What Is the Spatial Extent of a Bemisia tabaci Population?


Department of Entomology, University of Georgia, Athens, GA 30602, USA
*
Author to whom correspondence should be addressed.
Insects 2020, 11(11), 813; https://0-doi-org.brum.beds.ac.uk/10.3390/insects11110813
Submission received: 22 October 2020
/
Revised: 11 November 2020
/
Accepted: 12 November 2020
/
Published: 18 November 2020
(This article belongs to the Special Issue Improving Whitefly Management)
Abstract
:Simple Summary
Pest management can be greatly enhanced by basic knowledge about pest dispersal patterns in agroecosystems, which for insects often relies on comparisons of genetic variation among populations. The globally invasive sweet potato whitefly Bemisia tabaci is one such pest for which a large body of research has examined patterns of genetic variation. We review this literature to address the question: What spatial scales define B. tabaci populations? These studies are global in coverage and draw from a variety of genetic marker types. We found that genetic differentiation among populations is typically low, and that patterns of genetic diversity suggest that groups of migrating whiteflies from divergent populations are typically being sampled together. Overall, these results suggest that there is high ongoing gene flow over large spatial extents, but recent invasion by most populations could obscure genetic markers’ ability to detect geographic isolation. Genome-wide data collected across finer spatial and temporal scales hold great promise to clarify the spatial extent of a B. tabaci population, and could reveal whether insecticide rotations can be tailored to specific commodities or if coordination across commodities and regions linked by B. tabaci gene flow is justified.
Abstract
Effective pest management depends on basic knowledge about insect dispersal patterns and gene flow in agroecosystems. The globally invasive sweet potato whitefly Bemisia tabaci (Gennadius) (Hemiptera: Aleyrodidae) is considered a weak flier whose life history nonetheless predisposes it to frequent dispersal, but the scale over which populations exchange migrants, and should therefore be managed, is uncertain. In this review, we synthesize the emergent literature on B. tabaci population genetics to address the question: What spatial scales define B. tabaci populations? We find that within-species genetic differentiation among sites is often low, and evidence of population structuring by host plant or geography is rare. Heterozygote deficits prevail among populations, indicating that migrants from divergent populations are frequently sampled together. Overall, these results suggest that there is high ongoing gene flow over large spatial extents. However, genetic homogeneity typical of recently invading populations could obscure power to detect real isolation among populations. Genome-wide data collected systematically across space and time could distinguish signatures of invasion history from those of ongoing gene flow. Characterizing the spatial extent of B. tabaci populations could reveal whether insecticide rotations can be tailored to specific commodities or if coordination across linked commodities and regions is justified.
1. Introduction
Basic knowledge about insect dispersal patterns in landscapes is foundational to effective agricultural pest management. This is because insects must regularly disperse to colonize crops, and knowing the pathways, timing, and severity of these dispersal events can reveal where, when, and how intensely to apply control measures. Such knowledge can be difficult to obtain; however, for widely dispersing insects whose populations cannot readily be tracked across agricultural landscapes [1,2,3]. In these systems, population genetics approaches, which use observations of genetic diversity and differentiation among populations based on molecular markers to infer evolutionary processes acting on populations, can delineate which host plants are being attacked [4], how far and regularly pests are moving across landscapes [5,6], and whether insecticide resistance (or other traits allowing adaptation to new management techniques) tend to rapidly spread among and across populations [7]. One such agricultural pest for which a substantial body of literature has emerged, using population genetics approaches, is the sweet potato whitefly Bemisia tabaci (Gennadius) (Hemiptera: Aleyrodidae) cryptic species complex. The insect’s small body size (0.80−0.95 mm [8]) and wide host range (at least 500 plant species [9]) make B. tabaci difficult to physically mark and track as they move among fields and crop species, though movements among crops can be inferred from extensive monitoring efforts that record sequential abundance peaks in one crop and then another [10,11]. Further complicating matters, B. tabaci populations often include several “cryptic species” (sometimes called biotypes) that are genetically distinct but morphologically identical [9,12], and whiteflies appear to be readily moved among regions, countries, and even continents when horticultural plants and infested crops are traded [13,14,15,16,17]. All of these traits further complicate surveillance efforts that rely purely on physically tracking whitefly abundance. Rather, it often is necessary to look at underlying genetic variation to infer population boundaries, and gain some indirect indication of how, when, and where they are moving from one site and/or crop to another [18].
Two species within the B. tabaci complex have emerged over the last four decades as major economic pests of field and horticultural crops worldwide, named for their geographic origins: Middle East-Asia Minor 1 (hereafter, MEAM 1) and Mediterranean (hereafter, MED) [12]. Though morphologically indistinguishable [9,12], these species diverged ~12 mya [19] and are distinct in economically significant ways. MEAM 1 is characterized by relatively high fecundity [20], mating interference [21], virus transmission [22], vector-virus mutualisms [23,24], and association with physiological disorders in some host plants [25,26]. MED is often associated with greenhouse plant production [13,27] and seems more prone to evolve resistance to insecticides [28,29]. Invading populations of MEAM 1 and MED tend to rapidly sweep through agricultural regions, displacing resident B. tabaci species [27,30,31,32,33]. Though considered a weak flier [8], B. tabaci is capable of sustained flight over long distances [34], even producing what might be considered a migratory form under some circumstances [35,36]. Yet, a large proportion of dispersing B. tabaci will typically fly close to the ground (<10 cm [37]) and settle on nearby host plants [35,38]. The extent to which long-distance migration and the accumulation of short distance movements over many generations contribute to population connectivity over large spatial extents is uncertain, but the genetic consequences of such movements can be examined using a population genetics framework. Understanding the spatial extent of B. tabaci populations could potentially aid in designing insecticide rotations that account for resistance in genetically connected areas and targeting efforts to mitigate virus spread by identifying high risk fields.
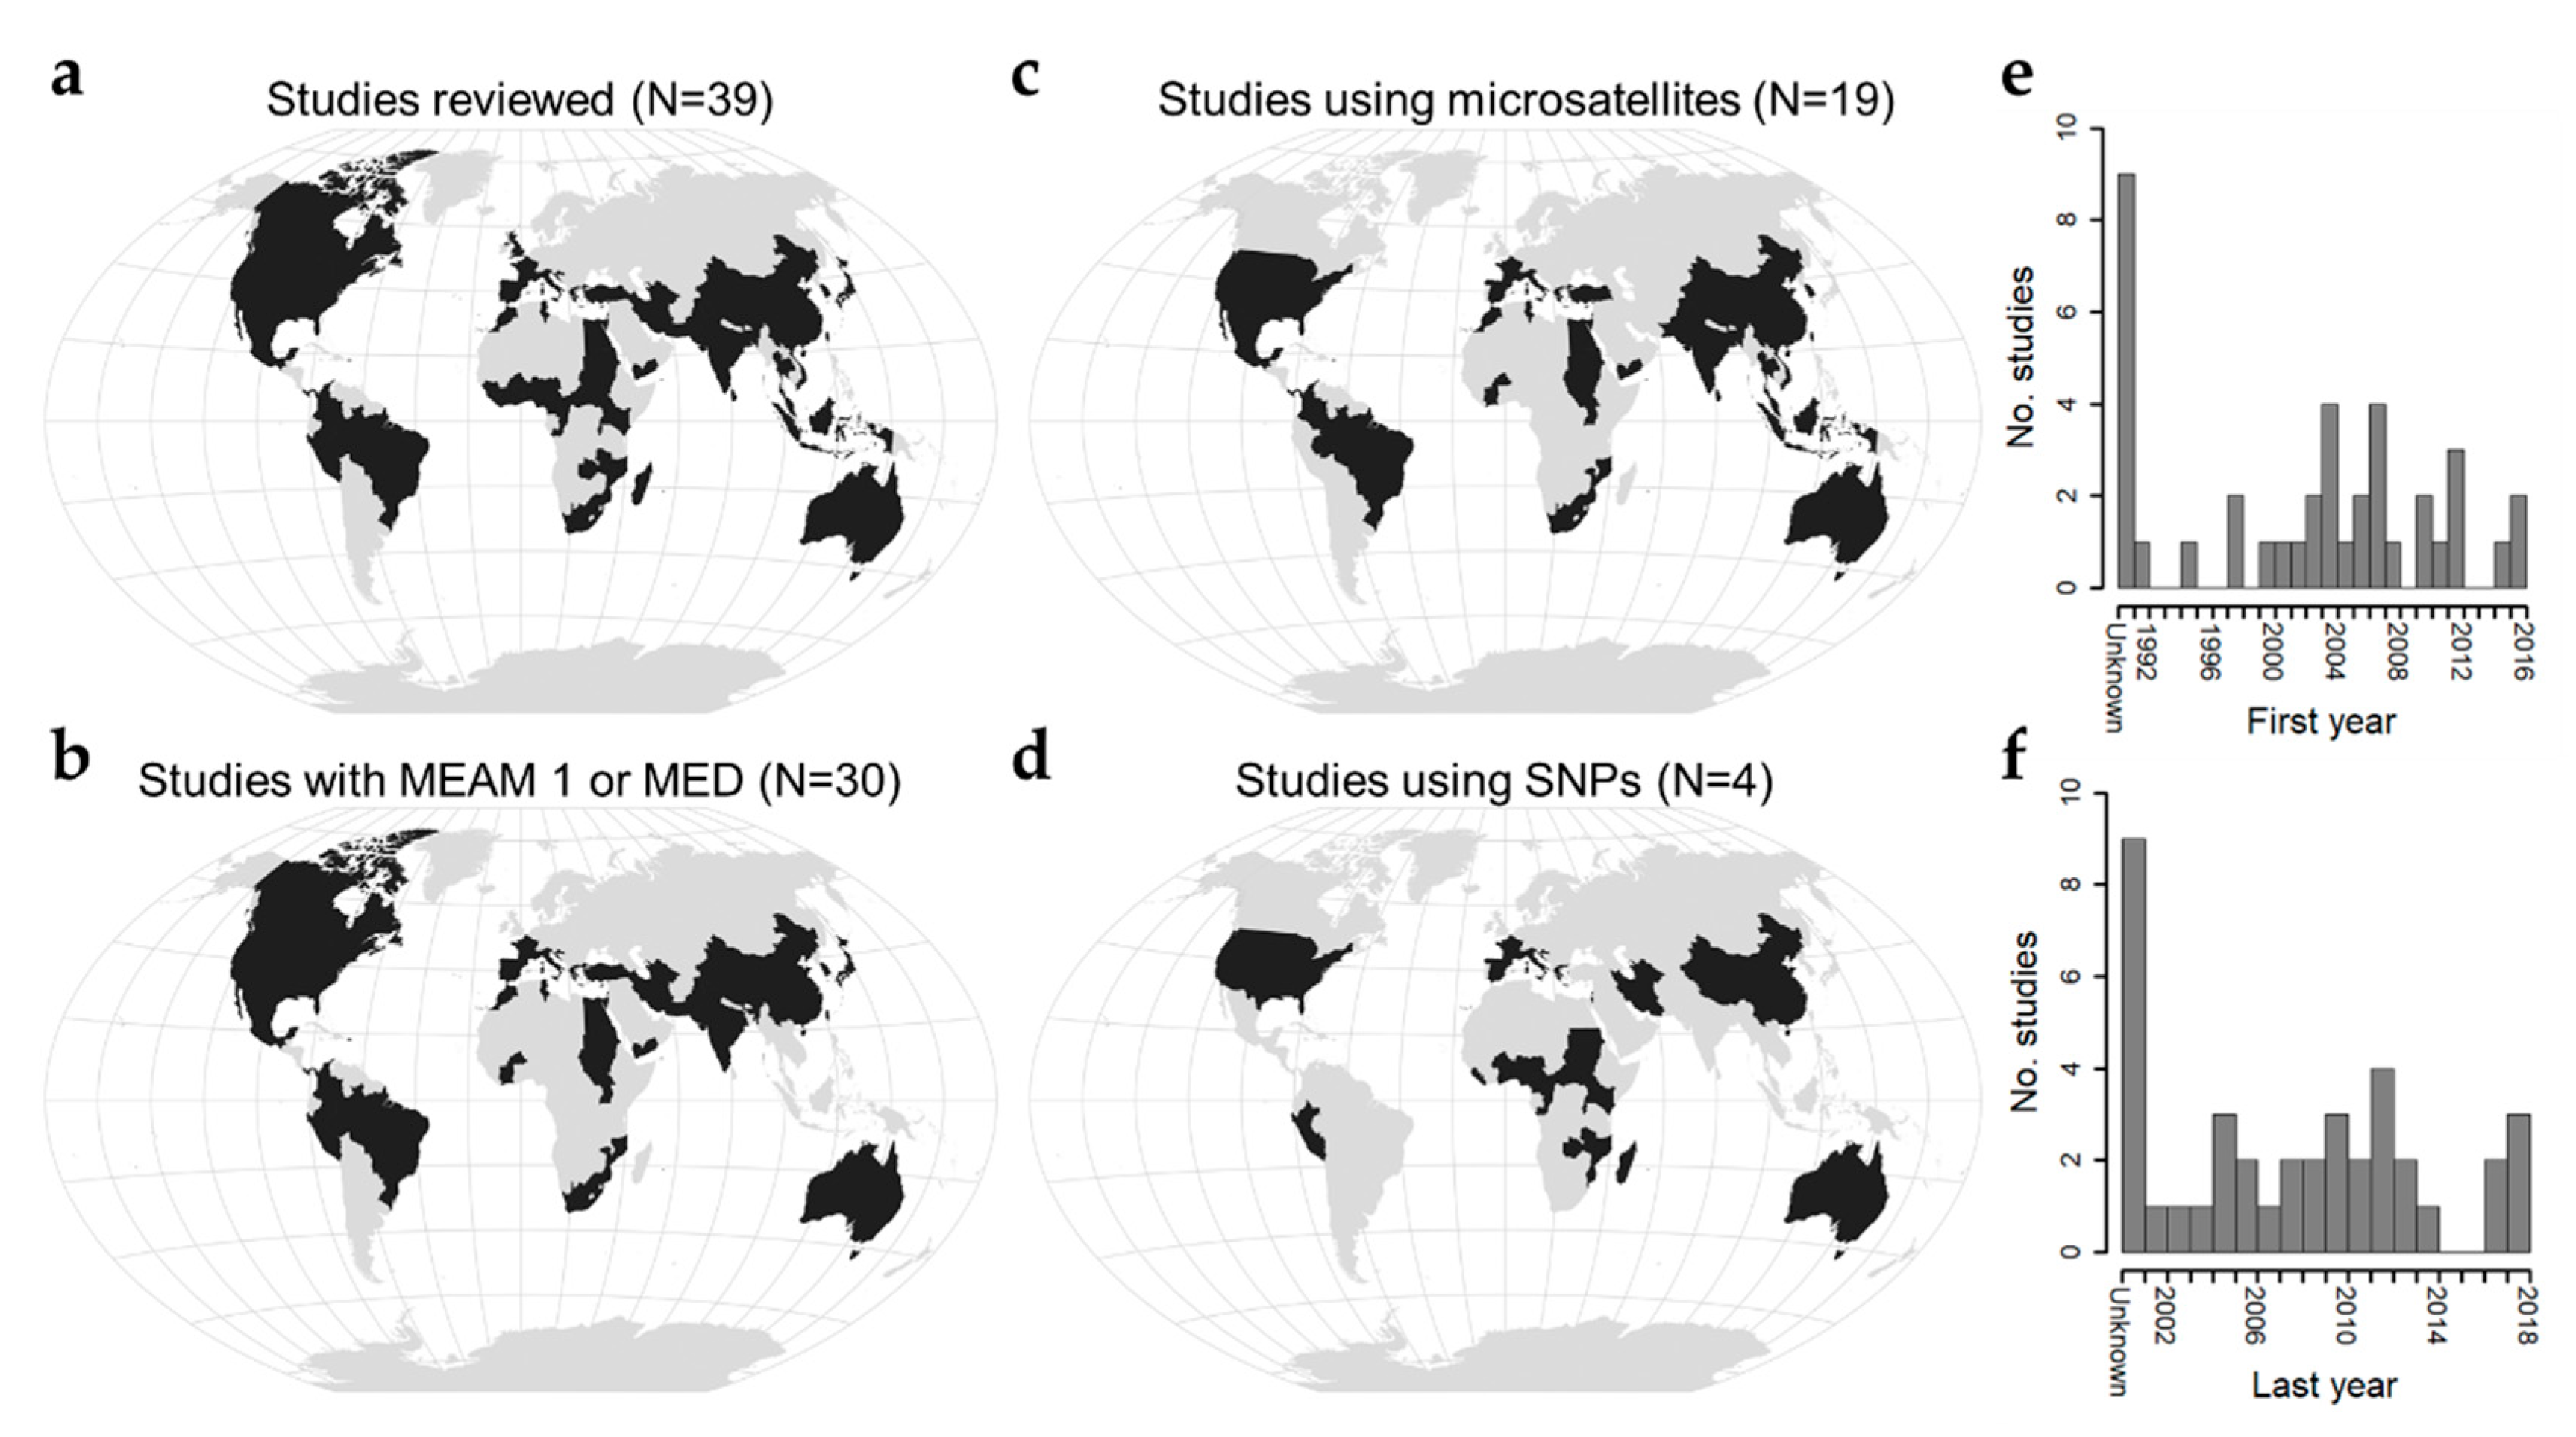
In this review, we synthesize the literature on B. tabaci population genetics to address the question: What spatial scales define B. tabaci populations? These studies are global in coverage, focus largely on populations of MEAM 1 and MED, and span collections from 1991−2018 (Figure 1, Table S1). Studies leverage a variety of genetic marker types [27,39,40,41,42,43,44,45,46,47,48,49,50,51,52,53], but, while the majority use microsatellites [13,16,17,54,55,56,57,58,59,60,61,62,63,64,65,66,67,68], use of single nucleotide polymorphisms is beginning to become more common [15,69,70,71] (Figure 1). We organize our synthesis around insights gained from three common marker types (cytochrome oxidase I, microsatellites, single nucleotide polymorphisms) and associated measures of genetic diversity and differentiation, interpreting emergent patterns in light of potential underlying ecological and evolutionary processes. In conclusion we suggest three guiding questions for future research that could build upon these findings to further understanding of the relevant spatial scales over which B. tabaci should be managed.
2. Cytochrome Oxidase I
Sequence data from the mitochondrial gene cytochrome oxidase I (COI) has been used to delineate cryptic species [12], detect invasions and displacement of indigenous species [27,41,42,45,49], describe population size changes [45], and characterize levels of genetic diversity within species [13,41,44,53]. Perhaps unsurprisingly, COI-based studies typically report low levels of genetic diversity among invasive populations of MEAM 1 and MED, with MEAM 1 populations often comprising a single haplotype across entire regions [13,27,56,72]. This is to be expected because mutations in COI do not accumulate quickly enough to enable differentiation of populations within species on ecological time scales [19,73]. In addition, asymmetric gene flow due to cytoplasmic-incompatibility caused by Wolbachia can constrain gene flow among uninfected and infected B. tabaci lineages, further limiting recovery of genetic diversity among invasive populations [67,74]. While clearly an important first step toward describing genetic differences among invasive lineages, COI sequence comparisons are not well suited for quantification of genetic diversity and differentiation at the smaller spatial and temporal scales that are relevant to processes acting on populations. For this, we turn next to microsatellites.
3. Microsatellites
Microsatellites are highly polymorphic, nuclear markers that can parse levels of genetic diversity and differentiation among populations at relatively fine scales [18]. Unlike studies based on COI, microsatellite-based studies frequently report high levels of genetic diversity within invasive B. tabaci populations [43,46,55,56,64], though sometimes this is conflated with variation among cryptic species [46] or is indirectly inferred [43]. Some studies report increasing [65] or decreasing [13,45,58] genetic diversity over time, invoking extinction/recolonization dynamics or ongoing population expansion. Relevant to the question of what spatial scales best define B. tabaci populations, we examine four themes among B. tabaci microsatellite datasets that can shed light on the extent of gene flow among B. tabaci populations.
3.1. Low Genetic Differentiation
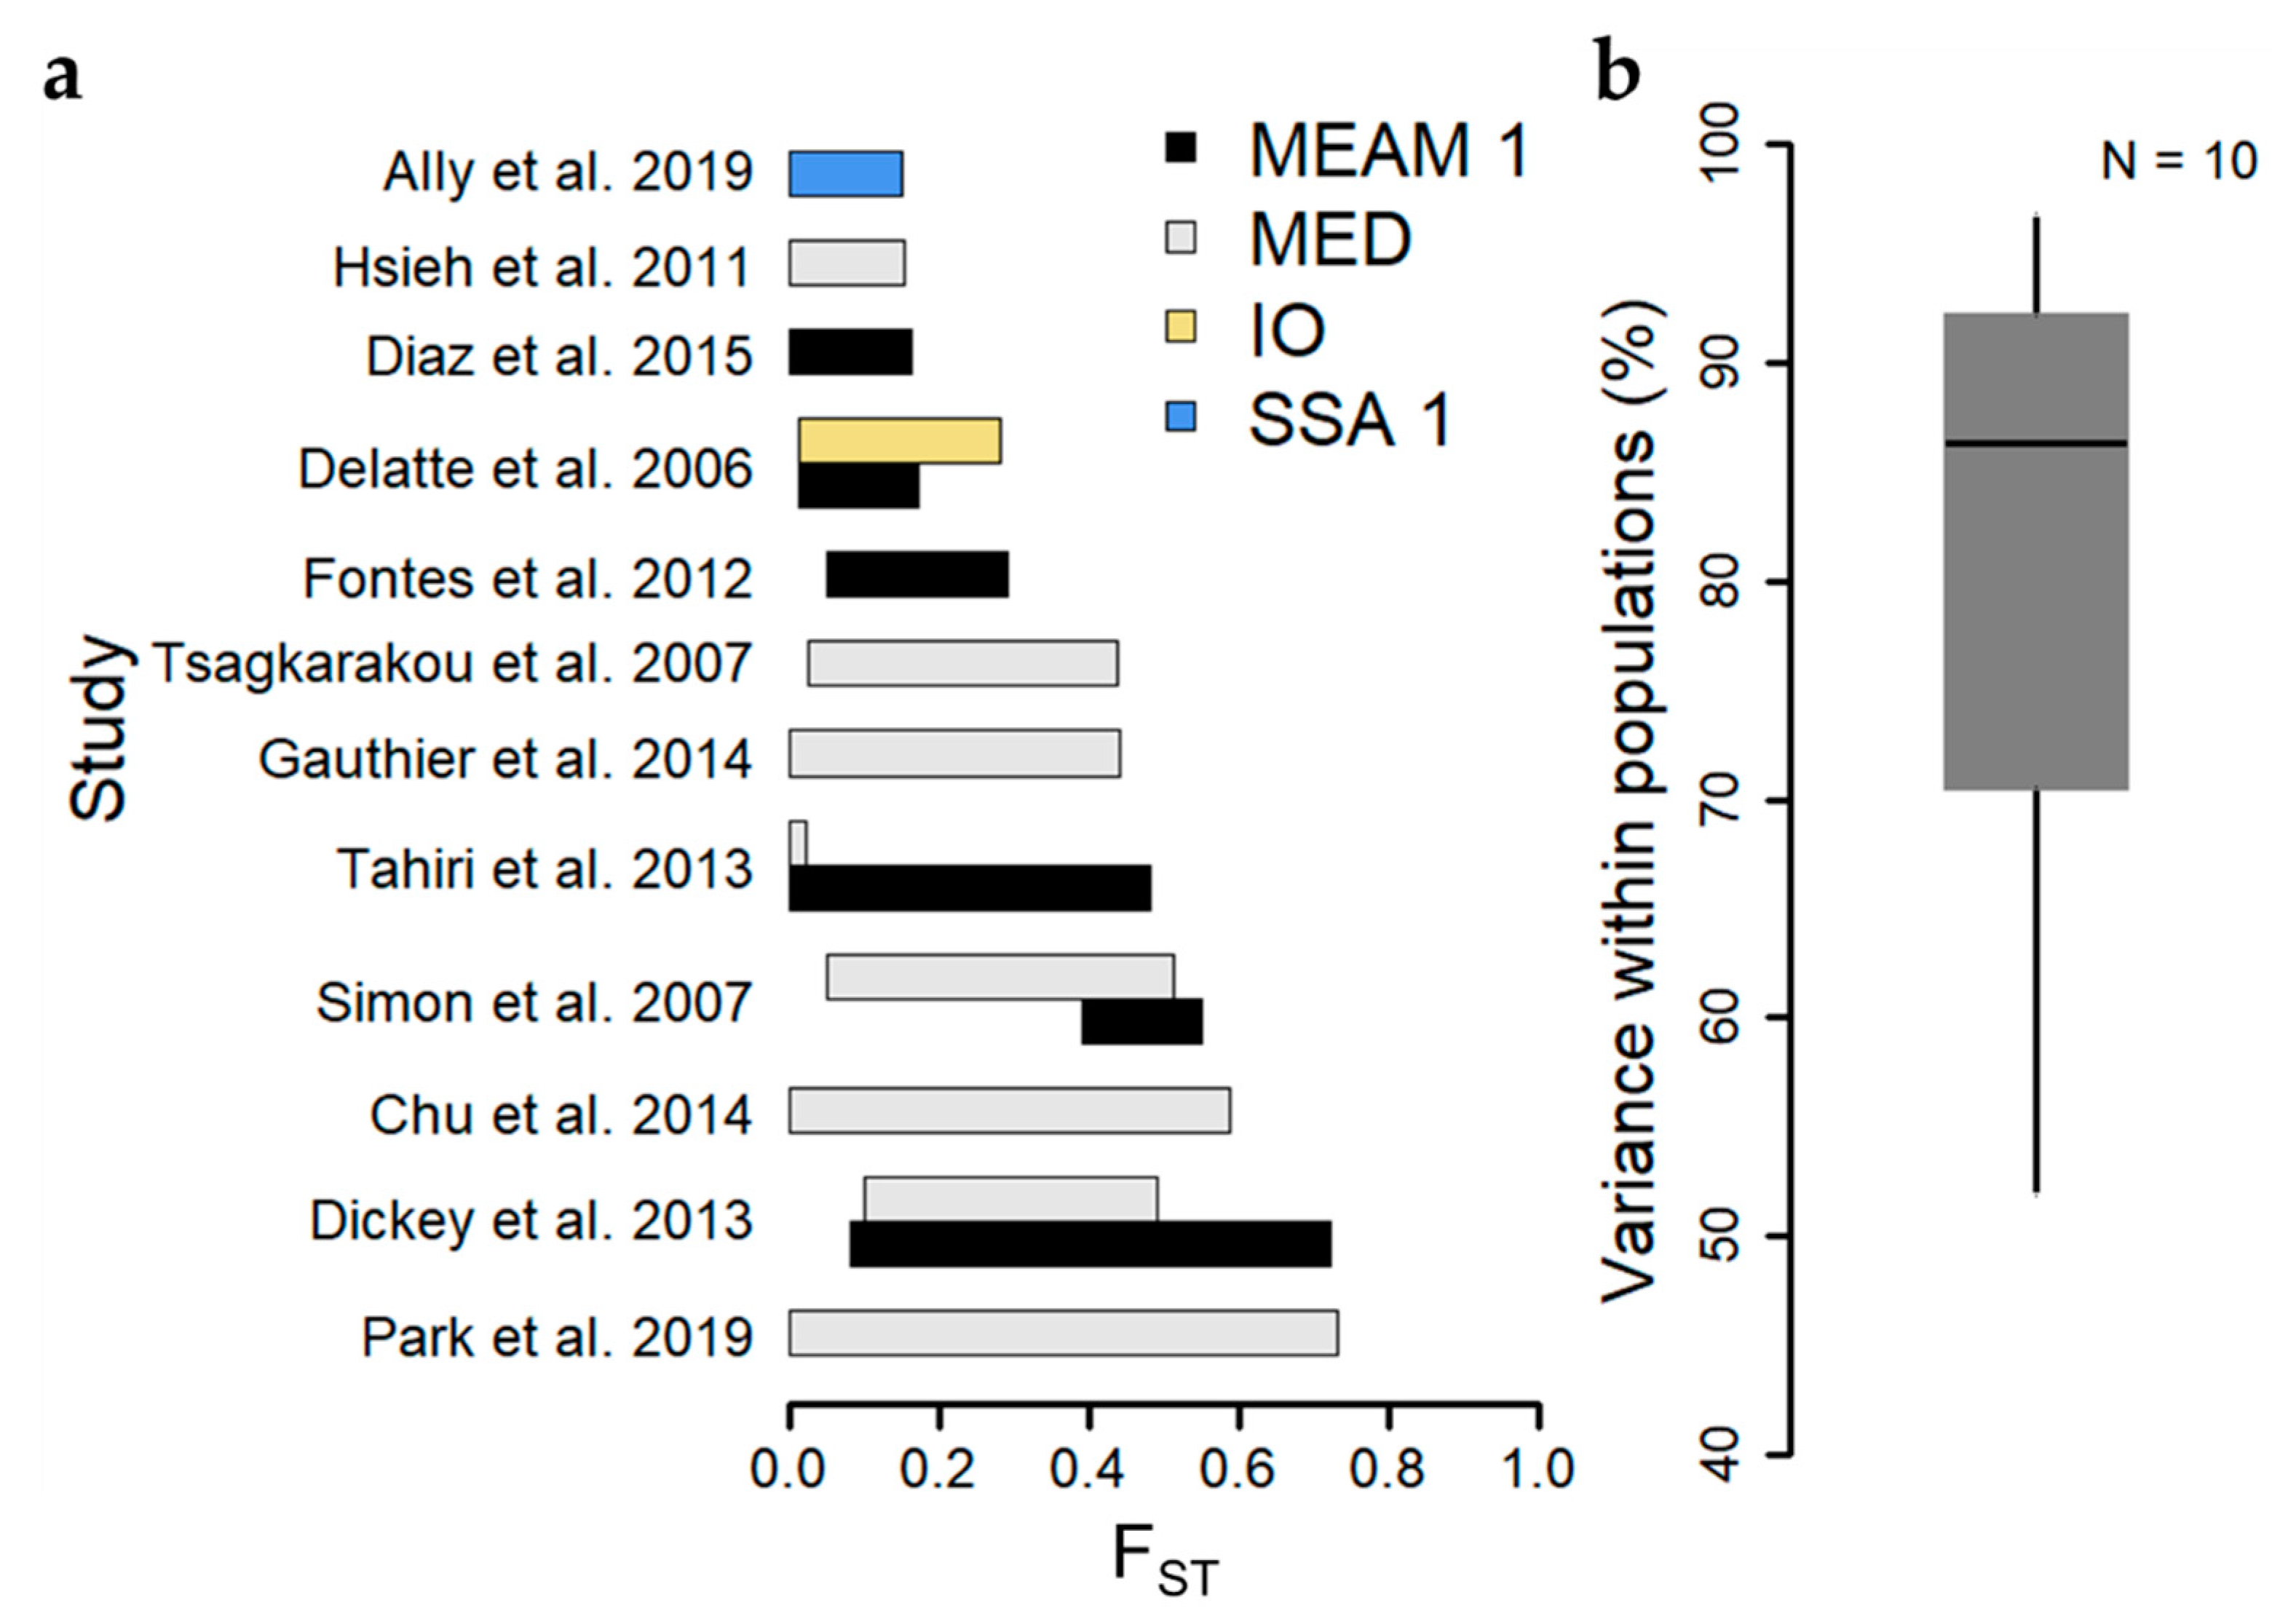
Genetic differentiation arises when populations are isolated in space over time, due to the random generation and loss of genetic variation by mutation and genetic drift, respectively, and the action of natural selection in their respective environments. Importantly, gene flow among divergent populations tends to erode genetic differentiation between them [75]. The degree of genetic differentiation between populations can thus provide a measure of the extent over which dispersal and gene flow are occurring among B. tabaci populations in a landscape. The fixation index (FST) [76], is a commonly used measure of genetic differentiation between populations, ranging from 0 (no differentiation) to 1 (complete differentiation). Of the 15 studies reporting values of FST among populations within cryptic species, eight (53%) include ranges of FST that bound zero [17,41,54,58,61,65,66,67], though upper estimates of FST among studies sometimes exceed 0.5 [59,64,65] (Figure 2, Table S2). Differences in the geographic extent of sampling largely explain differences in the range of FST among studies. Studies reporting relatively low genetic differentiation between populations typically cover small geographic areas within individual countries [16,17,54,56,61,66], whereas those with high or broad ranges of genetic differentiation generally compared populations spanning multiple islands [63], numerous sites distributed throughout individual countries [58,59], or sites spanning multiple countries/continents [64,67]. Analysis of Molecular Variance (AMOVA) is another common tool used for reporting levels of genetic differentiation, functionally partitioning levels of genetic variance into hierarchical levels including categories for among-individuals within a population and among-populations within a region. The relative levels of genetic variance ascribed to these two categories can provide a measure of the amount of genetic differentiation among populations. The median percentage of genetic variance among individuals within populations across ten studies reporting AMOVA results based on microsatellite datasets was 86% (Figure 2), and only two studies exhibited <70%, corroborating findings of low FST among populations, and supporting the occurrence of high levels of gene flow among populations within cryptic species.
3.2. Interpreting K = 2
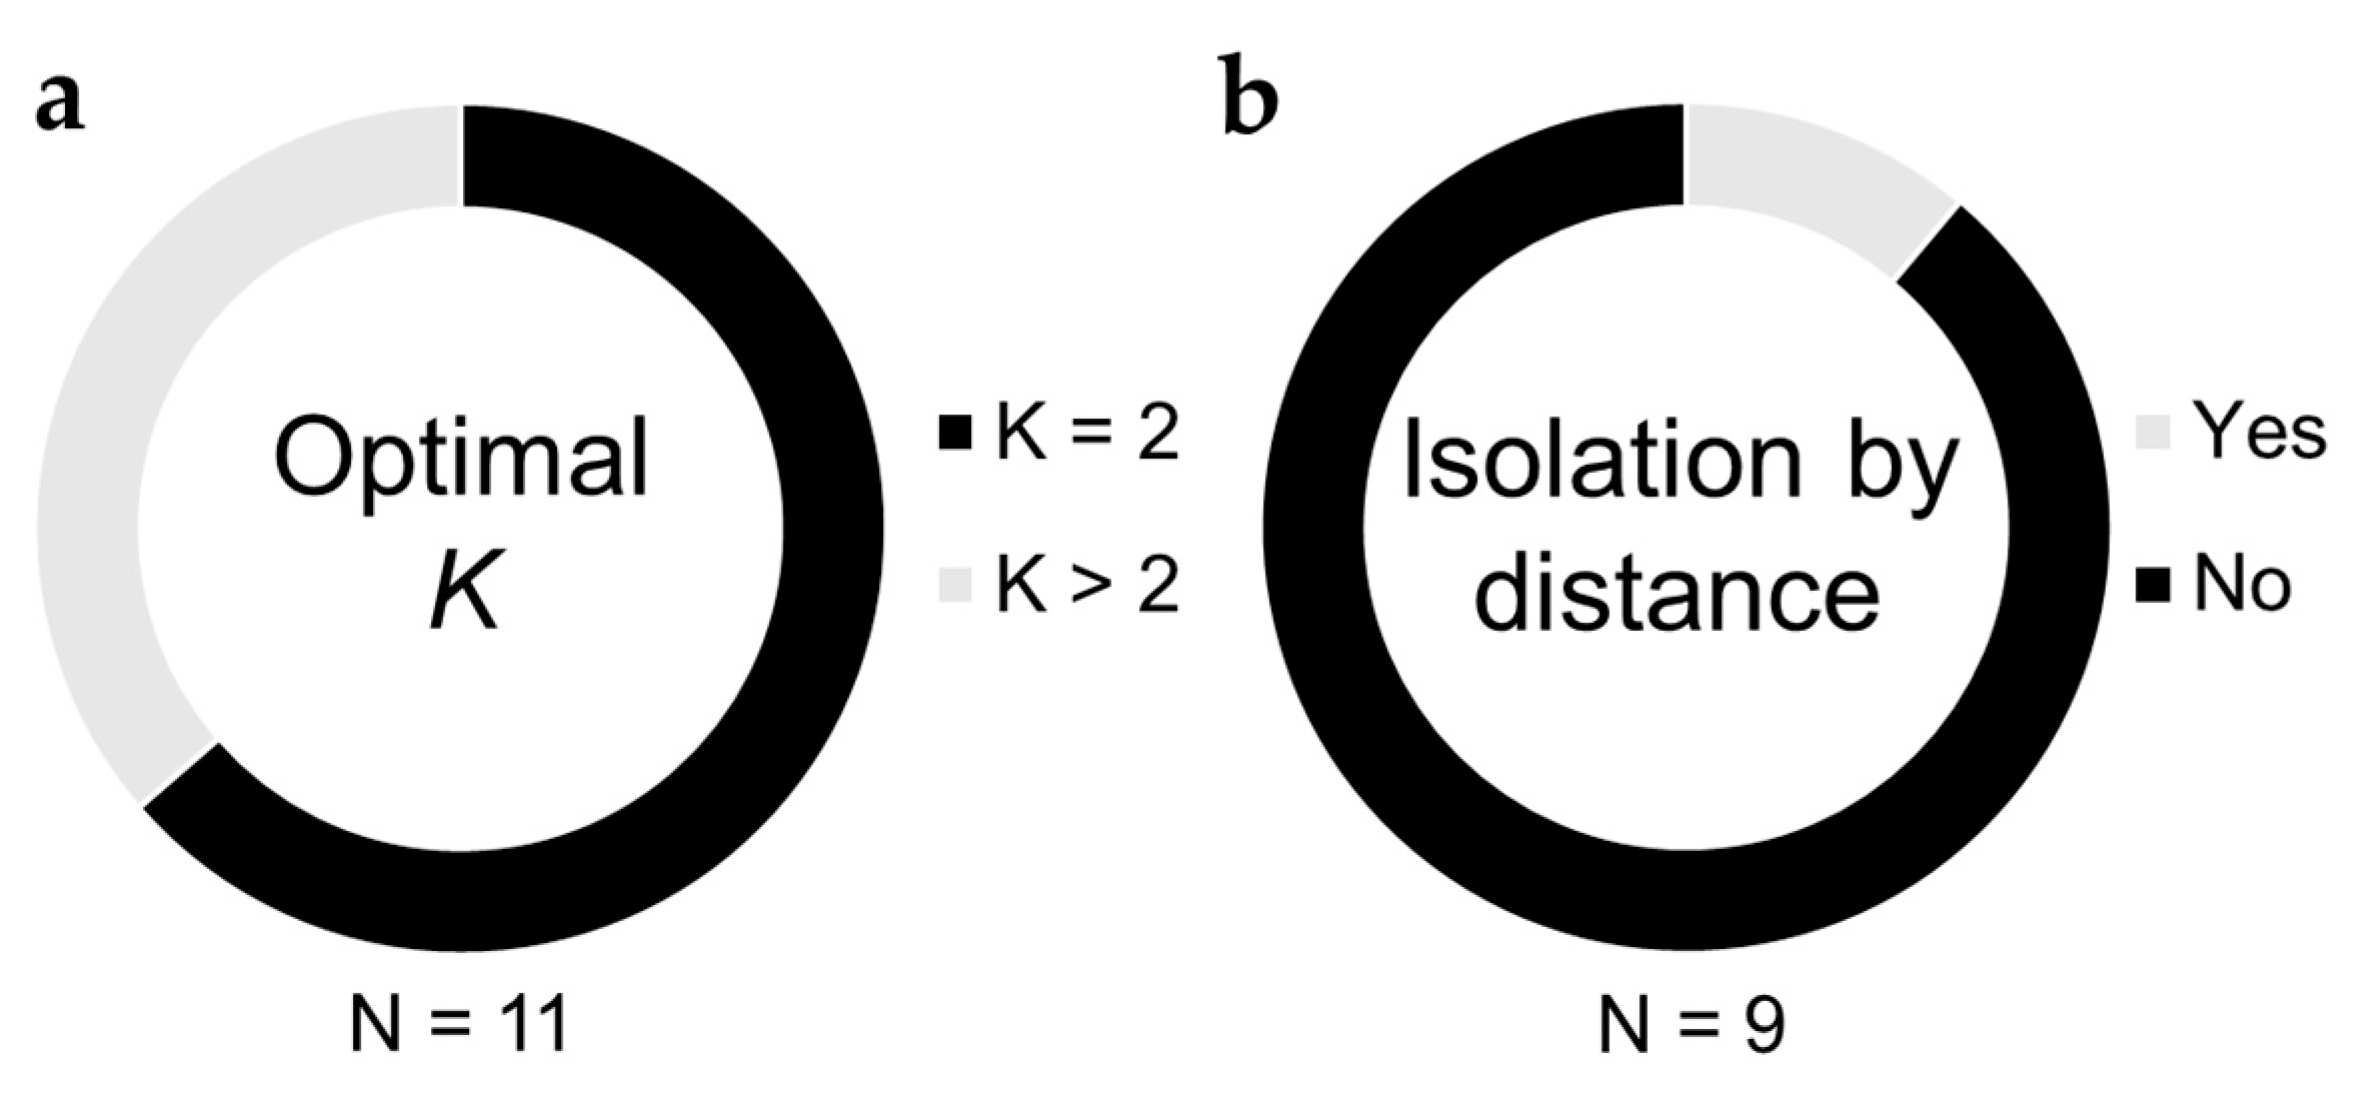
Another often used measure of genetic differentiation among populations is the Bayesian clustering analysis implemented in the software STRUCTURE [77]. The optimal number of genetic clusters, K, is inferred using several heuristics, and proportions of ancestry coefficients among clusters for each individual are assessed for evidence of admixture or isolation among populations. A challenge that is common to all applications of STRUCTURE appears to be at play among B. tabaci studies as well, termed the “K = 2 conundrum” [78]. An optimal value of K = 2 was reported in 64% of studies (7 out of 11) applying STRUCTURE to the study of B. tabaci genetic differentiation [16,54,57,58,59,60,63] (Figure 3, Table S1). Because the possibility of K = 1 is not evaluated by STRUCTURE, an optimal value of K = 2 can sometimes imply the near-complete absence of genetic differentiation among populations, especially when ancestry proportions for the two genetic clusters are evenly mixed among most individuals [78]. Four of 11 studies reported optimal values of K > 2 (Figure 3, Table S1), but interpretation seems to be complicated by the inclusion of multiple cryptic species in the same analysis [55,69,71]. STRUCTURE results are therefore in agreement with FST- and AMOVA-based analyses in suggesting that gene flow among populations can be quite high over relatively large spatial extents.
3.3. Limited Evidence of Isolation by Distance
When migration among populations decreases as a function of increasing distance between them, a pattern of isolation by distance can arise [79], which is often quantified by comparing levels of genetic differentiation (FST/1-FST) with the geographic distance between pairs of populations. An absence of evidence of isolation by distance can follow from frequent long-distance migration events erasing any association between genetic differentiation and geography. Of nine studies testing for evidence of isolation by distance [13,17,54,56,57,58,60,67,68], only one detected a significant association between genetic differentiation and geographic distance among populations within a region [58] (Figure 3, Table S1). Notably, isolation by distance was not observed over spatial extents as wide as the Mediterranean Basin, though most studies spanned regions within individual countries (Columbia, France, Greece, Réunion, Taiwan).
The one case where a significant pattern of isolation by distance was found [58] seems to have arisen from a combination of three otherwise non-unique factors. First, sampling occurred in greenhouses that were known to regularly receive plant materials from different sources each year [58]. While anthropogenic movement of B. tabaci via plant trade would otherwise be expected to erase any pattern of isolation by distance, as evident in [13,17,57,67], what, in Park et al. [58], essentially amounts to multiple introductions from separate sources each year, could produce a pattern of isolation by distance, especially if greenhouses tend to obtain seedlings from closer rather than more distant nurseries. Second, the spatial coverage of the study region (South Korea) was relatively broad compared to other studies that sampled from a single country [13,17,56,57,60], a factor that we earlier showed also enables detection of a broader range of genetic differentiation (FST) among populations. This likely offered greater statistical power for subsequent tests of isolation by distance. Lastly, the density of sampling at each site was quite high (up to 40 individuals per site, while others usually sampled ~20 per site), again lending itself to greater resolution of any genetic differences among populations. So, while isolation by distance may appear rare in B. tabaci, we suggest that sampling more densely among sites that are well-distributed across a region (not too narrow geographically, but also not too broad) might reveal more cases where gene flow is geographically restricted among populations.
3.4. Pervasive Heterozygote Deficits
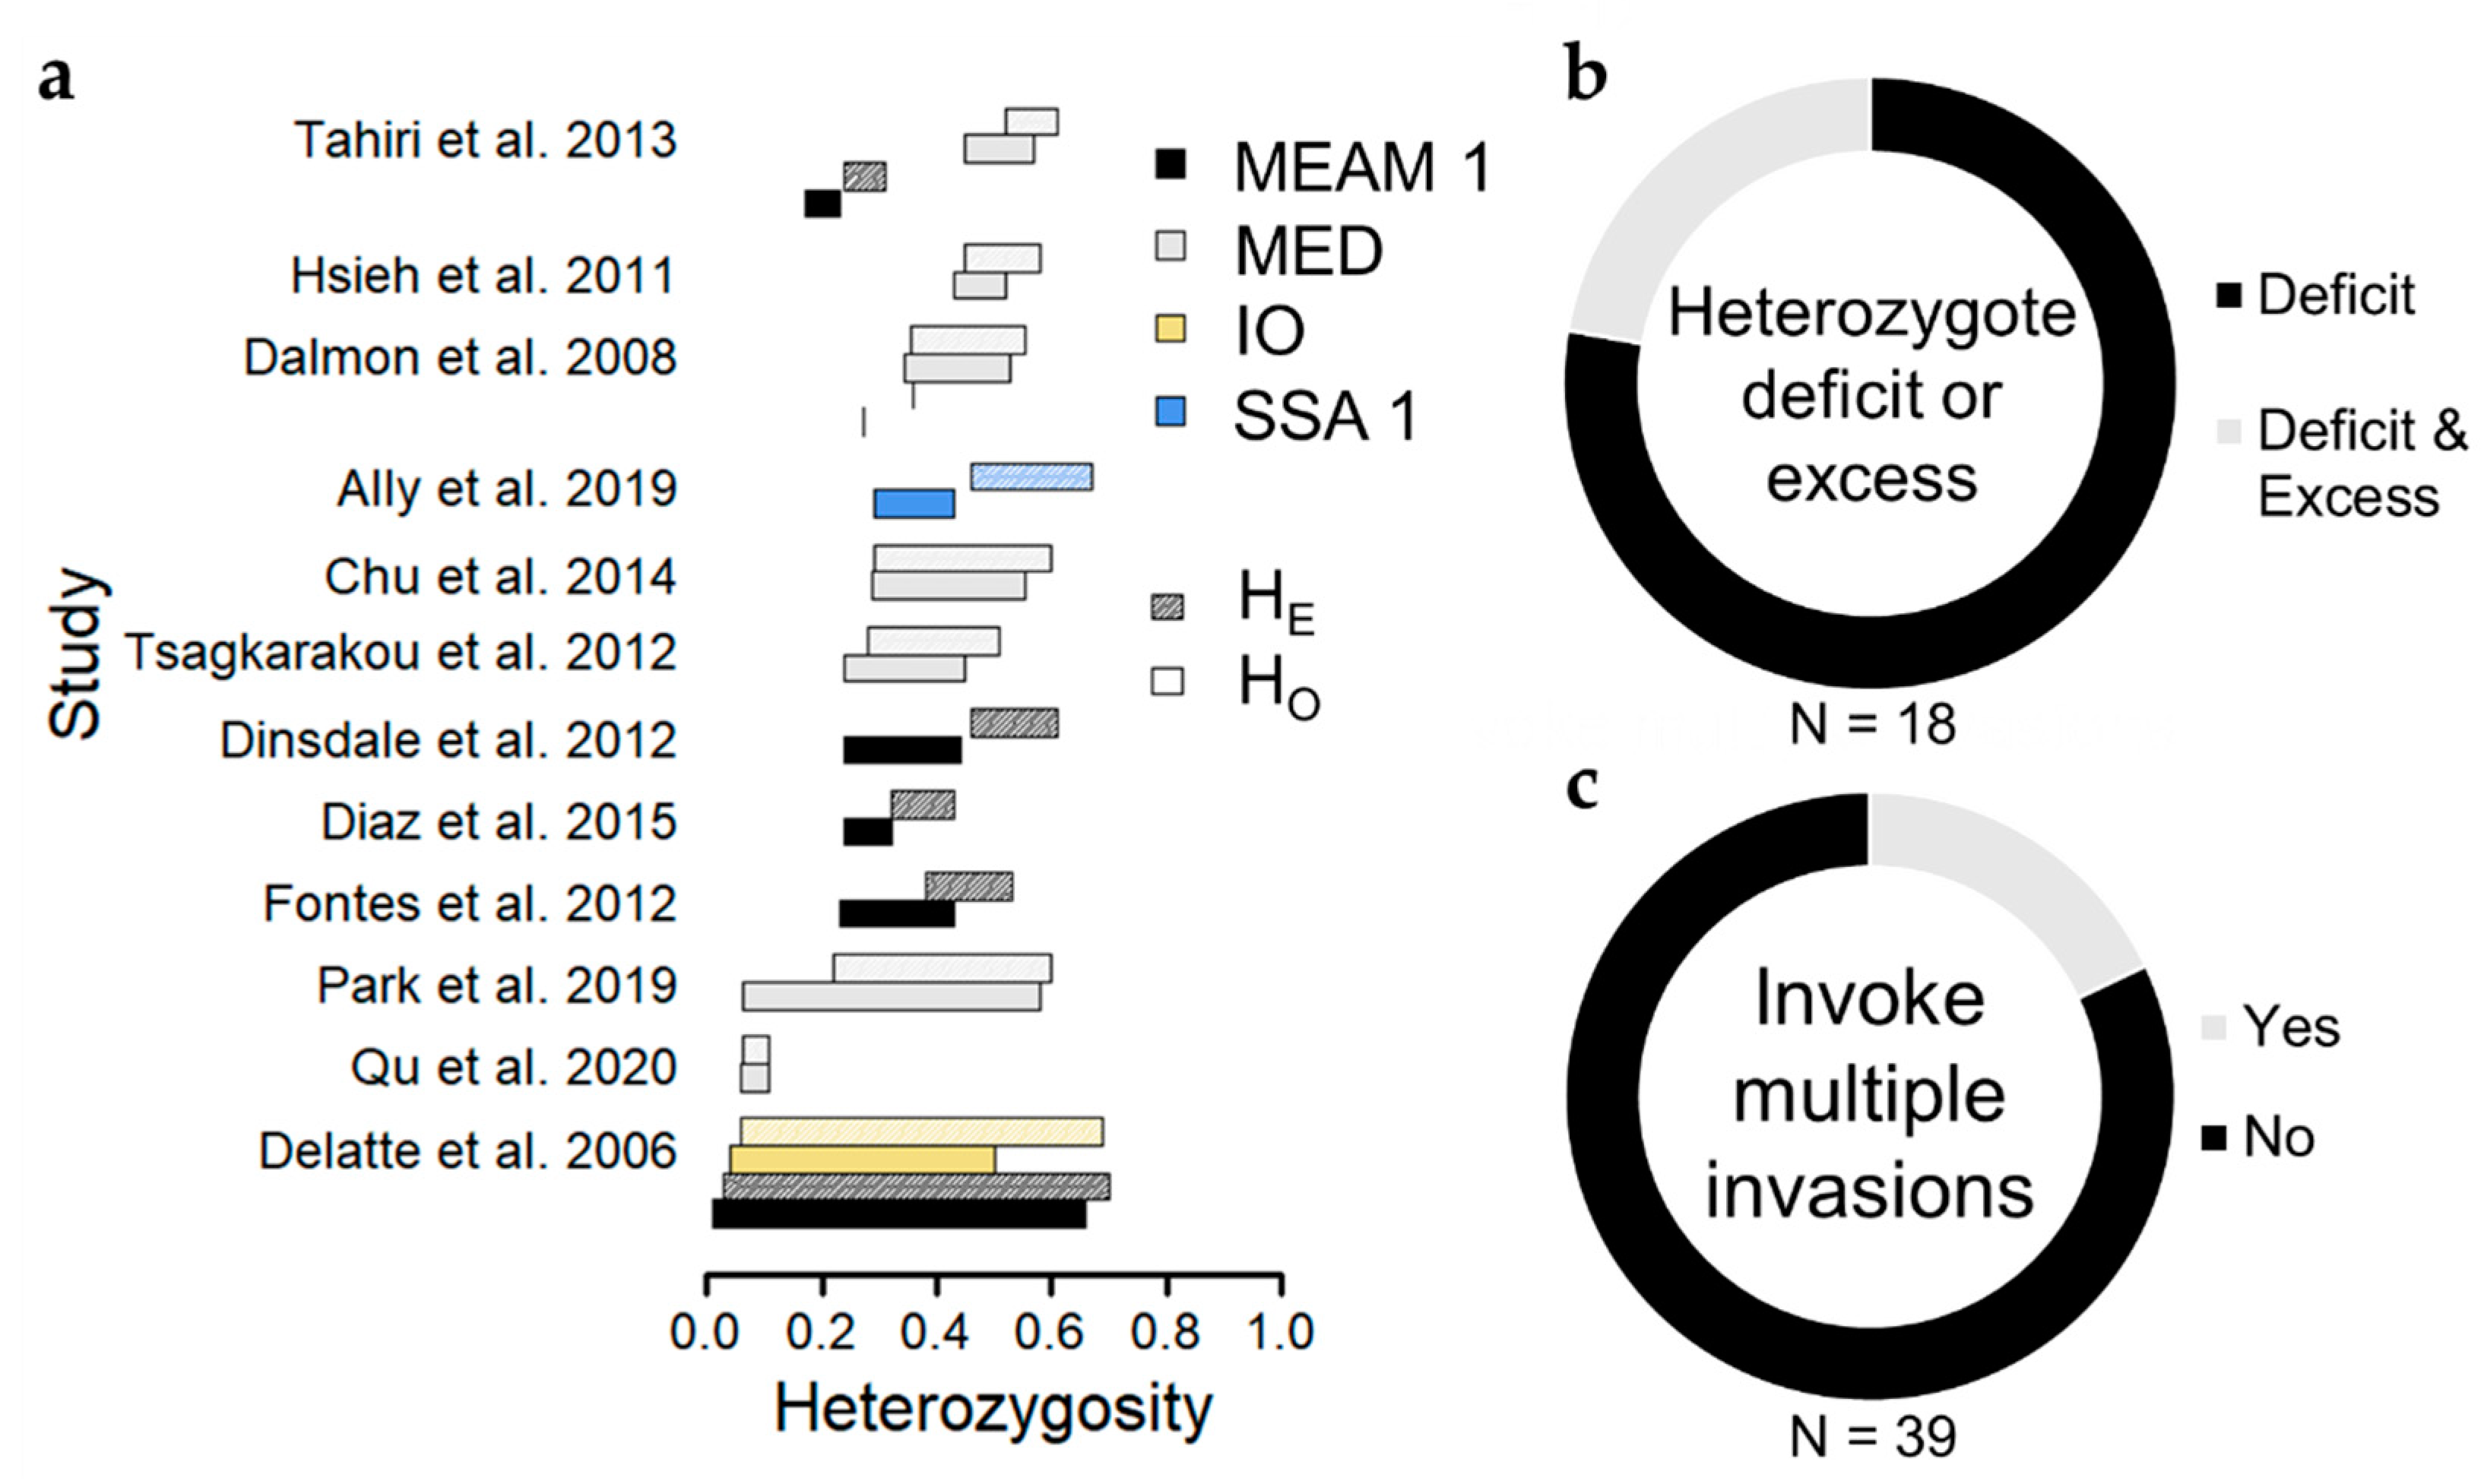
A common theme throughout microsatellite-based studies reporting on genetic diversity among B. tabaci populations is the observation of widespread heterozygote deficits (Figure 4), which occur when observed heterozygosity is lower than expected based on Hardy–Weinberg Equilibrium assumptions, and which can be quantified using the inbreeding coefficient FIS (FIS > 0 indicates heterozygote deficit). Of eighteen studies reporting population estimates of observed and expected heterozygosity, 14 (78%) demonstrated heterozygote deficits in most populations [13,16,54,56,57,60,61,63,64,65,66,67,68,70], and 4 (22%) reported instances of heterozygote deficit alongside heterozygote excess [17,55,58,59], wherein observed heterozygosity exceeds expectations under Hardy–Weinberg Equilibrium (Figure 4, Table S1). Heterozygote excess in haplodiploid species, such as B. tabaci, can result from large differences in allele frequencies between sexes [80], but is often considered a signature of a recent population bottleneck (i.e., a dramatic reduction in population size) [81]. While some sampled populations appear to have undergone a population bottleneck, perhaps due to founder events typical of invasive populations or strong population suppression from insecticides [13,55,57], the majority of populations instead exhibit some degree of heterozygote deficit.
What is the cause of such pervasive heterozygote deficits and what can they tell us about the extent of gene flow among populations? One cause of heterozygote deficits could be genotyping error, a common challenge among microsatellite datasets [82], wherein allele size or primer binding variation leads to allele dropout (‘null alleles’) and misclassification of homozygous genotypes when they are truly heterozygous genotypes [59,64]. However, studies specifically account for genotyping error, and null alleles would not be expected to permeate every B. tabaci microsatellite dataset. One interpretation of heterozygote deficits is that a population is undergoing substantial inbreeding, a phenomenon where heterozygosity erodes due to frequent mating between closely related individuals [83]. This might follow from an absence of gene flow among divergent populations, suggesting that localized B. tabaci movements over the landscape may predominate, but could also arise if sampling schemes result in high rates of sibling sampling. Additional evidence of inbreeding in microsatellite datasets is strong linkage disequilibrium among loci, wherein allele frequencies among loci are correlated because they share a very recent common ancestor and are still being inherited together. Importantly, though, linkage disequilibrium across loci was rare among B. tabaci microsatellite studies. Without further evidence from genome-wide data (such as long homozygosity tracts), it is difficult to conclude that the observed heterozygote deficits stem from inbreeding. Lastly, consequences of Wolbachia infection have been proposed to explain heterozygote deficits, whether due to sex-ratio distortions [68] or asymmetrical gene flow due to cytoplasmic-incompatibility [67]. Wolbachia infections can be quite common among MEAM1 and MED, but also extremely rare, depending on geography [51,57,84,85]. The potential for horizontal transmission via shared host plants, in addition to vertical transmission, suggests that Wolbachia infections will only grow in importance with time [86]. However, studies examining the effect of Wolbachia infection status on B. tabaci population structure have so far found no causal relationship [67,68].
Instead, we propose that pervasive heterozygote deficits arise due to population substructure (i.e., non-random mating) among individuals collected at a site, referred to as the Wahlund effect [87]. Population substructure might follow from host-associated differentiation [88], but studies so far do not report evidence of host-associated differentiation among B. tabaci populations within cryptic species (Saurabh et al. this issue, [39,57]). Instead, population substructure likely reflects sampling of individuals as they immigrate from distinct populations, implying that movement occurs frequently and potentially over large spatial extents, but that this does not always result in gene flow among populations. Along these lines, multiple studies interpret observations of genetic variation among B. tabaci populations as evidence for multiple invasions in their study extent (Figure 4) [17,27,41,55,56,59], and unique MED COI haplotypes can co-occur on the same plant [72]. It is possible that divergent lineages of invasive B. tabaci populations are widely dispersing throughout agricultural landscapes but have not admixed enough to erase any Wahlund effect.
3.5. Other Lines of Evidence
Three other lines of evidence provide some support for the idea that B. tabaci are connected over large spatial extents: temporal shifts in genetic cluster assignment, rapid spread of symbiont infections, and widespread distributions of insecticide resistance mutations. Invasive MED populations exhibited large shifts in genetic cluster assignment over a period of six years in China [65], as a single COI haplotype came to predominate throughout most agricultural regions [44]. In Australia, invasive MEAM 1 populations exhibited substantial genetic change (according to AMOVA applied among populations over time) among seasons within a single year [60]. In addition to temporal changes due to the spread of invasive B. tabaci, distributions of native populations can also exhibit broad shifts over time, with the viruliferous SSA 1 spreading throughout much of Sub-Saharan Africa over a period of 20 years [61]. Second, a Rickettsia infection spread to nearly 100% of B. tabaci in 6 years over an area spanning southern Arizona, USA [31]. Lastly, findings of common, widespread insecticide resistance mutations (associated with organophosphate and pyrethroid resistance) throughout the Mediterranean Basin suggest that frequent migration is facilitating spread of advantageous alleles [67], though selection on standing genetic variation [89] within whitefly’s ancestral range cannot be ruled out. So, all of these lines of evidence support the conclusions drawn from FST, AMOVA, and STUCTURE analyses that there is potential for ongoing gene flow among B. tabaci populations over broad spatial extents.
4. Single Nucleotide Polymorphisms
Only four studies have so far used single nucleotide polymorphisms (SNPs) to examine B. tabaci population genetics, and none were designed to address questions about gene flow among populations on small spatial and temporal scales [15,70,71,90]. Wosula et al. [71] sampled B. tabaci from cassava (Manihot esculenta) in 8 countries in Sub-Saharan Africa, and found relatively high levels of genetic differentiation (minimum FST = 0.11, K = 4) according to 7453 SNPs. However, analyses of population structure were complicated by the inclusion of multiple B. tabaci cryptic species. Chen et al. [69] obtained similar results after expanding sampling to 18 Sub-Saharan African countries and 63,770 SNPs. Elfekih et al. [15] genotyped MEAM 1, MED, and IO (“Indian Ocean”) whiteflies from 20 sites on six continents at 38,041 SNPs, but analyses of population structure were focused on revealing invasion routes among countries rather than ongoing movement patterns over landscapes. Qu et al. [70] found values of FST among MED populations between 0.078–0.346, but here comparisons were made among populations from different continents. While these studies were well designed for characterizing the species composition of economically important B. tabaci communities and genetic differences at continental and global scales, there remains a need for studies that leverage genome-wide datasets to address questions about the importance of local movements for B. tabaci ecology and evolution. Such studies in other insect systems have revealed colonization of crop fields from specific non-crop host plant reservoirs [4], identified sibling pairs separated by distances > 3 km and uncovered previously hidden patterns of isolation by distance [91], and shown how the spatial configuration of crop fields can impede or enhance gene flow among pest populations in certain environments [5,92].
5. Concluding Remarks and Future Directions
What is the spatial extent of a B. tabaci population? While our synthesis of the current B. tabaci population genetics literature cannot provide a quantitative answer, it does suggest that there is potential for frequent and widespread gene flow on the scale of an agricultural region. The limited resolution provided by small numbers of genetic markers in most studies, combined with the recent invasion history of many economic B. tabaci populations cast doubt on this interpretation and complicate the task of linking population genetic patterns with ecological and evolutionary processes. Low genetic differentiation and pervasive heterozygote deficits among populations could be a consequence of recent introduction of a small number of founding individuals, which would obscure any ability to detect evidence of geographic isolation or widespread gene flow among populations based on patterns of genetic differentiation. Moving forward, higher-resolution genetic data, like that offered by genome-wide single nucleotide polymorphism (SNP) datasets, combined with systematic sampling over landscapes and over time will play an important role in distinguishing whether populations are primarily local in nature or connected over wide spatial extents. Studies of B. tabaci population genetics are beginning to make use of SNP datasets [15,70,71,90], but have not yet been designed to address questions about dispersal and gene flow among populations in agricultural landscapes at local scales. As the time since invasion of most MEAM 1 and MED populations continues to increase, such studies may begin to reveal previously unknown connections among commodities and landscapes or delineate geographically isolated groups of economic B. tabaci populations.
We suggest three questions to guide future research along these lines. First, what are the genetic consequences of B. tabaci migration among cropping systems? Sampling whiteflies in a region over time as they first arrive and depart from emerging and senescing crops, respectively, could reveal important ongoing constraints on B. tabaci genetic variation that could potentially be modulated by crop diversity in landscapes. Second, what can whole-genome data reveal about the spatial extent of gene flow? The relative ease with which whole-genome data can now be generated for non-model systems opens the door for a powerful set of tools to be applied to the study of B. tabaci ecology and evolution. Pertinent to B. tabaci gene flow, genome-wide patterns of linkage disequilibrium can be used to make precise inferences about the spatial extent and timing of gene flow among populations [93], and haplodiploidy makes B. tabaci particularly amenable to this kind of analysis (because haploid male genomes contain perfect linkage information, circumventing the need for carefully constructed pedigrees). Lastly, is anything impeding movement of B. tabaci among crops? Landscape genetics approaches, which examine associations between genetic variation and environmental variables [94], provide a useful framework with which to approach this question where evidence for genetic differentiation among populations is found [95], and are still rarely applied in agricultural pest systems [5,7,96]. Discerning whether B. tabaci populations should be considered on local versus regional scales is important for designing management schemes of all kinds, including, but not limited to, insecticide resistance management strategies, which could benefit from coordinated efforts to rotate insecticide modes of action across commodities and regions where B. tabaci population linkages are evident.
Supplementary Materials
The following are available online at https://0-www-mdpi-com.brum.beds.ac.uk/2075-4450/11/11/813/s1, Table S1: Summary of select attributes of reviewed research articles, Table S2: Summary of genetic diversity and differentiation among cryptic species and studies.
Author Contributions
Conceptualization and visualization, M.S.C.; writing, M.S.C. and W.E.S. All authors have read and agreed to the published version of the manuscript.
Funding
This research was funded by the USDA Non-Assistance Cooperative Agreement #58-6080-9-006 “Managing Whiteflies and Whitefly-transmitted Viruses in Vegetable Crops in the Southeastern U.S.”
Acknowledgments
We thank two anonymous reviewers for helpful feedback on earlier drafts. We thank A. K. Barman, M. D. Toews, P. M. Roberts, D. G. Riley, and A. N. Sparks for helpful discussions about whitefly biology.
Conflicts of Interest
The authors declare no conflict of interest.
References
- Miller, S.D.; MacInnes, H.E.; Fewster, R.M. Detecting invisible migrants: An application of genetic methods to estimate migration rates. In Modeling Demographic Processes in Marked Populations; Springer: New York, NY, USA, 2009; pp. 417–437. [Google Scholar]
- Lowe, W.H.; Allendorf, F.W. What can genetics tell us about population connectivity? Mol. Ecol. 2010, 19, 3038–3051. [Google Scholar] [CrossRef]
- Kim, K.S.; Sappington, T.W. Population genetics strategies to characterize long-distance dispersal of insects. J. Asia-Pac. Entomol. 2013, 16, 87–97. [Google Scholar] [CrossRef] [Green Version]
- Fu, Z.; Epstein, B.; Kelley, J.L.; Zheng, Q.; Bergland, A.O.; Castillo Carrillo, C.I.; Jensen, A.S.; Dahan, J.; Karasev, A.V.; Snyder, W.E. Using NextRAD sequencing to infer movement of herbivores among host plants. PLoS ONE 2017, 12, e0177742. [Google Scholar] [CrossRef] [Green Version]
- Crossley, M.S.; Rondon, S.I.; Schoville, S.D. Effects of contemporary agricultural land cover on Colorado potato beetle genetic differentiation in the Columbia Basin and Central Sands. Ecol. Evol. 2019, 9, 9385–9394. [Google Scholar] [CrossRef] [Green Version]
- Kim, K.S.; Bagley, M.J.; Coates, B.S.; Hellmich, R.L.; Sappington, T.W. Spatial and temporal genetic analyses show high gene flow among European corn borer (Lepidoptera: Crambidae) populations across the Central U.S. Corn Belt. Environ. Entomol. 2009, 38, 1312–1323. [Google Scholar] [CrossRef] [PubMed] [Green Version]
- Pélissié, B.; Crossley, M.S.; Cohen, Z.P.; Schoville, S.D. Rapid evolution in insect pests: The importance of space and time in population genomics studies. Curr. Opin. Insect Sci. 2018, 26, 8–16. [Google Scholar] [CrossRef] [PubMed]
- Byrne, D.N.; Bellows, T.S. Whitefly biology. Annu. Rev. Entomol. 1991, 36, 431–457. [Google Scholar] [CrossRef]
- Brown, J.K.; Frohlich, D.R.; Rosell, R.C. The sweetpotato or silverleaf whiteflies: Biotypes of Bemisia tabaci or a species complex? Annu. Rev. Entomol. 1995, 40, 511–534. [Google Scholar] [CrossRef]
- Riley, D.G.; Ciomperlik, M.A. Regional population dynamics of whitefly (Homoptera: Aleyrodidae) and associated parasitoids (Hymenoptera: Aphelinidae). Environ. Entomol. 1997, 26, 1049–1055. [Google Scholar] [CrossRef]
- Naranjo, S.E.; Castle, S.J.; De Barro, P.J.; Liu, S.S. Population dynamics, demography, dispersal and spread of Bemisia tabaci. In Bemisia: Bionomics and Management of a Global Pest; Springer: New York, NY, USA, 2010; pp. 185–226. ISBN 9789048124596. [Google Scholar]
- De Barro, P.J.; Liu, S.-S.; Boykin, L.M.; Dinsdale, A.B. Bemisia tabaci: A statement of species status. Annu. Rev. Entomol 2011, 56, 1–19. [Google Scholar] [CrossRef]
- Dalmon, A.; Halkett, F.; Granier, M.; Delatte, H.; Peterschmitt, M. Genetic structure of the invasive pest Bemisia tabaci: Evidence of limited but persistent genetic differentiation in glasshouse populations. Heredity 2008, 100, 316–325. [Google Scholar] [CrossRef] [PubMed]
- Dalton, R. Whitefly infestations: The Christmas invasion. Nature 2006, 443, 898–900. [Google Scholar] [CrossRef] [PubMed]
- Elfekih, S.; Etter, P.; Tay, W.T.; Fumagalli, M.; Gordon, K.; Johnson, E.; De Barro, P. Genome-wide analyses of the Bemisia tabaci species complex reveal contrasting patterns of admixture and complex demographic histories. PLoS ONE 2018, 13, e0190555. [Google Scholar] [CrossRef] [PubMed] [Green Version]
- Fontes, F.H.M.; Colombo, C.A.; Lourenção, A.L. Structure of genetic diversity of Bemisia tabaci (Genn.) (Hemiptera: Aleyrodidae) populations in Brazilian crops and locations. Sci. Agric. 2012, 69, 47–53. [Google Scholar] [CrossRef] [Green Version]
- Hsieh, C.-H.; Chiang, Y.-H.; Ko, C.-C. Population genetic structure of the newly invasive Q biotype of Bemisia tabaci in Taiwan. Entomol. Exp. Appl. 2011, 138, 263–271. [Google Scholar] [CrossRef]
- Hadjistylli, M.; Brown, J.K.; Roderick, G.K. Tools and recent progress in studying gene flow and population genetics of the Bemisia tabaci sibling species group. In Bemisia: Bionomics and Management of a Global Pest; Springer: New York, NY, USA, 2012; pp. 69–103. ISBN 9789048124596. [Google Scholar]
- Boykin, L.M.; Bell, C.D.; Evans, G.; Small, I.; De Barro, P.J. Is agriculture driving the diversification of the Bemisia tabaci species complex (Hemiptera: Sternorrhyncha: Aleyrodidae)?: Dating, diversification and biogeographic evidence revealed. BMC Evol. Biol. 2013, 13. [Google Scholar] [CrossRef] [PubMed] [Green Version]
- Pascual, S.; Callejas, C. Intra- and interspecific competition between biotypes B and Q of Bemisia tabaci (Hemiptera: Aleyrodidae) from Spain. Bull. Entomol. Res. 2004, 94, 369–375. [Google Scholar] [CrossRef] [PubMed]
- Perring, T.M.; Farrar, C.A.; Cooper, A.D. Mating behavior and competitive displacement in whiteflies. In Silverleaf Whitefly (Formerly Sweetpotato Whitefly, Strain B): 1994 Supplement to the 5-Year National Research and Action Plan; Agric. Res. Serv. No. 125; U.S. Dept. Agric.: Washington, DC, USA, 1994; p. 25. [Google Scholar]
- Bedford, I.D.; Briddon, R.W.; Brown, J.K.; Rosell, R.C.; Markham, P.G. Geminivirus transmission and biological characterisation of Bemisia tabaci (Gennadius) biotypes from different geographic regions. Ann. Appl. Biol. 1994, 125, 311–325. [Google Scholar] [CrossRef]
- Jiu, M.; Zhou, X.P.; Tong, L.; Xu, J.; Yang, X.; Wan, F.H.; Liu, S.S. Vector-virus mutualism accelerates population increase of an invasive whitefly. PLoS ONE 2007, 2, e000182. [Google Scholar] [CrossRef] [Green Version]
- Costa, H.S.; Brown, J.K.; Byrne, D.N. Life history traits of the whitefly, Bemisia tabaci (Homoptera: Aleyrodidae) on six virus-infected or healthy plant species. Environ. Entomol. 1991, 20, 1102–1107. [Google Scholar] [CrossRef]
- Hamon, A.; Salguero, V. Bemisia tabaci, sweetpotato whitefly, in Florida (In Proceedings of the: Aleyrodidae: Aleyrodinae); Entomology; Florida Dep. Agric. Consum. Serv. Div. Plant Ind. Gainesville: Gainesville, FL, USA, 1987. [Google Scholar]
- Yokomi, R.K. Relationships between the sweetpotato whitefly and the squash silverleaf disorder. Phytopathology 1990, 80, 895–900. [Google Scholar] [CrossRef]
- McKenzie, C.L.; Bethke, J.A.; Byrne, F.J.; Chamberlin, J.R.; Dennehy, T.J.; Dickey, A.M.; Gilrein, D.; Hall, P.M.; Ludwig, S.; Oetting, R.D.; et al. Distribution of Bemisia tabaci (Hemiptera: Aleyrodidae) biotypes in North America after the Q invasion. J. Econ. Entomol. 2012, 105, 753–766. [Google Scholar] [CrossRef] [PubMed] [Green Version]
- Horowitz, A.R.; Kontsedalov, S.; Khasdan, V.; Ishaaya, I. Biotypes B and Q of Bemisia tabaci and their relevance to neonicotinoid and pyriproxyfen resistance. Arch. Insect Biochem. Physiol. 2005, 58, 216–225. [Google Scholar] [CrossRef] [PubMed]
- Horowitz, A.R.; Gorman, K.; Ross, G.; Denholm, I. Inheritance of pyriproxyfen resistance in the whitefly, Bemisia tabaci (Q biotype). Arch. Insect Biochem. Physiol. 2003, 54, 177–186. [Google Scholar] [CrossRef] [PubMed]
- Paredes-Montero, J.R.; Hameed, U.; Zia-Ur-Rehman, M.; Rasool, G.; Haider, M.S.; Herrmann, H.W.; Brown, J.K. Demographic expansion of the predominant Bemisia tabaci (Gennadius) (Hemiptera: Aleyrodidae) mitotypes associated with the cotton leaf curl virus epidemic in Pakistan. Ann. Entomol. Soc. Am. 2019, 112, 265–280. [Google Scholar] [CrossRef]
- Himler, A.G.; Adachi-Hagimori, T.; Bergen, J.E.; Kozuch, A.; Kelly, S.E.; Tabashnik, B.E.; Chiel, E.; Duckworth, V.E.; Dennehy, T.J.; Zchori-Fein, E.; et al. Rapid spread of a bacterial symbiont in an invasive whitefly is driven by fitness benefits and female bias. Science 2011, 332, 254–256. [Google Scholar] [CrossRef] [Green Version]
- Liu, S.S.; De Barro, P.J.; Xu, J.; Luan, J.B.; Zang, L.S.; Ruan, Y.M.; Wan, F.H. Asymmetric mating interactions drive widespread invasion and displacement in a whitefly. Science 2007, 318, 1769–1772. [Google Scholar] [CrossRef]
- Chu, D.; Pan, H.P.; Li, X.C.; Guo, D.; Tao, Y.L.; Liu, B.M.; Zhang, Y.J. Spatial genetic heterogeneity in populations of a newly invasive whitefly in China revealed by a nation-wide field survey. PLoS ONE 2013, 8, e0079997. [Google Scholar] [CrossRef] [Green Version]
- Byrne, D.N. Migration and dispersal by the sweet potato whitefly, Bemisia tabaci. Agric. For. Meteorol. 1999, 97, 309–316. [Google Scholar] [CrossRef]
- Blackmer, J.L.; Byrne, D.N.; Tu, Z. Behavioral, morphological, and physiological traits associated with migratory Bemisia tabaci (Homoptera: Aleyrodidae). J. Insect Behav. 1994, 8, 251–267. [Google Scholar] [CrossRef]
- Byrne, D.N.; Houck, M.A. Morphometric identification of wing polymorphism in Bemisia tabaci (Homoptera: Aleyrodidae). Ann. Entomol. Soc. Am. 1990, 83, 487–493. [Google Scholar] [CrossRef]
- Byrne, D.N.; Von Bretzel, P.K.; Hoffman, C.J. Impact of trap design and placement when monitoring for the bandedwinged whitefly and the sweetpotato whitefly (Homoptera: Aleyrodidae). Environ. Entomol. 1986, 15, 300–304. [Google Scholar] [CrossRef]
- Byrne, D.N.; Rathman, R.J.; Orum, T.V.; Palumbo, J.C. Localized migration and dispersal by the sweet potato whitefly, Bemisia tabaci. Oecologia 1996, 105, 320–328. [Google Scholar] [CrossRef] [PubMed]
- Lima, L.H.C.; Campos, L.; Moretzsohn, M.C.; Návia, D.; de Oliveira, M.R.V. Genetic diversity of Bemisia tabaci (Genn.) populations in Brazil revealed by RAPD markers. Genet. Mol. Biol. 2002, 25, 217–223. [Google Scholar] [CrossRef]
- Mckenzie, C.L.; Hodges, G.; Osborne, L.S.; Byrne, F.J.; Shatters, R.G. Distribution of Bemisia tabaci (Hemiptera: Aleyrodidae) biotypes in Florida–Investigating the Q invasion. J. Econ. Entomol. 2009, 102, 670–676. [Google Scholar] [CrossRef] [PubMed]
- Hsieh, C.-H.; Wang, C.-H.; Ko, C.-C. Evidence from molecular markers and population genetic analyses suggests recentinvasions of the Western North Pacific region by biotypes B and Q of Bemisia tabaci (Gennadius). Environ. Entomol. 2007, 36, 952–961. [Google Scholar] [CrossRef] [PubMed] [Green Version]
- Valle, G.; Lourenção, A.; Zucchi, M.; Pinheiro, J.; Abreu, A. MtDNA variability in whitefly (Bemisia tabaci) populations in Brazil. Genet. Mol. Res. 2011, 10, 2155–2164. [Google Scholar] [CrossRef]
- Maruthi, M.N.; Rekha, A.R.; Mirza, S.H.; Alam, S.N.; Colvin, J. PCR-based detection and partial genome sequencing indicate high genetic diversity in Bangladeshi begomoviruses and their whitefly vector, Bemisia tabaci. Virus Genes 2007, 34, 373–385. [Google Scholar] [CrossRef]
- Li, H.R.; Pan, H.P.; Tao, Y.L.; Zhang, Y.J.; Chu, D. Population genetics of an alien whitefly in China: Implications for its dispersal and invasion success. Sci. Rep. 2017, 7, 1–8. [Google Scholar] [CrossRef] [Green Version]
- Legg, J.P.; Sseruwagi, P.; Boniface, S.; Okao-Okuja, G.; Shirima, R.; Bigirimana, S.; Gashaka, G.; Herrmann, H.W.; Jeremiah, S.; Obiero, H.; et al. Spatio-temporal patterns of genetic change amongst populations of cassava Bemisia tabaci whiteflies driving virus pandemics in East and Central Africa. Virus Res. 2014, 186, 61–75. [Google Scholar] [CrossRef]
- Moya, A.; Guirao, P.; Cifuentes, D.; Beitia, F.; Cenis, J.L. Genetic diversity of Iberian populations of Bemisia tabaci (Hemiptera: Aleyrodidae) based on random amplified polymorphic DNA-polymerase chain reaction. Mol. Ecol. 2001, 10, 891–897. [Google Scholar] [CrossRef] [PubMed]
- Abdullahi, I.; Winter, S.; Atiri, G.I.; Thottappilly, G. Molecular characterization of whitefly, Bemisia tabaci (Hemiptera: Aleyrodidae) populations infesting cassava. Bull. Entomol. Res. 2003, 93, 97–106. [Google Scholar] [CrossRef] [PubMed]
- Fahmy, I.F.; Abou-Ali, R.M. Studying genetic diversity of whitefly B. tabaci Egyptian isolates in relation to some worldwide isolates. J. Genet. Eng. Biotechnol. 2015, 13, 87–92. [Google Scholar] [CrossRef] [PubMed] [Green Version]
- Zhang, L.P.; Zhang, Y.J.; Zhang, W.J.; Wu, Q.J.; Xu, B.Y.; Chu, D. Analysis of genetic diversity among different geographical populations and determination of biotypes of Bemisia tabaci in China. J. Appl. Entomol. 2005, 129, 121–128. [Google Scholar] [CrossRef]
- Rajaei, S.H.; Kazemi, B.; Manzari, S.; Brown, J.K.; Sarafrazi, A. Genetic variation and mtCOI phylogeny for Bemisia tabaci (Hemiptera, Aleyrodidae) indicate that the “B” biotype predominates in Iran. J. Pest Sci. 2008, 81, 199–206. [Google Scholar] [CrossRef]
- Gorsane, F.; Ben Halima, A.; Ben Khalifa, M.; Bel-Kadhi, M.S.; Fakhfakh, H. Molecular characterization of Bemisia tabaci populations in Tunisia: Genetic structure and evidence for multiple acquisition of secondary symbionts. Environ. Entomol. 2011, 40, 809–817. [Google Scholar] [CrossRef]
- Wool, D.; Calvert, L.; Constantino, L.M.; Bellotti, A.C.; Gerling, D. Differentiation of Bemisia tabaci (Genn.) (Hom., Aleyrodidae) populations in Colombia. J. Appl. Entomol. 1994, 117, 122–134. [Google Scholar] [CrossRef]
- Islam, W.; Lin, W.; Qasim, M.; Islam, S.U.; Ali, H.; Adnan, M.; Arif, M.; Du, Z.; Wu, Z. A nation-wide genetic survey revealed a complex population structure of Bemisia tabaci in Pakistan. Acta Trop. 2018, 183, 119–125. [Google Scholar] [CrossRef]
- Díaz, F.; Endersby, N.M.; Hoffmann, A.A. Genetic structure of the whitefly Bemisia tabaci populations in Colombia following a recent invasion. Insect Sci. 2015, 22, 483–494. [Google Scholar] [CrossRef] [Green Version]
- Hadjistylli, M.; Roderick, G.K.; Brown, J.K. Global population structure of a worldwide pest and virus vector: Genetic diversity and population history of the Bemisia tabaci sibling species group. PLoS ONE 2016, 11, e0165105. [Google Scholar] [CrossRef] [Green Version]
- Delatte, H.; David, P.; Granier, M.; Lett, J.M.; Goldbach, R.; Peterschmitt, M.; Reynaud, B. Microsatellites reveal extensive geographical, ecological and genetic contacts between invasive and indigenous whitefly biotypes in an insular environment. Genet. Res. 2006, 87, 109–124. [Google Scholar] [CrossRef] [PubMed] [Green Version]
- Tsagkarakou, A.; Mouton, L.; Kristoffersen, J.B.; Dokianakis, E.; Grispou, M.; Bourtzis, K. Population genetic structure and secondary endosymbionts of Q Bemisia tabaci (Hemiptera: Aleyrodidae) from Greece. Bull. Entomol. Res. 2012, 102, 353–365. [Google Scholar] [CrossRef] [PubMed]
- Park, Y.; Nam, H.Y.; Baek, S.; Lee, S.H.; Lee, J.H. Population genetic structure of Bemisia tabaci MED (Hemiptera: Aleyrodidae) in Korea. PLoS ONE 2019, 14, e0220327. [Google Scholar] [CrossRef] [PubMed]
- Dickey, A.M.; Osborne, L.S.; Shatters, R.G.; Hall, P.M.; Mckenzie, C.L. Population genetics of invasive Bemisia tabaci (Hemiptera: Aleyrodidae) cryptic species in the United States based on microsatellite markers. J. Econ. Entomol. 2013, 106, 1355–1364. [Google Scholar] [CrossRef] [Green Version]
- Dinsdale, A.; Schellhorn, N.A.; De Barro, P.; Buckley, Y.M.; Riginos, C. Rapid genetic turnover in populations of the insect pest Bemisia tabaci Middle East: Asia Minor 1 in an agricultural landscape. Bull. Entomol. Res. 2012, 102, 539–549. [Google Scholar] [CrossRef]
- Ally, H.M.; El Hamss, H.; Simiand, C.; Maruthi, M.N.; Colvin, J.; Omongo, C.A.; Delatte, H. What has changed in the outbreaking populations of the severe crop pest whitefly species in cassava in two decades? Sci. Rep. 2019, 9, 1–13. [Google Scholar] [CrossRef] [Green Version]
- Ben Abdelkrim, A.; Hattab, T.; Fakhfakh, H.; Belkadhi, M.S.; Gorsane, F. A landscape genetic analysis of important agricultural pest species in Tunisia: The whitefly Bemisia tabaci. PLoS ONE 2017, 12, e0185724. [Google Scholar] [CrossRef] [Green Version]
- Tsagkarakou, A.; Tsigenopoulos, C.S.; Gorman, K.; Lagnel, J.; Bedford, I.D. Biotype status and genetic polymorphism of the whitefly Bemisia tabaci (Hemiptera: Aleyrodidae) in Greece: Mitochondrial DNA and microsatellites. Bull. Entomol. Res. 2007, 97, 29–40. [Google Scholar] [CrossRef]
- Simón, B.; Cenis, J.L.; De La Rúa, P. Distribution patterns of the Q and B biotypes of Bemisia tabaci in the Mediterranean Basin based on microsatellite variation. Entomol. Exp. Appl. 2007, 124, 327–336. [Google Scholar] [CrossRef]
- Chu, D.; Guo, D.; Tao, Y.; Jiang, D.; Li, J.; Zhang, Y. Evidence for rapid spatiotemporal changes in genetic structure of an alien whitefly during initial invasion. Sci. Rep. 2014, 4. [Google Scholar] [CrossRef] [Green Version]
- Tahiri, A.; Halkett, F.; Granier, M.; Gueguen, G.; Peterschmitt, M. Evidence of gene flow between sympatric populations of the middle east-asia minor 1 and mediterranean putative species of Bemisia tabaci. Ecol. Evol. 2013, 3, 2619–2633. [Google Scholar] [CrossRef]
- Gauthier, N.; Clouet, C.; Perrakis, A.; Kapantaidaki, D.; Peterschmitt, M.; Tsagkarakou, A. Genetic structure of Bemisia tabaci Med populations from home-range countries, inferred by nuclear and cytoplasmic markers: Impact on the distribution of the insecticide resistance genes. Pest Manag. Sci. 2014, 70, 1477–1491. [Google Scholar] [CrossRef] [PubMed]
- De Barro, P.J. Genetic structure of the whitefly Bemisia tabaci in the Asia-Pacific region revealed using microsatellite markers. Mol. Ecol. 2005, 14, 3695–3718. [Google Scholar] [CrossRef] [PubMed]
- Chen, W.; Wosula, E.N.; Hasegawa, D.K.; Casinga, C.; Shirima, R.R.; Fiaboe, K.K.M.; Hanna, R.; Fosto, A.; Goergen, G.; Tamò, M.; et al. Genome of the African cassava whitefly Bemisia tabaci and distribution and genetic diversity of cassava-colonizing whiteflies in Africa. Insect Biochem. Mol. Biol. 2019, 110, 112–120. [Google Scholar] [CrossRef] [PubMed]
- Qu, W.; Liang, N.; Wu, Z.; Zhao, Y.; Chu, D. Minimum sample sizes for invasion genomics: Empirical investigation in an invasive whitefly. Ecol. Evol. 2020, 10, 38–49. [Google Scholar] [CrossRef] [PubMed] [Green Version]
- Wosula, E.N.; Chen, W.; Fei, Z.; Legg, J.P. Unravelling the genetic diversity among cassava Bemisia tabaci whiteflies using NextRAD sequencing. Genome Biol. Evol. 2017, 9, 2958–2973. [Google Scholar] [CrossRef] [PubMed] [Green Version]
- Shatters, R.G.; Powell, C.A.; Boykin, L.M.; Liansheng, H.; McKenzie, C.L. Improved DNA barcoding method for Bemisia tabaci and related Aleyrodidae: Development of universal and Bemisia tabaci biotype-specific mitochondrial cytochrome c oxidase I polymerase chain reaction primers. J. Econ. Entomol. 2009, 102, 750–758. [Google Scholar] [CrossRef]
- Papadopoulou, A.; Anastasiou, I.; Vogler, A.P. Revisiting the insect mitochondrial molecular clock: The mid-aegean trench calibration. Mol. Biol. Evol. 2010, 27, 1659–1672. [Google Scholar] [CrossRef] [Green Version]
- Fu, Z.; Meier, A.R.; Epstein, B.; Bergland, A.O.; Castillo Carrillo, C.I.; Cooper, W.R.; Cruzado, R.K.; Horton, D.R.; Jensen, A.S.; Kelley, J.L.; et al. Host plants and Wolbachia shape the population genetics of sympatric herbivore populations. Evol. Appl. 2020, 1–14. [Google Scholar] [CrossRef]
- Slatkin, M. Gene flow and the geographic structure of natural populations. Science 1987, 236, 787–792. [Google Scholar] [CrossRef]
- Wright, S. Evolution and the Genetics of Populations. In Vol. II. The Theory of Gene Frequencies; University of Chicago Press: Chicago, IL, USA, 1969. [Google Scholar]
- Pritchard, J.K.; Stephens, M.; Donnelly, P. Inference of population structure using multilocus genotype data. Genetics 2000, 155, 945–959. [Google Scholar]
- Janes, J.K.; Miller, J.M.; Dupuis, J.R.; Malenfant, R.M.; Gorrell, J.C.; Cullingham, C.I.; Andrew, R.L. The K = 2 conundrum. Mol. Ecol. 2017, 26, 3594–3602. [Google Scholar] [CrossRef] [PubMed] [Green Version]
- Wright, S. Isolation by distance. Genetics 1943, 28, 114–138. [Google Scholar] [PubMed]
- Hedrick, P.W.; Parker, J.D. Evolutionary genetics and genetic variation of haplodiploids and X-linked genes. Annu. Rev. Ecol. Syst. 1997, 28, 55–83. [Google Scholar] [CrossRef]
- Maruyama, T.; Fuerst, P.A. Population bottlenecks and nonequilibrium models in population genetics. II. Number of alleles in a small population that was formed by a recent bottleneck. Genetics 1985, 111, 675–689. [Google Scholar] [PubMed]
- Pemberton, J.M.; Slate, J.; Bancroft, D.R.; Barrett, J.A. Nonamplifying alleles at microsatellite loci: A caution for parentage and population studies. Mol. Ecol. 1995, 4, 249–252. [Google Scholar] [CrossRef]
- Keller, L.F.; Waller, D.M. Inbreeding effects in wild populations. Trends Ecol. Evol. 2002, 17, 230–241. [Google Scholar] [CrossRef]
- Pan, H.; Li, X.; Ge, D.; Wang, S.; Wu, Q.; Xie, W.; Jiao, X.; Chu, D.; Liu, B.; Xu, B.; et al. Factors affecting population dynamics of maternally transmitted endosymbionts in Bemisia tabaci. PLoS ONE 2012, 7, e0030760. [Google Scholar] [CrossRef] [Green Version]
- Nirgianaki, A.; Banks, G.K.; Frohlich, D.R.; Veneti, Z.; Braig, H.R.; Miller, T.A.; Bedford, I.D.; Markham, P.G.; Savakis, C.; Bourtzis, K. Wolbachia infections of the whitefly Bemisia tabaci. Curr. Microbiol. 2003, 47, 93–101. [Google Scholar] [CrossRef]
- Li, S.J.; Ahmed, M.Z.; Lv, N.; Shi, P.Q.; Wang, X.M.; Huang, J.L.; Qiu, B.L. Plantmediated horizontal transmission of Wolbachia between whiteflies. ISME J. 2017, 11, 1019–1028. [Google Scholar] [CrossRef] [Green Version]
- Wahlund, S. Zusammensetzung von Population und Korrelationserscheinung vom Standpunkt der Vererbungslehre aus betrachtet. Hereditas 1928, 11, 65–106. [Google Scholar] [CrossRef]
- Drès, M.; Mallet, J. Host races in plant-feeding insects and their importance in sympatric speciation. Philos. Trans. R. Soc. B Biol. Sci. 2002, 357, 471–492. [Google Scholar] [CrossRef] [PubMed] [Green Version]
- Barrett, R.D.H.; Schluter, D. Adaptation from standing genetic variation. Trends Ecol. Evol. 2007, 23, 38–44. [Google Scholar] [CrossRef] [PubMed]
- Chen, W.; Hasegawa, D.K.; Kaur, N.; Kliot, A.; Pinheiro, P.V.; Luan, J.; Stensmyr, M.C.; Zheng, Y.; Liu, W.; Sun, H.; et al. The draft genome of whitefly Bemisia tabaci MEAM1, a global crop pest, provides novel insights into virus transmission, host adaptation, and insecticide resistance. BMC Biol. 2016, 14, 110. [Google Scholar] [CrossRef]
- Schmidt, T.L.; Rašić, G.; Zhang, D.; Zheng, X.; Xi, Z.; Hoffmann, A.A. Genome-wide SNPs reveal the drivers of gene flow in an urban population of the Asian tiger mosquito, Aedes albopictus. PLoS Negl. Trop. Dis. 2017, 11, e0006009. [Google Scholar] [CrossRef] [PubMed] [Green Version]
- Yang, F.; Liu, N.; Crossley, M.S.; Wang, P.; Ma, Z.; Guo, J.; Zhang, R. Cropland connectivity affects genetic divergence of Colorado potato beetle along an invasion front. Evol. Appl. 2020. [Google Scholar] [CrossRef]
- Duranton, M.; Bonhomme, F.; Gagnaire, P. The spatial scale of dispersal revealed by admixture tracts. Evol. Appl. 2019, 12, 1743–1756. [Google Scholar] [CrossRef]
- Manel, S.; Schwartz, M.K.; Luikart, G.; Taberlet, P. Landscape genetics: Combining landscape ecology and population genetics. Trends Ecol. Evol. 2003, 18, 189–197. [Google Scholar] [CrossRef]
- Cushman, S.A.; Shirk, A.J.; Landguth, E.L. Landscape genetics and limiting factors. Conserv. Genet. 2013, 14, 263–274. [Google Scholar] [CrossRef]
- Kirk, H.; Dorn, S.; Mazzi, D. Molecular genetics and genomics generate new insights into invertebrate pest invasions. Evol. Appl. 2013, 6, 842–856. [Google Scholar] [CrossRef] [Green Version]
Figure 1.
Geographic and temporal scope of literature reviewed. (a) Countries where Bemisia tabaci populations were sampled in the reviewed literature (number of studies = 39). (b) Countries where Middle East-Asia Minor 1 (MEAM 1) and/or Mediterranean (MED) cryptic species were sampled (number of studies = 30). (c) Countries where microsatellite data were used to study B. tabaci genetic variation (number of studies = 19). (d) Countries where single nucleotide polymorphism data were used to study B. tabaci genetic variation (number of studies = 4). Maps were drawn using the Winkel Tripel projection. (e) Histogram depicting the first year when sampling was reported (range 1991–2016). Studies that did not report sampling dates appear on the left and are labeled as “Unknown”. (f) Histogram depicting the last year when sampling was reported in studies (range 2002–2018).

Figure 2.
Summary of genetic differentiation among populations within cryptic species among microsatellite-based studies. (a) Barplots depict the range of pairwise fixation index (FST) reported among populations within cryptic species and studies. “MEAM 1” stands for Middle East-Asia Minor 1; “MED” stands for Mediterranean; “IO” stands for Indian Ocean; “SSA 1” stands for Sub-Saharan Africa 1. (b) Boxplot depicts the distribution of reported values of the percentage of genetic variance partitioned within populations. Boxplots depict the median (thick line), 25th and 75th percentiles (box edges), and 95th percentiles (whiskers).

Figure 3.
Summary of STRUCTURE and isolation by distance analyses. (a) Circle diagram depicting the proportion of studies reporting an optimal value of K = 2 versus K > 2. Values of K = 2 are generally interpreted to mean that there is little/no population structure distinguishing the sampled populations (b) Circle diagram depicting the proportion of studies reporting evidence of isolation by distance, a phenomenon wherein genetic differentiation (represented by FST/(1-FST)) increases with increasing geographic distance between populations.

Figure 4.
Summary of genetic diversity among populations within cryptic species among studies. (a) Barplots depicting the range of observed and expected heterozygosity for each cryptic species among studies [13,16,17,54,56,57,58,60,61,65,66,70]. “MEAM 1” stands for Middle East-Asia Minor 1; “MED” stands for Mediterranean; “IO” stands for Indian Ocean; “SSA 1” stands for Sub-Saharan Africa 1. (b) Circle diagram depicting the proportion of studies reporting heterozygote deficits (regardless of whether this was formally tested with a statistical model) among most if not all populations. (c) Circle diagram depicting the proportion of studies that interpreted patterns of genetic variation as evidence of multiple invasions having occurred in the study region.

Publisher’s Note: MDPI stays neutral with regard to jurisdictional claims in published maps and institutional affiliations. |
© 2020 by the authors. Licensee MDPI, Basel, Switzerland. This article is an open access article distributed under the terms and conditions of the Creative Commons Attribution (CC BY) license (http://creativecommons.org/licenses/by/4.0/).
Share and Cite
MDPI and ACS Style
Crossley, M.S.; Snyder, W.E. What Is the Spatial Extent of a Bemisia tabaci Population? Insects 2020, 11, 813. https://0-doi-org.brum.beds.ac.uk/10.3390/insects11110813
AMA Style
Crossley MS, Snyder WE. What Is the Spatial Extent of a Bemisia tabaci Population? Insects. 2020; 11(11):813. https://0-doi-org.brum.beds.ac.uk/10.3390/insects11110813
Chicago/Turabian StyleCrossley, Michael S., and William E. Snyder. 2020. "What Is the Spatial Extent of a Bemisia tabaci Population?" Insects 11, no. 11: 813. https://0-doi-org.brum.beds.ac.uk/10.3390/insects11110813
Note that from the first issue of 2016, this journal uses article numbers instead of page numbers. See further details here.