COVID-19 Pandemic and Upcoming Influenza Season—Does an Expert’s Computed Tomography Assessment Differentially Identify COVID-19, Influenza and Pneumonias of Other Origin?

 , , , , , ,
Abstract
:1. Introduction
2. Experimental Section
2.1. Patient Selection
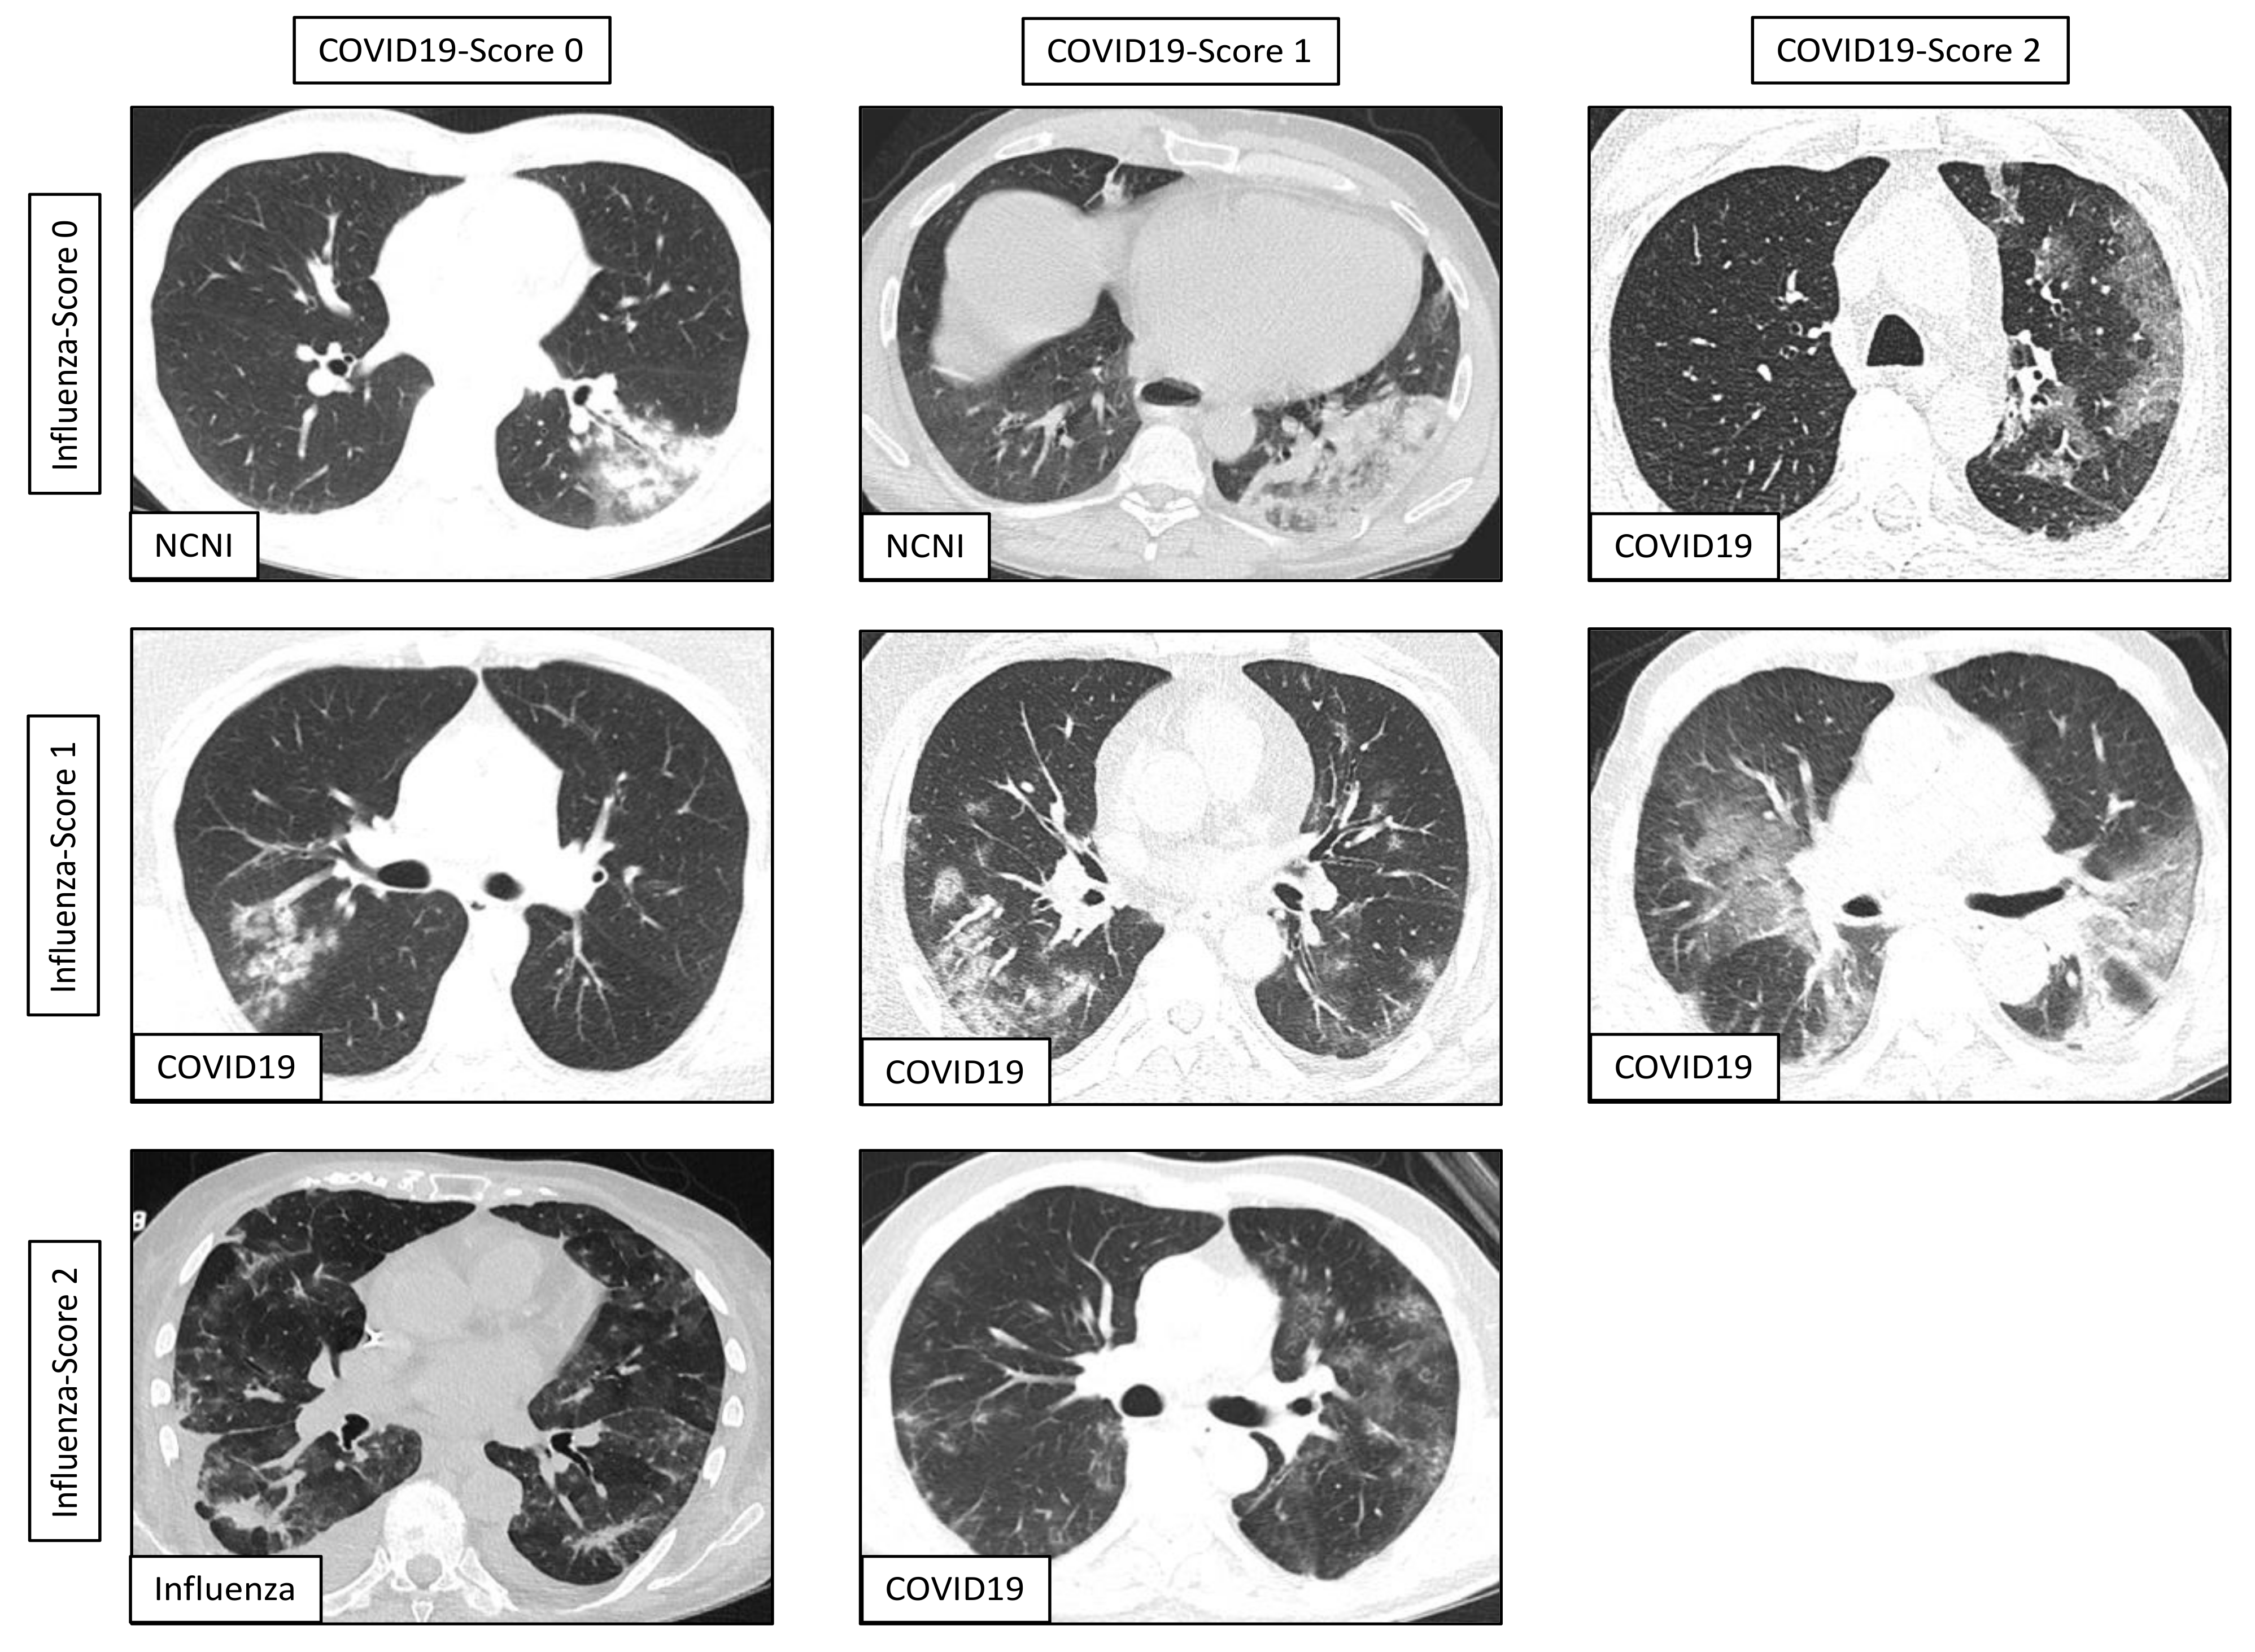
2.2. Chest CT Image Acquisition and Radiologist’s CT Assessment
2.3. Results Quantification and Statistical Analysis
3. Results
4. Discussion
Author Contributions
Funding
Institutional Review Board Statement
Informed Consent Statement
Conflicts of Interest
References
- World Health Organization. Novel Coronovirus—China. Available online: https://www.who.int/csr/don/12-january-2020-novel-coronavirus-china/en/ (accessed on 3 September 2020).
- World Health Organization. Rolling Updates on Coronavirus Disease (COVID-19). Available online: https://www.who.int/emergencies/diseases/novel-coronavirus-2019/events-as-they-happen (accessed on 3 September 2020).
- Coronaviridae Study Group of the International Committee on Taxonomy of Viruses. The species Severe acute respiratory syndrome-related coronavirus: Classifying 2019-nCoV and naming it SARS-CoV-2. Nat. Microbiol. 2020, 5, 536–544. [Google Scholar] [CrossRef] [PubMed] [Green Version]
- WHO Coronavirus Disease (COVID-19) Dashboard. Available online: https://covid19.who.int (accessed on 3 September 2020).
- Chen, N.; Zhou, M.; Dong, X.; Qu, J.; Gong, F.; Han, Y.; Qiu, Y.; Wang, J.; Liu, Y.; Wei, Y.; et al. Epidemiological and clinical characteristics of 99 cases of 2019 novel coronavirus pneumonia in Wuhan, China: A descriptive study. Lancet 2020, 395, 507–513. [Google Scholar] [CrossRef] [Green Version]
- Yang, X.; Yu, Y.; Xu, J.; Shu, H.; Liu, H.; Wu, Y.; Wu, Y.; Zhang, L.; Yu, Z.; Fang, M.; et al. Clinical course and outcomes of critically ill patients with SARS-CoV-2 pneumonia in Wuhan, China: A single-centered, retrospective, observational study. Lancet Respir. Med. 2020, 8, 475–481. [Google Scholar] [CrossRef] [Green Version]
- Tian, S.; Hu, N.; Lou, J.; Chen, K.; Kang, X.; Xiang, Z.; Chen, H.; Wang, D.; Liu, N.; Liu, D.; et al. Characteristics of COVID-19 infection in Beijing. J. Infect. 2020, 80, 401–406. [Google Scholar] [CrossRef] [Green Version]
- Xu, X.-W.; Wu, X.-X.; Jiang, X.-G.; Xu, K.-J.; Ying, L.-J.; Ma, C.-L.; Li, S.-B.; Wang, H.-Y.; Zhang, S.; Gao, H.-N.; et al. Clinical findings in a group of patients infected with the 2019 novel coronavirus (SARS-Cov-2) outside of Wuhan, China: Retrospective case series. BMJ 2020, 368, m606. [Google Scholar] [CrossRef] [Green Version]
- World Health Organization. Influenza (Seasonal). Available online: https://www.who.int/news-room/fact-sheets/detail/influenza-(seasonal) (accessed on 3 September 2020).
- Zhang, N.; Wang, L.; Deng, X.; Liang, R.; Su, M.; He, C.; Hu, L.; Su, Y.; Ren, J.; Yu, F.; et al. Recent advances in the detection of respiratory virus infection in humans. J. Med. Virol. 2020, 92, 408–417. [Google Scholar] [CrossRef]
- Long, C.; Xu, H.; Shen, Q.; Zhang, X.; Fan, B.; Wang, C.; Zeng, B.; Li, Z.; Li, X.; Li, H.; et al. Diagnosis of the Coronavirus disease (COVID-19): rRT-PCR or CT? Eur. J. Radiol. 2020, 126, 108961. [Google Scholar] [CrossRef]
- Sawano, T.; Kotera, Y.; Ozaki, A.; Murayama, A.; Tanimoto, T.; Sah, R.; Wang, J. Underestimation of COVID-19 cases in Japan: An analysis of RT-PCR testing for COVID-19 among 47 prefectures in Japan. QJM Int. J. Med. 2020, 113, 551–555. [Google Scholar] [CrossRef]
- Fang, Y.; Zhang, H.; Xie, J.; Lin, M.; Ying, L.; Pang, P.; Ji, W. Sensitivity of Chest CT for COVID-19: Comparison to RT-PCR. Radiology 2020, 296, E115–E117. [Google Scholar] [CrossRef]
- Ai, T.; Yang, Z.; Hou, H.; Zhan, C.; Chen, C.; Lv, W.; Tao, Q.; Sun, Z.; Xia, L. Correlation of Chest CT and RT-PCR Testing in Coronavirus Disease 2019 (COVID-19) in China: A Report of 1014 Cases. Radiology 2020. Available online: https://0-www-ncbi-nlm-nih-gov.brum.beds.ac.uk/pmc/articles/PMC7233399/ (accessed on 3 September 2020).
- Li, Y.; Xia, L. Coronavirus Disease 2019 (COVID-19): Role of Chest CT in Diagnosis and Management. Am. J. Roentgenol. 2020, 214, 1280–1286. [Google Scholar] [CrossRef]
- Wang, H.; Wei, R.; Rao, G.; Zhu, J.; Song, B. Characteristic CT findings distinguishing 2019 novel coronavirus disease (COVID-19) from influenza pneumonia. Eur. Radiol. 2020, 30, 4910–4917. [Google Scholar] [CrossRef] [PubMed]
- Altmayer, S.; Zanon, M.; Pacini, G.S.; Watte, G.; Barros, M.C.; Mohammed, T.-L.; Verma, N.; Marchiori, E.; Hochhegger, B. Comparison of the Computed Tomography Findings in COVID-19 and Other Viral Pneumonia in Immunocompetent Adults: A Systematic Review and Meta-Analysis. SSRN Electron. J. 2020, 1–12. [Google Scholar] [CrossRef]
- Simpson, S.; Kay, F.U.; Abbara, S.; Bhalla, S.; Chung, J.H.; Chung, M.; Henry, T.S.; Kanne, J.P.; Kligerman, S.; Ko, J.P.; et al. Radiological Society of North America Expert Consensus Statement on Reporting Chest CT Findings Related to COVID-19. Endorsed by the Society of Thoracic Radiology, the American College of Radiology, and RSNA—Secondary Publication. J. Thorac. Imaging 2020, 35, 219–227. [Google Scholar] [CrossRef]
- Li, K.; Wu, J.; Wu, F.; Guo, D.; Chen, L.; Fang, Z.; Li, C. The Clinical and Chest CT Features Associated With Severe and Critical COVID-19 Pneumonia. Investig. Radiol. 2020, 55, 327–331. [Google Scholar] [CrossRef] [PubMed]
- Ye, Z.; Zhang, Y.; Wang, Y.; Huang, Z.; Song, B. Chest CT manifestations of new coronavirus disease 2019 (COVID-19): A pictorial review. Eur. Radiol. 2020, 30, 4381–4389. [Google Scholar] [CrossRef] [PubMed] [Green Version]
- Liu, M.; Zeng, W.; Wen, Y.; Zheng, Y.; Lv, F.; Xiao, K. COVID-19 pneumonia: CT findings of 122 patients and differentiation from influenza pneumonia. Eur. Radiol. 2020, 1–7. [Google Scholar] [CrossRef]
- Reynolds, J.H.; McDonald, G.; Alton, H.; Gordon, S.B. Pneumonia in the immunocompetent patient. Br. J. Radiol. 2010, 83, 998–1009. [Google Scholar] [CrossRef] [Green Version]
- Demirkazik, F.B.; Akin, A.; Uzun, O.; Akpinar, M.G.; Ariyürek, M.O. CT findings in immunocompromised patients with pulmonary infections. Diagn. Interv. Radiol. 2008, 14, 75–82. [Google Scholar]
- Tarver, R.D.; Teague, S.D.; Heitkamp, D.E.; Conces, D.J. Radiology of Community-Acquired Pneumonia. Radiol. Clin. N. Am. 2005, 43, 497–512. [Google Scholar] [CrossRef]
- Rueckel, J.; Kunz, W.G.; Hoppe, B.F.; Patzig, M.; Notohamiprodjo, M.; Meinel, F.G.; Cyran, C.C.; Ingrisch, M.; Ricke, J.; Sabel, B.O. Artificial Intelligence Algorithm Detecting Lung Infection in Supine Chest Radiographs of Critically Ill Patients With a Diagnostic Accuracy Similar to Board-Certified Radiologists. Crit. Care Med. 2020, 48, e574–e583. [Google Scholar] [CrossRef]
- Kunz, W.; Patzig, M.; Crispin, A.; Stahl, R.; Reiser, M.F.; Notohamiprodjo, M. The Value of Supine Chest X-Ray in the Diagnosis of Pneumonia in the Basal Lung Zones. Acad. Radiol. 2018, 25, 1252–1256. [Google Scholar] [CrossRef] [PubMed]
- Zhang, J.; Ding, D.; Huang, X.; Zhang, J.; Chen, D.; Fu, P.; Shi, Y.; Xu, W.; Tao, Z. Differentiation of COVID-19 from seasonal influenza: A multicenter comparative study. J. Med. Virol. 2020. [Google Scholar] [CrossRef] [PubMed]
- Maignan, M.; Viglino, D.; Hablot, M.; Termoz Masson, N.; Lebeugle, A.; Collomb Muret, R.; Makele, P.M.; Guglielmetti, V.; Morand, P.; Lupo, J.; et al. Diagnostic accuracy of a rapid RT-PCR assay for point-of-care detection of influenza A/B virus at emergency department admission: A prospective evaluation during the 2017/2018 influenza season. PLoS ONE 2019, 14, e0216308. [Google Scholar] [CrossRef] [PubMed] [Green Version]
- Dugas, A.F.; Valsamakis, A.; Gaydos, C.A.; Forman, M.; Hardick, J.; Kidambi, P.; Amin, S.; Gupta, A.; Rothman, R.E. Evaluation of the Xpert Flu Rapid PCR Assay in High-Risk Emergency Department Patients. J. Clin. Microbiol. 2014, 52, 4353–4355. [Google Scholar] [CrossRef] [PubMed] [Green Version]
- Antoniol, S.; Fidouh, N.; Ghazali, A.; Ichou, H.; Bouzid, D.; Kenway, P.; Choquet, C.; Visseaux, B.; Casalino, E.; The Emergency Department Study Group on Respiratory Viruses. Diagnostic performances of the Xpert® Flu PCR test and the OSOM® immunochromatographic rapid test for influenza A and B virus among adult patients in the Emergency Department. J. Clin. Virol. 2018, 99–100, 5–9. [Google Scholar] [CrossRef] [PubMed]
- Valentin, T.; Kieslinger, P.; Stelzl, E.; Santner, B.I.; Groselj-Strele, A.; Kessler, H.H.; Tiran, B. Prospective evaluation of three rapid molecular tests for seasonal influenza in patients presenting at an emergency unit. J. Clin. Virol. 2019, 111, 29–32. [Google Scholar] [CrossRef]
- Sanche, S.; Lin, Y.T.; Xu, C.; Romero-Severson, E.; Hengartner, N.; Ke, R. High Contagiousness and Rapid Spread of Severe Acute Respiratory Syndrome Coronavirus 2. Emerg. Infect. Dis. 2020, 26, 1470–1477. [Google Scholar] [CrossRef]
- Biggerstaff, M.; Cauchemez, S.; Reed, C.; Gambhir, M.; Finelli, L. Estimates of the reproduction number for seasonal, pandemic, and zoonotic influenza: A systematic review of the literature. BMC Infect Dis. 2014, 14, 480. [Google Scholar] [CrossRef] [Green Version]
- McCullers, J.A. The co-pathogenesis of influenza viruses with bacteria in the lung. Nat. Rev. Genet. 2014, 12, 252–262. [Google Scholar] [CrossRef]
- Garcia-Vidal, C.; Sanjuan, G.; Moreno-García, E.; Puerta-Alcalde, P.; Garcia-Pouton, N.; Chumbita, M.; Fernandez-Pittol, M.; Pitart, C.; Inciarte, A.; Bodro, M.; et al. Incidence of co-infections and superinfections in hospitalised patients with COVID-19: A retrospective cohort study. Clin. Microbiol. Infect. 2020, 27, 83–88. [Google Scholar] [CrossRef]
- Hughes, S.; Troise, O.; Donaldson, H.; Mughal, N.; Moore, L. Bacterial and fungal coinfection among hospitalized patients with COVID-19: A retrospective cohort study in a UK secondary-care setting. Clin. Microbiol. Infect. 2020, 26, 1395–1399. [Google Scholar] [CrossRef] [PubMed]
- Robinson, K.M.; Kolls, J.K.; Alcorn, J.F. The immunology of influenza virus-associated bacterial pneumonia. Curr. Opin. Immunol. 2015, 34, 59–67. [Google Scholar] [CrossRef] [PubMed] [Green Version]
- Harmon, S.A.; Sanford, T.H.; Xu, S.; Turkbey, E.B.; Roth, H.; Xu, Z.; Yang, D.; Myronenko, A.; Anderson, V.; Amalou, A.; et al. Artificial intelligence for the detection of COVID-19 pneumonia on chest CT using multinational datasets. Nat. Commun. 2020, 11, 1–7. [Google Scholar] [CrossRef] [PubMed]
- Xie, X.; Zhong, Z.; Zhao, W.; Zheng, C.; Wang, F.; Liu, J. Chest CT for Typical Coronavirus Disease 2019 (COVID-19) Pneumonia: Relationship to Negative RT-PCR Testing. Radiology 2020, 296, E41–E45. [Google Scholar] [CrossRef] [Green Version]
- Gremmels, H.; Winkel, B.M.; Schuurman, R.; Rosingh, A.; Rigter, N.A.; Rodriguez, O.; Ubijaan, J.; Wensing, A.M.J.; Bonten, M.J.; Hofstra, L.M. Real-life validation of the PanbioTM COVID-19 antigen rapid test (Abbott) in community-dwelling subjects with symptoms of potential SARS-CoV-2 infection. EClinicalMedicine 2020. Available online: https://www.thelancet.com/journals/eclinm/article/PIIS2589-5370(20)30421-1/abstract (accessed on 13 December 2020).
- Bernheim, A.; Mei, X.; Huang, M.; Yang, Y.; Fayad, Z.; Zhang, N.; Diao, K.; Lin, B.; Zhu, X.; Li, K.; et al. Chest CT Findings in Coronavirus Disease-19 (COVID-19): Relationship to Duration of Infection. Radiology 2020, 295, 200463. [Google Scholar] [CrossRef] [Green Version]
- Lin, L.; Fu, G.; Chen, S.; Tao, J.; Qian, A.; Yang, Y.; Wang, M. CT Manifestations of Coronavirus Disease (COVID-19) Pneumonia and Influenza Virus Pneumonia: A Comparative Study. Am. J. Roentgenol. 2020, 216, 1–9. [Google Scholar] [CrossRef]
- Bai, H.X.; Hsieh, B.; Xiong, Z.; Halsey, K.; Choi, J.W.; Tran, T.M.L.; Pan, I.; Shi, L.-B.; Wang, D.-C.; Mei, J.; et al. Performance of Radiologists in Differentiating COVID-19 from Non-COVID-19 Viral Pneumonia at Chest CT. Radiology 2020, 296, 200823. [Google Scholar] [CrossRef]


| Study cohort—CTs [n] | 353 | ||
|---|---|---|---|
| Study cohort—Patients [n] | 297 | ||
| COVID-19 | Influenza | Non-COVID-19-Non-Influenza | |
| CTs [n] | 86 | 132 | 135 |
| No contrast media applied [n (%)] | 63 (73.3%) | 98 (74.2%) | 89 (65.9%) |
| Constrast media applied [n (%)] | 23 (26.7%) | 34 (25.8%) | 46 (34.1%) |
| Slice thickness [mean (range)] | 1.6 mm (0.625–3 mm) | 1.6 mm (0.625–3 mm) | 1.5 mm (0.625–3 mm) |
| Radiologist’s reading | |||
| Pneumonia [n (%)] | 78 (90.7%) | 65 (49.2%) | 62 (45.9%) |
| Affected lung parenchyma [mean %] | 34.4 ± 23.1% *** vs. NCNI | 27.0 ± 23.5% | 21.1 ± 18.8% |
| COVID19-Reading-Score 0 [n] | 5 | 40 | 45 |
| COVID19-Reading-Score 1 [n] | 18 | 19 | 16 |
| COVID19-Reading-Score 2 [n] | 55 | 6 | 1 |
| Influenza-Reading-Score 0 [n] | 25 | 19 | 21 |
| Influenza-Reading-Score 1 [n] | 46 | 31 | 35 |
| Influenza-Reading-Score 2 [n] | 7 | 15 | 6 |
| Bacteria-Reading-Score 0 [n] | 64 | 28 | 18 |
| Bacteria-Reading-Score 1 [n] | 11 | 17 | 14 |
| Bacteria-Reading-Score 2 [n] | 3 | 20 | 29 |
| Mycotic-Reading-Score 0 [n] | 76 | 49 | 37 |
| Mycotic-Reading-Score 1 [n] | 0 | 18 | 17 |
| Mycotic-Reading-Score 2 [n] | 2 | 7 | 8 |
| Patients [n] | 69 | 110 | 118 |
| Age [mean ± SD] | 61.3 ± 15.9 | 59.6 ± 16.0 | 61.6 ± 18.6 |
| Male sex [n (%)] | 47 (68.1%) | 58 (52.7%) | 71 (60.2%) |
| Pneumonia [n (%)] | 61 (88.4%) | 61 (55.5%) | 49 (41.5%) |
| Age [mean ± SD] | 63.0 ± 15.3 | 58.6 ± 18.2 | 62.4 ± 18.2 |
| Male sex [n (%)] | 45 (73.8%) | 37 (60.7%) | 34 (69.4%) |
| Outpatient w pneumonia [n (%)] | 1 (1.6%) | 2 (3.3%) | 5 (10.2%) |
| Hospitalized w pneumonia [n (%)] | 60 (98.4%) | 59 (96.7%) | 39 (89.8%) |
| ICU admission [n (%)] | 18 (30.0%) | 17 (27.9%) | 12 (24.5%) |
| Mortality [n (%)] | 4 (6.7%) | 12 (19.7%) | 3 (6.1%) |
| Lab (related to initial CT scan) | |||
| CRP [mg/dL] | 7.5 ± 6.9 | 12.6 ± 11.1 ** vs. both subgroups | 7.5 ± 7.7 |
| Leucocytes [G/L] | 7.6 ± 4.1 | 7.4 ± 7.2 | 10.3 ±4.4 ** vs. COVID19 * vs. Influenza |
| LDH | 386 ± 207 | 352 ± 184 | 314 ± 122 * vs. COVID19 |
| COVID19 vs. Non-COVID-Non-Influenza | ||||||||||
| Reading Score Positive for COVID19 | Follow-Up CTs Included | n | Prevalence COVID-19 (RT-PCR) | % Correct Classified | Sensitivity | Specificity | PPV | NPV | FPR | FNR |
| 1 + 2 | Yes | 140 | 0.56 | 0.84 (0.78–0.90) | 0.94 (0.86–0.98) | 0.73 (0.60–0.82) | 0.81 (0.73–0.89) | 0.90 (0.82–0.98) | 0.27 (0.17–0.38) | 0.06 (0.01–0.12) |
| 2 | Yes | 140 | 0.56 | 0.83 (0.77–0.89) | 0.71 (0.60–0.80) | 0.98 (0.90–1.00) | 0.98 (0.95–1.00) | 0.73 (0.63–0.82) | 0.02 (0.00–0.05) | 0.30 (0.20–0.39) |
| 1 + 2 | No | 110 | 0.56 | 0.84 (0.77–0.91) | 0.93 (0.84–0.98) | 0.71 (0.58–0.82) | 0.80 (0.71–0.90) | 0.90 (0.80–0.99) | 0.29 (0.16–0.41) | 0.07 (0.01–0.13) |
| 2 | No | 110 | 0.56 | 0.85 (0.78–0.91) | 0.74 (0.61–0.83) | 0.98 (0.88–1.00) | 0.98 (0.94–1.00) | 0.75 (0.64–0.86) | 0.02 (0.00–0.06) | 0.26 (0.16–0.37) |
| COVID19 vs. Influenza | ||||||||||
| Reading Score Positive for COVID19 | Follow-Up CTs Included | n | Prevalence COVID-19 (RT-PCR) | % Correct Classified | Sensitivity | Specificity | PPV | NPV | FPR | FNR |
| 1 + 2 | Yes | 143 | 0.55 | 0.79 (0.72–0.86) | 0.94 (0.85–0.98) | 0.62 (0.49–0.72) | 0.75 (0.66–0.83) | 0.89 (0.80–0.98) | 0.39 (0.27–0.50) | 0.06 (0.01–0.12) |
| 2 | Yes | 143 | 0.55 | 0.80 (0.73–0.86) | 0.71 (0.60–0.80) | 0.91 (0.81–0.96) | 0.90 (0.83–0.98) | 0.72 (0.62–0.82) | 0.09 (0.02–0.16) | 0.30 (0.20–0.39) |
| 1 + 2 | No | 122 | 0.50 | 0.80 (0.72–0.87) | 0.93 (0.84–0.98) | 0.66 (0.53–0.76) | 0.73 (0.63–0.83) | 0.91 (0.82–0.99) | 0.34 (0.23–0.46) | 0.07 (0.01–0.13) |
| 2 | No | 122 | 0.50 | 0.82 (0.75–0.89) | 0.74 (0.61–0.83) | 0.90 (0.80–0.96) | 0.88 (0.79–0.97) | 0.78 (0.68–0.87) | 0.10 (0.03–0.17) | 0.26 (0.16–0.37) |
| Influenza vs. Non-COVID19-Non-Influenza | ||||||||||
| Reading Score Positive for Influenza | Follow-Up CTs Included | n | Prevalence Influenza (RT-PCR) | % Correct Classified | Sensitivity | Specificity | PPV | NPV | FPR | FNR |
| 1 + 2 | Yes | 127 | 0.51 | 0.53 (0.44–0.61) | 0.71 (0.59–0.80) | 0.34 (0.23–0.46) | 0.53 (0.42–0.63) | 0.53 (0.37–0.68) | 0.66 (0.55–0.78) | 0.29 (0.19–0.40) |
| 2 | Yes | 127 | 0.51 | 0.56 (0.47–0.65) | 0.23 (0.15–0.35) | 0.90 (0.80–0.96) | 0.71 (0.52–0.91) | 0.53 (0.43–0.62) | 0.10 (0.03–0.17) | 0.77 (0.67–0.87) |
| 1 + 2 | No | 110 | 0.56 | 0.54 (0.44–0.63) | 0.69 (0.56–0.79) | 0.38 (0.23–0.49) | 0.57 (0.46–0.68) | 0.47 (0.31–0.64) | 0.65 (0.53–0.78) | 0.31 (0.20–0.42) |
| 2 | No | 110 | 0.56 | 0.52 (0.43–0.61) | 0.21 (0.13–0.33) | 0.90 (0.78–0.96) | 0.72 (0.52–0.93) | 0.48 (0.38–0.58) | 0.10 (0.02–0.18) | 0.79 (0.69–0.89) |
| Influenza vs. COVID19 | ||||||||||
| Reading Score Positive for Influenza | Follow-Up CTs Included | N | Prevalence Influenza (RT-PCR) | % Correct Classified | Sensitivity | Specificity | PPV | NPV | FPR | FNR |
| 1 + 2 | Yes | 143 | 0.46 | 0.50 (0.42–0.58) | 0.71 (0.59–0.80) | 0.32 (0.23–0.43) | 0.47 (0.37–0.56) | 0.57 (0.42–0.72) | 0.68 (0.58–0.78) | 0.29 (0.19–0.40) |
| 2 | Yes | 143 | 0.46 | 0.60 (0.52–0.68) | 0.23 (0.15–0.35) | 0.91 (0.82–0.96) | 0.68 (0.49–0.88) | 0.59 (0.50–0.68) | 0.09 (0.03–0.15) | 0.77 (0.67–0.87) |
| 1 + 2 | No | 122 | 0.50 | 0.52 (0.43–0.61) | 0.69 (0.56–0.79) | 0.34 (0.24–0.47) | 0.51 (0.40–0.62) | 0.53 (0.37–0.68) | 0.66 (0.54–0.77) | 0.31 (0.20–0.42) |
| 2 | No | 122 | 0.50 | 0.58 (0.49–0.67) | 0.21 (0.13–0.33) | 0.95 (0.86–0.99) | 0.81 (0.62–1.00) | 0.55 (0.45–0.64) | 0.05 (0.00–0.10) | 0.79 (0.69–0.89) |
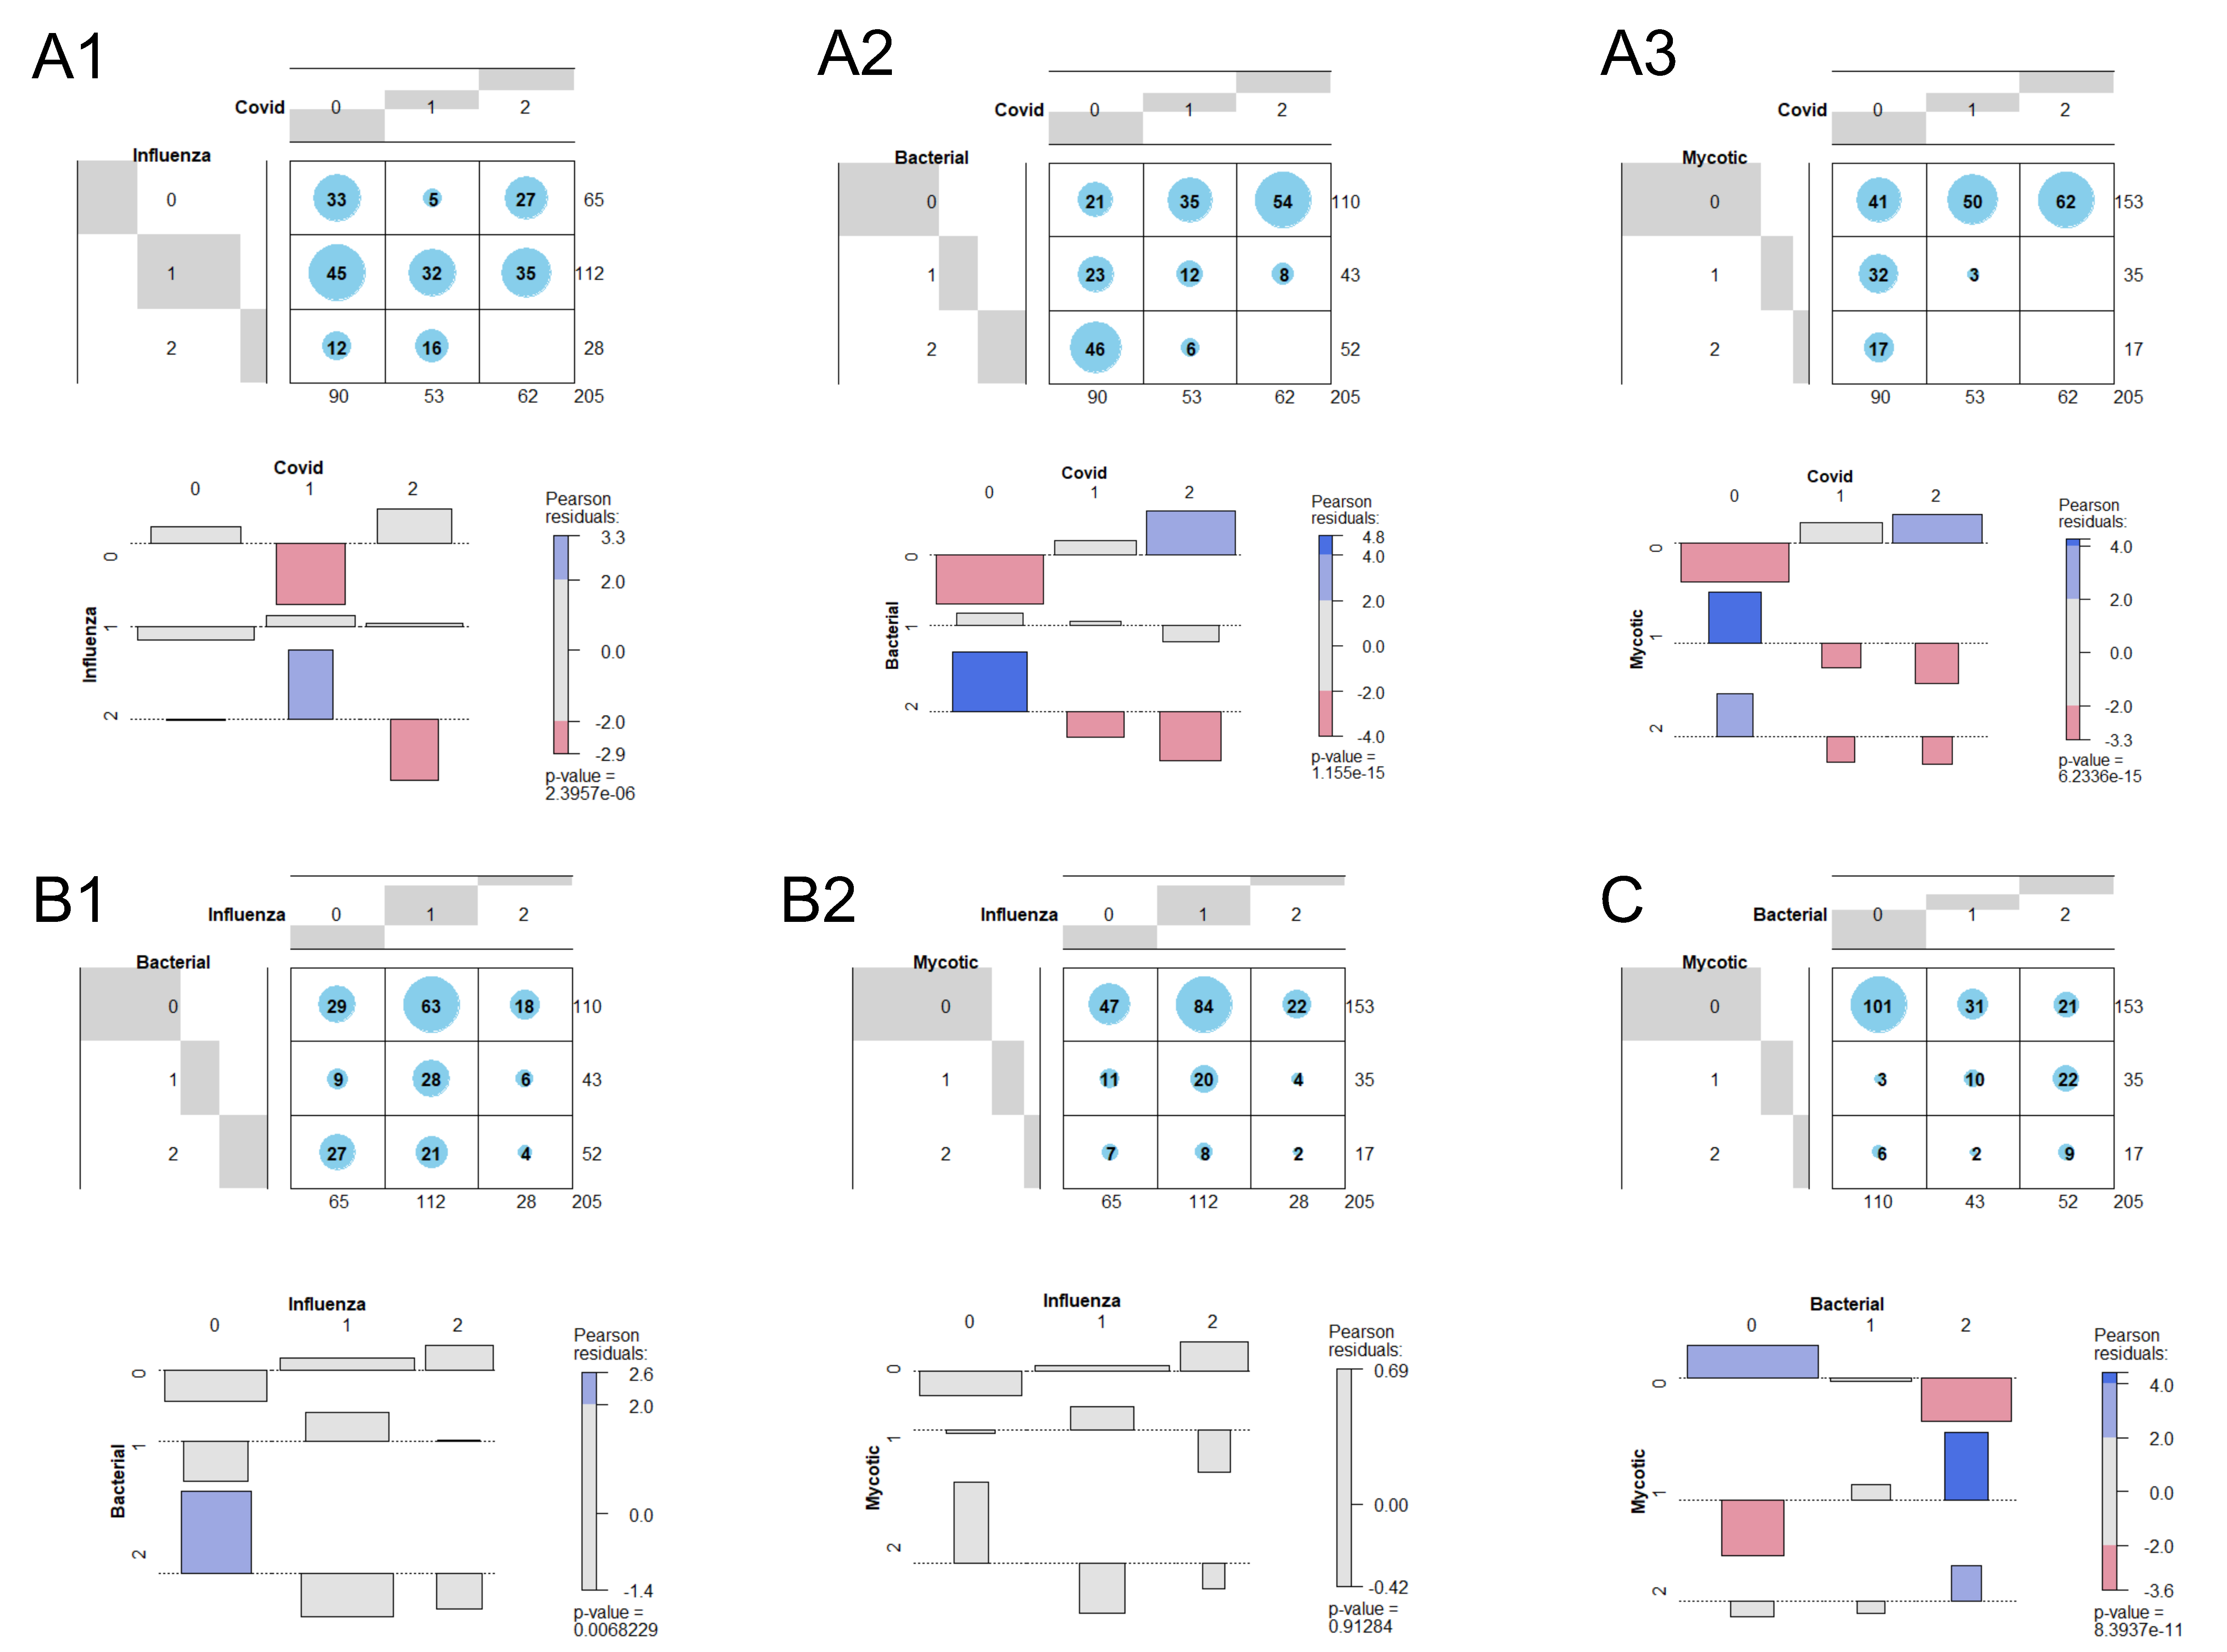
| Pearson’s Chi2 Test for Independence | ||||
|---|---|---|---|---|
| Combination | Chi2 Statistics | df | p-Value | Corr. p-Value |
| COVID vs. Influenza | 31.52173 | 4 | 0.000002 | 0.000014 |
| COVID vs. Bacterial | 76.11953 | 4 | 0.000000 | 0.000000 |
| COVID vs. Mycotic | 72.65716 | 4 | 0.000000 | 0.000000 |
| Influenza vs. Bacterial | 14.15284 | 4 | 0.006823 | 0.040937 |
| Influenza vs. Mycotic | 0.97985 | 4 | 0.912836 | 1.000000 |
| Bacterial vs. Mycotic | 53.03143 | 4 | 0.000000 | 0.000000 |
Publisher’s Note: MDPI stays neutral with regard to jurisdictional claims in published maps and institutional affiliations. |
© 2020 by the authors. Licensee MDPI, Basel, Switzerland. This article is an open access article distributed under the terms and conditions of the Creative Commons Attribution (CC BY) license (http://creativecommons.org/licenses/by/4.0/).
Share and Cite
Rueckel, J.; Fink, N.; Kaestle, S.; Stüber, T.; Schwarze, V.; Gresser, E.; Hoppe, B.F.; Rudolph, J.; Kunz, W.G.; Ricke, J.; et al. COVID-19 Pandemic and Upcoming Influenza Season—Does an Expert’s Computed Tomography Assessment Differentially Identify COVID-19, Influenza and Pneumonias of Other Origin? J. Clin. Med. 2021, 10, 84. https://0-doi-org.brum.beds.ac.uk/10.3390/jcm10010084
Rueckel J, Fink N, Kaestle S, Stüber T, Schwarze V, Gresser E, Hoppe BF, Rudolph J, Kunz WG, Ricke J, et al. COVID-19 Pandemic and Upcoming Influenza Season—Does an Expert’s Computed Tomography Assessment Differentially Identify COVID-19, Influenza and Pneumonias of Other Origin? Journal of Clinical Medicine. 2021; 10(1):84. https://0-doi-org.brum.beds.ac.uk/10.3390/jcm10010084
Chicago/Turabian StyleRueckel, Johannes, Nicola Fink, Sophia Kaestle, Theresa Stüber, Vincent Schwarze, Eva Gresser, Boj F. Hoppe, Jan Rudolph, Wolfgang G. Kunz, Jens Ricke, and et al. 2021. "COVID-19 Pandemic and Upcoming Influenza Season—Does an Expert’s Computed Tomography Assessment Differentially Identify COVID-19, Influenza and Pneumonias of Other Origin?" Journal of Clinical Medicine 10, no. 1: 84. https://0-doi-org.brum.beds.ac.uk/10.3390/jcm10010084