
Serum C18:1-Cer as a Potential Biomarker for Early Detection of Gestational Diabetes

 and
and
Abstract
:1. Introduction
2. Materials and Methods
2.1. Study Population
2.2. Diabetic Parameters
2.3. Sphingolipid Measurements
2.4. Statistical Analysis
3. Results
3.1. Characteristics of the Studied Groups
3.2. Sphingolipids Profile
4. Discussion
Author Contributions
Funding
Institutional Review Board Statement
Informed Consent Statement
Data Availability Statement
Conflicts of Interest
References
- Plows, J.F.; Stanley, J.L.; Baker, P.N.; Reynolds, C.M.; Vickers, M.H. The Pathophysiology of Gestational Diabetes Mellitus. Int. J. Mol. Sci. 2018, 19, 3342. [Google Scholar] [CrossRef] [PubMed] [Green Version]
- Dirar, A.M.; Doupis, J. Gestational Diabetes from A to Z. World J. Diabetes 2017, 8, 489–511. [Google Scholar] [CrossRef]
- Catalano, P.M.; Tyzbir, E.D.; Roman, N.M.; Amini, S.B.; Sims, E.A. Longitudinal Changes in Insulin Release and Insulin Resistance in Nonobese Pregnant Women. Am. J. Obstet. Gynecol. 1991, 165, 1667–1672. [Google Scholar] [CrossRef]
- Catalano, P.M.; Tyzbir, E.D.; Wolfe, R.R.; Roman, N.M.; Amini, S.B.; Sims, E.A. Longitudinal Changes in Basal Hepatic Glucose Production and Suppression during Insulin Infusion in Normal Pregnant Women. Am. J. Obstet. Gynecol. 1992, 167, 913–919. [Google Scholar] [CrossRef]
- Herrera, E.; Ortega-Senovilla, H. Disturbances in Lipid Metabolism in Diabetic Pregnancy—Are These the Cause of the Problem? Best Pract. Res. Clin. Endocrinol. Metab. 2010, 24, 515–525. [Google Scholar] [CrossRef] [PubMed]
- Herrera, E.; Lasunción, M.A.; Gomez-Coronado, D.; Aranda, P.; López-Luna, P.; Maier, I. Role of Lipoprotein Lipase Activity on Lipoprotein Metabolism and the Fate of Circulating Triglycerides in Pregnancy. Am. J. Obstet. Gynecol. 1988, 158, 1575–1583. [Google Scholar] [CrossRef]
- Ryckman, K.K.; Spracklen, C.N.; Smith, C.J.; Robinson, J.G.; Saftlas, A.F. Maternal Lipid Levels during Pregnancy and Gestational Diabetes: A Systematic Review and Meta-Analysis. BJOG 2015, 122, 643–651. [Google Scholar] [CrossRef] [PubMed]
- Meikle, P.J.; Summers, S.A. Sphingolipids and Phospholipids in Insulin Resistance and Related Metabolic Disorders. Nat. Rev. Endocrinol. 2017, 13, 79–91. [Google Scholar] [CrossRef]
- Khan, S.R.; Mohan, H.; Liu, Y.; Batchuluun, B.; Gohil, H.; Al Rijjal, D.; Manialawy, Y.; Cox, B.J.; Gunderson, E.P.; Wheeler, M.B. The Discovery of Novel Predictive Biomarkers and Early-Stage Pathophysiology for the Transition from Gestational Diabetes to Type 2 Diabetes. Diabetologia 2019, 62, 687–703. [Google Scholar] [CrossRef] [Green Version]
- Furse, S.; White, S.L.; Meek, C.L.; Jenkins, B.; Petry, C.J.; Vieira, M.C.; Ozanne, S.E.; Dunger, D.B.; Poston, L.; Koulman, A. Altered Triglyceride and Phospholipid Metabolism Predates the Diagnosis of Gestational Diabetes in Obese Pregnancy. Mol. Omics 2019, 15, 420–430. [Google Scholar] [CrossRef]
- MacRae, V.E.; Burdon, T.; Ahmed, S.F.; Farquharson, C. Ceramide Inhibition of Chondrocyte Proliferation and Bone Growth Is IGF-I Independent. J. Endocrinol. 2006, 191, 369–377. [Google Scholar] [CrossRef] [Green Version]
- Oh, H.L.; Seok, J.Y.; Kwon, C.H.; Kang, S.K.; Kim, Y.K. Role of MAPK in Ceramide-Induced Cell Death in Primary Cultured Astrocytes from Mouse Embryonic Brain. Neurotoxicology 2006, 27, 31–38. [Google Scholar] [CrossRef]
- Summers, S.A. Ceramides in Insulin Resistance and Lipotoxicity. Prog. Lipid. Res. 2006, 45, 42–72. [Google Scholar] [CrossRef]
- Reali, F.; Morine, M.J.; Kahramanoğulları, O.; Raichur, S.; Schneider, H.-C.; Crowther, D.; Priami, C. Mechanistic Interplay between Ceramide and Insulin Resistance. Sci. Rep. 2017, 7, 41231. [Google Scholar] [CrossRef]
- Petersen, M.C.; Shulman, G.I. Roles of Diacylglycerols and Ceramides in Hepatic Insulin Resistance. Trends Pharmacol. Sci. 2017, 38, 649–665. [Google Scholar] [CrossRef]
- Summers, S.A.; Garza, L.A.; Zhou, H.; Birnbaum, M.J. Regulation of Insulin-Stimulated Glucose Transporter GLUT4 Translocation and Akt Kinase Activity by Ceramide. Mol. Cell. Biol. 1998, 18, 5457–5464. [Google Scholar] [CrossRef] [Green Version]
- Samad, F.; Hester, K.D.; Yang, G.; Hannun, Y.A.; Bielawski, J. Altered Adipose and Plasma Sphingolipid Metabolism in Obesity: A Potential Mechanism for Cardiovascular and Metabolic Risk. Diabetes 2006, 55, 2579–2587. [Google Scholar] [CrossRef] [PubMed] [Green Version]
- Obinata, H.; Hla, T. Sphingosine 1-Phosphate and Inflammation. Int. Immunol. 2019, 31, 617–625. [Google Scholar] [CrossRef] [PubMed]
- Diagnostic Criteria and Classification of Hyperglycaemia First Detected in Pregnancy: A World Health Organization Guideline. Diabetes Res. Clin. Pract. 2014, 103, 341–363. [CrossRef] [PubMed]
- Matsuda, M.; DeFronzo, R.A. Insulin Sensitivity Indices Obtained from Oral Glucose Tolerance Testing: Comparison with the Euglycemic Insulin Clamp. Diabetes Care 1999, 22, 1462–1470. [Google Scholar] [CrossRef]
- Blachnio-Zabielska, A.U.; Persson, X.-M.T.; Koutsari, C.; Zabielski, P.; Jensen, M.D. A Liquid Chromatography/Tandem Mass Spectrometry Method for Measuring the in Vivo Incorporation of Plasma Free Fatty Acids into Intramyocellular Ceramides in Humans. Rapid Commun. Mass Spectrom. 2012, 26, 1134–1140. [Google Scholar] [CrossRef] [Green Version]
- Pridjian, G.; Benjamin, T.D. Update on Gestational Diabetes. Obstet. Gynecol. Clin. N. Am. 2010, 37, 255–267. [Google Scholar] [CrossRef]
- Haus, J.M.; Kashyap, S.R.; Kasumov, T.; Zhang, R.; Kelly, K.R.; DeFronzo, R.A.; Kirwan, J.P. Plasma Ceramides Are Elevated in Obese Subjects with Type 2 Diabetes and Correlate with the Severity of Insulin Resistance. Diabetes 2009, 58, 337–343. [Google Scholar] [CrossRef] [Green Version]
- Bhavadharini, B.; Uma, R.; Saravanan, P.; Mohan, V. Screening and Diagnosis of Gestational Diabetes Mellitus—Relevance to Low and Middle Income Countries. Clin. Diabetes Endocrinol. 2016, 2, 13. [Google Scholar] [CrossRef] [Green Version]
- Codina, M.; Corcoy, R.; Goya, M.M. Actualización Urgente: Alternativa Temporal Para El Diagnóstico de Hiper-Glucemia Gestacional y El Seguimiento de Estas Mujeres y Aquellas Con Diabetes Pregestacional Durante La Pandemia COVID-19. Consenso Del Grupo Español de Diabetes y Embarazo (GEDE) de La Sociedad Española de Diabetes (SED) y La Sociedad Española de Ginecología y Obstetricia (SEGO). Endocrinol. Diabetes Nutr. 2020, 67, 545–552. [Google Scholar] [CrossRef]
- Fernández, S.C.; Martínez, M.M.; De Francisco Montero, C.; Rodríguez, I.G.; Arenas, Á.V.; Calvo, M.O. Predictive models of gestational diabetes, a new prediction mode. Semergen 2021, 47, 515–520. [Google Scholar] [CrossRef]
- IDF Diabetes Atlas. 2021. Available online: www.diabetesatlas.org (accessed on 6 December 2021).
- Hansen, M.E.; Tippetts, T.S.; Anderson, M.C.; Holub, Z.E.; Moulton, E.R.; Swensen, A.C.; Prince, J.T.; Bikman, B.T. Insulin Increases Ceramide Synthesis in Skeletal Muscle. J. Diabetes Res. 2014, 2014, 765784. [Google Scholar] [CrossRef] [Green Version]
- Turpin, S.M.; Nicholls, H.T.; Willmes, D.M.; Mourier, A.; Brodesser, S.; Wunderlich, C.M.; Mauer, J.; Xu, E.; Hammerschmidt, P.; Brönneke, H.S.; et al. Obesity-Induced CerS6-Dependent C16:0 Ceramide Production Promotes Weight Gain and Glucose Intolerance. Cell Metab. 2014, 20, 678–686. [Google Scholar] [CrossRef] [Green Version]
- Raichur, S.; Brunner, B.; Bielohuby, M.; Hansen, G.; Pfenninger, A.; Wang, B.; Bruning, J.C.; Larsen, P.J.; Tennagels, N. The Role of C16:0 Ceramide in the Development of Obesity and Type 2 Diabetes: CerS6 Inhibition as a Novel Therapeutic Approach. Mol. Metab. 2019, 21, 36–50. [Google Scholar] [CrossRef]
- Fretts, A.M.; Jensen, P.N.; Hoofnagle, A.; McKnight, B.; Howard, B.V.; Umans, J.; Yu, C.; Sitlani, C.; Siscovick, D.S.; King, I.B.; et al. Plasma Ceramide Species Are Associated with Diabetes Risk in Participants of the Strong Heart Study. J. Nutr. 2020, 150, 1214–1222. [Google Scholar] [CrossRef]
- Kayser, B.D.; Prifti, E.; Lhomme, M.; Belda, E.; Dao, M.-C.; Aron-Wisnewsky, J.; Kontush, A.; Zucker, J.-D.; Rizkalla, S.W.; Dugail, I.; et al. Elevated Serum Ceramides Are Linked with Obesity-Associated Gut Dysbiosis and Impaired Glucose Metabolism. Metabolomics 2019, 15, 140. [Google Scholar] [CrossRef]
- Soma-Pillay, P.; Catherine, N.-P.; Tolppanen, H.; Mebazaa, A.; Tolppanen, H.; Mebazaa, A. Physiological Changes in Pregnancy. Cardiovasc. J. Afr. 2016, 27, 89–94. [Google Scholar] [CrossRef] [Green Version]
- Holland, W.L.; Miller, R.A.; Wang, Z.V.; Sun, K.; Barth, B.M.; Bui, H.H.; Davis, K.E.; Bikman, B.T.; Halberg, N.; Rutkowski, J.M.; et al. The Pleiotropic Actions of Adiponectin Are Initiated via Receptor-Mediated Activation of Ceramidase Activity. Nat. Med. 2011, 17, 55–63. [Google Scholar] [CrossRef] [Green Version]
- Vasiliauskaité-Brooks, I.; Sounier, R.; Rochaix, P.; Bellot, G.; Fortier, M.; Hoh, F.; De Colibus, L.; Bechara, C.; Saied, E.M.; Arenz, C.; et al. Structural Insights into Adiponectin Receptors Suggest Ceramidase Activity. Nature 2017, 544, 120–123. [Google Scholar] [CrossRef] [Green Version]
- de Gennaro, G.; Palla, G.; Battini, L.; Simoncini, T.; Del Prato, S.; Bertolotto, A.; Bianchi, C. The Role of Adipokines in the Pathogenesis of Gestational Diabetes Mellitus. Gynecol. Endocrinol. 2019, 35, 737–751. [Google Scholar] [CrossRef]
- Hla, T.; Dannenberg, A.J. Sphingolipid Signaling in Metabolic Disorders. Cell Metab. 2012, 16, 420–434. [Google Scholar] [CrossRef] [Green Version]
- Frej, C.; Mendez, A.J.; Ruiz, M.; Castillo, M.; Hughes, T.A.; Dahlbäck, B.; Goldberg, R.B. A Shift in ApoM/S1P Between HDL-Particles in Women with Type 1 Diabetes Mellitus Is Associated with Impaired Anti-Inflammatory Effects of the ApoM/S1P Complex. Arter. Thromb. Vasc. Biol. 2017, 37, 1194–1205. [Google Scholar] [CrossRef] [Green Version]
- Del Gaudio, I.; Sreckovic, I.; Zardoya-Laguardia, P.; Bernhart, E.; Christoffersen, C.; Frank, S.; Marsche, G.; Illanes, S.E.; Wadsack, C. Circulating Cord Blood HDL-S1P Complex Preserves the Integrity of the Feto-Placental Vasculature. Biochim. Biophys. Acta Mol. Cell Biol. Lipids 2020, 1865, 158632. [Google Scholar] [CrossRef]
- Kurano, M.; Tsukamoto, K.; Shimizu, T.; Kassai, H.; Nakao, K.; Aiba, A.; Hara, M.; Yatomi, Y. Protection Against Insulin Resistance by Apolipoprotein M/Sphingosine-1-Phosphate. Diabetes 2020, 69, 867–881. [Google Scholar] [CrossRef]
- Stanford, J.C.; Morris, A.J.; Sunkara, M.; Popa, G.J.; Larson, K.L.; Özcan, S. Sphingosine 1-Phosphate (S1P) Regulates Glucose-Stimulated Insulin Secretion in Pancreatic Beta Cells. J. Biol. Chem. 2012, 287, 13457–13464. [Google Scholar] [CrossRef] [Green Version]
- Liu, Z.; Yang, H.; Zhi, L.; Xue, H.; Lu, Z.; Zhao, Y.; Cui, L.; Liu, T.; Ren, S.; He, P.; et al. Sphingosine 1-Phosphate Stimulates Insulin Secretion and Improves Cell Survival by Blocking Voltage-Dependent K+ Channels in β Cells. Front. Pharmacol. 2021, 12, 683674. [Google Scholar] [CrossRef]
- Górska, M.; Dobrzyń, A.; Baranowski, M. Concentrations of Sphingosine and Sphinganine in Plasma of Patients with Type 2 Diabetes. Med. Sci. Monit. 2005, 11, CR35–CR38. [Google Scholar]
- Straczkowski, M.; Kowalska, I.; Nikolajuk, A.; Dzienis-Straczkowska, S.; Kinalska, I.; Baranowski, M.; Zendzian-Piotrowska, M.; Brzezinska, Z.; Gorski, J. Relationship Between Insulin Sensitivity and Sphingomyelin Signaling Pathway in Human Skeletal Muscle. Diabetes 2004, 53, 1215–1221. [Google Scholar] [CrossRef] [PubMed] [Green Version]
- Tidhar, R.; Futerman, A.H. The Complexity of Sphingolipid Biosynthesis in the Endoplasmic Reticulum. Biochim. Biophys. Acta 2013, 1833, 2511–2518. [Google Scholar] [CrossRef] [Green Version]
- Liu, J.; Li, J.; Yang, K.; Leng, J.; Li, W.; Yang, W.; Huo, X.; Yu, Z.; Cw Ma, R.; Hu, G.; et al. Ceramides and Their Interactive Effects with Trimethylamine-N-Oxide Metabolites on Risk of Gestational Diabetes: A Nested Case-Control Study. Diabetes Res. Clin. Pract. 2021, 171, 108606. [Google Scholar] [CrossRef] [PubMed]
- Mathews, A.T.; Famodu, O.A.; Olfert, M.D.; Murray, P.J.; Cuff, C.F.; Downes, M.T.; Haughey, N.J.; Colby, S.E.; Chantler, P.D.; Olfert, I.M.; et al. Efficacy of Nutritional Interventions to Lower Circulating Ceramides in Young Adults: FRUVEDomic Pilot Study. Physiol. Rep. 2017, 5, e13329. [Google Scholar] [CrossRef] [PubMed]


| Control | NGT | GDM (Pre-Conversion) | p-Value | |
|---|---|---|---|---|
| n | 37 | 82 | 53 | |
| Age (years) | 26 (23–31) | 28 (24–32) | 25.5 (24–30) | 0.4 ° 0.81 * |
| Gestational age (week) | 11 (10–12) | 11 (10–11) | 0.19 * | |
| Prepregnancy BMI (kg/m2) | 21.9 (20.6–23.4) | 20.9 (19.8–28.5) | 24.1 (21.6–26.8) | 0.42 ° 0.87 * |
| Current BMI (kg/m2) | 24.5 (20.4–29.8) | 24.8 (22.0–26.7) | 0.95 * | |
| Fasting glucose (mg/dL) | 90 (86–92) | 86 (84–88) | 87 (84.5–89.5) | 0.0005 ° 0.19 * |
| Fasting insulin (µU/mL) | 7.5 (5.2–10.7) | 11.6 (8.9–14.7) | 11.3 (10.1–13.3) | <0.0001 ° 0.83 * |
| HOMA–IR | 1.6 (1.1–2.4) | 2.4 (1.8–3.2) | 2.5 (2.1–2.9) | 0.0002 ° 0.89 * |
| HOMA–β | 101.1 (67.3–149) | 176.9 (151.9–226.8) | 173.7 (155.7–220.0) | <0.0001 ° 0.82 * |
| HbA1c (%) | 5.2 (5.0–5.4) | 5.0 (4.9–5.3) | 5.1 (4.9–5.4) | 0.2 ° 0.31 * |
| Total cholesterol (mmol/L) | 166 (158–182) | 174 (150–202) | 172 (156.5–187) | 0.64 ° 0.64 * |
| HDL-cholesterol (mmol/L) | 86 (69.6–102.8) | 73 (63–88) | 72.5 (59.5–80.5) | 0.01 ° 0.49 * |
| LDL-cholesterol (mmol/L) | 64 (53–83) | 78 (63.4–96.6) | 87.6 (69.3–95.5) | 0.03 ° 0.79 * |
| Triglycerides (mmol/L) | 69 (59–75) | 87 (65–116) | 84.5 (64.5–125.5) | 0.0009 ° 0.92 * |
| NGT | GDM | p–Value | |
|---|---|---|---|
| n | 82 | 53 | |
| Gestational age (week) | 25 (24–26) | 25.5 (24–26) | 0.41 |
| Current BMI (kg/m2) | 26.17 (22.6–31.8) | 27.8 (23.7–29.7) | 0.76 |
| Fasting glucose (mg/dL) | 83 (80–86) | 94 (89–97) | <0.0001 |
| Glucose 30’ (mg/dL) | 127 (117–139) | 157.5 (139.5–166) | <0.0001 |
| Glucose 60’ (mg/dL) | 121.5 (103–139) | 164 (129.5–184) | <0.0001 |
| Glucose 120’ (mg/dL) | 108 (89–121) | 124 (113–157) | <0.0001 |
| Fasting insulin (µU/mL) | 11.1 (9.2–14.2) | 15.9 (12.8–20.5) | <0.0001 |
| Insulin 30’ (µU/mL) | 77.9 (56.2–115.1) | 89.3 (61.1–137.3) | 0.18 |
| Insulin 60’ (µU/mL) | 72.3 (47.9–112.8) | 108.3 (91.1–152.4) | <0.0001 |
| Insulin 120’ (µU/mL) | 56.0 (35.2–78.0) | 104.8 (68.7–131) | <0.0001 |
| HOMA–IR | 2.3 (1.9–2.9) | 3.6 (2.8–4.7) | <0.0001 |
| HOMA–β | 223.2 (169.8–276.1) | 201.4 (154.4–244.3) | 0.13 |
| ISI OGTT | 4.3 (3.3–5.4) | 2.6 (2.1–3.4) | <0.0001 |
| HbA1c (%) | 4.8 (4.7–5.1) | 5.0 (4.8–5.2) | 0.006 |
| Total cholesterol (mmol/L) | 243 (219–276) | 233 (203–257) | 0.04 |
| HDL-cholesterol (mmol/L) | 86 (73–95) | 79 (65–93) | 0.13 |
| LDL-cholesterol (mmol/L) | 120.4 (95.6–149.2) | 119.2 (86.8–134.4) | 0.08 |
| Triglycerides (mmol/L) | 172 (133–196) | 179 (136–219) | 0.31 |
| Compound | Control Group | NGT | GDM Pre-Conversion | p-Value |
|---|---|---|---|---|
| Me (Q1–Q3) [ng/mL] | Me (Q1–Q3) [ng/mL] | Me (Q1–Q3) [ng/mL] | ||
| Sph | 23.4 (20.6–26.4) | 18.02 (13.3–31.7) | 17.2 (14.5–36.9) | * p = 0.73 ° p = 0.2 ᶺ p = 0.09 |
| SPA | 37.5 (34.2–43.8) | 13.89 (9.9–19.7) | 10.82 (8.0–20.2) | * p = 0.28 ° p < 0.0001 ᶺ p < 0.0001 |
| S1P | 400.93 (357.2–436.8) | 348.81 (251.4–403.4) | 296.78 (235.3–342.4) | * p = 0.06 ° p < 0.0001 ᶺ p < 0.0001 |
| C14:0 Cer | 30.56 (26.5–34.7) | 32.4 (25.6–42.9) | 29.6 (23.4–36.7) | * p = 0.22 ° p = 0.5 ᶺ p = 0.19 |
| C16:0 Cer | 135.68 (118.6–156.6) | 183.37 (151.3–246.6) | 178.01 (129.9–201.4) | * p = 0.49 ° p = 0.02 ᶺ p = 0.0002 |
| C18:1 Cer | 16.33 (14.3–18.5) | 20.72 (16.6–23.7) | 24.16 (20.1–29.5) | * p = 0.01 ° p < 0.0001 ᶺ p = 0.006 |
| C18:0 Cer | 127.75 (114.3–142.2) | 133.01 (108.4–160.5) | 132.87 (108.1–199.6) | * p = 0.57 ° p = 0.6 ᶺ p = 0.5 |
| C20:0 Cer | 183.56 (156.4–206.7) | 172.96 (130.1–194.2) | 152.08 (123.6–177.9) | * p = 0.25 ° p = 0.09 ᶺ p = 0.3 |
| C22:0 Cer | 215.53 (198.3–240.4) | 280.68 (243.5–317.7) | 316.04 (256.0–376.7) | * p = 0.1 ° p < 0.0001 ᶺ p < 0.0001 |
| C24:1 Cer | 219.88 (200.8–251.5) | 280.36 (237.9–336.5) | 278.96 (241.5–320.3) | * p = 0.92 ° p = 0.0001 ᶺ p < 0.0001 |
| C24:0 Cer | 1941.61 (1819.1–2306.9) | 2200.14 (2040.8–2608.7) | 2356.23 (2026.8–2917.9) | * p = 0.52 ° p = 0.03 ᶺ p = 0.003 |
| Cer Total | 3023.67 (2738.7–3225.9) | 3344.21 (3101.9–3682.7) | 3552.17 (3007.1–3923.5) | * p = 0.39 ° p = 0.0006 ᶺ p < 0.0001 |
| Compound | NGT | GDM Converters | ||||||
|---|---|---|---|---|---|---|---|---|
| 1st Trimester | 2nd Trimester | 1st Trimester | 2nd Trimester | |||||
| Me | Q1–Q3 | Me | Q1–Q3 | Me | Q1–Q3 | Me | Q1–Q3 | |
| Sph | 18.02 | 13.3–31.7 | 18.7 | 15.3–23.7 | 17.2 | 14.5–36.9 | 18.07 | 15.4–20.8 |
| SPA | 13.89 | 9.9–19.7 | 16.14 | 12.6–21.5 | 10.82 | 8.0–20.2 | 14.71 | 10.9–18.5 |
| S1P | 348.81 | 251.4–403.4 | 307.53 | 214.1–423.3 | 296.78 | 235.3–342.4 | 263.73 | 180.9–304.2 |
| C14:0 Cer | 32.4 | 25.6–42.9 | 35.87 | 23.9–42.6 | 29.6 | 23.4–36.7 | 35.47 | 27.8–43.4 |
| C16:0 Cer | 183.37 | 151.3–246.6 | 184.34 | 133.8–234.7 | 178.01 * | 129.9–201.4 | 214.38 * | 178.5–250.2 |
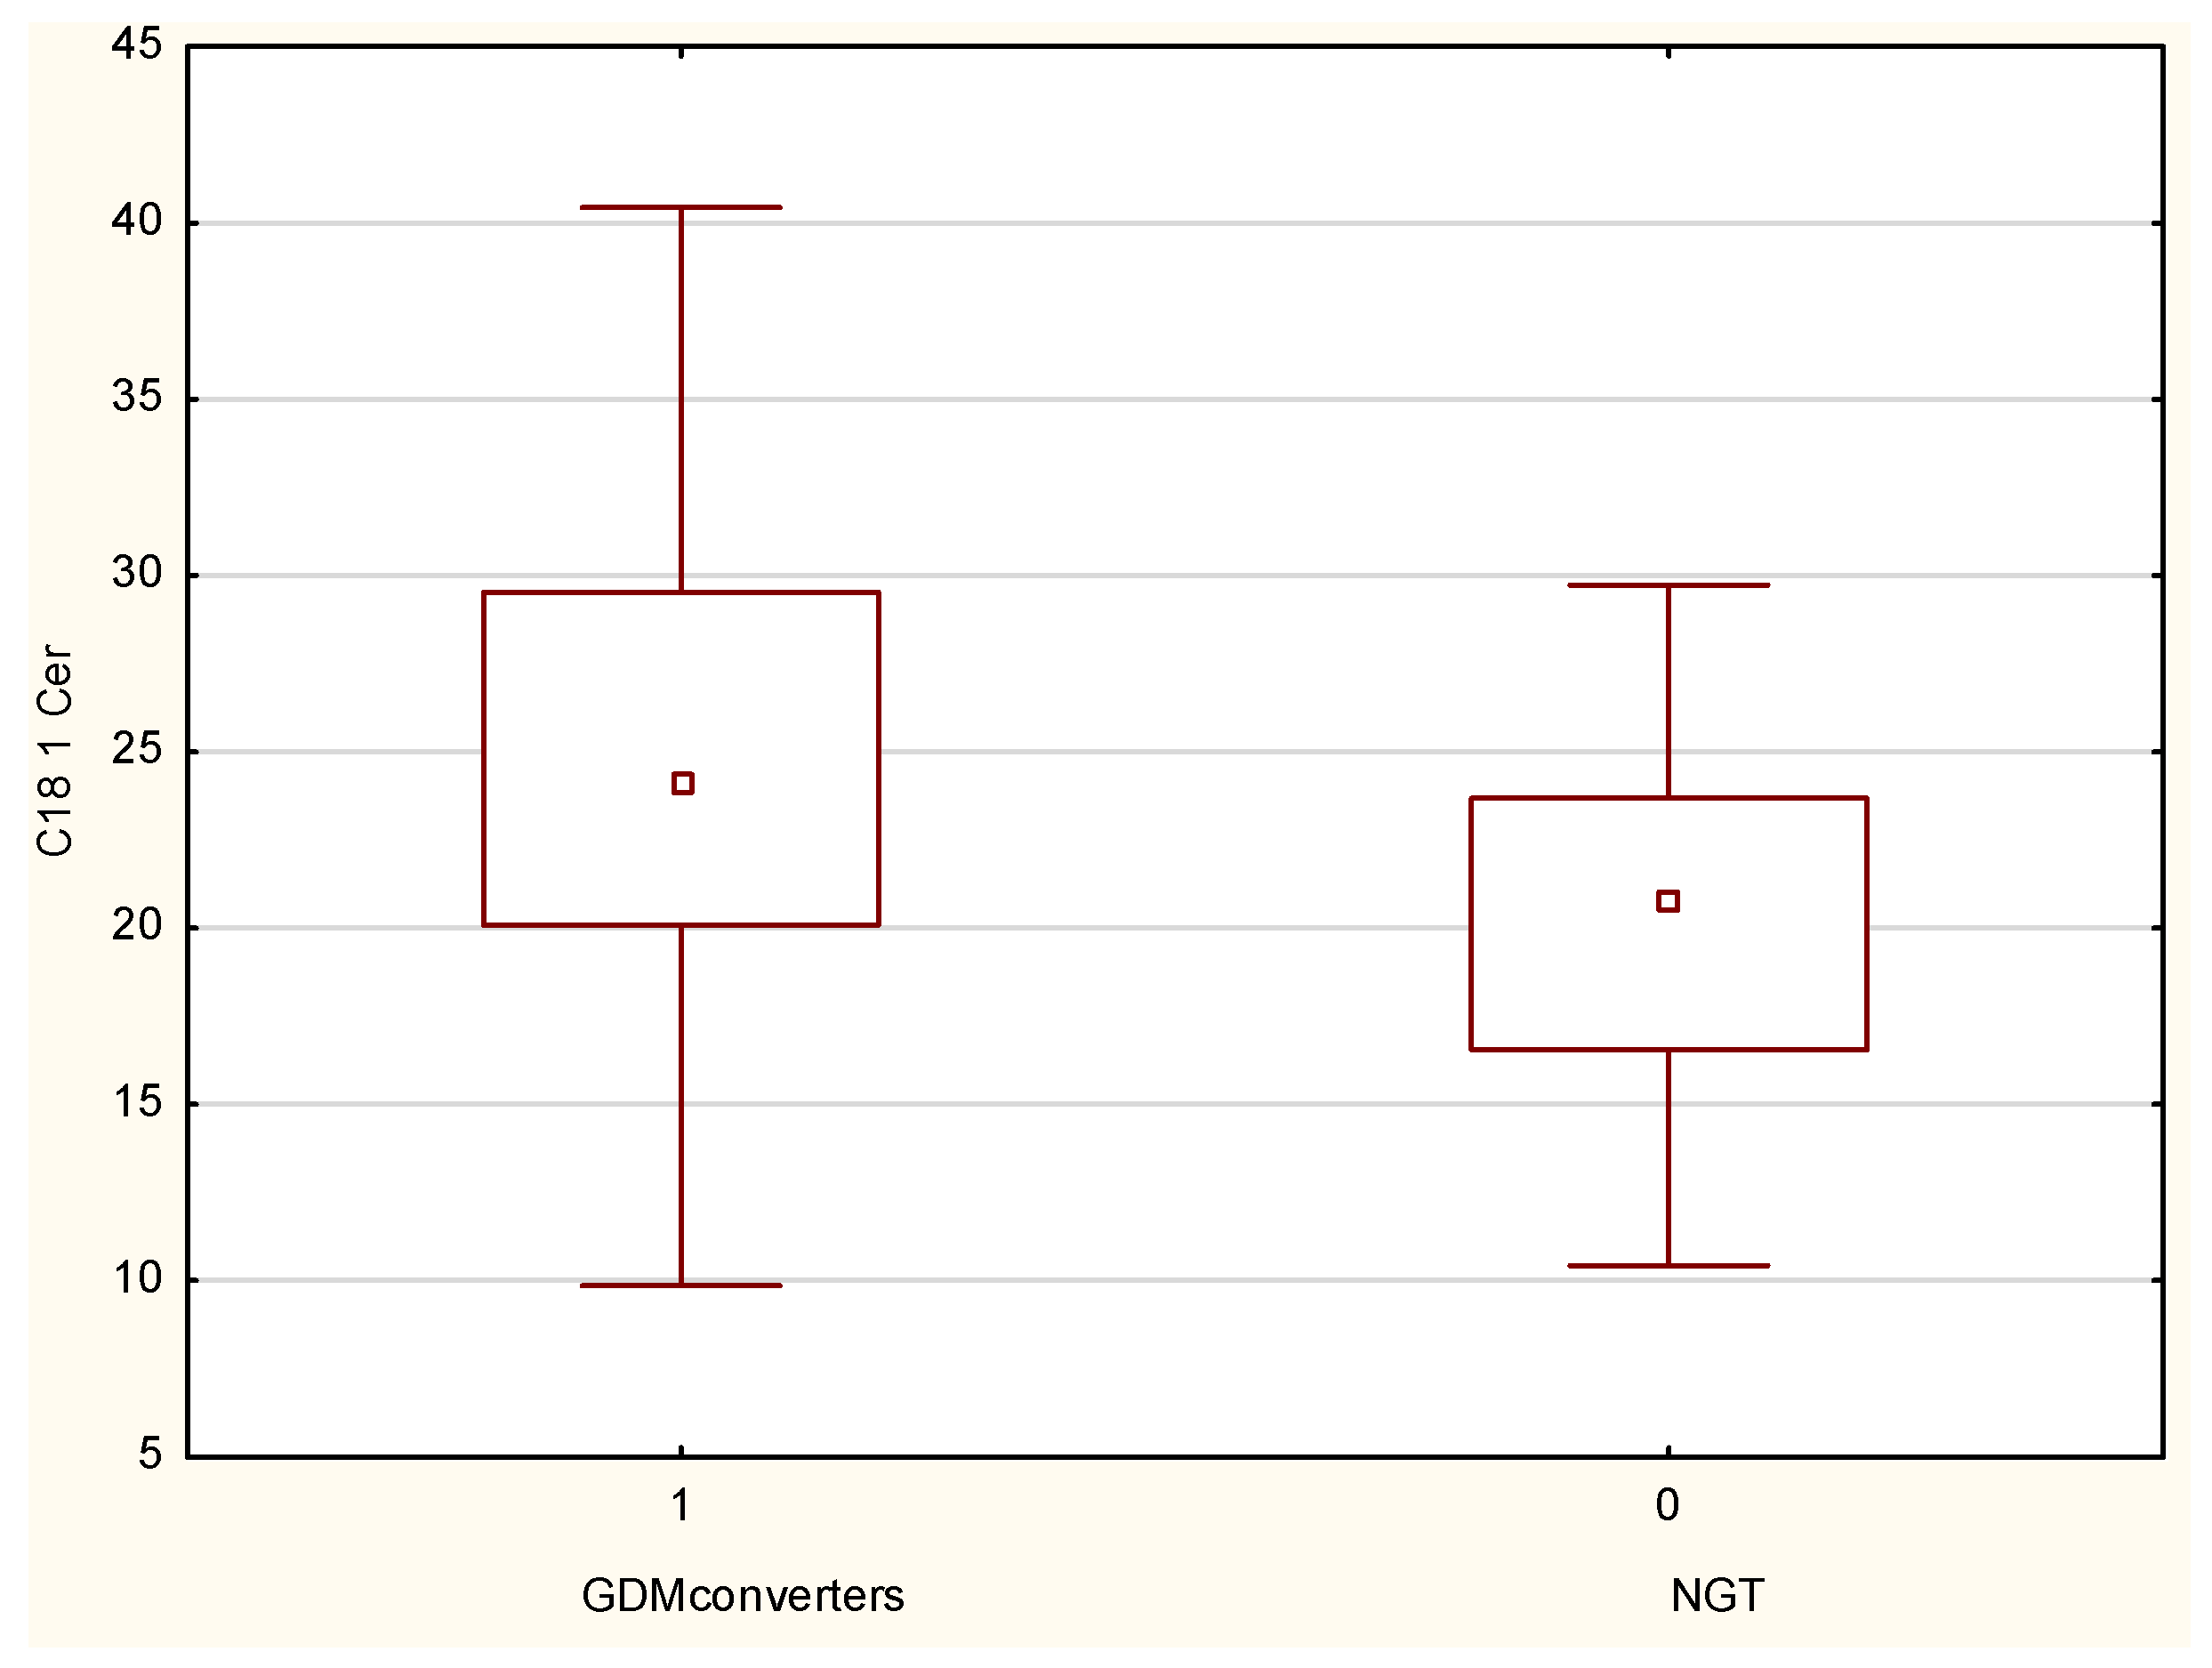
| C18:1 Cer | 20.72 * | 16.6–23.7 | 22.36 * | 17.7–25.9 | 24.16 * | 20.1–29.5 | 20.36 * | 15.6–26.5 |
| C18:0 Cer | 133.01 | 108.4–160.5 | 137.56 | 116.9–154.6 | 132.87 * | 108.8–199.6 | 168.21 * | 138.4–201.0 |
| C20:0 Cer | 172.96 | 130.1–194.2 | 174.51 | 136.7–210.6 | 152.08 | 123.6–177.9 | 180.41 | 146.8–242.8 |
| C22:0 Cer | 280.68 | 243.5–317.7 | 296.23 | 248.7–347.2 | 316.04 | 256.0–376.7 | 278.25 | 237.0–336.5 |
| C24:1 Cer | 280.36 | 237.9–336.5 | 285.22 | 234.5–344.5 | 278.96 * | 241.5–320.3 | 257.62 * | 214.8–296.6 |
| C24:0 Cer | 2200.14 ° | 2040.8–2608.7 | 2612.07 ° | 2306.4–2936.5 | 2356.23 | 2026.8–2917.9 | 2545.29 | 2115.7–3077.4 |
| Cer Total | 3344.21 | 3101.9–3682.7 | 3731.5 | 3494.8–4298.8 | 3552.17 | 3007.1–3923.5 | 3737.46 | 3310.1–4454.1 |
Publisher’s Note: MDPI stays neutral with regard to jurisdictional claims in published maps and institutional affiliations. |
© 2022 by the authors. Licensee MDPI, Basel, Switzerland. This article is an open access article distributed under the terms and conditions of the Creative Commons Attribution (CC BY) license (https://creativecommons.org/licenses/by/4.0/).
Share and Cite
Juchnicka, I.; Kuźmicki, M.; Zabielski, P.; Krętowski, A.; Błachnio-Zabielska, A.; Szamatowicz, J. Serum C18:1-Cer as a Potential Biomarker for Early Detection of Gestational Diabetes. J. Clin. Med. 2022, 11, 384. https://0-doi-org.brum.beds.ac.uk/10.3390/jcm11020384
Juchnicka I, Kuźmicki M, Zabielski P, Krętowski A, Błachnio-Zabielska A, Szamatowicz J. Serum C18:1-Cer as a Potential Biomarker for Early Detection of Gestational Diabetes. Journal of Clinical Medicine. 2022; 11(2):384. https://0-doi-org.brum.beds.ac.uk/10.3390/jcm11020384
Chicago/Turabian StyleJuchnicka, Ilona, Mariusz Kuźmicki, Piotr Zabielski, Adam Krętowski, Agnieszka Błachnio-Zabielska, and Jacek Szamatowicz. 2022. "Serum C18:1-Cer as a Potential Biomarker for Early Detection of Gestational Diabetes" Journal of Clinical Medicine 11, no. 2: 384. https://0-doi-org.brum.beds.ac.uk/10.3390/jcm11020384