
Kidney Function According to Different Equations in Patients Admitted to a Cardiology Unit and Impact on Outcome

 , ,
, ,  and
and 
Abstract
:1. Introduction
2. Materials and Methods
2.1. Endpoint
2.2. Statistical Analysis
3. Results
3.1. eGFR with CG, CG-BSA, MDRD, CKD-EPI, BIS1 and FAS Equations, Concordance Analysis
3.2. Survival Analysis
4. Discussion
4.1. Concordance between CKD-EPI and Different eGFR Equations
4.2. eGFR Estimates and Patient’s Age
4.3. eGFR and Cardiovascular Outcomes
4.4. Strengths and Limitations
Supplementary Materials
Author Contributions
Funding
Institutional Review Board Statement
Informed Consent Statement
Data Availability Statement
Conflicts of Interest
References
- KDIGO. 2012 clinical practice guideline for the evaluation and management of chronic kidney disease. Kidney Int. 2013, 3, 1–150. [Google Scholar]
- Foundation NK. K/DOQI clinical practice guidelines for chronic kidney disease: Evaluation, classification, and stratification. Am. J. Kidney Dis. 2002, 39 (Suppl. 1), S1–S266. [Google Scholar]
- Go, A.S.; Chertow, G.M.; Fan, D.; McCulloch, C.E.; Hsu, C.Y. Chronic kidney disease and the risks of death, cardiovascular events, and hospitalization. N. Engl. J. Med. 2004, 351, 1296–1305. [Google Scholar] [CrossRef] [PubMed]
- Sarnak, M.J.; Levey, A.S.; Schoolwerth, A.C.; Coresh, J.; Culleton, B.; Hamm, L.L.; McCullough, P.A.; Kasiske, B.L.; Kelepouris, E.; Klag, M.J.; et al. Kidney disease as a risk factor for development of cardiovascular disease: A statement from the American Heart Association Councils on Kidney in Cardiovascular Disease, High Blood Pressure Research, Clinical Cardiology, and Epidemiology and Prevention. Hypertension 2003, 42, 1050–1065. [Google Scholar] [CrossRef]
- Thompson, S.; James, M.; Wiebe, N.; Hemmelgarn, B.; Manns, B.; Klarenbach, S.; Tonelli, M. Alberta Kidney Disease Network. Cause of Death in Patients with Reduced Kidney Function. J. Am. Soc. Nephrol. 2015, 26, 2504–2511. [Google Scholar] [CrossRef]
- Su, G.; Xu, Y.; Xu, X.; Xu, H.; Lu, L.; Marrone, G.; Lindholm, B.; Wen, Z.; Liu, X.; Johnson, D.W.; et al. Association between reduced renal function and cardiovascular mortality in patients hospitalized with infection: A multi-center cohort study. Eur. J. Intern. Med. 2018, 57, 32–38. [Google Scholar] [CrossRef]
- Gallo, P.; De Vincentis, A.; Pedone, C.; Nobili, A.; Tettamanti, M.; Gentilucci, U.V.; Picardi, A.; Mannucci, P.M.; Incalzi, R.A. REPOSI Investigators. Prognostic relevance of glomerular filtration rate estimation obtained through different equations in hospitalized elderly patients. Eur. J. Intern. Med. 2018, 54, 60–64. [Google Scholar] [CrossRef]
- Topaz, G.; Gharra, W.; Eisen, A.; Hershko, A.Y.; Shilo, L.; Beeri, G.; Kitay-Cohen, Y.; Pereg, D. Impaired renal function is associated with adverse outcomes in patients with chest pain discharged from internal medicine wards. Eur. J. Intern. Med. 2018, 53, 57–61. [Google Scholar] [CrossRef]
- Bozzano, V.; Abati, E. (GrAM) GdAM. Fluid intake and chronic kidney disease: Effect of coaching an increase in fluid intake on kidney function decline. Intern. Emerg Med. 2018, 13, 1283–1285. [Google Scholar] [CrossRef]
- Riva, N.; Ageno, W.; Gatt, A. Estimating renal function in patients with atrial fibrillation: Which dose of direct oral anticoagulants? Intern. Emerg. Med. 2018, 13, 1001–1004. [Google Scholar] [CrossRef]
- Boriani, G.; Vitolo, M.; Diemberger, I.; Proietti, M.; Valenti, A.C.; Malavasi, V.L.; Lip, G.Y.H. Optimizing indices of AF susceptibility and burden to evaluate AF severity, risk and outcomes. Cardiovasc. Res. 2021, 117, 1–21. [Google Scholar] [CrossRef] [PubMed]
- Sgura, F.A.; Arrotti, S.; Magnavacchi, P.; Monopoli, D.; Gabbieri, D.; Banchelli, F.; Tondi, S.; Denegri, A.; D’Amico, R.; Guiducci, V.; et al. Kidney dysfunction and short term all-cause mortality after transcatheter aortic valve implantation. Eur. J. Intern. Med. 2020, 81, 32–37. [Google Scholar] [CrossRef] [PubMed]
- Malavasi, V.L.; Pettorelli, D.; Fantecchi, E.; Zoccali, C.; Laronga, G.; Trenti, T.; Lip, G.Y.H.; Boriani, G. Variations in clinical management of non-vitamin K antagonist oral anticoagulants in patients with atrial fibrillation according to different equations for estimating renal function: Post hoc analysis of a prospective cohort. Intern. Emerg. Med. 2018, 13, 1059–1067. [Google Scholar] [CrossRef] [PubMed]
- Pugliese, N.R.; Fabiani, I.; Conte, L.; Nesti, L.; Masi, S.; Natali, A.; Colombo, P.C.; Pedrinelli, R.; Dini, F.L. Persistent congestion, renal dysfunction and inflammatory cytokines in acute heart failure: A prognosis study. J. Cardiovasc. Med. 2020, 21, 494–502. [Google Scholar] [CrossRef] [PubMed]
- Campanile, A.; Castellani, C.; Santucci, A.; Annunziata, R.; Tutarini, C.; Reccia, M.R.; Del Pinto, M.; Verdecchia, P.; Cavallini, C. Predictors of in-hospital and long-term mortality in unselected patients admitted to a modern coronary care unit. J. Cardiovasc. Med. 2019, 20, 327–334. [Google Scholar] [CrossRef]
- Shetty, S.; Malik, A.H.; Ali, A.; Yang, Y.C.; Aronow, W.S.; Briasoulis, A. Impact of acute kidney injury on in-hospital outcomes among patients hospitalized with acute heart failure—A propensity-score matched analysis. Eur, J. Intern. Med. 2020, 79, 76–80. [Google Scholar] [CrossRef]
- Sanchez-Serna, J.; Hernandez-Vicente, A.; Garrido-Bravo, I.P.; Pastor-Perez, F.; Noguera-Velasco, J.A.; Casas-Pina, T.; Rodriguez-Serrano, A.I.; Núñez, J.; Pascual-Figal, D. Impact of pre-hospital renal function on the detection of acute kidney injury in acute decompensated heart failure. Eur. J. Intern. Med. 2020, 77, 66–72. [Google Scholar] [CrossRef]
- Correale, M.; Paolillo, S.; Mercurio, V.; Limongelli, G.; Barillà, F.; Ruocco, G.; Palazzuoli, A.; Scrutinio, D.; Lagioia, R.; Lombardi, C.; et al. Co-morbidities in chronic heart failure: An update from Italian Society of Cardiology (SIC) Working Group on Heart Failure. Eur. J. Intern. Med. 2020, 71, 23–31. [Google Scholar] [CrossRef] [Green Version]
- Kashani, K.; Rosner, M.H.; Ostermann, M. Creatinine: From physiology to clinical application. Eur. J. Intern. Med. 2020, 72, 9–14. [Google Scholar] [CrossRef]
- Fox, C.S.; Matsushita, K.; Woodward, M.; Bilo, H.J.; Chalmers, J.; Heerspink, H.J.; Lee, B.J.; Perkins, R.M.; Rossing, P.; Sairenchi, T.; et al. Associations of kidney disease measures with mortality and end-stage renal disease in individuals with and without diabetes: A meta-analysis. Lancet 2012, 380, 1662–1673. [Google Scholar] [CrossRef] [Green Version]
- Lokhandwala, S.; McCague, N.; Chahin, A.; Escobar, B.; Feng, M.; Ghassemi, M.M.; Stone, D.J.; Celi, L.A. One-year mortality after recovery from critical illness: A retrospective cohort study. PLoS ONE 2018, 13, e0197226. [Google Scholar] [CrossRef] [PubMed]
- Tonelli, M.; Muntner, P.; Lloyd, A.; Manns, B.J.; Klarenbach, S.; Pannu, N.; James, M.T.; Hemmelgarn, B.R. Alberta Kidney Disease Network. Risk of coronary events in people with chronic kidney disease compared with those with diabetes: A population-level cohort study. Lancet 2012, 380, 807–814. [Google Scholar] [CrossRef]
- Vanholder, R.; Massy, Z.; Argiles, A.; Spasovski, G.; Verbeke, F.; Lameire, N. European Uremic Toxin Work Group. Chronic kidney disease as cause of cardiovascular morbidity and mortality. Nephrol. Dial. Transplant. 2005, 20, 1048–1056. [Google Scholar] [CrossRef] [PubMed] [Green Version]
- Tonelli, M.; Wiebe, N.; Culleton, B.; House, A.; Rabbat, C.; Fok, M.; McAlister, F.; Garg, A.X. Chronic kidney disease and mortality risk: A systematic review. J. Am. Soc. Nephrol. 2006, 17, 2034–2047. [Google Scholar] [CrossRef] [Green Version]
- Manjunath, G.; Tighiouart, H.; Ibrahim, H.; MacLeod, B.; Salem, D.N.; Griffith, J.L.; Coresh, J.; Levey, A.S.; Sarnak, M.J. Level of kidney function as a risk factor for atherosclerotic cardiovascular outcomes in the community. J. Am. Coll. Cardiol. 2003, 41, 47–55. [Google Scholar] [CrossRef] [Green Version]
- Anavekar, N.S.; McMurray, J.J.; Velazquez, E.J.; Solomon, S.D.; Kober, L.; Rouleau, J.L.; White, H.D.; Nordlander, R.; Maggioni, A.; Dickstein, K.; et al. Relation between renal dysfunction and cardiovascular outcomes after myocardial infarction. N. Engl. J. Med. 2004, 351, 1285–1295. [Google Scholar] [CrossRef]
- Gibson, C.M.; Dumaine, R.L.; Gelfand, E.V.; Murphy, S.A.; Morrow, D.A.; Wiviott, S.D.; Giugliano, R.P.; Cannon, C.P.; Antman, E.M.; Braunwald, E. TIMI Study Group. Association of glomerular filtration rate on presentation with subsequent mortality in non-ST-segment elevation acute coronary syndrome; observations in 13,307 patients in five TIMI trials. Eur. Heart J. 2004, 25, 1998–2005. [Google Scholar] [CrossRef] [Green Version]
- Kpaeyeh, J.A., Jr.; Divoky, L.; Hyer, J.M.; Daly, D.D., Jr.; Maran, A.; Waring, A.; Gold, M.R. Impact of Renal Function on Survival After Cardiac Resynchronization Therapy. Am. J. Cardiol. 2017, 120, 262–266. [Google Scholar] [CrossRef]
- García-Gil, M.; Parramon, D.; Comas-Cufí, M.; Martí, R.; Ponjoan, A.; Alves-Cabratosa, L.; Blanch, J.; Petersen, I.; Elosua, R.; Grau, M.; et al. Role of renal function in cardiovascular risk assessment: A retrospective cohort study in a population with low incidence of coronary heart disease. Prev Med. 2016, 89, 200–206. [Google Scholar] [CrossRef] [Green Version]
- Edfors, R.; Sahlén, A.; Szummer, K.; Renlund, H.; Evans, M.; Carrero, J.J.; Spaak, J.; James, S.K.; Lagerqvist, B.; Varenhorst, C.; et al. Outcomes in patients treated with ticagrelor versus clopidogrel after acute myocardial infarction stratified by renal function. Heart 2018, 104, 1575–1582. [Google Scholar] [CrossRef]
- Boriani, G.; Savelieva, I.; Dan, G.A.; Deharo, J.C.; Ferro, C.; Israel, C.W.; Lane, D.A.; La Manna, G.; Morton, J.; Mitjans, A.M.; et al. Chronic kidney disease in patients with cardiac rhythm disturbances or implantable electrical devices: Clinical significance and implications for decision making-a position paper of the European Heart Rhythm Association endorsed by the Heart Rhythm Society and the Asia Pacific Heart Rhythm Society. Europace 2015, 17, 1169–1196. [Google Scholar] [PubMed]
- Boriani, G.; Laroche, C.; Diemberger, I.; Popescu, M.I.; Rasmussen, L.H.; Petrescu, L.; Crijns, H.J.G.M.; Tavazzi, L.; Maggioni, A.P.; Lip, G.Y.H. Glomerular filtration rate in patients with atrial fibrillation and 1-year outcomes. Sci. Rep. 2016, 6, 30271. [Google Scholar] [CrossRef] [PubMed]
- Cockcroft, D.W.; Gault, M.H. Prediction of creatinine clearance from serum creatinine. Nephron 1976, 16, 31–41. [Google Scholar] [CrossRef] [PubMed]
- Rostoker, G.; Andrivet, P.; Pham, I.; Griuncelli, M.; Adnot, S. A modified Cockcroft-Gault formula taking into account the body surface area gives a more accurate estimation of the glomerular filtration rate. J. Nephrol. 2007, 20, 576–585. [Google Scholar] [PubMed]
- Levey, A.S.; Bosch, J.P.; Lewis, J.B.; Greene, T.; Rogers, N.; Roth, D. A more accurate method to estimate glomerular filtration rate from serum creatinine: A new prediction equation. Modification of Diet in Renal Disease Study Group. Ann. Intern. Med. 1999, 130, 461–470. [Google Scholar] [CrossRef]
- Levey, A.S.; Coresh, J.; Greene, T.; Marsh, J.; Stevens, L.A.; Kusek, J.W.; Van Lente, F.; Chronic Kidney Disease Epidemiology Collaboration. Expressing the Modification of Diet in Renal Disease Study equation for estimating glomerular filtration rate with standardized serum creatinine values. Clin. Chem. 2007, 53, 766–772. [Google Scholar] [CrossRef] [Green Version]
- Levey, A.S.; Stevens, L.A.; Schmid, C.H.; Zhang, Y.L.; Castro, A.F., 3rd; Feldman, H.I.; Kusek, J.W.; Eggers, P.; Van Lente, F.; Greene, T.; et al. A new equation to estimate glomerular filtration rate. Ann. Intern. Med. 2009, 150, 604–612. [Google Scholar] [CrossRef]
- Gill, J.; Malyuk, R.; Djurdjev, O.; Levin, A. Use of GFR equations to adjust drug doses in an elderly multi-ethnic group--a cautionary tale. Nephrol Dial. Transplant. 2007, 22, 2894–2899. [Google Scholar] [CrossRef] [Green Version]
- Garasto, S.; Fusco, S.; Corica, F.; Rosignuolo, M.; Marino, A.; Montesanto, A.; De Rango, F.; Maggio, M.; Mari, V.; Corsonello, A.; et al. Estimating glomerular filtration rate in older people. Biomed. Res. Int. 2014, 2014, 916542. [Google Scholar] [CrossRef] [Green Version]
- Schaeffner, E.S.; Ebert, N.; Delanaye, P.; Frei, U.; Gaedeke, J.; Jakob, O.; Kuhlmann, M.K.; Schuchardt, M.; Tölle, M.; Ziebig, R.; et al. Two novel equations to estimate kidney function in persons aged 70 years or older. Ann. Intern. Med. 2012, 157, 471–481. [Google Scholar] [CrossRef] [Green Version]
- Pottel, H.; Mottaghy, F.M.; Zaman, Z.; Martens, F. On the relationship between glomerular filtration rate and serum creatinine in children. Pediatr Nephrol. 2010, 25, 927–934. [Google Scholar] [CrossRef] [PubMed]
- Pottel, H.; Hoste, L.; Martens, F. A simple height-independent equation for estimating glomerular filtration rate in children. Pediatr Nephrol. 2012, 27, 973–979. [Google Scholar] [CrossRef] [PubMed]
- Pottel, H.; Vrydags, N.; Mahieu, B.; Vandewynckele, E.; Croes, K.; Martens, F. Establishing age/sex related serum creatinine reference intervals from hospital laboratory data based on different statistical methods. Clin. Chim Acta. 2008, 396, 49–55. [Google Scholar] [CrossRef]
- Pottel, H.; Hoste, L.; Dubourg, L.; Ebert, N.; Schaeffner, E.; Eriksen, B.O.; Melsom, T.; Lamb, E.J.; Rule, A.D.; Turner, S.T.; et al. An estimated glomerular filtration rate equation for the full age spectrum. Nephrol Dial. Transplant. 2016, 31, 798–806. [Google Scholar] [CrossRef] [Green Version]
- Levey, A.S. Measurement of renal function in chronic renal disease. Kidney Int. 1990, 38, 167–184. [Google Scholar] [CrossRef] [PubMed] [Green Version]
- Miller, B.F.; Winkler, A.W. The renal excretion of endogenous creatinine in man. comparison with exogenous creatinine and inulin. J. Clin. Invest. 1938, 17, 31–40. [Google Scholar] [CrossRef] [Green Version]
- Shemesh, O.; Golbetz, H.; Kriss, J.P.; Myers, B.D. Limitations of creatinine as a filtration marker in glomerulopathic patients. Kidney Int. 1985, 28, 830–838. [Google Scholar] [CrossRef] [Green Version]
- Perrone, R.D.; Madias, N.E.; Levey, A.S. Serum creatinine as an index of renal function: New insights into old concepts. Clin. Chem. 1992, 38, 1933–1953. [Google Scholar] [CrossRef] [PubMed]
- Heymsfield, S.B.; Arteaga, C.; McManus, C.; Smith, J.; Moffitt, S. Measurement of muscle mass in humans: Validity of the 24-h urinary creatinine method. Am. J. Clin. Nutr. 1983, 37, 478–494. [Google Scholar] [CrossRef]
- Preiss, D.J.; Godber, I.M.; Lamb, E.J.; Dalton, R.N.; Gunn, I.R. The influence of a cooked-meat meal on estimated glomerular filtration rate. Ann. Clin. Biochem. 2007, 44 Pt 1, 35–42. [Google Scholar] [CrossRef] [Green Version]
- Levey, A.S.; Inker, L.A.; Coresh, J. GFR estimation: From physiology to public health. Am. J. Kidney Dis. 2014, 63, 820–834. [Google Scholar] [CrossRef] [PubMed] [Green Version]
- Viera, A.J.; Garrett, J.M. Understanding interobserver agreement: The kappa statistic. Fam Med. 2005, 37, 360–363. [Google Scholar] [PubMed]
- DeLong, E.R.; DeLong, D.M.; Clarke-Pearson, D.L. Comparing the areas under two or more correlated receiver operating characteristic curves: A non-parametric approach. Biometrics 1988, 44, 837–845. [Google Scholar] [CrossRef] [PubMed]
- Pencina, M.J.; D’Agostino, R.B.; Vasan, R.S. Evaluating the added predictive ability of a new marker: From area under the ROC curve to reclassification and beyond. Stat. Med. 2008, 27, 157–172; discussion 207-12. [Google Scholar] [CrossRef] [PubMed]
- Kundu, S.; Aulchenko, Y.S.; van Duijn, C.M.; Janssens, A.C. PredictABEL: An R package for the assessment of risk prediction models. Eur. J. Epidemiol. 2011, 26, 261–264. [Google Scholar] [CrossRef] [PubMed] [Green Version]
- January, C.T.; Wann, L.S.; Alpert, J.S.; Calkins, H.; Cigarroa, J.E.; Cleveland, J.C.; Ellinor, P.T.; Ezekowitz, M.D.; Field, M.E.; Furie , K.L.; et al. 2014 AHA/ACC/HRS guideline for the management of patients with atrial fibrillation: A report of the American College of Cardiology/American Heart Association Task Force on Practice Guidelines and the Heart Rhythm Society. J. Am. Coll Cardiol. 2014, 64, e1–e76. [Google Scholar] [CrossRef] [Green Version]
- Ruiz-Esteban, P.; López, V.; García-Frías, P.; Cabello, M.; González-Molina, M.; Vozmediano, C.; Hernandez, D. Concordance of estimated glomerular filtration rates using Cockcroft-Gault modification of diet in renal disease, and chronic kidney disease epidemiology in renal transplant recipients. Transplant. Proc. 2012, 44, 2561–2563. [Google Scholar] [CrossRef] [PubMed]
- Esteve Poblador, S.; Gorriz Pintado, S.; Ortuño Alonso, M. Comparison between two equations to estimated glomerular filtration rate. Rev. Clin. Esp. 2012, 212, 75–80. [Google Scholar] [CrossRef]
- Teruel, J.L.; Rexach, L.; Burguera, V.; Gomis, A.; Rodríguez-Mendiola, N.; Díaz, A.; Collazo, S.; Quereda, C. Home care programme for patients with advanced chronic kidney disease. A two-year experience. Nefrologia. 2014, 34, 611–616. [Google Scholar]
- Torreggiani, M.; Chatrenet, A.; Fois, A.; Moio, M.R.; Mazé, B.; Coindre, J.P.; Crochette, R.; Sigogne, M.; Wacrenier, S.; Lecointre, L.; et al. Elderly Patients in a Large Nephrology Unit: Who Are Our Old, Old-Old and Oldest-Old Patients? J. Clin. Med. 2021, 10, 1168. [Google Scholar] [CrossRef] [PubMed]
- Stevens, L.A.; Levey, A.S. Use of the MDRD study equation to estimate kidney function for drug dosing. Clin. Pharmacol Ther. 2009, 86, 465–467. [Google Scholar] [CrossRef] [PubMed]
- Michels, W.M.; Grootendorst, D.C.; Verduijn, M.; Elliott, E.G.; Dekker, F.W.; Krediet, R.T. Performance of the Cockcroft-Gault, MDRD, and new CKD-EPI formulas in relation to GFR, age, and body size. Clin. J. Am. Soc. Nephrol. 2010, 5, 1003–1009. [Google Scholar] [CrossRef] [PubMed] [Green Version]
- Mandelli, S.; Riva, E.; Tettamanti, M.; Detoma, P.; Giacomin, A.; Lucca, U. Mortality Prediction in the Oldest Old with Five Different Equations to Estimate Glomerular Filtration Rate: The Health and Anemia Population-based Study. PLoS ONE 2015, 10, e0136039. [Google Scholar] [CrossRef] [PubMed] [Green Version]
- Flamant, M.; Haymann, J.P.; Vidal-Petiot, E.; Letavernier, E.; Clerici, C.; Boffa, J.J.; Vrtovsnik, F. GFR estimation using the Cockcroft-Gault, MDRD study, and CKD-EPI equations in the elderly. Am. J. Kidney Dis. 2012, 60, 847–849. [Google Scholar] [CrossRef] [PubMed]
- Buron, F.; Hadj-Aissa, A.; Dubourg, L.; Morelon, E.; Steghens, J.P.; Ducher, M.; Fauvel, J.P. Estimating glomerular filtration rate in kidney transplant recipients: Performance over time of four creatinine-based formulas. Transplantation 2011, 92, 1005–1011. [Google Scholar] [CrossRef] [PubMed]
- Kilbride, H.S.; Stevens, P.E.; Eaglestone, G.; Knight, S.; Carter, J.L.; Delaney, M.P.; Farmer, C.K.; Irving, J.; O’Riordan, S.E.; Dalton, R.N.; et al. Accuracy of the MDRD (Modification of Diet in Renal Disease) study and CKD-EPI (CKD Epidemiology Collaboration) equations for estimation of GFR in the elderly. Am. J. Kidney Dis. 2013, 61, 57–66. [Google Scholar] [CrossRef]
- Rivera-Caravaca, J.M.; Ruiz-Nodar, J.M.; Tello-Montoliu, A.; Esteve-Pastor, M.A.; Quintana-Giner, M.; Véliz-Martínez, A.; Orenes-Piñero, E.; Romero-Aniorte, A.I.; Vicente-Ibarra, N.; Pernias-Escrig, V.; et al. Disparities in the Estimation of Glomerular Filtration Rate According to Cockcroft-Gault, Modification of Diet in Renal Disease-4, and Chronic Kidney Disease Epidemiology Collaboration Equations and Relation With Outcomes in Patients With Acute Coronary Syndrome. J. Am. Heart Assoc. 2018, 7, e008725. [Google Scholar]
- Ndrepepa, G.; Holdenrieder, S.; Neumann, F.J.; Lahu, S.; Cassese, S.; Joner, M.; Xhepa, E.; Kufner, S.; Wiebe, J.; Laugwitz, K.L.; et al. Prognostic value of glomerular function estimated by Cockcroft-Gault creatinine clearance, MDRD-4, CKD-EPI and European Kidney Function Consortium equations in patients with acute coronary syndromes. Clin. Chim Acta. 2021, 523, 106–113. [Google Scholar] [CrossRef]
- Da Silva Selistre, L.; Rech, D.L.; de Souza, V.; Iwaz, J.; Lemoine, S.; Dubourg, L. Diagnostic Performance of Creatinine-Based Equations for Estimating Glomerular Filtration Rate in Adults 65 Years and Older. JAMA Intern. Med. 2019, 179, 796–804. [Google Scholar] [CrossRef] [PubMed]
- Cherney, D.Z.I.; Lytvyn, Y.; McCullough, P.A. Cardiovascular Risk Reduction in Patients With Chronic Kidney Disease: Potential for Targeting Inflammation With Canakinumab. J. Am. Coll Cardiol. 2018, 71, 2415–2418. [Google Scholar] [CrossRef] [PubMed]
- Kuo, P.H.; Kanal, E.; Abu-Alfa, A.K.; Cowper, S.E. Gadolinium-based MR contrast agents and nephrogenic systemic fibrosis. Radiology. 2007, 242, 647–649. [Google Scholar] [CrossRef] [PubMed]
- Polyzos, K.A.; Konstantelias, A.A.; Falagas, M.E. Risk factors for cardiac implantable electronic device infection: A systematic review and meta-analysis. Europace 2015, 17, 767–777. [Google Scholar] [CrossRef] [PubMed]
- Boriani, G.; Malavasi, V.L. Patient outcome after implant of a cardioverter defibrillator in the ‘real world’: The key role of co-morbidities. Eur. J. Heart Fail. 2017, 19, 387–390. [Google Scholar] [CrossRef] [PubMed] [Green Version]


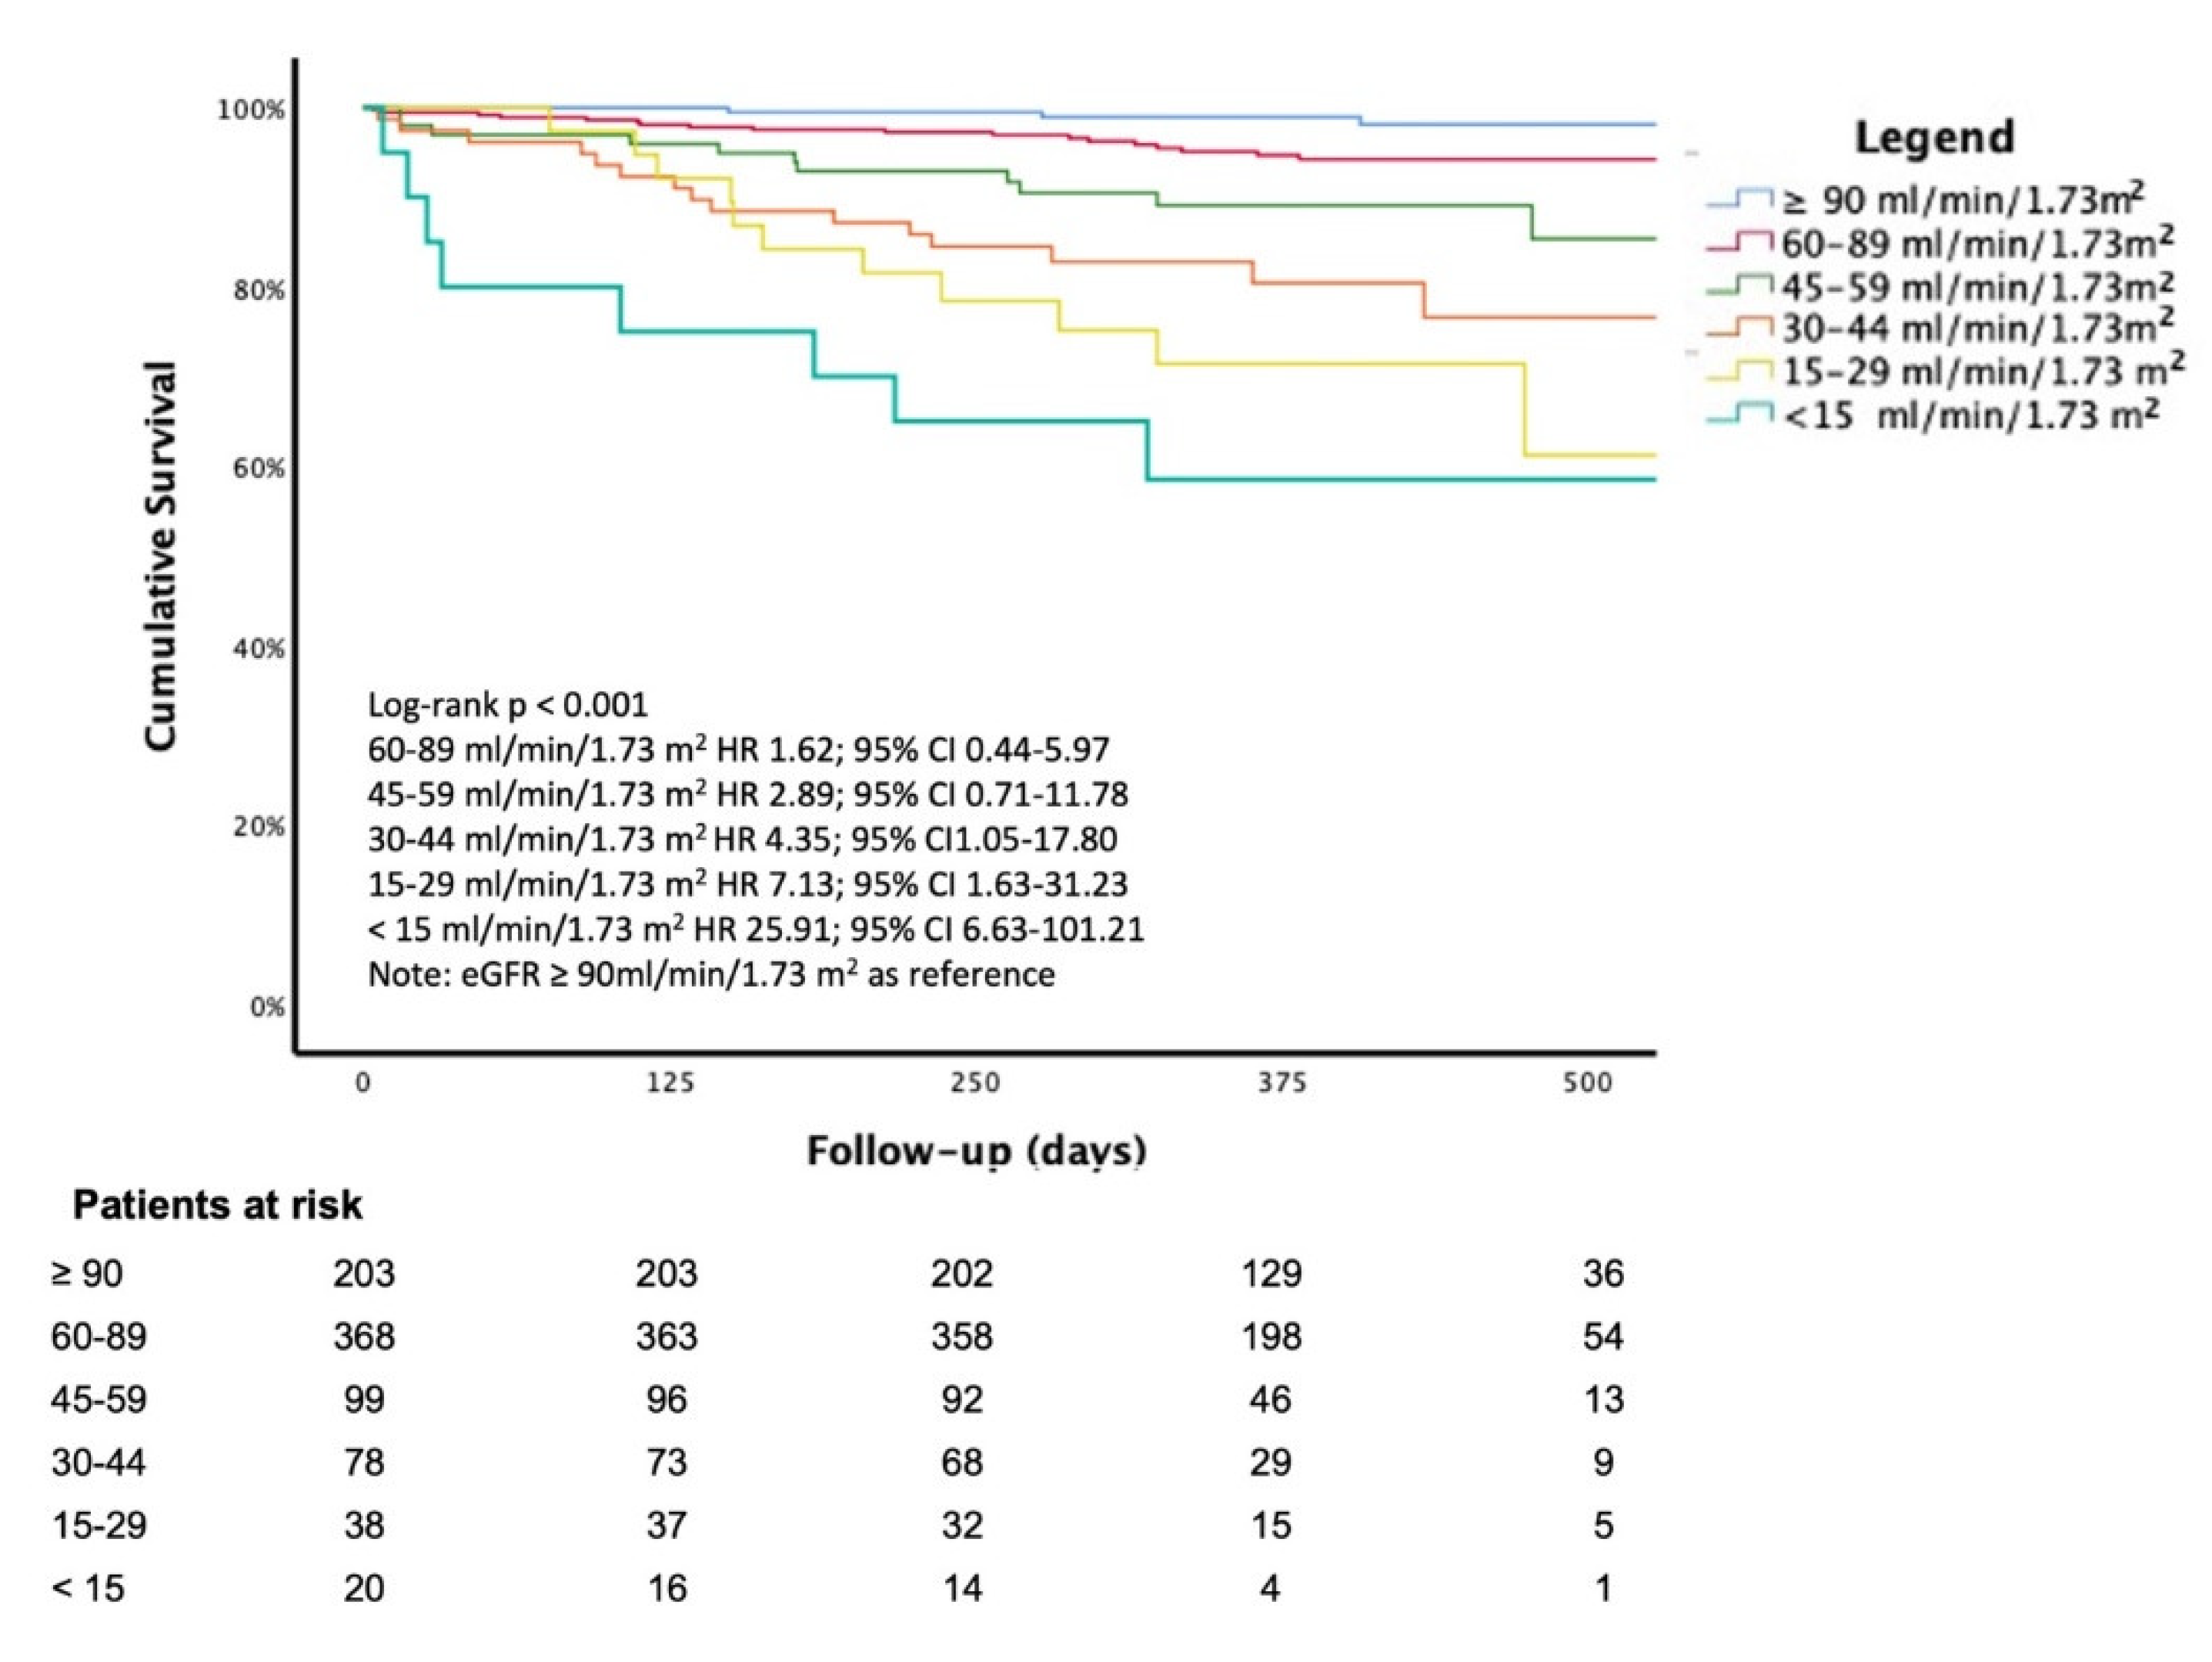
| KDIGO Categories According to CKD-EPI eGFR (mL/min/1.73 m2) | ||||||||
|---|---|---|---|---|---|---|---|---|
| Overall (n = 806) | G1 eGFR ≥ 90 (n = 203) | G2 eGFR 89–60 (n = 368) | G3a eGFR 59–45 (n = 99) | G3b eGFR 44–30 (n = 78) | G4 eGFR 29–15 (n = 38) | G5 eGFR < 15 (n = 20) | p | |
| Clinical features | ||||||||
| F-U days, median (IQR) | 407 (284–473) | 430 (365–478) | 414 (277–478) | 382 (269–474) | 330 (243–433) | 325 (223–359) | 283 (145–378) | <0.001 |
| Males, n (%) | 510 (63.3) | 137 (67.5) | 247 (67.1) | 56 (56.6) | 37 (47.4) | 21 (55.3) | 12 (60) | 0.009 |
| Age, yrs median (IQR) | 71 (61–79) | 58 (50–65) | 73 (66–79) | 77 (72–83) | 81 (76–85) | 83 (80–86) | 63 (58–71) | <0.001 |
| Hypertension, n (%) | 551 (68.4) | 105 (51.7) | 258 (70.1) | 84 (84.8) | 63 (80.8) | 32 (84.2) | 9 (45) | <0.001 |
| Diabetes, n (%) | 198 (24.6) | 41 (20.2) | 84 (22.8) | 33 (33.3) | 24 (30.8) | 12 (31.6) | 4 (20) | 0.086 |
| Dyslipidemia, n (%) | 414 (51.4) | 95 (46.8) | 203 (55.2) | 57 (57.6) | 38 (48.7) | 15 (39.5) | 6 (30) | 0.044 |
| Smoking, n (%) | 220 (27.3) | 78 (38.4) | 101 (27.4) | 21 (21.2) | 10 (12.8) | 5 (13.2) | 5 (25) | <0.001 |
| Family history of CVD, n (%) | 108 (13.4) | 48 (23.6) | 45 (12.2) | 6 (6.1) | 6 (7.7) | 0 | 3 (15) | <0.001 |
| History of CKD, n (%) | 107 (13.3) | 0 | 10 (2.7) | 20 (20.2) | 37 (47.4) | 22 (57.9) | 18 (90) | <0.001 |
| BMI, median (IQR) | 26.6 (24–29.4) | 26.7 (23.7–30.1) | 26.6 (24.2–29.4) | 26.8 (23.6–29.3) | 27 (23.4–30.8) | 25.5 (23.5–27.8) | 25.7 (21.2–29.9) | 0.690 |
| SCr mg/dl median (IQR) | 0.94 (0.71–1.20) | 0.71 (0.62–0.86) | 0.91 (0.82–1.03) | 1.20 (1.01–1.33) | 1.50 (1.32–1.71) | 2.21 (2.01–2.52) | 5.85 (4.31–7.02) | <0.001 |
| Age groups | <0.001 | |||||||
| Age < 65 yrs, n (%) | 241 (29.9) | 149 (73.4) | 64 (17.4) | 9 (9.1) | 6 (7.7) | 2 (5.3) | 11 (55) | |
| Age 65–74 yrs, n (%) | 221 (27.4) | 47 (23.2) | 134 (36.4) | 22 (22.2) | 10 (12.8) | 3 (7.9) | 5 (25) | |
| Age 75–84 yrs, n (%) | 258 (32) | 7 (3.4) | 142 (38.6) | 52 (52.5) | 37 (47.4) | 17 (44.7) | 3 (15) | |
| Age ≥ 85 yrs, n (%) | 86 (10.7) | 0 | 28 (7.6) | 16 (16.2) | 25 (32.1) | 16 (42.1) | 1 (5) | |
| Diagnosis at discharge | <0.001 | |||||||
| CCS n (%) | 108 (13.4) | 37 (18.2) | 48 (13) | 13 (13.1) | 6 (7.7) | 2 (5.3) | 2 (10) | |
| ACS n (%) | 345 (42.8) | 102 (50.2) | 163 (44.3) | 35 (35.4) | 24 (30.8) | 9 (23.7) | 12 (60) | |
| HF n (%) | 110 (13.6) | 13 (6.4) | 38 (10.3) | 21 (21.2) | 27 (34.6) | 8 (21.1) | 3 (15) | |
| VHD n (%) | 17 (2.1) | 1 (0.5) | 9 (2.5) | 4 (4) | 3 (3.8) | 0 | 0 | |
| AF n (%) | 14 (1.7) | 2 (1) | 6 (1.6) | 1 (1) | 1 (1.3) | 4 (10.5) | 0 | |
| Other arrhythmias n (%) | 127 (15.8) | 23 (11.4) | 61 (16.6) | 18 (18.2) | 14 (17.9) | 9 (23.7) | 2 (10) | |
| Miscellaneous n (%) | 85 (10.5) | 25 (12.3) | 43 (11.7) | 7 (7.1) | 3 (3.8) | 6 (15.8) | 1 (5) | |
| Outcome | ||||||||
| Deaths n (%) | 66 (8.2) | 3 (1.5) | 18 (4.9) | 11 (11.1) | 15 (19.2) | 11 (28.9) | 8 (40) | <0.001 |
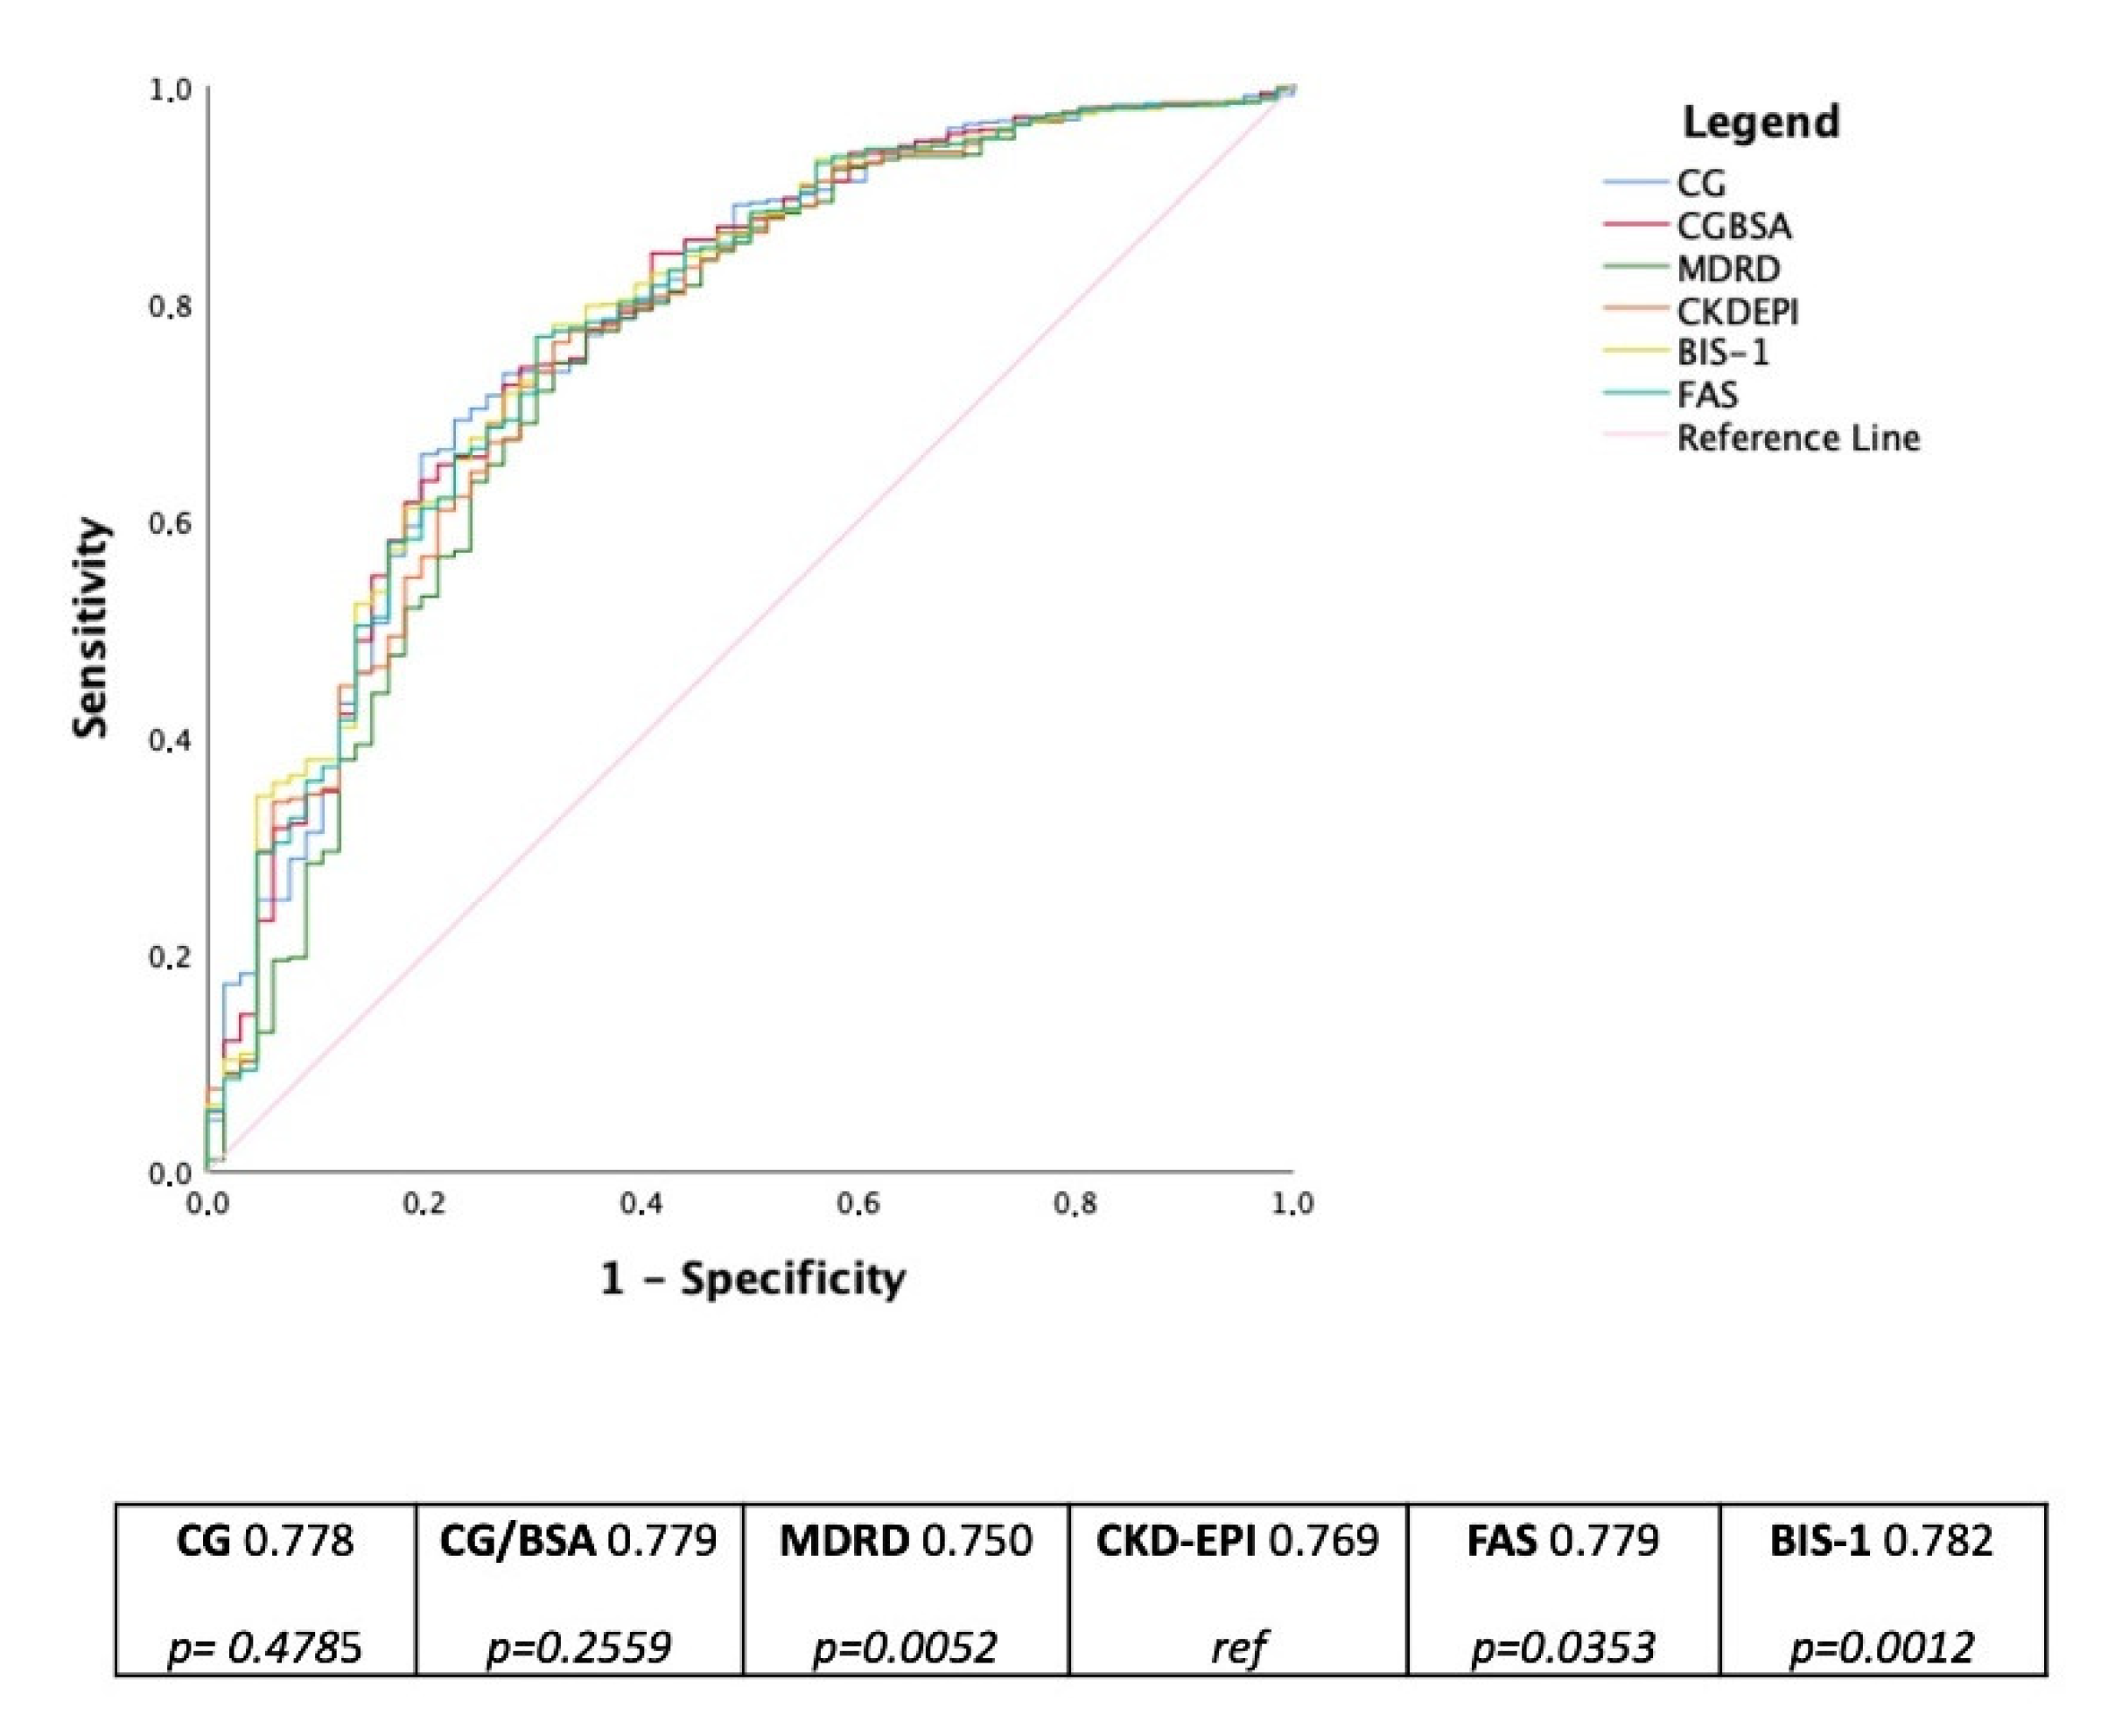
| CG | CG-BSA | MDRD | BIS-1 | FAS | |
|---|---|---|---|---|---|
| CKD-EPI | 0.535 (0.699–0.761) | 0.659 (0.575–0.743) | 0.751 (0.651–0.851) | 0.660 (0.560–0.760) | 0.663 (0.563–0.763) |
| CG | 0.717 (0.650–0.783) | 0.460 (0.393–0.527) | 0.514 (0.447–0.581) | 0.505 (0.438–0.572) | |
| CG-BSA | 0.499 (0.432–0.566) | 0.732 (0.665–0.799) | 0.739 (0.672–0.806) | ||
| MDRD | 0.477 (0.410–0.544) | 0.470 (0.403–0.537) | |||
| BIS-1 | 0.896 (0.829–0.962) |
| CG | CG-BSA | MDRD | BIS-1 | FAS | |
|---|---|---|---|---|---|
| CKD-EPI in pts <65 y | 0.523 (0.456–0.589) * | 0.762 (0.695–0.829) * | 0.881 (0.814–0.947) *** | 0.688 (0.621–0.754) ** | 0.747 (0.680–0.814) ** |
| CKD-EPI in pts 65–74 y | 0.396 (0.329–0.462) | 0.727 (0.660–0.793) ** | 0.717 (0.650–0.784) ** | 0.646 (0.579–0.712) ** | 0.671 (0.604–0.738)** |
| CKD-EPI in pts 75–84 y | 0.486 (0.410–0.553) * | 0.512 (0.445–0.578) * | 0.652 (0.585–0.719) ** | 0.557 (0.490–0.623) * | 0.560 (0.593–0.627) * |
| CKD-EPI in pts ≥85 y | 0.413 (0.346–0.480) * | 0.350 (0.283–0.417) | 0.588 (0.501–0.635) * | 0.568 (0.501–0.634) * | 0.422 (0.355–0.489) * |
| Whole Population (n 806) | ||||||
| Deaths n (%) | HR (95% CI) | AUC | p | IDI% | p | |
| CKD-EPI <60 mL/min/1.73 m2 | 45 (68.2) | 3.97 (2.24–7.04) | 0.769 | ref | ref | NA |
| CG <60 mL/min | 50 (75.8) | 4.62 (2.40–8.91) | 0.778 | 0.479 | −0.23 (−1.54–1.08) | 0.733 |
| CG-BSA <60 mL/min/1.73 m2 | 49 (74.2) | 3.30 (1.72–6.32) | 0.779 | 0.256 | 0.54 (−0.8–1.88) | 0.431 |
| MDRD <60 mL/min/1.73 m2 | 41 (62.1) | 3.82 (2.22–6.59) | 0.750 | 0.005 | −0.43 (−1.14–0.28) | 0.232 |
| BIS-1 <60 mL/min/1.73 m2 | 51 (77.3) | 3.43 (1.75–6.71) | 0.782 | 0.035 | 1.63 (0.51–2.75) | 0.004 |
| FAS <60 mL/min/1.73 m2 | 51 (77.3) | 3.70 (1.90–7.17) | 0.776 | 0.001 | 1.40 (0.28–2.51) | 0.014 |
| Patients aged ≥75 years (n 344) | ||||||
| Deaths n (%) | HR (95% CI) | AUC | p | IDI% | p | |
| CKD-EPI <60 mL/min/1.73 m2 | 36 (76.6) | 3.18 (1.58–6.40) | 0.705 | ref | ref | NA |
| CG <60 mL/min | 42 (89.4) | 4.61 (1.78–11.96) | 0.725 | 0.261 | 0.79 (−0.89–2.47) | 0.358 |
| CG-BSA <60 mL/min/1.73 m2 | 41 (87.2) | 2.69 (1.11–6.51) | 0.717 | 0.255 | 0.94 (−0.93–2.81) | 0.326 |
| MDRD <60 mL/min/1.73 m2 | 32 (68.1) | 2.84 (1.49–5.42) | 0.698 | 0.023 | −0.82 (−1.92–0.28) | 0.145 |
| BIS-1 <60 mL/min/1.73 m2 | 41 (87.2) | 2.30 (0.95–5.57) | 0.707 | 0.553 | 3.26 (1.65–4.87) | <0.001 |
| FAS <60 mL/min/1.73 m2 | 41 (87.2) | 2.67 (1.10–6.51) | 0.706 | 0.692 | 2.73 (1.16–4.31) | <0.001 |
Publisher’s Note: MDPI stays neutral with regard to jurisdictional claims in published maps and institutional affiliations. |
© 2022 by the authors. Licensee MDPI, Basel, Switzerland. This article is an open access article distributed under the terms and conditions of the Creative Commons Attribution (CC BY) license (https://creativecommons.org/licenses/by/4.0/).
Share and Cite
Malavasi, V.L.; Valenti, A.C.; Ruggerini, S.; Manicardi, M.; Orlandi, C.; Sgreccia, D.; Vitolo, M.; Proietti, M.; Lip, G.Y.H.; Boriani, G. Kidney Function According to Different Equations in Patients Admitted to a Cardiology Unit and Impact on Outcome. J. Clin. Med. 2022, 11, 891. https://0-doi-org.brum.beds.ac.uk/10.3390/jcm11030891
Malavasi VL, Valenti AC, Ruggerini S, Manicardi M, Orlandi C, Sgreccia D, Vitolo M, Proietti M, Lip GYH, Boriani G. Kidney Function According to Different Equations in Patients Admitted to a Cardiology Unit and Impact on Outcome. Journal of Clinical Medicine. 2022; 11(3):891. https://0-doi-org.brum.beds.ac.uk/10.3390/jcm11030891
Chicago/Turabian StyleMalavasi, Vincenzo Livio, Anna Chiara Valenti, Sara Ruggerini, Marcella Manicardi, Carlotta Orlandi, Daria Sgreccia, Marco Vitolo, Marco Proietti, Gregory Y. H. Lip, and Giuseppe Boriani. 2022. "Kidney Function According to Different Equations in Patients Admitted to a Cardiology Unit and Impact on Outcome" Journal of Clinical Medicine 11, no. 3: 891. https://0-doi-org.brum.beds.ac.uk/10.3390/jcm11030891