Quantitative Measurements of Breast Density Using Magnetic Resonance Imaging: A Systematic Review and Meta-Analysis

 ,
,
Abstract
:1. Introduction
2. Materials and Methods
2.1. Search Strategy and Eligibility Criteria
2.2. Data Extraction
2.3. Data Synthesis
2.4. Statistical Analysis
3. Results
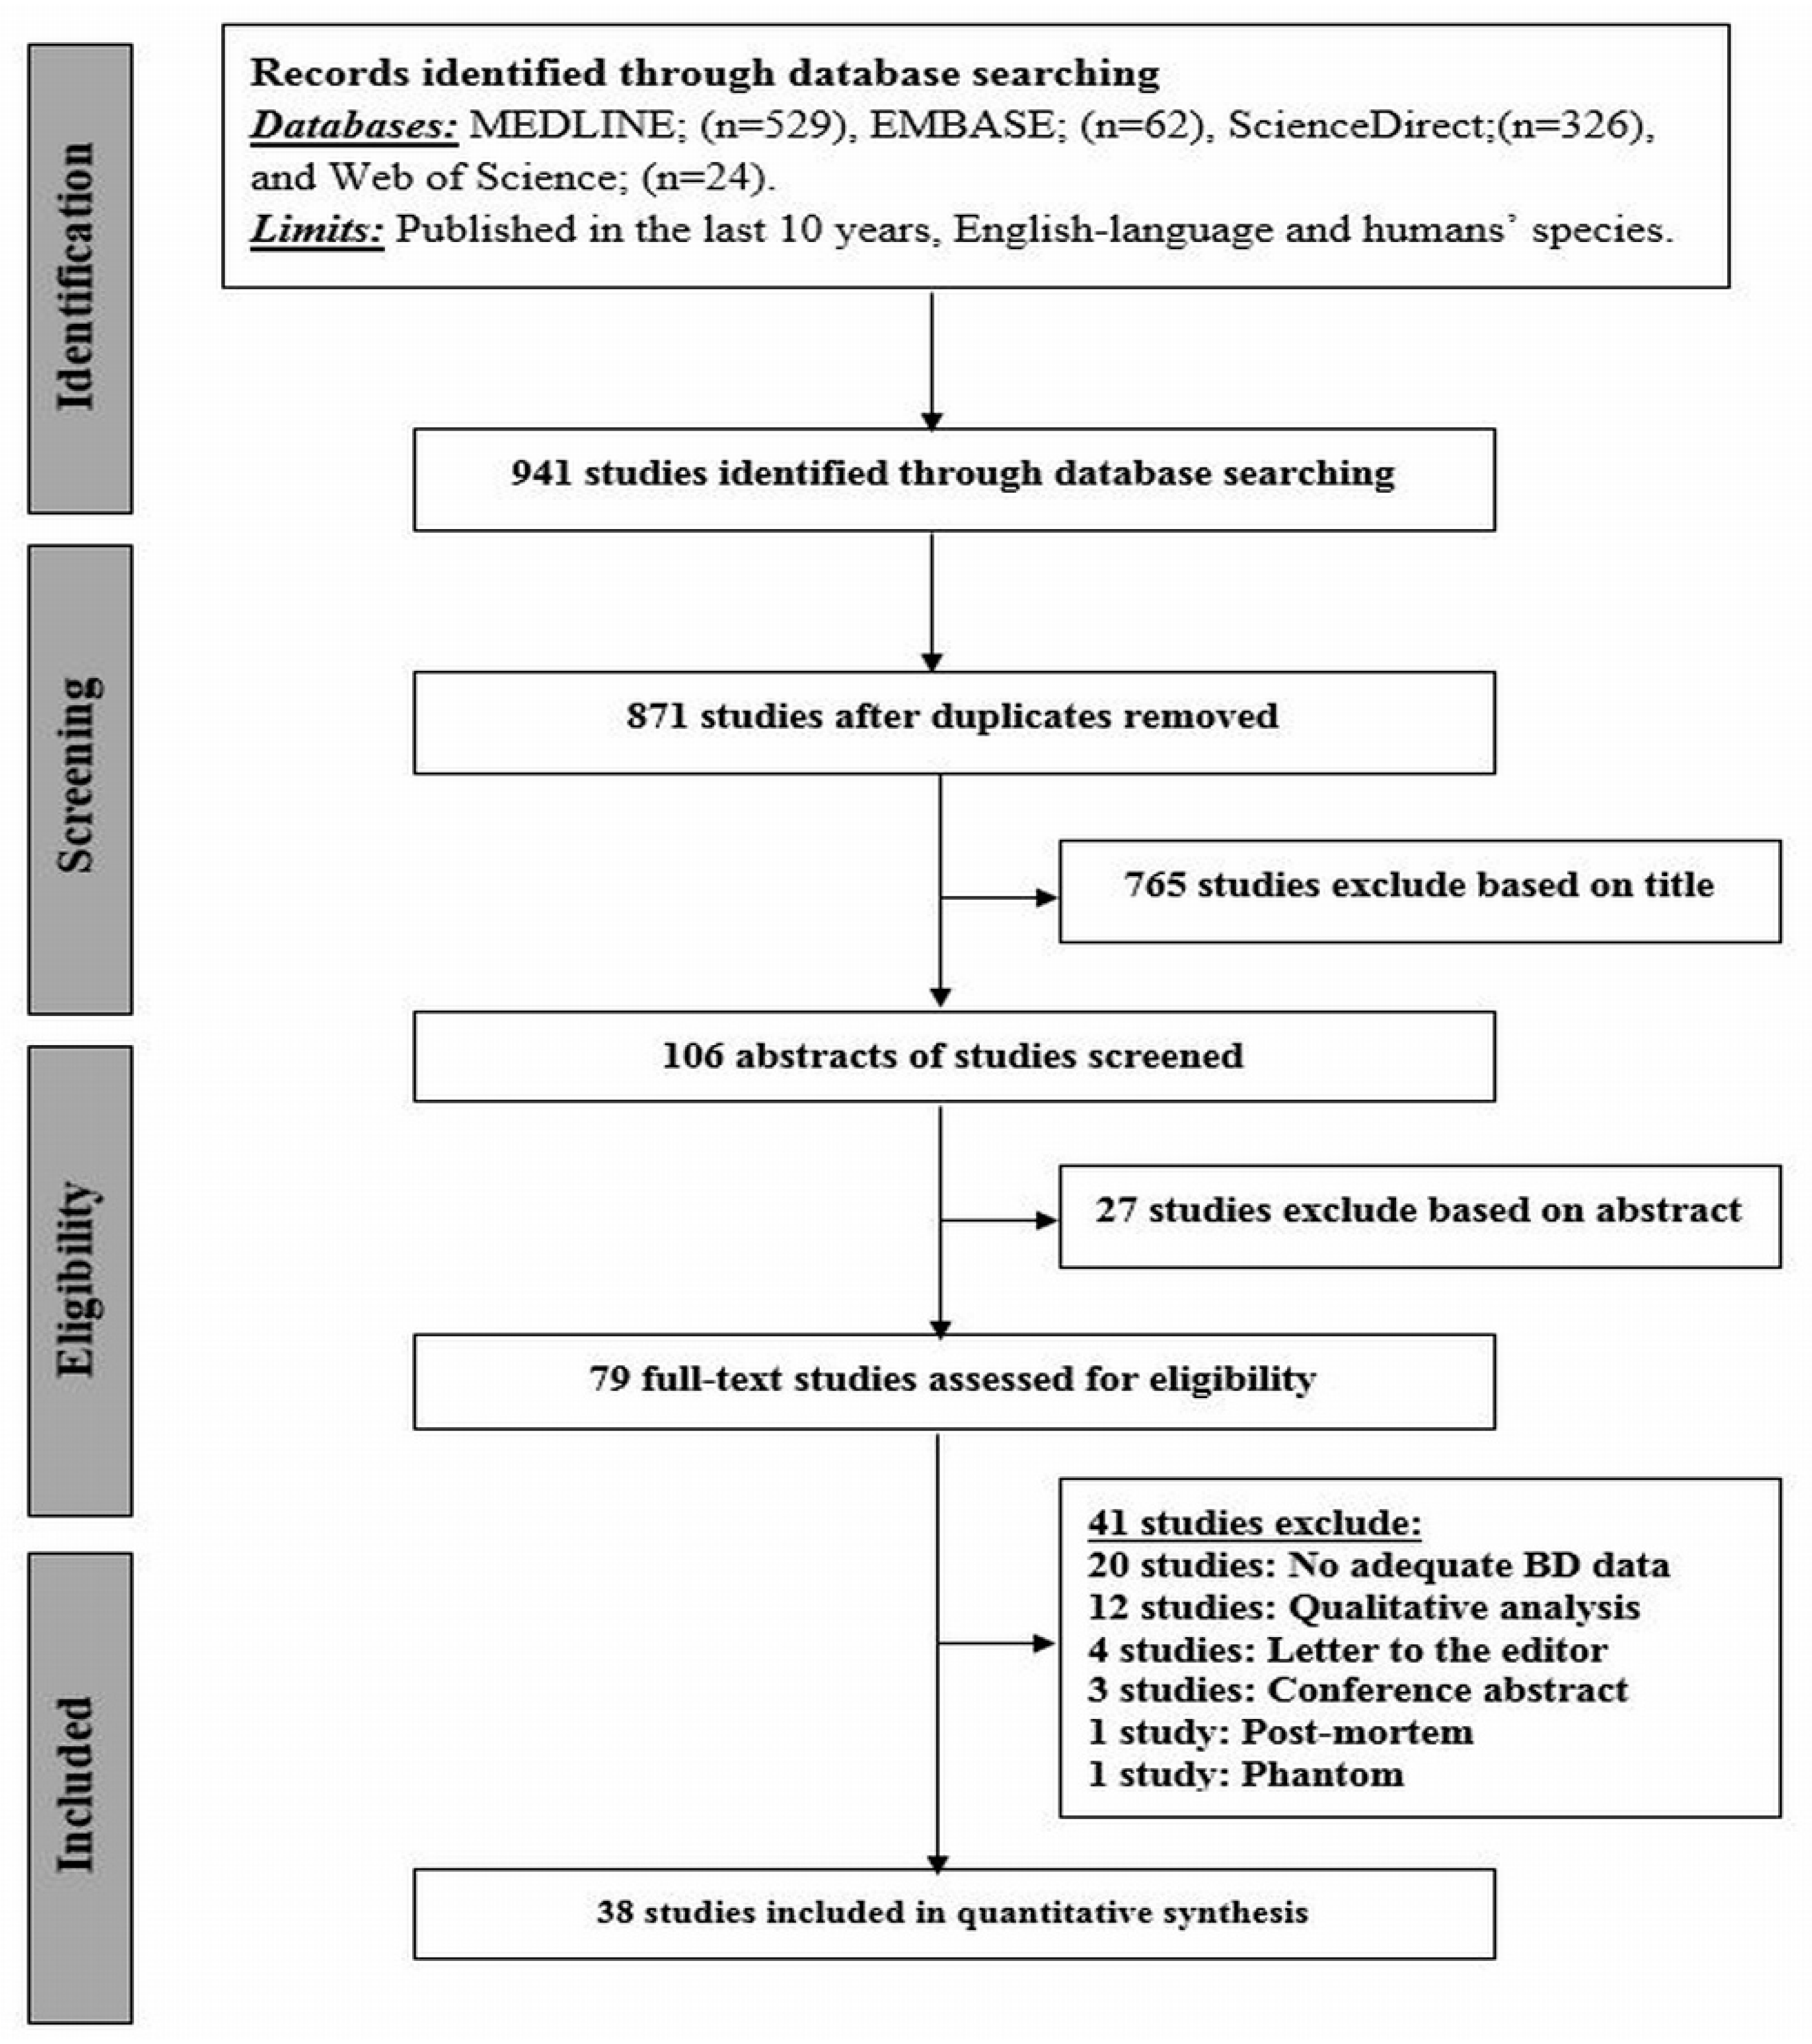
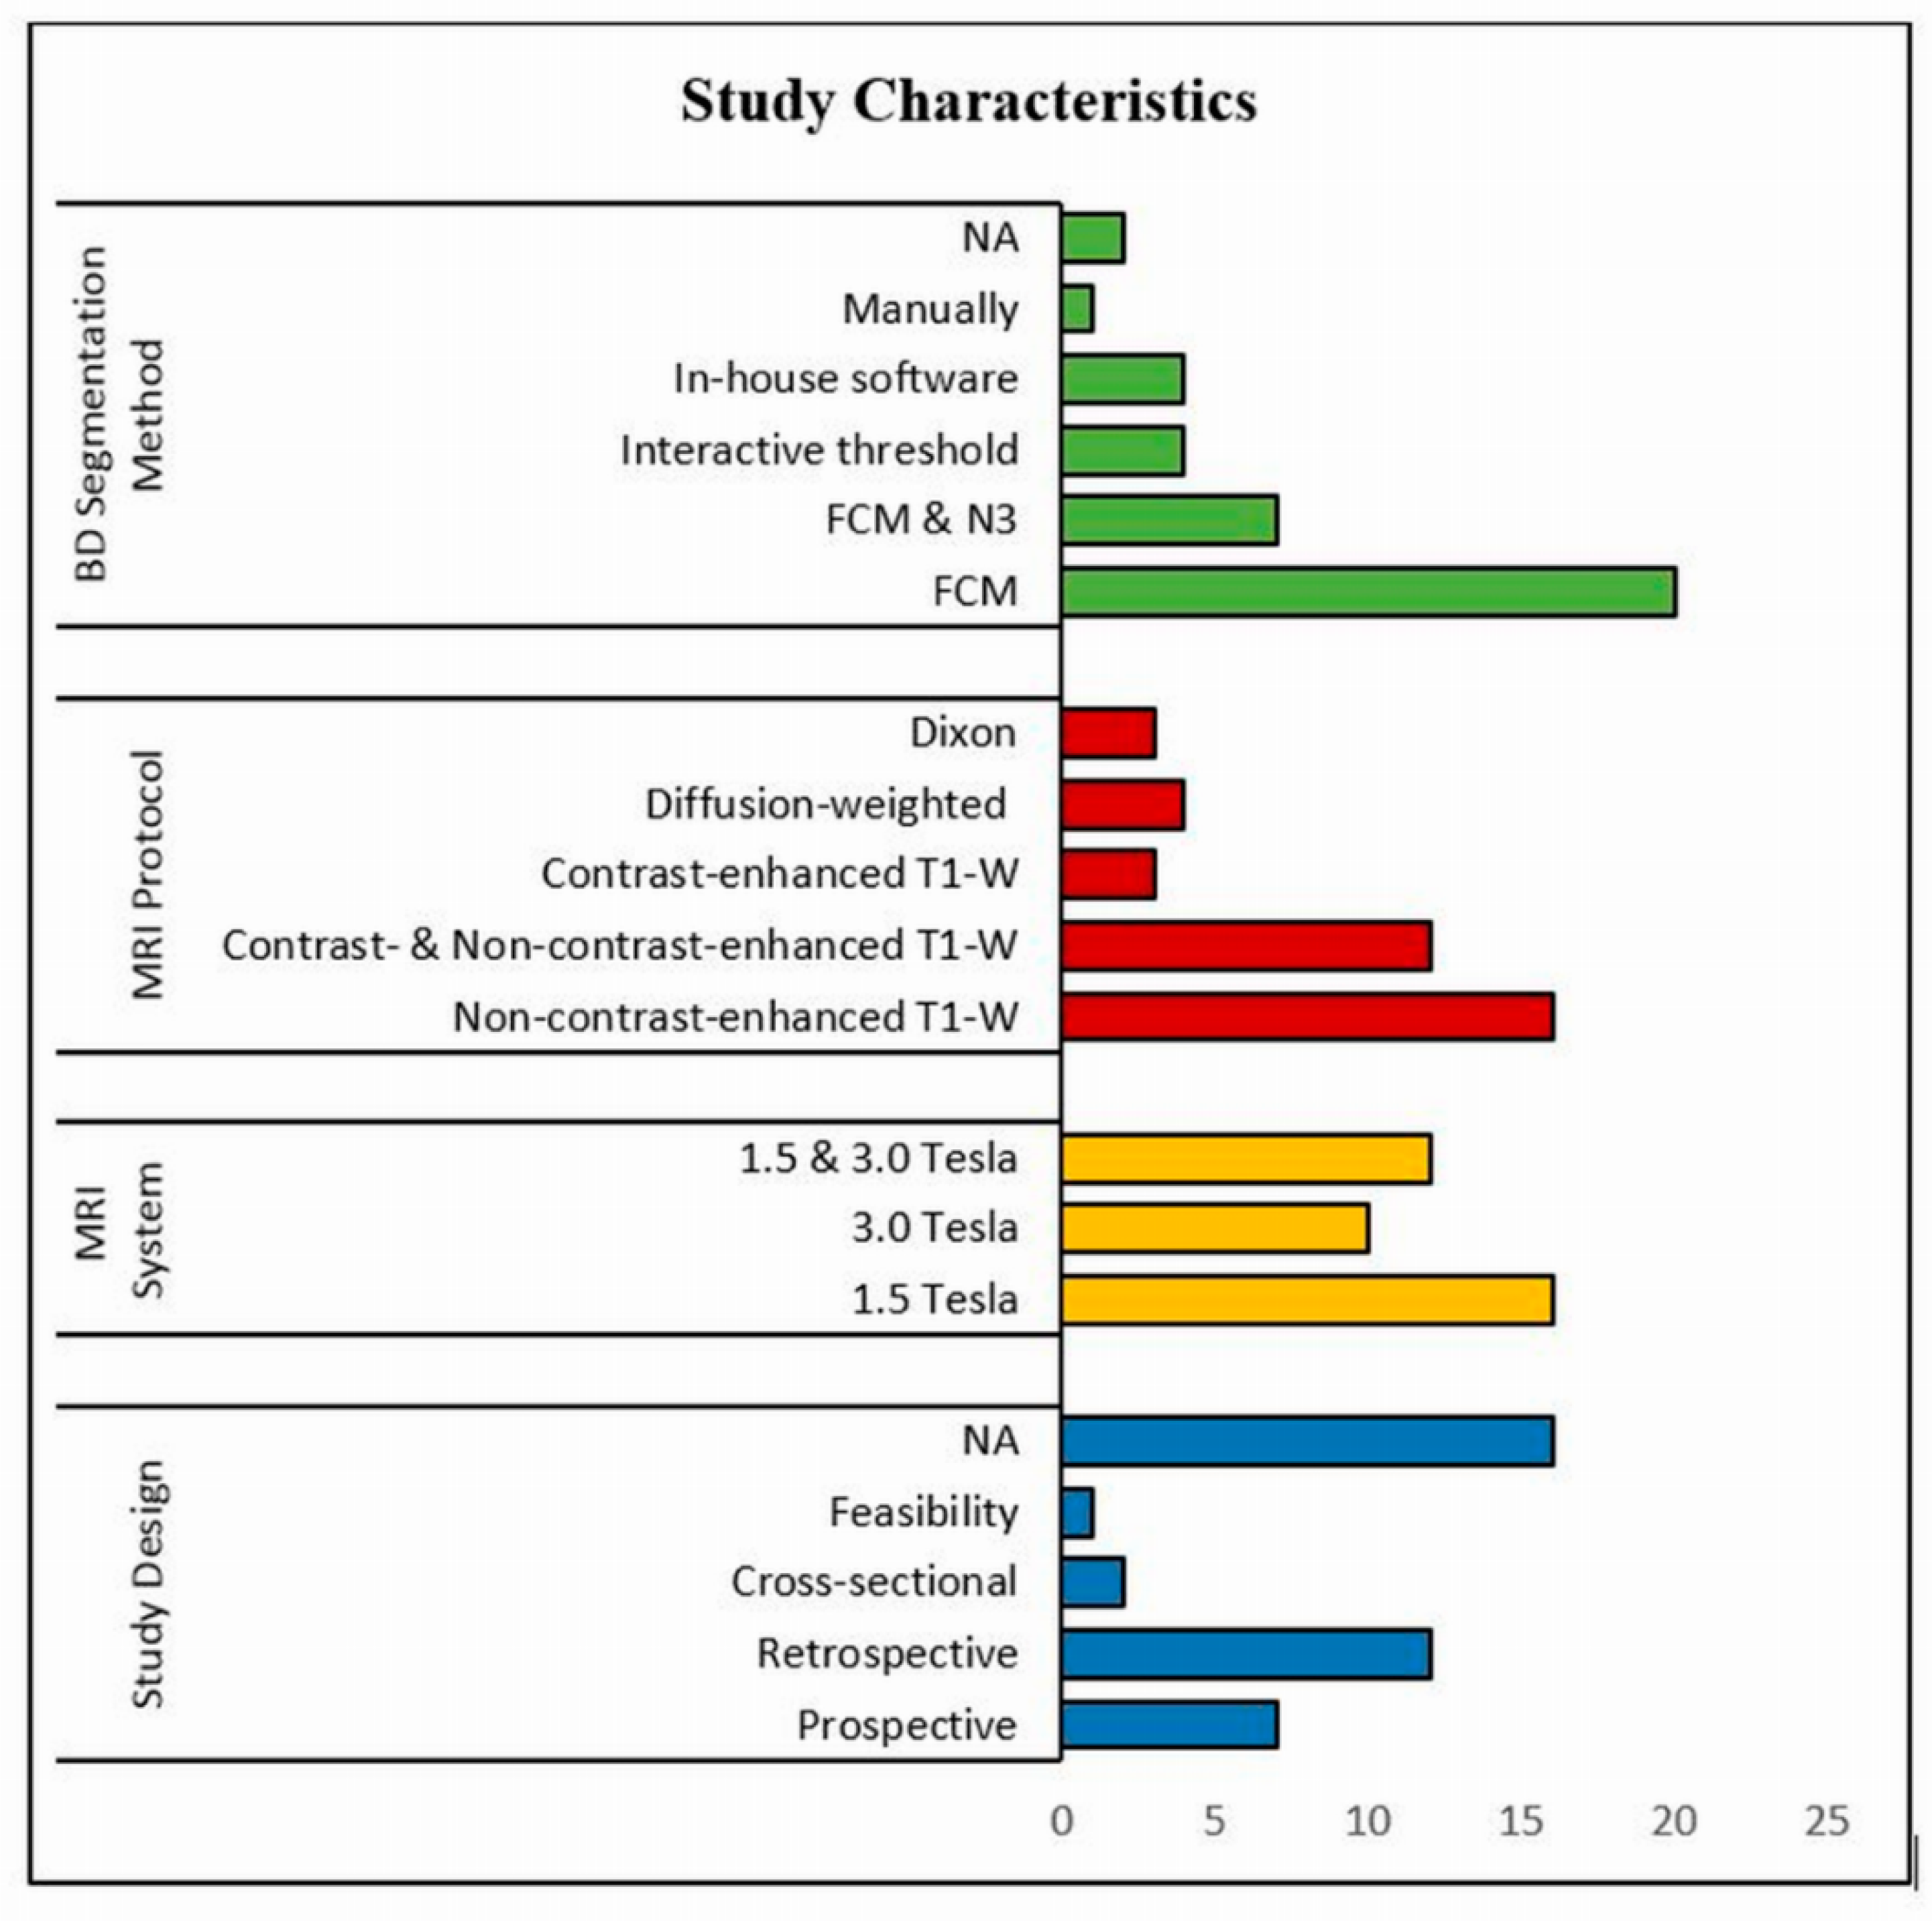
3.1. Literature Search
3.2. Systematic Review
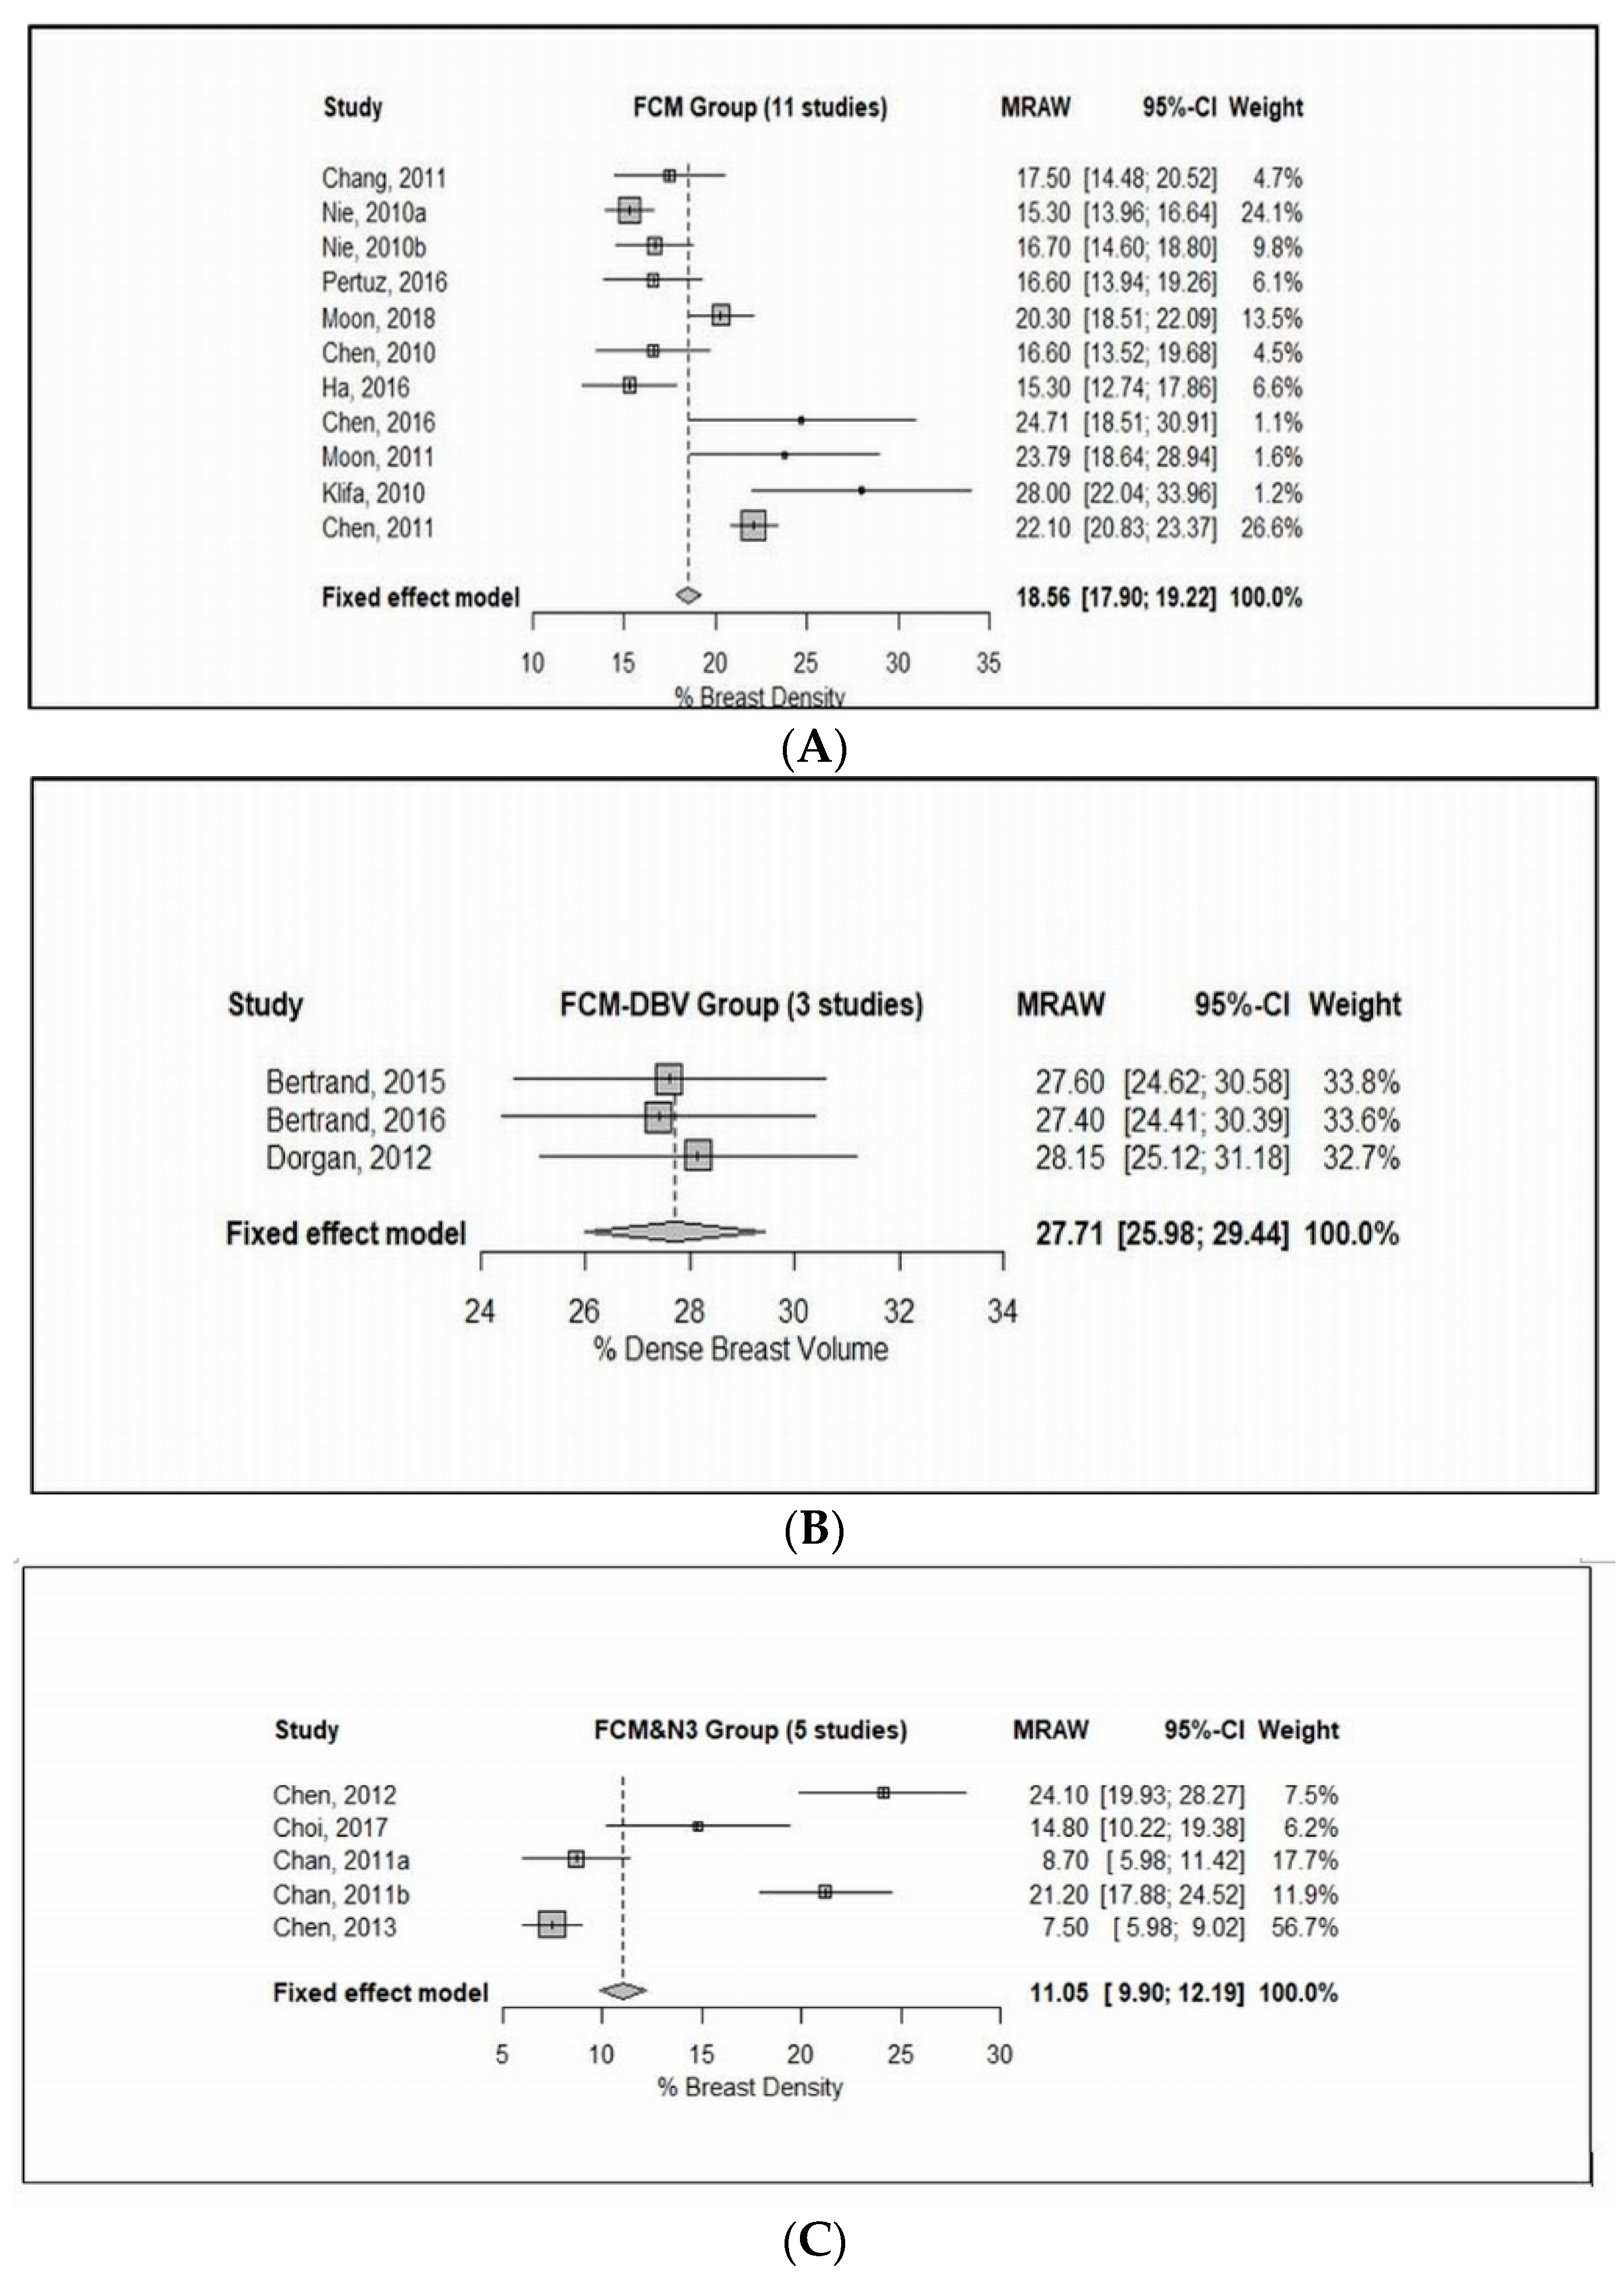
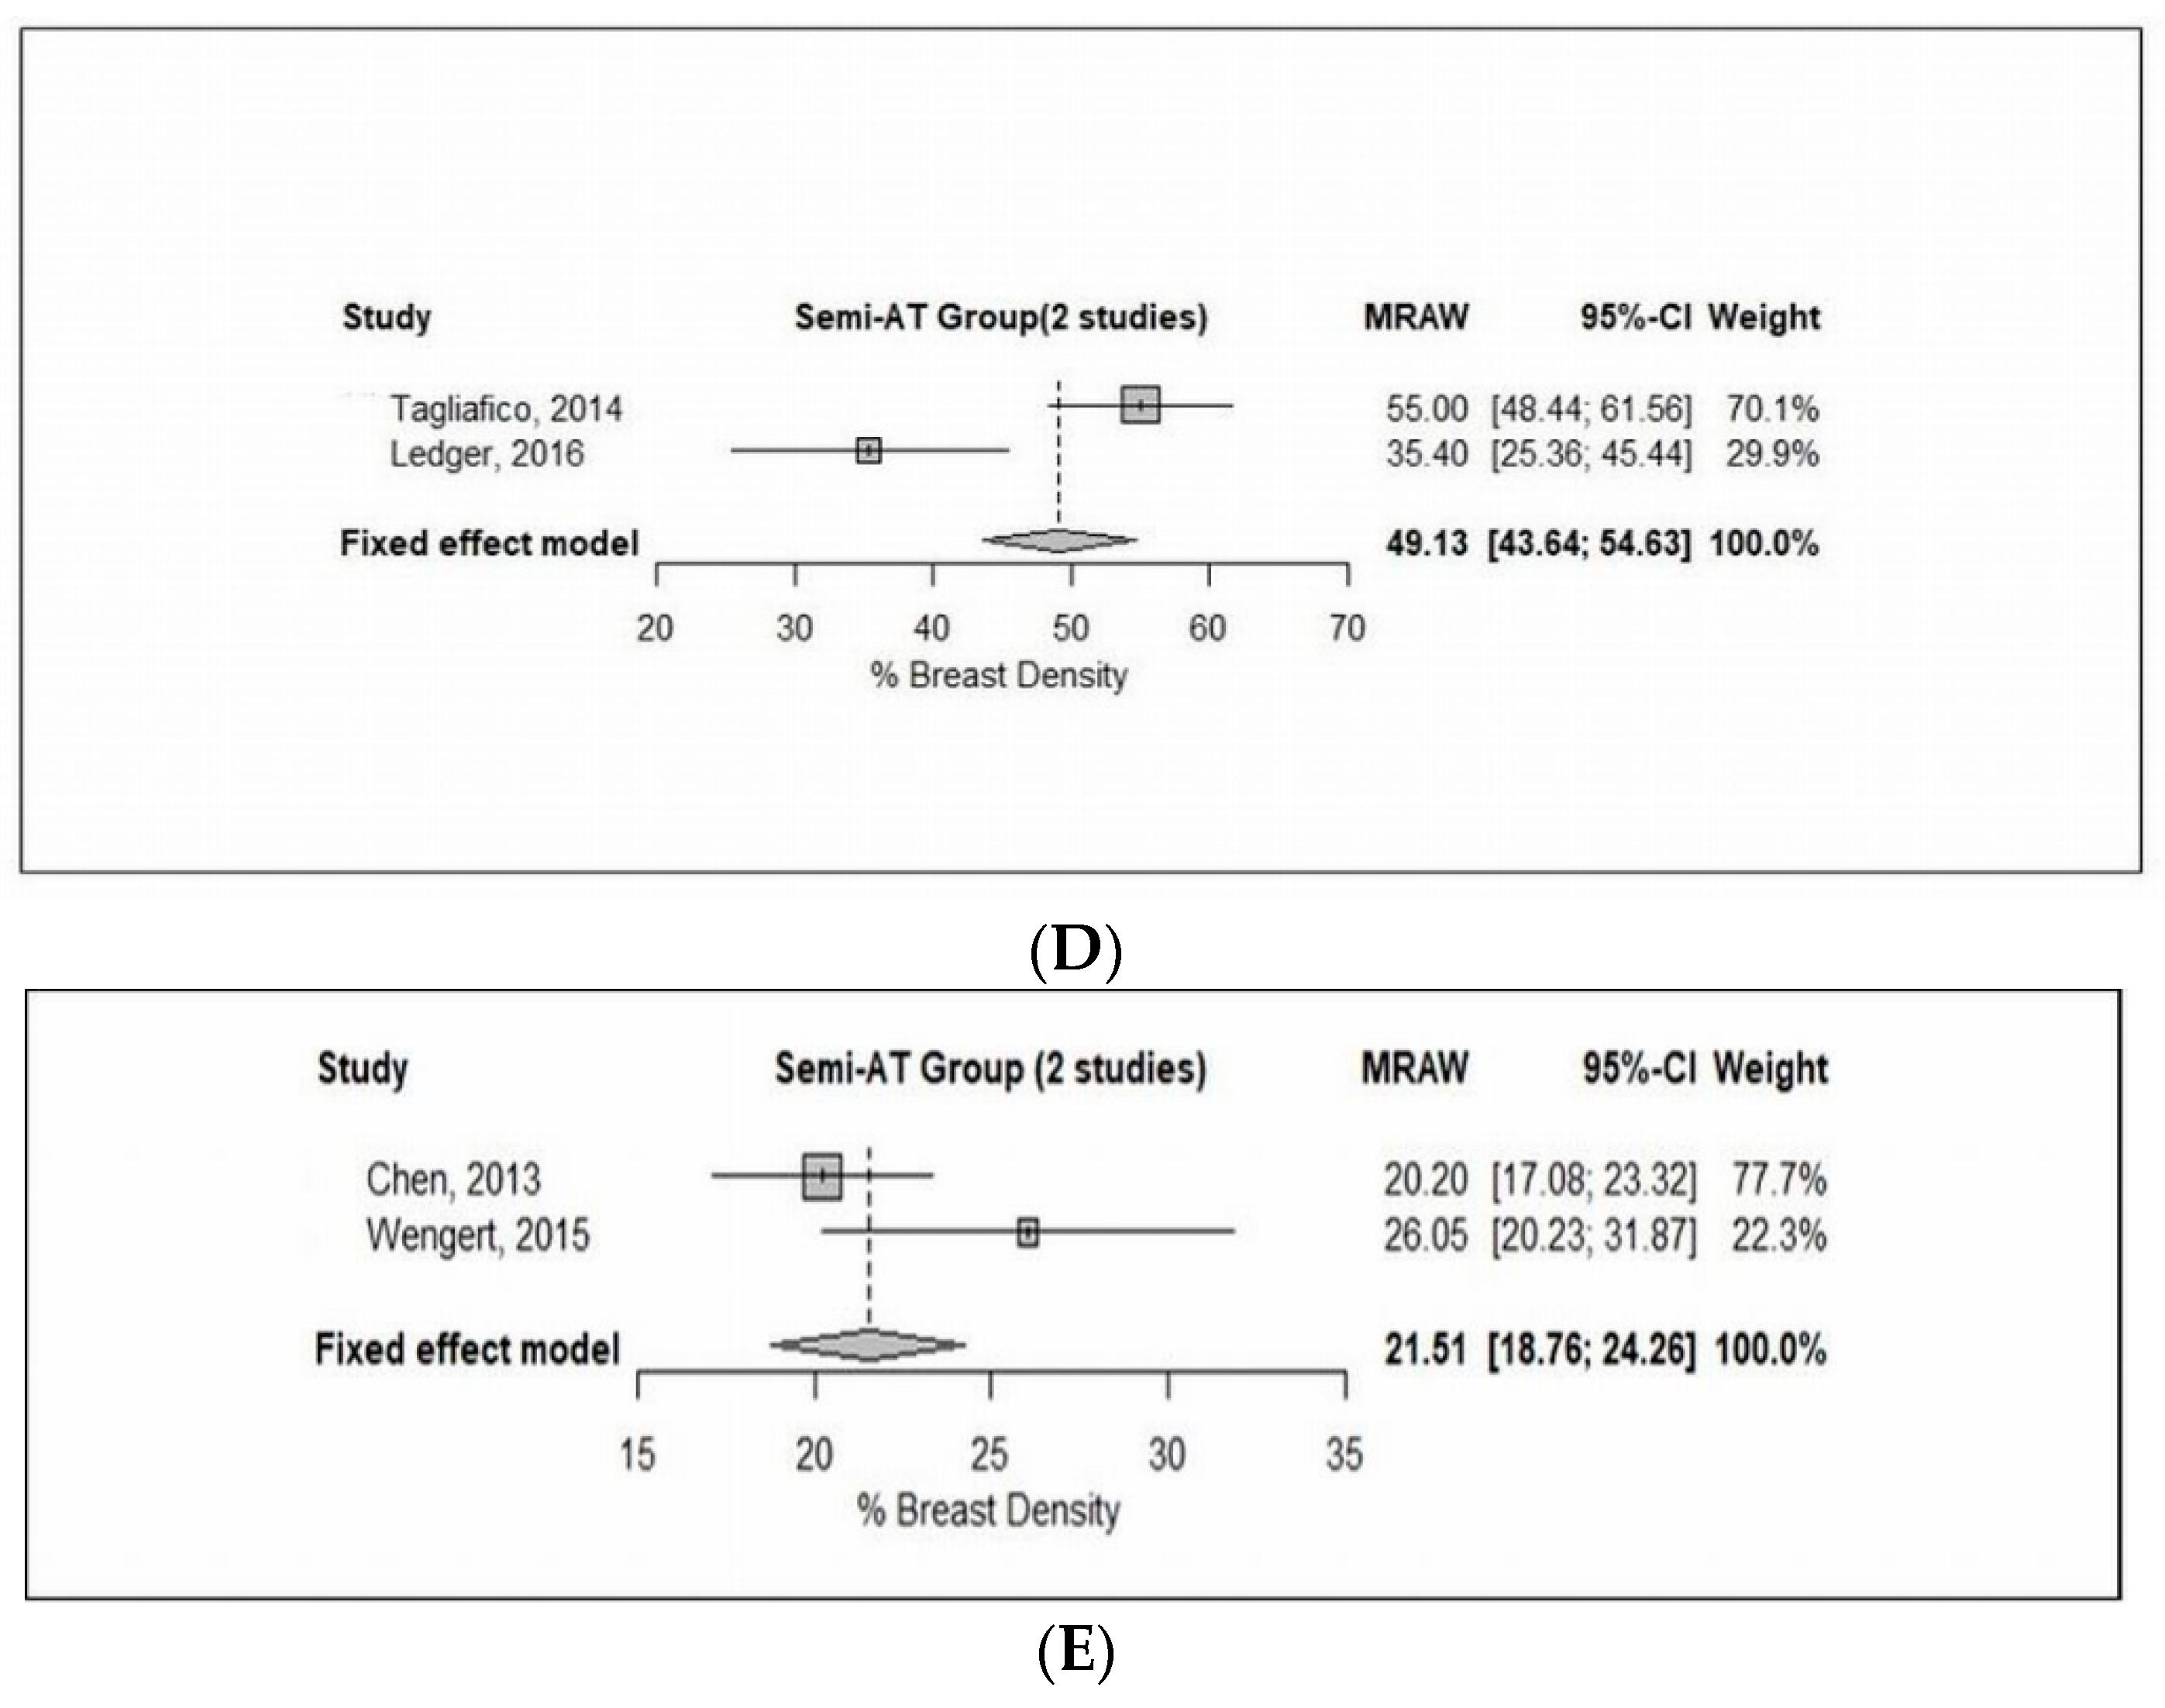
3.3. Subgroup Analyses
3.3.1. Fuzzy C-mean Clustering (FCM)
3.3.2. FCM and Nonparametric Nonuniformity Normalization (N3)
3.3.3. Interactive Semi-Automated Threshold
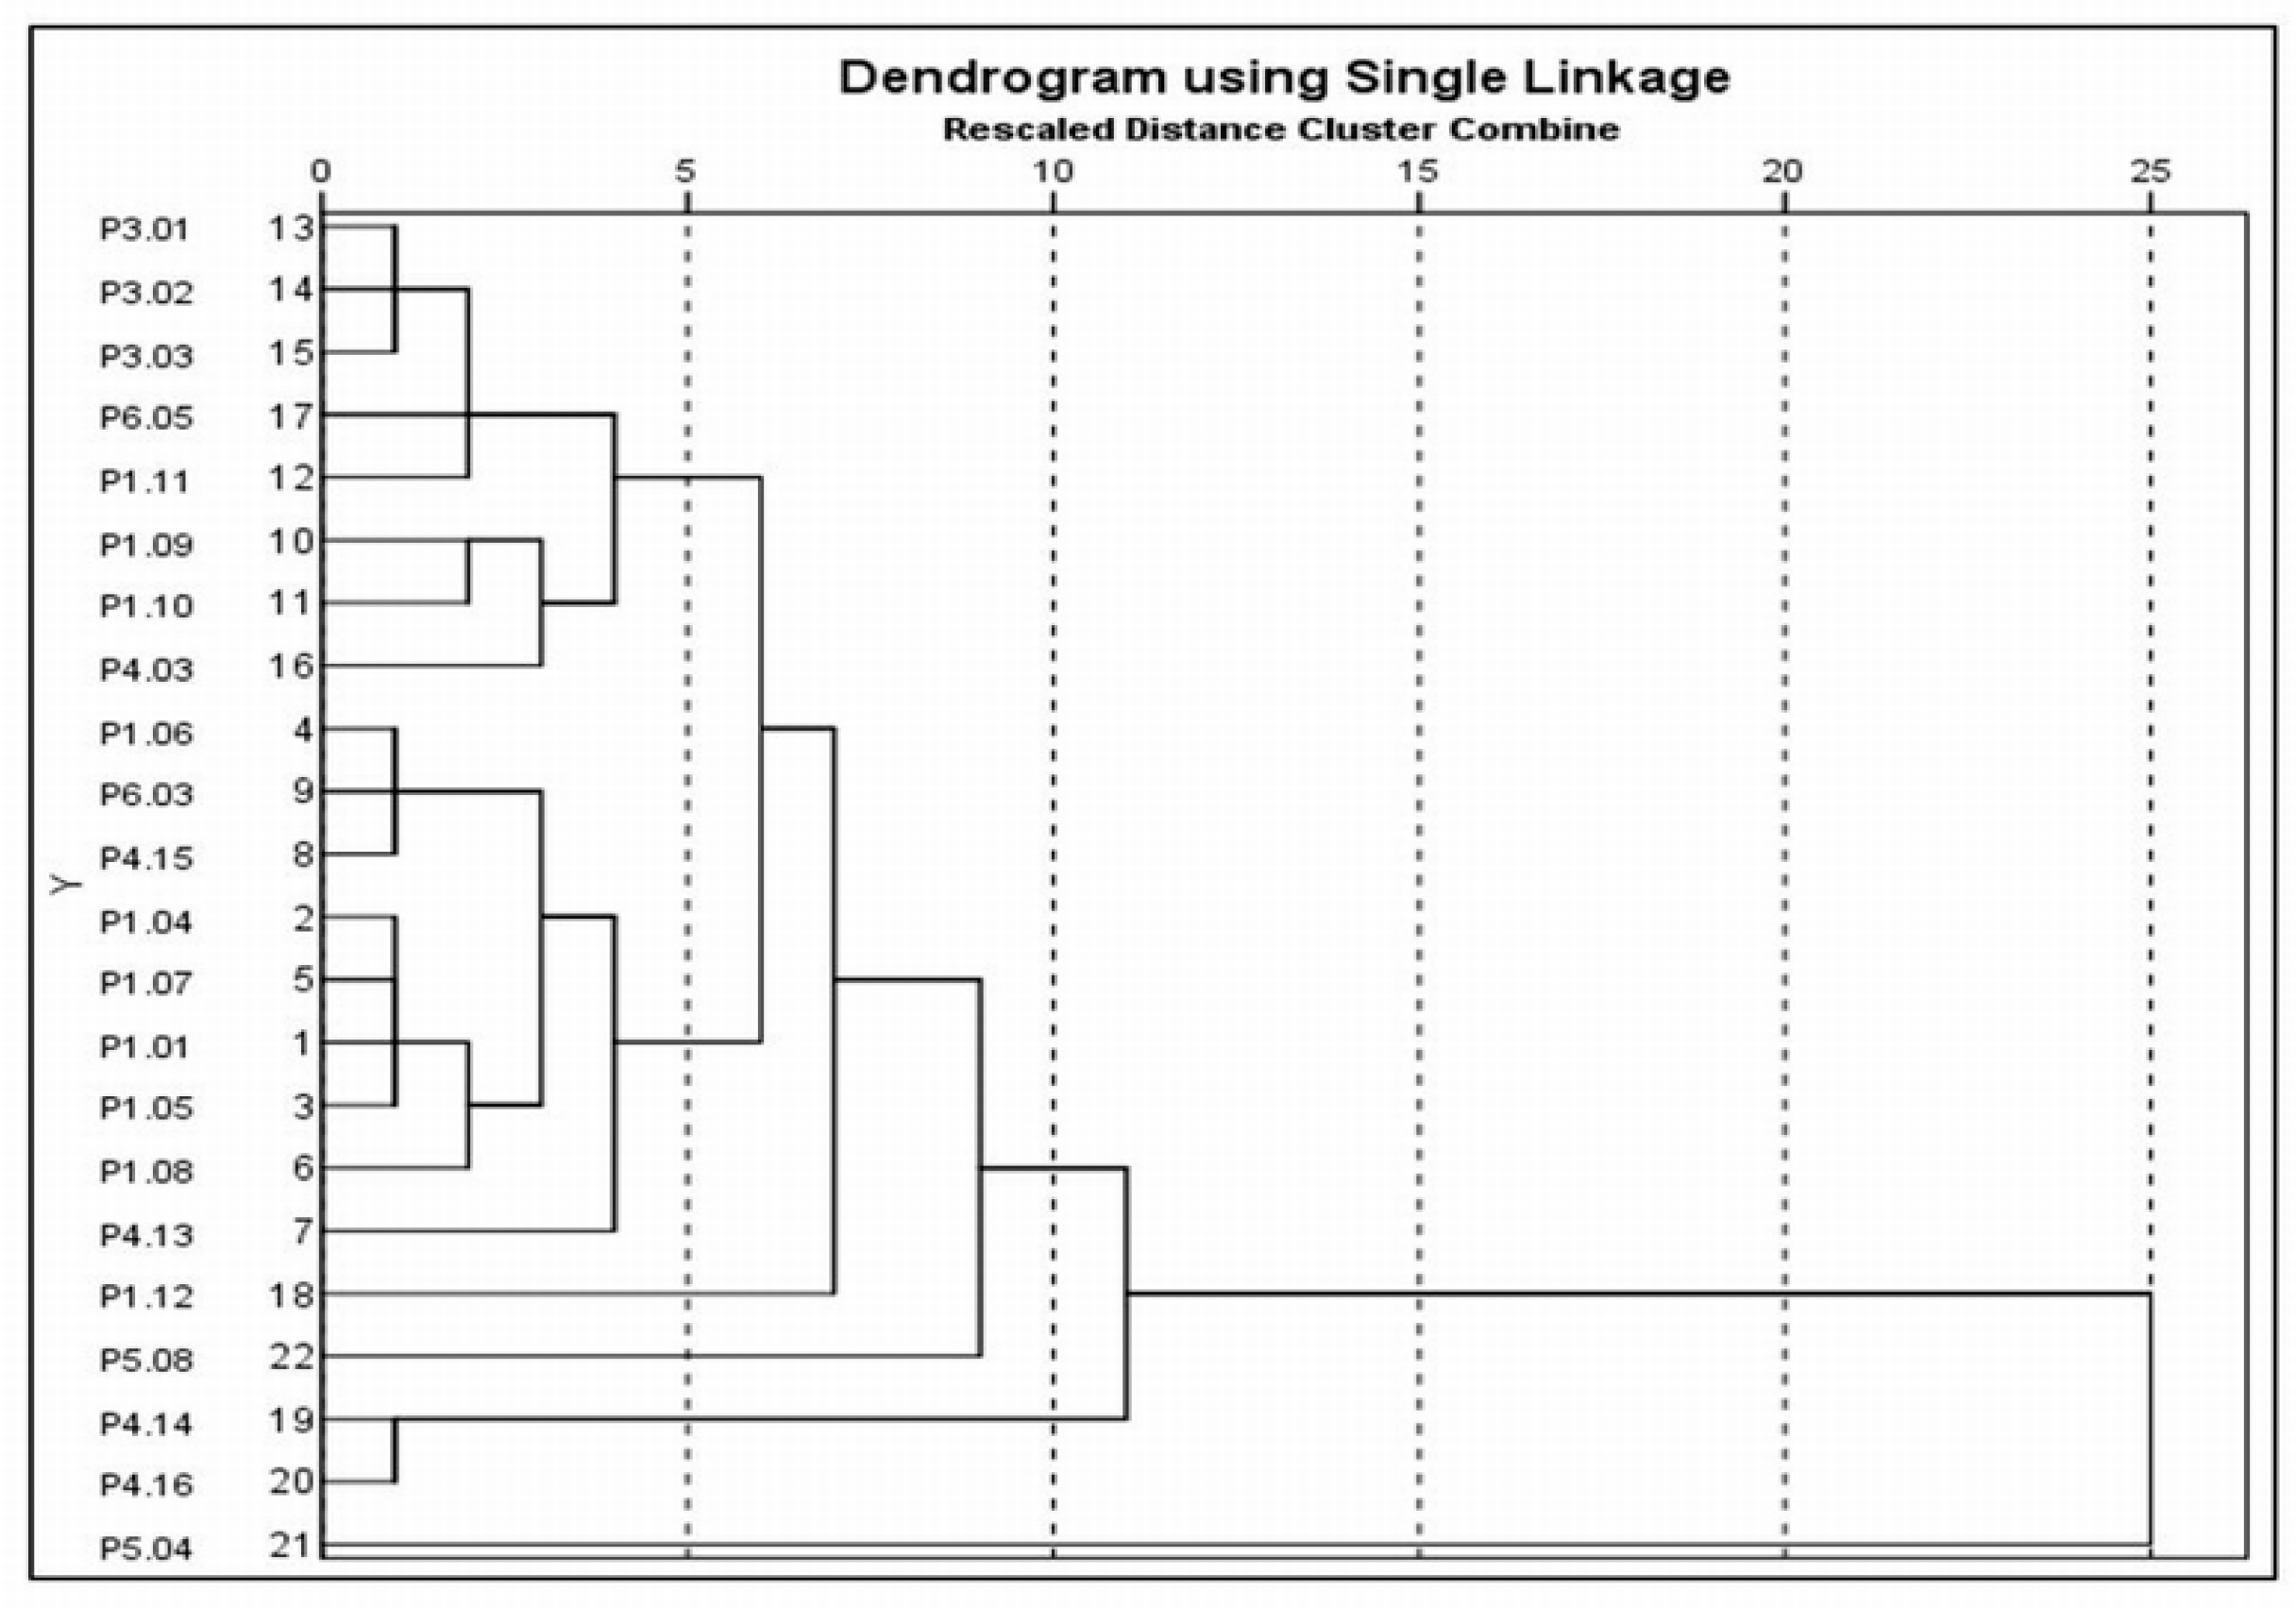
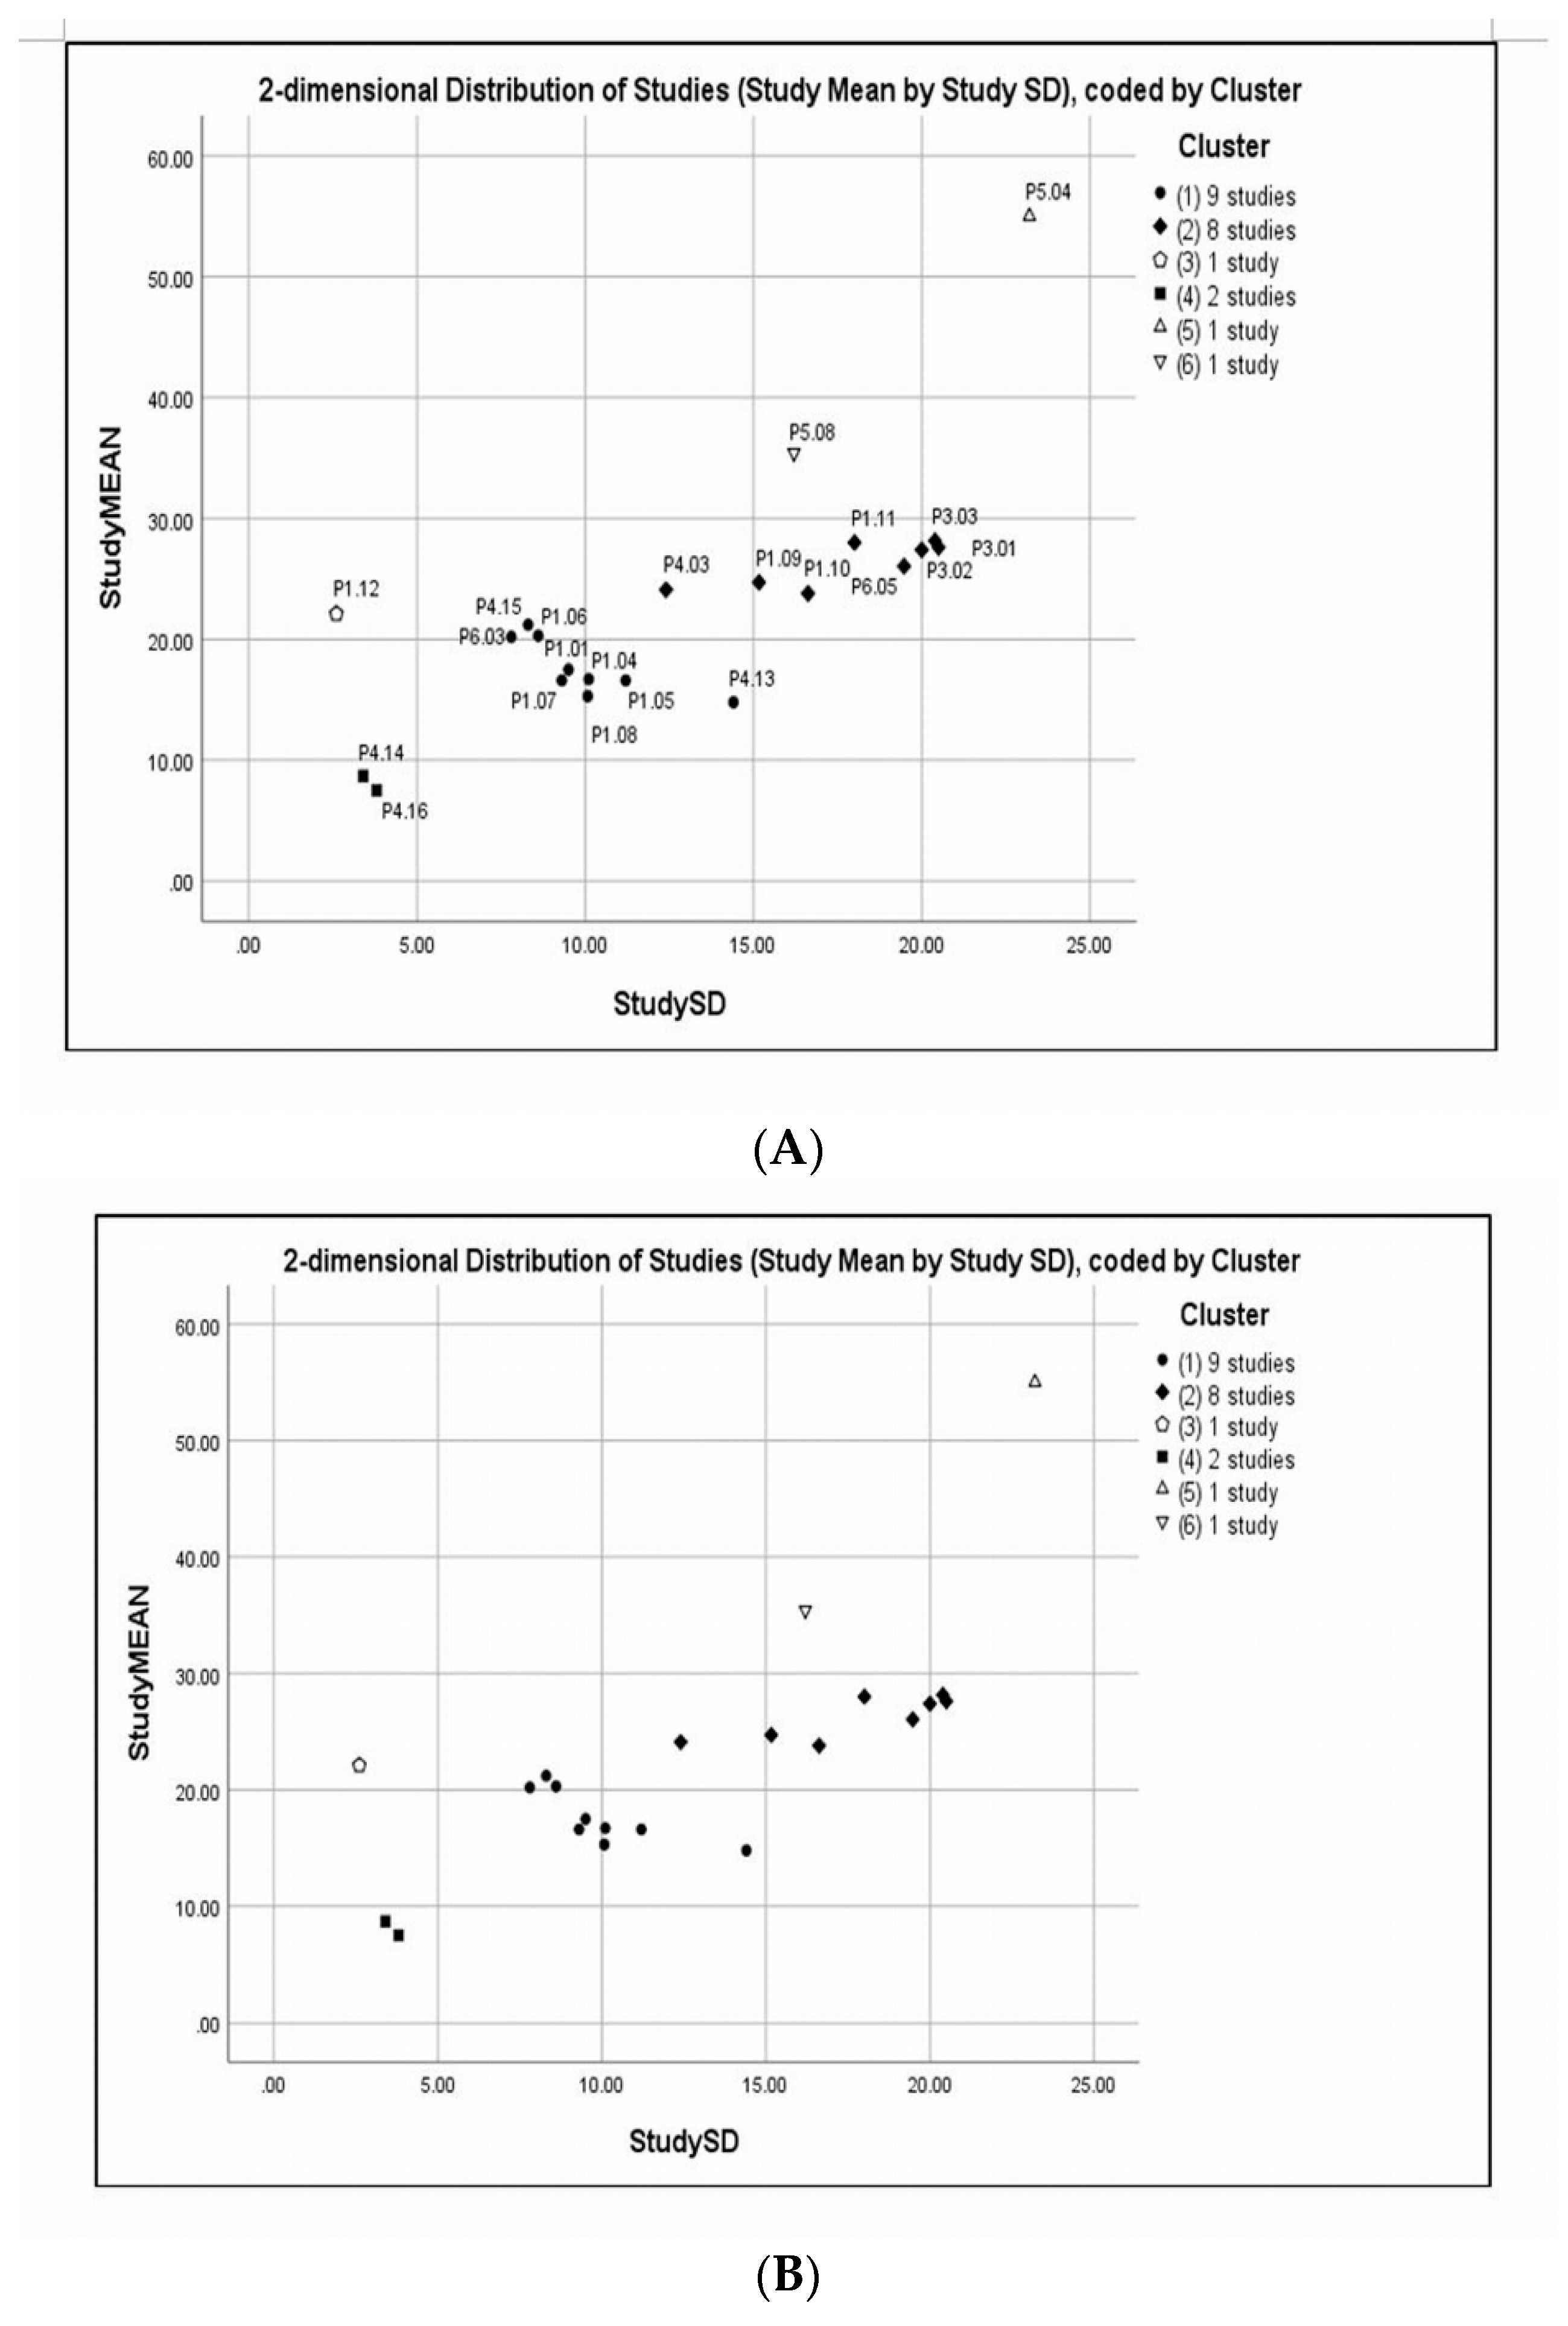
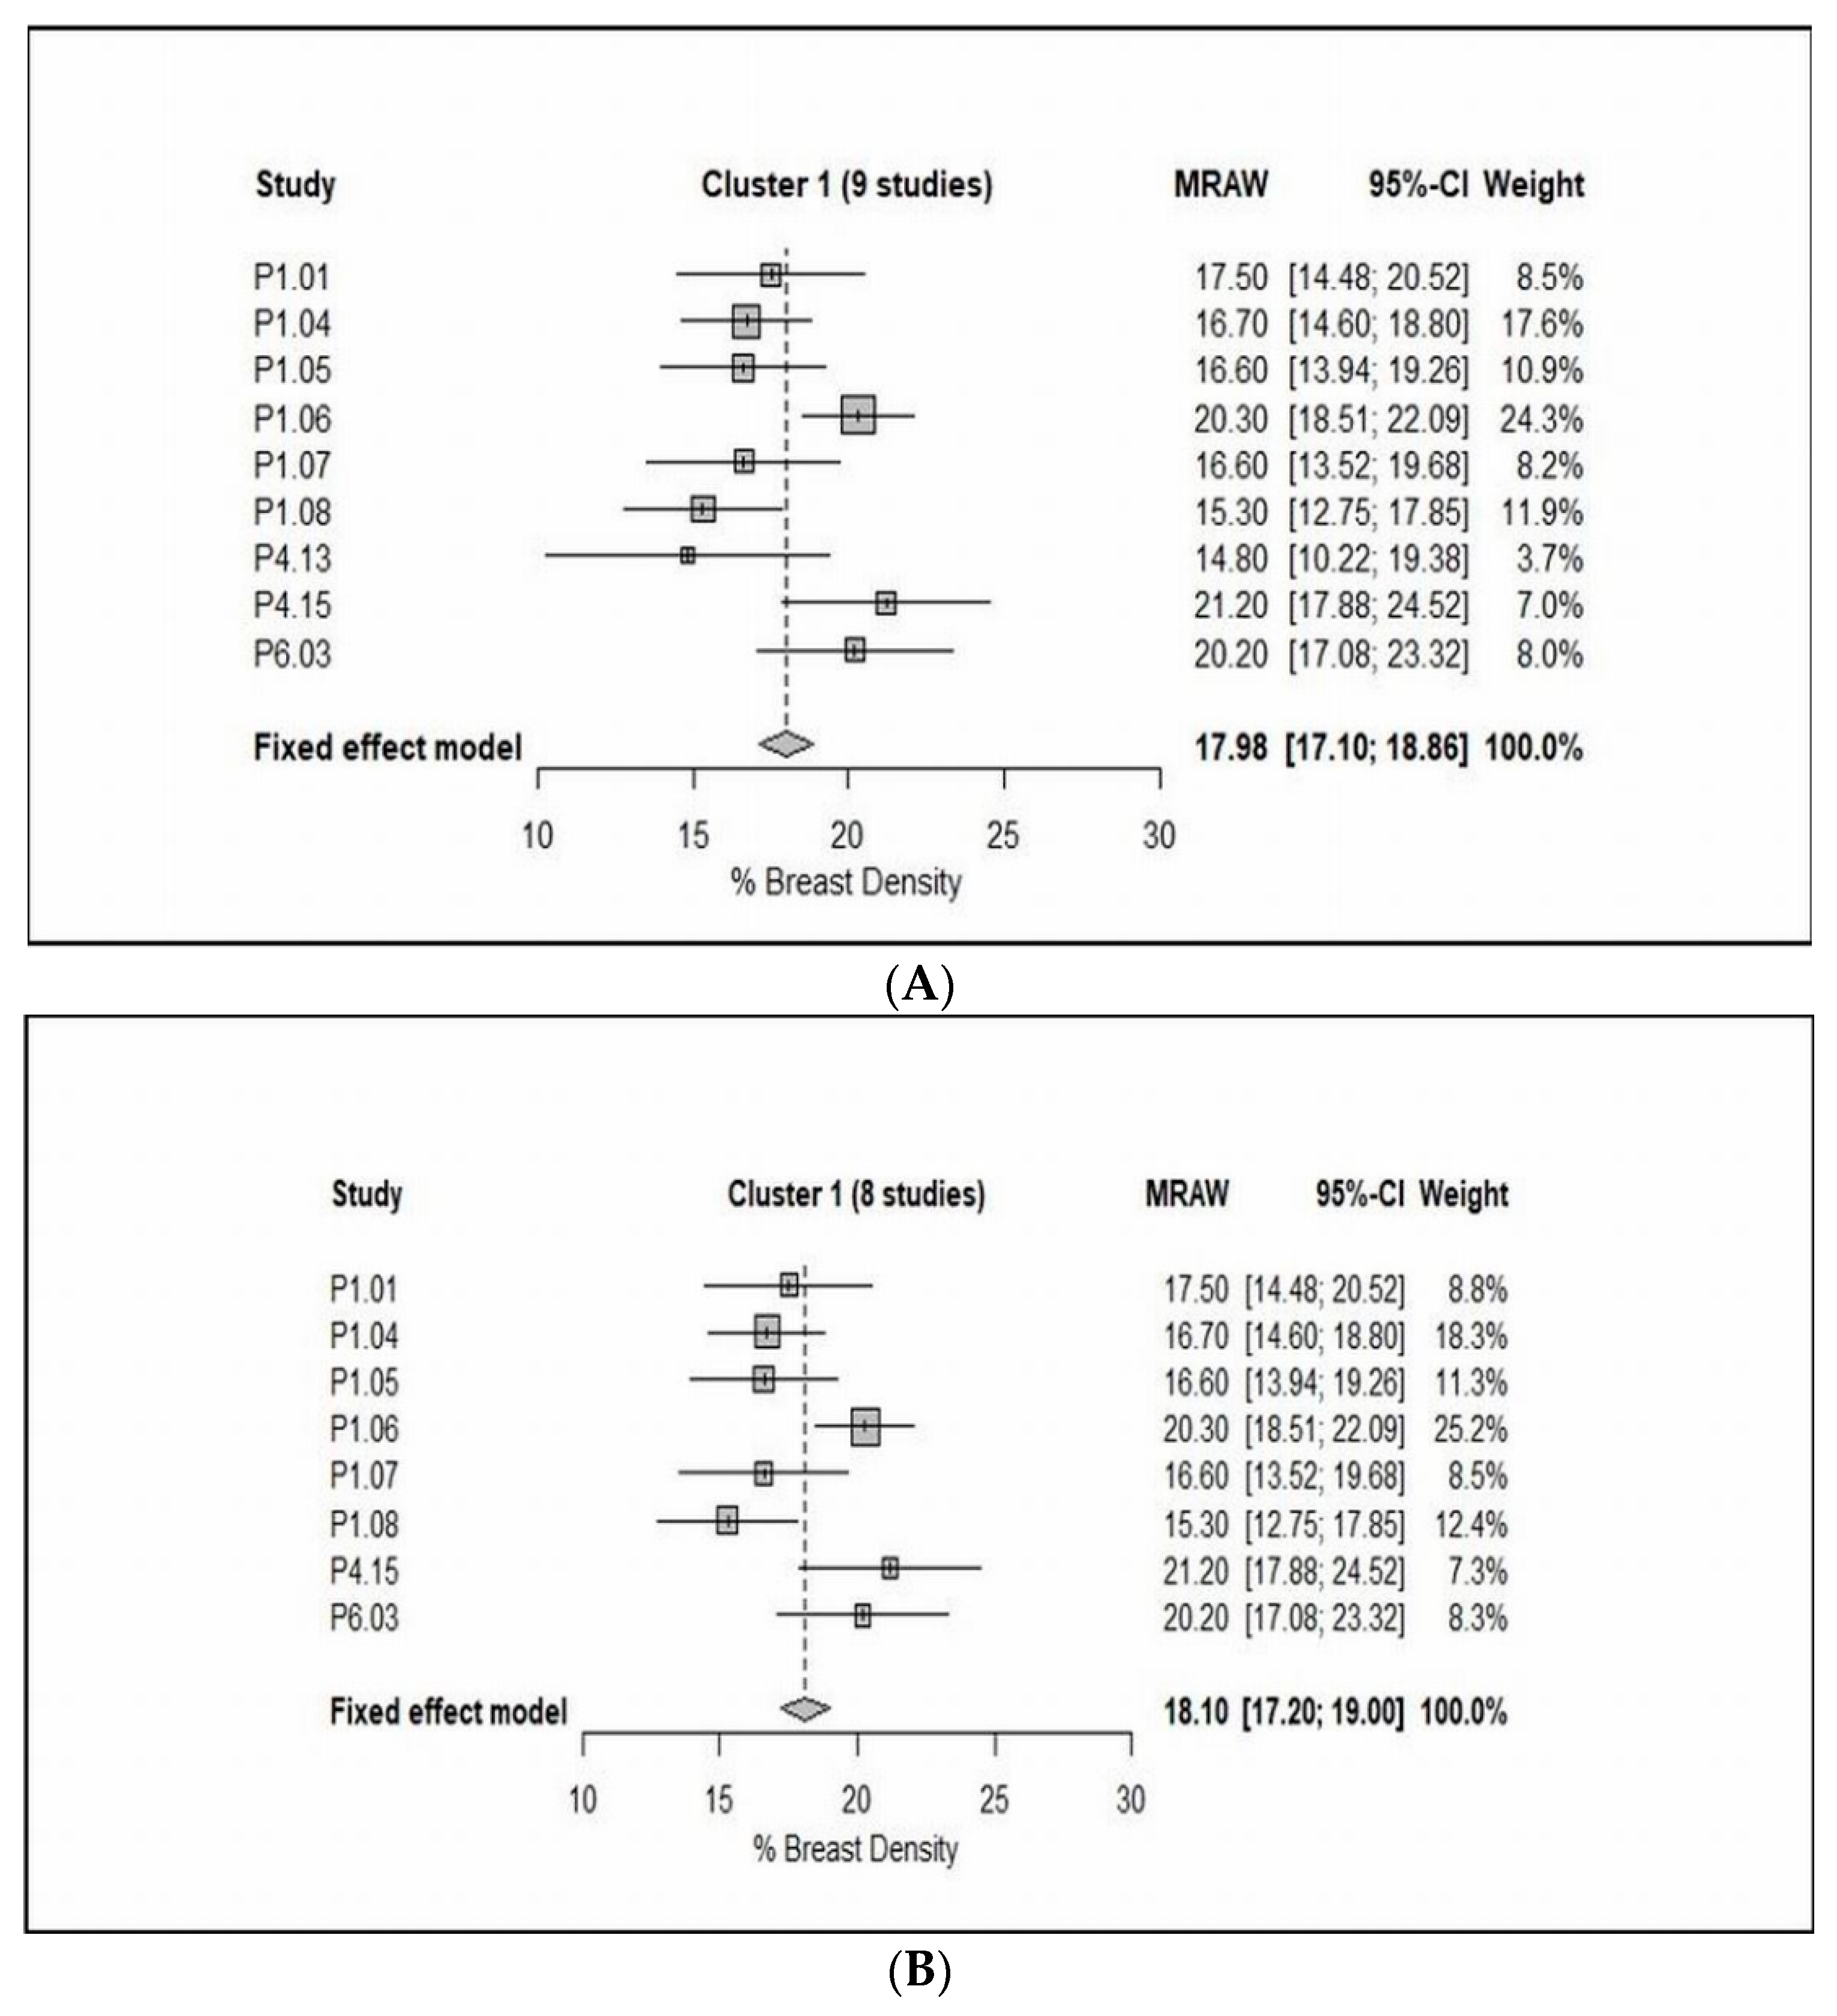
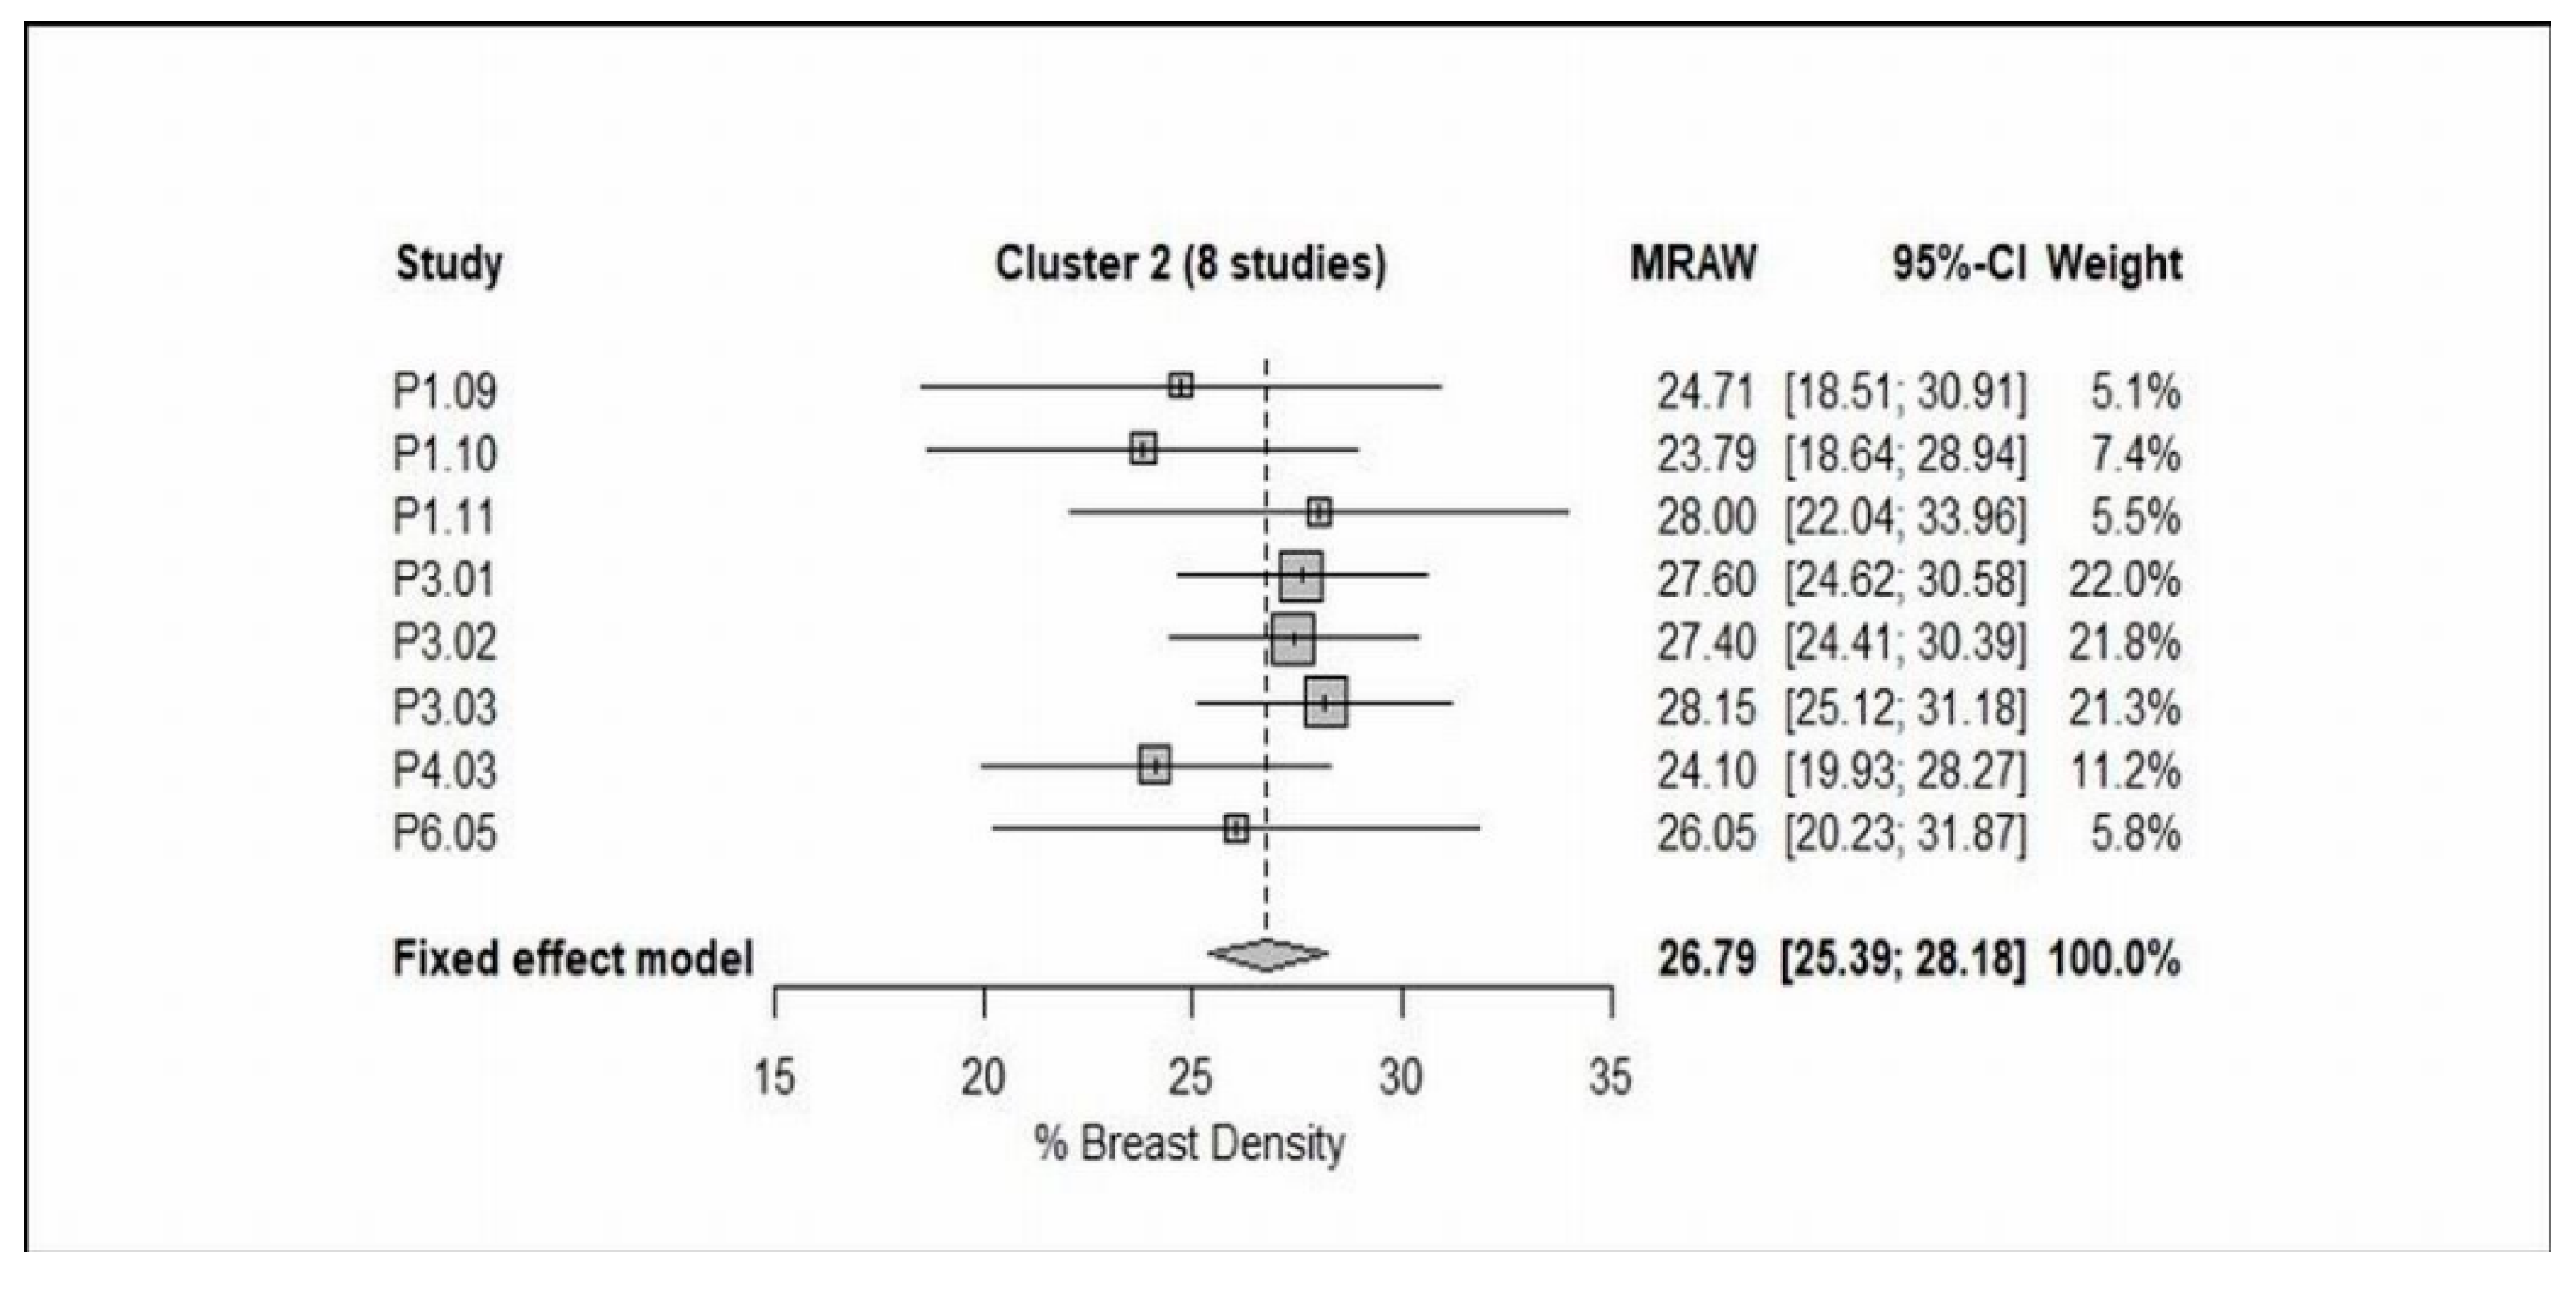
3.4. Cluster Analysis
4. Discussion
5. Conclusions
Author Contributions
Conflicts of Interest
References
- Chen, J.H.; Chang, Y.C.; Chang, D.; Wang, Y.T.; Nie, K.; Chang, R.F.; Nalcioglu, O.; Huang, C.S.; Su, M.Y. Reduction of breast density following tamoxifen treatment evaluated by 3-D MRI: Preliminary study. Magn. Reson. Imaging 2011, 29, 91–98. [Google Scholar] [CrossRef] [PubMed]
- Wang, J.; Azziz, A.; Fan, B.; Malkov, S.; Klifa, C.; Newitt, D.; Yitta, S.; Hylton, N.; Kerlikowske, K.; Shepherd, J.A. Agreement of mammographic measures of volumetric breast density to MRI. PLoS ONE 2013, 8, e81653. [Google Scholar] [CrossRef]
- Tagliafico, A.; Bignotti, B.; Tagliafico, G.; Astengo, D.; Martino, L.; Airaldi, S.; Signori, A.; Sormani, M.P.; Houssami, N.; Calabrese, M. Breast density assessment using a 3T MRI system: Comparison among different sequences. PLoS ONE 2014, 9, e99027. [Google Scholar] [CrossRef] [PubMed]
- Lienart, V.; Carly, B.; Kang, X.; Guzy, L.; Sajovitz, A.M.; Liebens, F. Effect of preventive hormonal therapy on breast density: A systematic qualitative review. Sci. World J. 2014, 2014, 942386. [Google Scholar] [CrossRef]
- Tagliafico, A.; Tagliafico, G.; Astengo, D.; Airaldi, S.; Calabrese, M.; Houssami, N. Comparative estimation of percentage breast tissue density for digital mammography, digital breast tomosynthesis, and magnetic resonance imaging. Breast Cancer Res. Treat. 2013, 138, 311–317. [Google Scholar] [CrossRef]
- Li, H.; Weiss, W.A.; Medved, M.; Abe, H.; Newstead, G.M.; Karczmar, G.S.; Giger, M.L. Breast density estimation from high spectral and spatial resolution MRI. J. Med. Imaging 2016, 3, 044507. [Google Scholar] [CrossRef] [PubMed] [Green Version]
- Wu, S.; Weinstein, S.P.; Conant, E.F.; Kontos, D. Automated fibroglandular tissue segmentation and volumetric density estimation in breast MRI using an atlas-aided fuzzy C-means method. Med. Phys. 2013, 40, 122302. [Google Scholar] [CrossRef] [Green Version]
- Ding, J.; Stopeck, A.T.; Gao, Y.; Marron, M.T.; Wertheim, B.C.; Altbach, M.I.; Galons, J.P.; Roe, D.J.; Wang, F.; Maskarinec, G.; et al. Reproducible automated breast density measure with no ionizing radiation using fat-water decomposition MRI. Magn. Reson. Imaging 2018, 48, 971–981. [Google Scholar] [CrossRef]
- Sak, M.A.; Littrup, P.J.; Duric, N.; Mullooly, M.; Sherman, M.E.; Gierach, G.L. Current and future methods for measuring breast density: A brief comparative review. Breast Cancer Manag. 2015, 4, 209–221. [Google Scholar] [CrossRef]
- Niukkanen, A.; Arponen, O.; Nykänen, A.; Masarwah, A.; Sutela, A.; Liimatainen, T.; Vanninen, R.; Sudah, M. Quantitative volumetric K-means cluster segmentation of fibroglandular tissue and skin in breast MRI. J. Digit. Imaging 2018, 31, 425–434. [Google Scholar] [CrossRef]
- Klifa, C.; Carballido-Gamio, J.; Wilmes, L.; Laprie, A.; Shepherd, J.; Gibbs, J.; Fan, B.; Noworolski, S.; Hylton, N. Magnetic resonance imaging for secondary assessment of breast density in a high-risk cohort. Magn. Reson. Imaging 2010, 28, 8–15. [Google Scholar] [CrossRef] [Green Version]
- Ertas, G.; Doran, S.J.; Leach, M.O. A computerized volumetric segmentation method applicable to multi-centre MRI data to support computer-aided breast tissue analysis, density assessment and lesion localization. Med. Biol. Eng. Comput. 2017, 55, 57–68. [Google Scholar] [CrossRef]
- Petridou, E.; Kibiro, M.; Gladwell, C.; Malcolm, P.; Toms, A.; Juette, A.; Borga, M.; Leinhard, O.D.; Romu, T.; Kasmai, B.; et al. Breast fat volume measurement using wide-bore 3 T MRI: Comparison of traditional mammographic density evaluation with MRI density measurements using automatic segmentation. Clin. Radiol. 2017, 72, 565–572. [Google Scholar] [CrossRef]
- American College of Radiology. ACR BI-RADS® Atlas: Breast Imaging Reporting and Data System; American College of Radiology: Reston, VA, USA, 2013. [Google Scholar]
- Mainiero, M.B.; Lourenco, A.; Mahoney, M.C.; Newell, M.S.; Bailey, L.; Barke, L.D.; D’Orsi, C.; Harvey, J.A.; Hayes, M.K.; Huynh, P.T.; et al. ACR appropriateness criteria breast cancer screening. J. Am. Coll. Radiol. 2016, 13, 45–49. [Google Scholar] [CrossRef]
- Timmers, J.M.; van Doorne-Nagtegaal, H.J.; Verbeek, A.L.; Den Heeten, G.J.; Broeders, M.J. A dedicated BI-RADS training programme: Effect on the inter-observer variation among screening radiologists. Eur. J. Radiol. 2012, 81, 2184–2188. [Google Scholar] [CrossRef]
- Nayeem, F.; Ju, H.; Brunder, D.G.; Nagamani, M.; Anderson, K.E.; Khamapirad, T.; Lu, L.J. Similarity of fibroglandular breast tissue content measured from magnetic resonance and mammographic images and by a mathematical algorithm. Int. J. Breast Cancer 2014, 2014, 961679. [Google Scholar] [CrossRef] [PubMed]
- Lin, M.; Chan, S.; Chen, J.H.; Chang, D.; Nie, K.; Chen, S.T.; Lin, C.J.; Shih, T.C.; Nalcioglu, O.; Su, M.Y. A new bias field correction method combining N3 and FCM for improved segmentation of breast density on MRI. Med. Phys. 2011, 38, 5–14. [Google Scholar] [CrossRef]
- Doran, S.J.; Hipwell, J.H.; Denholm, R.; Eiben, B.; Busana, M.; Hawkes, D.J.; Leach, M.O.; Silva, I.D. Breast MRI segmentation for density estimation: Do different methods give the same results and how much do differences matter? Med. Phys. 2017, 44, 4573–4592. [Google Scholar] [CrossRef] [Green Version]
- Tagliafico, A.; Tagliafico, G.; Tosto, S.; Chiesa, F.; Martinoli, C.; Derchi, L.E.; Calabrese, M. Mammographic density estimation: Comparison among BI-RADS categories, a semi-automated software and a fully automated one. Breast J. 2009, 18, 35–40. [Google Scholar] [CrossRef]
- Boston, R.C.; Schnall, M.D.; Englander, S.A.; Landis, J.R.; Moate, P.J. Estimation of the content of fat and parenchyma in breast tissue using MRI T1 histograms and phantoms. Magn. Reson. Imaging 2005, 23, 591–599. [Google Scholar] [CrossRef]
- Lu, L.J.; Nishino, T.K.; Johnson, R.F.; Nayeem, F.; Brunder, D.G.; Ju, H.; Leonard, M.H., Jr.; Grady, J.J.; Khamapirad, T. Comparison of breast tissue measurements using magnetic resonance imaging, digital mammography and a mathematical algorithm. Phys. Med. Biol. 2012, 57, 6903. [Google Scholar] [CrossRef] [PubMed]
- Moher, D.; Shamseer, L.; Clarke, M.; Ghersi, D.; Liberati, A.; Petticrew, M.; Shekelle, P.; Stewart, L.A. Preferred reporting items for systematic review and meta-analysis protocols (PRISMA-P) 2015 statement. Syst. Rev. 2015, 4, 1. [Google Scholar] [CrossRef] [PubMed]
- Stewart, L.A.; Clarke, M.; Rovers, M.; Riley, R.D.; Simmonds, M.; Stewart, G.; Tierney, J.F. Preferred reporting items for a systematic review and meta-analysis of individual participant data: The PRISMA-IPD statement. JAMA 2015, 313, 1657–1665. [Google Scholar] [CrossRef]
- Chang, D.H.; Chen, J.H.; Lin, M.; Bahri, S.; Hon, J.Y.; Mehta, R.S.; Nie, K.; Hsiang, D.J.; Nalcioglu, O.; Su, M.Y. Comparison of breast density measured on MR images acquired using fat-suppressed versus nonfat-suppressed sequences. Med. Phys. 2011, 38, 5961–5968. [Google Scholar] [CrossRef] [PubMed]
- Nie, K.; Chang, D.; Chen, J.H.; Hsu, C.C.; Nalcioglu, O.; Su, M.Y. Quantitative analysis of breast parenchymal patterns using 3D fibroglandular tissues segmented based on MRI. Med. Phys. 2010, 37, 217–226. [Google Scholar] [CrossRef] [PubMed]
- Pertuz, S.; McDonald, E.S.; Weinstein, S.P.; Conant, E.F.; Kontos, D. Fully automated quantitative estimation of volumetric breast density from digital breast tomosynthesis images: Preliminary results and comparison with digital mammography and MR imaging. Radiology 2016, 279, 65–74. [Google Scholar] [CrossRef]
- Moon, W.K.; Chang, J.F.; Lo, C.M.; Chang, J.M.; Lee, S.H.; Shin, S.U.; Huang, C.S.; Chang, R.F. Quantitative breast density analysis using tomosynthesis and comparison with MRI and digital mammography. Comput. Methods Programs. Biomed. 2018, 154, 99–107. [Google Scholar] [CrossRef]
- Chen, J.H.; Nie, K.; Bahri, S.; Hsu, C.C.; Hsu, F.T.; Shih, H.N.; Lin, M.; Nalcioglu, O.; Su, M.Y. Decrease in breast density in the contralateral normal breast of patients receiving neoadjuvant chemotherapy: MR imaging evaluation. Radiology 2010, 255, 44–52. [Google Scholar] [CrossRef] [PubMed]
- Ha, R.; Mema, E.; Guo, X.; Mango, V.; Desperito, E.; Ha, J.; Wynn, R.; Zhao, B. Quantitative 3D breast magnetic resonance imaging fibroglandular tissue analysis and correlation with qualitative assessments: A feasibility study. Quant. Imaging Med. Surg. 2016, 6, 144–150. [Google Scholar] [CrossRef]
- Chen, J.H.; Lee, Y.W.; Chan, S.W.; Yeh, D.C.; Chang, R.F. Breast density analysis with automated whole-breast ultrasound: Comparison with 3-D magnetic resonance imaging. Ultrasound Med. Biol. 2016, 42, 1211–1220. [Google Scholar] [CrossRef]
- Moon, W.K.; Shen, Y.W.; Huang, C.S.; Luo, S.C.; Kuzucan, A.; Chen, J.H.; Chang, R.F. Comparative study of density analysis using automated whole breast ultrasound and MRI. Med. Phys. 2011, 38, 382–389. [Google Scholar] [CrossRef]
- Nie, K.; Chang, D.; Chen, J.H.; Shih, T.C.; Hsu, C.C.; Nalcioglu, O.; Su, M.Y. Impact of skin removal on quantitative measurement of breast density using MRI. Med. Phys. 2010, 37, 227–233. [Google Scholar] [CrossRef] [PubMed]
- Kim, J.Y.; Cho, N.; Jeyanth, J.X.; Kim, W.H.; Lee, S.H.; Gweon, H.M.; Moon, W.K. Smaller reduction in 3D breast density associated with subsequent cancer recurrence in patients with breast cancer receiving adjuvant tamoxifen therapy. Am. J. Roentgenol. 2014, 202, 912–921. [Google Scholar] [CrossRef] [PubMed]
- Nie, K.; Su, M.Y.; Chau, M.K.; Chan, S.; Nguyen, H.; Tseng, T.; Huang, Y.; McLaren, C.E.; Nalcioglu, O.; Chen, J.H. Age-and race-dependence of the fibroglandular breast density analysed on 3D MRI. Med. Phys. 2010, 37, 2770–2776. [Google Scholar] [CrossRef] [PubMed]
- Bertrand, K.A.; Baer, H.J.; Orav, E.J.; Klifa, C.; Shepherd, J.A.; Van Horn, L.; Snetselaar, L.; Stevens, V.J.; Hylton, N.M.; Dorgan, J.F. Body fatness during childhood and adolescence and breast density in young women: A prospective analysis. Breast. Cancer. Res. 2015, 17, 95. [Google Scholar] [CrossRef] [PubMed]
- Bertrand, K.A.; Baer, H.J.; Orav, E.J.; Klifa, C.; Kumar, A.; Hylton, N.M.; LeBlanc, E.S.; Snetselaar, L.G.; Van Horn, L.; Dorgan, J.F. Early life body fatness, serum anti-müllerian hormone, and breast density in young adult women. Cancer Epidemiol. Biomark. Prev. 2016, 25, 1151–1157. [Google Scholar] [CrossRef]
- Dorgan, J.F.; Klifa, C.; Shepherd, J.A.; Egleston, B.L.; Kwiterovich, P.O.; Himes, J.H.; Gabriel, K.P.; Van Horn, L.; Snetselaar, L.G.; Stevens, V.J.; et al. Height, adiposity and body fat distribution and breast density in young women. Breast. Cancer Res. 2012, 14, R107. [Google Scholar] [CrossRef] [PubMed]
- Gabriel, K.P.; Klifa, C.; Pérez, A.; Kriska, A.M.; High, R.R.; Snetselaar, L.; Dorgan, J.F. Adolescent and young adult exposure to physical activity and breast density. Med. Sci. Sports Exerc. 2013, 45, 1515. [Google Scholar] [CrossRef]
- Jung, S.; Stanczyk, F.Z.; Egleston, B.L.; Snetselaar, L.G.; Stevens, V.J.; Shepherd, J.A.; Van Horn, L.; LeBlanc, E.S.; Paris, K.; Klifa, C.; et al. Endogenous sex hormones and breast density in young women. Cancer Epidemiol. Biomark. Prev. 2015, 24, 369–378. [Google Scholar] [CrossRef]
- Jung, S.; Goloubeva, O.; Klifa, C.; LeBlanc, E.S.; Snetselaar, L.G.; Van Horn, L.; Dorgan, J.F. Dietary fat intake during adolescence and breast density among young women. Cancer Epidemiol. Biomark. Prev. 2016, 25, 918–926. [Google Scholar] [CrossRef]
- Dorgan, J.F.; Klifa, C.; Deshmukh, S.; Egleston, B.L.; Shepherd, J.A.; Kwiterovich, P.O.; Van Horn, L.; Snetselaar, L.G.; Stevens, V.J.; Robson, A.M.; et al. Menstrual and reproductive characteristics and breast density in young women. Cancer Causes Control 2013, 24, 1973–1983. [Google Scholar] [CrossRef] [Green Version]
- Jung, S.; Egleston, B.L.; Chandler, D.W.; Van Horn, L.; Hylton, N.M.; Klifa, C.C.; Lasser, N.L.; LeBlanc, E.S.; Paris, K.; Shepherd, J.A.; et al. Adolescent endogenous sex hormones and breast density in early adulthood. Breast Cancer Res. 2015, 17, 77. [Google Scholar] [CrossRef] [Green Version]
- Jones, J.A.; Hartman, T.J.; Klifa, C.S.; Coffman, D.L.; Mitchell, D.C.; Vernarelli, J.A.; Snetselaar, L.G.; Van Horn, L.; Stevens, V.J.; Robson, A.M.; et al. Dietary energy density is positively associated with breast density among young women. J. Acad. Nut. Diet. 2015, 115, 353–359. [Google Scholar] [CrossRef]
- Chen, J.H.; Chan, S.; Liu, Y.J.; Yeh, D.C.; Chang, C.K.; Chen, L.K.; Pan, W.F.; Kuo, C.C.; Lin, M.; Chang, D.H.; et al. Consistency of breast density measured from the same women in four different MR scanners. Med. Phys. 2012, 39, 4886–4895. [Google Scholar] [CrossRef] [PubMed] [Green Version]
- Chen, J.H.; Chan, S.; Tang, Y.T.; Hon, J.S.; Tseng, P.C.; Cheriyan, A.T.; Shah, N.R.; Yeh, D.C.; Lee, S.K.; Chen, W.P.; et al. Impact of positional difference on the measurement of breast density using MRI. Med. Phys. 2015, 42, 2268–2275. [Google Scholar] [CrossRef] [Green Version]
- Chen, J.H.; Pan, W.F.; Kao, J.; Lu, J.; Chen, L.K.; Kuo, C.C.; Chang, C.K.; Chen, W.P.; McLaren, C.E.; Bahri, S.; et al. Effect of taxane-based neoadjuvant chemotherapy on fibroglandular tissue volume and percent breast density in the contralateral normal breast evaluated by 3T MR. NMR Biomed. 2013, 26, 1705–1713. [Google Scholar] [CrossRef] [PubMed]
- Chan, S.; Su, M.Y.; Lei, F.J.; Wu, J.P.; Lin, M.; Nalcioglu, O.; Feig, S.A.; Chen, J.H. Menstrual cycle–related fluctuations in breast density measured by using three-dimensional MR imaging. Radiology 2011, 261, 744–751. [Google Scholar] [CrossRef] [PubMed]
- Choi, Y.J.; Chen, J.H.; Yu, H.J.; Li, Y.; Su, M.Y. Impact of different analytic approaches on the analysis of the breast fibroglandular tissue using diffusion weighted imaging. Bio. Med. Res. Int. 2017, 2017, 1094354. [Google Scholar] [CrossRef]
- Chen, J.H.; Chan, S.; Yeh, D.C.; Fwu, P.T.; Lin, M.; Su, M.Y. Response of bilateral breasts to the endogenous hormonal fluctuation in a menstrual cycle evaluated using 3D MRI. Magn. Reson. Imaging 2013, 31, 538–544. [Google Scholar] [CrossRef] [PubMed]
- Clendenen, T.V.; Zeleniuch-Jacquotte, A.; Moy, L.; Pike, M.C.; Rusinek, H.; Kim, S. Comparison of 3-point dixon imaging and fuzzy C-means clustering methods for breast density measurement. Magn. Reson. Imaging 2013, 38, 474–481. [Google Scholar] [CrossRef]
- McDonald, E.S.; Schopp, J.G.; Peacock, S.; DeMartini, W.B.; Rahbar, H.; Lehman, C.D.; Partridge, S.C. Diffusion-weighted MRI: Association between patient characteristics and apparent diffusion coefficients of normal breast fibroglandular tissue at 3 T. Am. J. Roentgenol. 2014, 202, 496–502. [Google Scholar] [CrossRef] [PubMed]
- Chen, J.H.; Chen, W.P.; Chan, S.; Yeh, D.C.; Su, M.Y.; McLaren, C.E. Correlation of endogenous hormonal levels, fibroglandular tissue volume and percent density measured using 3D MRI during one menstrual cycle. Ann. Oncol. 2013, 24, 2329–2335. [Google Scholar] [CrossRef] [PubMed]
- Ledger, A.E.; Scurr, E.D.; Hughes, J.; Macdonald, A.; Wallace, T.; Thomas, K.; Wilson, R.; Leach, M.O.; Schmidt, M.A. Comparison of Dixon sequences for estimation of percent breast fibroglandular tissue. PLoS. ONE 2016, 11, e0152152. [Google Scholar] [CrossRef] [PubMed]
- Wengert, G.J.; Helbich, T.H.; Vogl, W.D.; Baltzer, P.; Langs, G.; Weber, M.; Bogner, W.; Gruber, S.; Trattnig, S.; Pinker, K. Introduction of an automated user–independent quantitative volumetric magnetic resonance imaging breast density measurement system using the Dixon sequence: Comparison with mammographic breast density assessment. Investig. Radiol. 2015, 50, 73–80. [Google Scholar] [CrossRef] [PubMed]
- O’Flynn, E.A.; Wilson, R.M.; Allen, S.D.; Locke, I.; Scurr, E.; deSouza, N.M. Diffusion-weighted imaging of the high-risk breast: Apparent diffusion coefficient values and their relationship to breast density. Magn. Reson. Imaging 2014, 39, 805–811. [Google Scholar] [CrossRef]
- Kim, J.Y.; Suh, H.B.; Kang, H.J.; Shin, J.K.; Choo, K.S.; Nam, K.J.; Lee, S.W.; Jung, Y.L.; Bae, Y.T. Apparent diffusion coefficient of breast cancer and normal fibroglandular tissue in diffusion-weighted imaging: The effects of menstrual cycle and menopausal status. Breast Cancer Res. Treat. 2016, 157, 31–40. [Google Scholar] [CrossRef]
- He, Y.; Liu, Y.; Dyer, B.A.; Boone, J.M.; Liu, S.; Chen, T.; Zheng, F.; Zhu, Y.; Sun, Y.; Rong, Y.; et al. 3D-printed breast phantom for multi-purpose and multi-modality imaging. Quant. Imaging Med. Surg. 2019, 9, 63–74. [Google Scholar] [CrossRef]


| Author, Year of Publication | Study Design | Study Participants | Age Range, Average (Years) or Mean ± SD | MR Scanner Manufacturer, Field Strength (Tesla) | MRI Sequence | Orientation, Slice No. | TR/TE (ms) | FOV (cm) | Slice Thickness (mm) | Matrix Size | Flip Angle (°) | Breast Coil | Segmentation Method |
|---|---|---|---|---|---|---|---|---|---|---|---|---|---|
| Chang, 2011 [25] | Retro. | 38 | 28–82, 48 | Philips, 3.0 | Fat-suppressed 3D SPAIR | Axial, 160 | 6.20/1.26 | 3.01–38.0 | 1.0 | 480 × 480 | 12 | NA | FCM |
| Non-fat-suppressed 2D TSE | Axial, 84 | 800/8.6 | 31.0–38.0 | 2.0 | 480 × 480 | 90 | NA | ||||||
| Nie, 2010 [26] | NA | 230 | 50 ± 11.0 | Philips, 1.5 | Non-fat-suppressed 3D SGRE (T1W) | Axial, 32 | 8.1/4.0 | 31.0–38.0 | 4.0 | 256 × 256 | 20 | NA | FCM |
| Pertuz, 2016 [27] | Retro. | 68 | 24–82, 52 | Siemens, 1.5 | Non-fat-suppressed (T1W) | NA | NA | NA | 2.4–3.5 | 512 × 512 | NA | NA | FCM |
| Moon, 2018 [28] | Retro. | 98 | 51.81 ± 11.08 | GE, 1.5 | Non-fat-suppressed (T1W) | Axial | 6.2/2.1 | 20.0 | 1.0 | 512 × 217 | NA | NA | FCM |
| Chen, 2010 [29] | Retro. | 35 | 45 ± 7 | Philips, 1.5 | Non-fat-suppressed 3D SGRE (T1W) | Axial, 32 | 8.1/4.0 | 38.0 | 3.0–4.0 | 256 × 128 | 20 | Dedicated 4-channel phased array | FCM |
| Chen, 2016 [31] | Retro. | 23 | 40.5 ± 8.2 | Philips, 3.0 | Non-fat-suppressed 2D TSE (T1W) | Axial, 90 | 654/9.0 | 33.0 | 2.0 | 328 × 384 | NA | NA | FCM |
| Moon, 2011 [32] | Retro. | 40 | 50.9 ± 9.4 | GE, 1.5 | Fat-suppressed 3D GRE (T1W) (VIBRANT) | Sagittal, 144–192 | 6.1/2.5 | 19.0 | 1.5 | 512 × 512 | NA | NA | FCM |
| Klifa, 2010 [11] | Retro. | 35 | 28–59, 43 | GE, 1.5 | Fat-suppressed 3D Fast GRE (T1W) | Axial, 60 | 8.0/4.2 | NA | 2.0 | NA | 20 | Dedicated bilateral phased array | FCM |
| Chen, 2011 [1] | Retro. | 16 | 33–51, 43 | GE, 1.5 | Non-fat-suppressed 3D (T1W) | Axial, 56 | 7.4/3.3 | 30 | 2.0 | 512 × 512 | NA | Dedicated 8-channel bilateral | FCM |
| Nie, 2010 [33] | Retro. | 50 | NA | Philips, 1.5 | Non-fat-suppressed 3D GRE (T1W) | Axial, 32 | 8.1/4.0 | 38.0 | 4.0 | 256 × 128 | 20 | NA | FCM |
| Kim, 2014 [34] | Retro. | 80 | 27–68, 44 | GE, 1.5 | Fat-suppressed 2D FSE (T2W) | Sagittal | 5500-7150/82 | 20.0 | 1.5 | 256 × 160 | NA | Dedicated 8-channel bilateral | FCM |
| Fat-suppressed 3D Fast SGRE (T2W) | Sagittal | 6.2/2.5 | 20.0 | 1.5 | 256 × 160 | 10 | Dedicated 8-channel bilateral | ||||||
| Nie, 2010 [35] | Retro. | 321 | 54 ± 12 | Philips, 1.5 | Non-fat-suppressed 3D SGRE (T1W) | Axial, 32 | 8.1/4.0 | 32.0–38.0 | 4.0 | 256 × 128 | 20 | Dedicated 4-channel phased-array | FCM |
| Wang, 2013 [2] | Retro. | 99 | 47.2 ± 12.1 | GE, 1.5/3.0 | Non-fat-suppressed (T1W) | Axial | NA | NA | 2.0 | NA | NA | Dedicated bilateral phased-array | FCM |
| Bertrand, 2015 [36] | Pros. | 182 | 25–29 | NA, 1.5/3.0 | Non-fat- and fat-suppressed 3D Fast GRE (T1W) | Axial and Coronal | NA | 32.0–40.0 | NA | NA | NA | Dedicated RF coil | FCM |
| Bertrand, 2016 [37] | Pros. | 172 | 25–29 | NA, 1.5/3.0 | Non-fat- and fat-suppressed 3D Fast GRE (T1W) | NA | NA | 32.0–40.0 | NA | NA | NA | Dedicated RF coil | FCM |
| Dorgan, 2012 [38] | Retro. | 174 | 25–29 | NA, 1.5/3.0 | Non-fat- and fat-suppressed 3D Fast GRE (T1W) | Axial and Coronal | NA | 32.0–40.0 | NA | NA | NA | Dedicated RF coil | FCM |
| Gabriel, 2013 [39] | NA | 182 | 25–29 | NA, 1.5/3.0 | Non-fat- and fat-suppressed 3D Fast GRE (T1W) | Axial and Coronal | NA | 32.0–40.0 | NA | NA | NA | Dedicated RF coil | FCM |
| Jung, 2015 [40] | Pros. | 180 | 25–29 | NA, 1.5/3.0 | Non-fat- and fat-suppressed 3D Fast GRE (T1W) | Axial and Coronal | NA | 32.0–40.0 | NA | NA | NA | Dedicated RF coil | FCM |
| Jung, 2016 [41] | Pros. | 177 | 25–29 | NA, 1.5/3.0 | Non-fat- and fat-suppressed 3D Fast GRE (T1W) | Axial and Coronal | NA | 32.0–40.0 | NA | NA | NA | Dedicated RF coil | FCM |
| Dorgan, 2013 [42] | C.S. | 176 | 27.0–27.3, 27.2 | NA, 1.5/3.0 | Non-fat- and fat-suppressed 3D Fast GRE (T1W) | Axial and Coronal | NA | 32.0–40.0 | NA | NA | NA | Dedicated RF coil | FCM |
| Jung, 2015 [43] | Pros. | 177 | 25–29 | NA, 1.5/3.0 | Non-fat- and fat-suppressed 3D Fast GRE (T1W) | Axial and Coronal | NA | NA | NA | NA | NA | Dedicated RF coil | NA |
| Jones, 2015 [44] | C.S. | 172 | 25–29 | NA, 1.5/3.0 | Non-fat- and fat-suppressed 3D Fast GRE (T1W) | Axial and Coronal | NA | NA | NA | NA | NA | Dedicated RF coil | NA |
| Chen, 2012 [45] | Pros. | 34 | 20–64, 35 | GE, 1.5 | Non-fat-suppressed 2D FSE (T1W) | Axial | 607/9.0 | 38.0 | 2.0 | 256 × 192 | NA | Dedicated 8-channel bilateral | FCM and N3 |
| GE, 3.0 | Non-fat-suppressed 2D FSE (T1W) | Axial | 650/9.0 | 38.0 | 2.0 | 256 × 192 | NA | Dedicated 8-channel bilateral | |||||
| Philips, 3.0 | Non-fat-suppressed 2D FSE (T1W) | Axial | 650/9.0 | 33.0 | 2.0 | 328 × 384 | NA | Dedicated 16-channel bilateral | |||||
| Siemens, 1.5 | Non-fat-suppressed 2D FSE (T1W) | Axial | 650/9.8 | 33.0 | 2.0 | 330 × 384 | 20 | Dedicated 4-channel bilateral | |||||
| Chen, 2015 [46] | NA | 32 | 22–53, 41 | Siemens, 1.5 | Non-fat-suppressed 2D FSE (T1W) | Axial | 650/9.8 | 33.0 | 2.0 | 256 × 256 and 512 × 512 | NA | Dedicated 4-channel bilateral | FCM and N3 |
| Chen, 2013 [47] | NA | 44 | 28–82, 47 | Philips, 3.0 | Non-fat-suppressed 2D TSE (T1W) | Axial | 800/8.6 | 31.0–38.0 | 2.0 | 480 × 480 | 90 | Dedicated 4-channel bilateral | FCM and N3 |
| Fat-suppressed 3D GRE (T1W) | Axial | 6.2/1.26 | 31.0–36.0 | 2.0 | 480 × 480 | 12 | Dedicated 4-channel bilateral | ||||||
| Chan, 2011 [48] | NA | 30 | Pre: (N = 24) | Siemens, 1.5 | Non-fat-suppressed 3D GRE (T1W) | Axial | 11/4.7 | 35.0 | 2.0 | 256 × 256 | 20 | 4-channel dual-mode | FCM and N3 |
| 23–48, 29 | |||||||||||||
| Post: (N = 6) | |||||||||||||
| 51–61, 57 | |||||||||||||
| Choi, 2017 [49] | Retro. | 38 | 32–79, 45 | Philips, 3.0 | Non-fat-suppressed SE (T1W) | Axial | 620/10 | 20.0–34.0 | 3.0 | 332 × 332 | NA | Dedicated 7-channel bilateral | FCM and N3 |
| STIR and SE-EPI (DW) | Axial | 3265/54 | 35.0 | 4.0 | 288 × 288 | 90 | Dedicated 7-channel bilateral | ||||||
| Chen, 2013 [50] | NA | 24 | 23–48, 29 | Siemens, 1.5 | Non-fat-suppressed 3D Fast GRE (T1W) | Axial | 11/4.7 | 35.0 | 2.0 | 256 × 256 | 20 | 4-channel dual-mode | FCM and N3 |
| Clendenen, 2013 [51] | NA | 9 | 24–31 | Siemens, 3.0 | Non-fat-suppressed 3D VIBE (T1W) | Axial | 4.19/1.62 | 26.9 × 20.2 × 28.8 | 0.6 × 0.6 × 1 | 448 × 336 × 288 | 12 | Dedicated 7-channel bilateral | FCM and N3 |
| 3-Point Dixon Non-fat-suppressed 3D FLASH (T1W) | Axial | 7.6/3.37, 4.17. 4.96 | NA | 0.88 × 0.88 × 1.5 | NA | 10 | Dedicated 7-channel bilateral | ||||||
| McDonald, 2014 [52] | Retro. | 103 | 47 ± 11 | Philips, 3.0 | EPI-Parallel Imaging (DWI) | NA | 5336/61 | 36.0 | 5.0 | 240 × 240 | NA | Dedicated 16 channel bilateral | Semi-automated Interactive Threshold |
| Tagliafico, 2013 [5] | Pros. | 48 | 35–67, 41 | GE, 3.0 | 3D Fast SGRE and Fat-suppressed 3D GRE (T1W) (VIBRANT) | NA | 6.2/3.0 | NA | NA | 350 × 350 | 10 | Dedicated 8-channel bilateral | Semi-automated Interactive Threshold |
| IDEAL | NA | 4380/130.872 | NA | NA | 360 × 360 | 90 | Dedicated 8-channel bilateral | ||||||
| Tagliafico, 2014 [3] | NA | 48 | 35–67, 41 | GE, 3.0 | TSE (T1W) | NA | 600/9.0 | NA | 4.0 | 350 × 350 | 90 | Dedicated 8-channel bilateral | Semi-automated Interactive Threshold |
| TSE (T2W) | NA | 5200/103 | NA | 4.0 | 350 × 350 | 90 | Dedicated 8-channel bilateral | ||||||
| Fat-suppressed 3D GRE (T1W) (VIBRANT) | NA | 6.2/3.0 | NA | 1.2 | 350 × 350 | 10 | Dedicated 8-channel bilateral | ||||||
| IDEAL | NA | 4380/130 | NA | 1.2 | 360 × 360 | 90 | Dedicated 8-channel bilateral | ||||||
| Chen, 2013 [53] | NA | 24 | 23–48, 29.4 | Siemens, 1.5 | Non-fat-suppressed 3D GRE (T1W) | Axial | 11/4.7 | 35.0 | 2.0 | 256 × 256 | 20 | NA | Semi-automated Interactive Threshold |
| Ha, 2016 [30] | Retro. | 60 | 54.2 | GE, 1.5/3.0 | Fat-suppressed Fast SGRE (T1W) | Axial | 17/2.4 | 18.0-22.0 | 2.0 | 256 × 192 | 35 | 8-channel breast array | Semi-automated (In-house software) |
| Ledger, 2016 [54] | Retro. | 10 | 23–50, 31 | Siemens, 1.5 | HR/LR 3D GRE (PDW) | Axial | 7.34/4.77, 2.39 | NA | NA | NA | 4 | Sentinelle variable coil geometry | Semi-automated (In-house software) |
| HR/LR3D GRE (T1W) | Axial | 7.34/4.77, 2.39 | NA | NA | NA | 25 | Sentinelle variable coil geometry | ||||||
| LR 2D SE (T1W) | Axial | 500/12 | NA | 7.0 | NA | NA | Sentinelle variable coil geometry | ||||||
| Wengert, 2015 [55] | Pros. | 43 | 21–71, 38 | Siemens, 3.0 | Dixon | Axial, 192 | NA/6.0, 2.45, 2.67 | NA | NA | 352 × 352 | 6 | Dedicated 4-channel bilateral | Fully-automated (AUQV) |
| O’Flynn, 2014 [56] | Retro. | 33 | (N = 17): | Siemens, 1.5 | Fat-suppressed SS-EPI (DWI) | Axial | 6300/83 | 34.0 | 5.0 | NA | NA | Dedicated 4-channel bilateral | Dedicated IDL based software for ADC calculation |
| 33–49, 43 | |||||||||||||
| (N = 16): | |||||||||||||
| 27–49, 40 | |||||||||||||
| Kim, 2016 [57] | Pros. | 57 | 32–74, 50.8 | Siemens, 3.0 | Fat-suppressed TSE (T2W) | Sagittal | 7623/91 | 22 × 22 | 3.0 | 320 × 246 | NA | Dedicated 4-breast array | Manually |
| Fat-suppressed SS-EPI (DWI) | Axial | 5200/74 | 340 × 179 | 5.0 | 80 × 190 | NA | Dedicated 4-breast array | ||||||
| Fat-suppressed 3D FLASH (T1W) | Sagittal | 4.5/1.6 | 22 × 22 | 2.0 | 352 × 292 | 20 | Dedicated 4-breast array |
| Author, Year | Breast Volume, BV (cm3) | Fibroglandular Volume, FV (cm3) | Breast Density, BD (%) | ||||
|---|---|---|---|---|---|---|---|
| Mean | SD | Mean | SD | N | Mean | SD | |
| Chang, 2011 [25] | 681 | 359 | 100 | 58 | 38 | 17.50 | 9.50 |
| Nie, 2010 [26] | - | - | 104 | 62 | 141 | 15.30 | 8.10 |
| - | - | 112 | 73 | 89 | 16.70 | 10.10 | |
| Perutz, 2016 [27] | 2210 | 1125 | 297 | 128 | 68 | 16.60 | 11.20 |
| Moon, 2018 [28] | 537.59 | 287.74 | - | - | 89 | 20.30 | 8.60 |
| Chen, 2010 [29] | - | - | - | - | 35 | 16.6 0 | 9.30 |
| Ha, 2016 [30] | - | - | - | - | 60 | 15.30 | 10.07 |
| Chen, 2016 [31] | 537.59 | 287.74 | - | - | 23 | 24.71 | 15.16 |
| Moon, 2011 [32] | 544.90 | 207.41 | - | - | 40 | 23.79 | 16.62 |
| Klifa, 2010 [11] | - | - | - | - | 35 | 28.0 | 18.00 |
| Chen, 2011 [1] | 358 | 174 | 79 | 66 | 16 | 22.10 | 2.60 |
| Bertrand, 2015 [36] | 413.5 | 364.3 | 104.2 | 70.6 | 182 | 27.60 | 20.50 |
| Bertrand, 2016 [37] | 418.7 | 369.3 | 104.7 | 70.3 | 172 | 27.40 | 20.00 |
| Dorgan, 2012 [38] | - | - | 104.67 | 71.28 | 174 | 28.15 | 20.39 |
| Chen, 2012 [45] | 528 | 263 | 117 | 82 | 34 | 24.10 | 12.40 |
| Choi, 2017 [49] | - | - | - | - | 38 | 14.80 | 14.40 |
| Chan, 2011 [48] | - | - | - | - | 6 | 8.70 | 3.40 |
| - | - | - | - | 24 | 21.20 | 8.30 | |
| Chen, 2013 [50] | - | - | - | - | 24 | 7.50 | 3.80 |
| Tagliafico, 2014 [3] | - | - | - | - | 48 | 55.00 | 23.20 |
| Ledger, 2016 [54] | 482.6 | 296.2 | 135.2 | 56.2 | 10 | 35.40 | 16.20 |
| Chen, 2013 [53] | - | - | 48.1 | 24.7 | 24 | 20.20 | 7.80 |
| Wengert, 2015 [55] | 1462.43 | 803.38 | - | - | 43 | 26.05 | 19.47 |
| Study Code | Author, Year | N | Mean | SD | CV | Cluster Membership |
|---|---|---|---|---|---|---|
| P1.01 | Chang, 2011 [25] | 38 | 17.50 | 9.50 | 54.29 | 1 |
| P1.04 | Nie, 2010 [26] | 89 | 16.70 | 10.10 | 60.48 | 1 |
| P1.05 | Pertuz, 2016 [27] | 68 | 16.60 | 11.20 | 67.47 | 1 |
| P1.06 | Moon, 2018 [28] | 89 | 20.30 | 8.60 | 42.36 | 1 |
| P1.07 | Chen, 2010 [29] | 35 | 16.60 | 9.30 | 56.02 | 1 |
| P1.08 | Ha, 2016 [30] | 60 | 15.30 | 10.07 | 65.82 | 1 |
| P4.13 | Choi, 2017 [49] | 38 | 14.80 | 14.40 | 97.30 | 1 |
| P4.15 | Chan, 2011 [48] | 24 | 21.20 | 8.30 | 39.15 | 1 |
| P6.03 | Chen, 2013 [53] | 24 | 20.20 | 7.80 | 38.61 | 1 |
| P1.09 | Chen, 2016 [31] | 23 | 24.71 | 15.16 | 61.35 | 2 |
| P1.10 | Moon, 2011 [32] | 40 | 23.79 | 16.62 | 69.86 | 2 |
| P1.11 | Klifa, 2010 [11] | 35 | 28.00 | 18.00 | 64.29 | 2 |
| P3.01 | Bertrand,2015 [36] | 182 | 27.60 | 20.50 | 74.28 | 2 |
| P3.02 | Bertrand, 2016 [37] | 172 | 27.40 | 20.00 | 72.99 | 2 |
| P3.03 | Dorgan, 2012 [38] | 174 | 28.15 | 20.39 | 72.43 | 2 |
| P4.03 | Chen, 2012 [45] | 34 | 24.10 | 12.40 | 51.45 | 2 |
| P6.05 | Wengert, 2015 [55] | 43 | 26.05 | 19.47 | 74.74 | 2 |
| P1.12 | Chen, 2011 [1] | 16 | 22.10 | 2.60 | 11.76 | 3 |
| P4.14 | Chan, 2011 [48] | 6 | 8.70 | 3.40 | 39.08 | 4 |
| P4.16 | Chen, 2013 [50] | 24 | 7.50 | 3.80 | 50.67 | 4 |
| P5.04 | Tagliafico, 2014 [3] | 48 | 55.00 | 23.20 | 42.18 | 5 |
| P5.08 | Ledger, 2016 [54] | 10 | 33.40 | 16.20 | 45.76 | 6 |
© 2019 by the authors. Licensee MDPI, Basel, Switzerland. This article is an open access article distributed under the terms and conditions of the Creative Commons Attribution (CC BY) license (http://creativecommons.org/licenses/by/4.0/).
Share and Cite
Sindi, R.; Sá Dos Reis, C.; Bennett, C.; Stevenson, G.; Sun, Z. Quantitative Measurements of Breast Density Using Magnetic Resonance Imaging: A Systematic Review and Meta-Analysis. J. Clin. Med. 2019, 8, 745. https://0-doi-org.brum.beds.ac.uk/10.3390/jcm8050745
Sindi R, Sá Dos Reis C, Bennett C, Stevenson G, Sun Z. Quantitative Measurements of Breast Density Using Magnetic Resonance Imaging: A Systematic Review and Meta-Analysis. Journal of Clinical Medicine. 2019; 8(5):745. https://0-doi-org.brum.beds.ac.uk/10.3390/jcm8050745
Chicago/Turabian StyleSindi, Rooa, Cláudia Sá Dos Reis, Colleen Bennett, Gil Stevenson, and Zhonghua Sun. 2019. "Quantitative Measurements of Breast Density Using Magnetic Resonance Imaging: A Systematic Review and Meta-Analysis" Journal of Clinical Medicine 8, no. 5: 745. https://0-doi-org.brum.beds.ac.uk/10.3390/jcm8050745