Statin and Cancer Mortality and Survival: An Umbrella Systematic Review and Meta-Analysis

 , , , and
Abstract
:1. Introduction
2. Methods
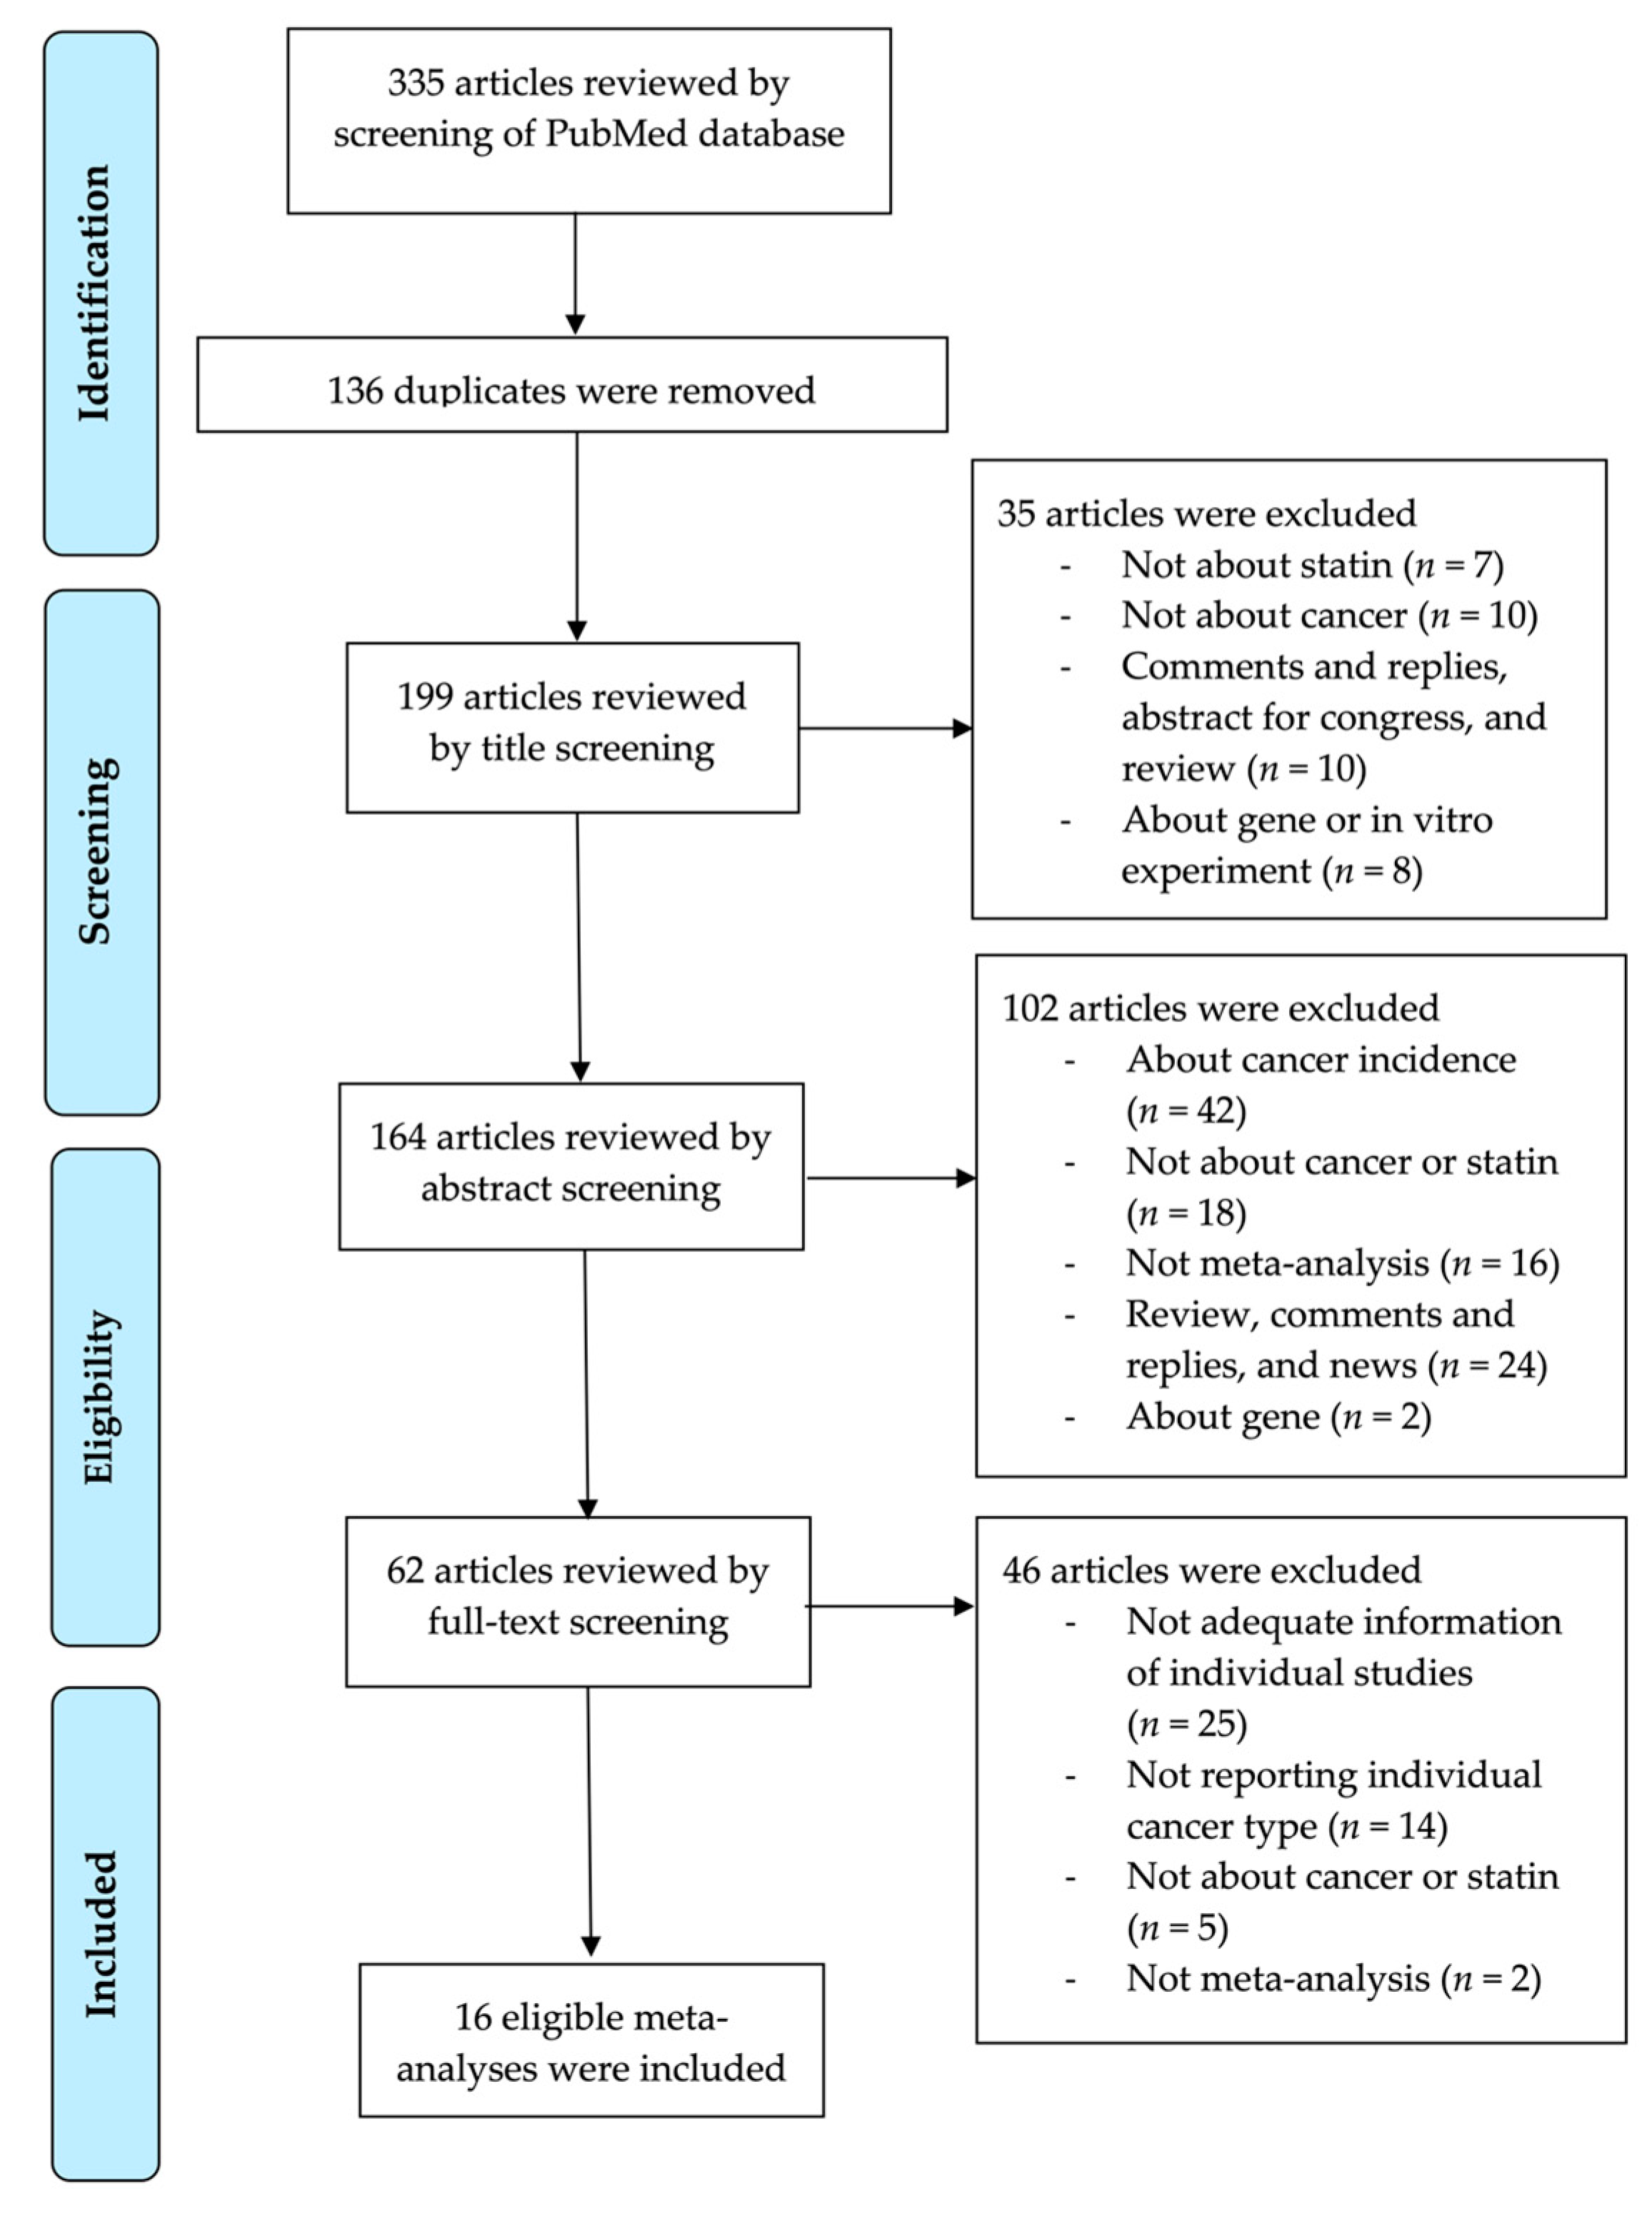
2.1. Methods for Literature Search
2.2. Eligibility Criteria and Data Extraction
2.3. Statistical Analysis
2.4. The Criteria to Determine the Level of Evidence
2.4.1. Convincing Evidence
2.4.2. Suggestive Evidence
2.4.3. Weak (Probable) Evidence
2.4.4. Nonsignificant Associations
3. Results
3.1. Search Strategy for the Literature and Included Studies for Reanalysis
3.2. The Effect of Statin on All-Cause Mortality in 11 Cancers
3.3. The Effect of Statin on Cancer-Specific Mortality in 8 Cancers
3.4. The Effect of Statin on Recurrence-Free Survival, Progression-Free Survival, and Disease-Free Survival
4. Discussion
5. Conclusions
Supplementary Materials
Author Contributions
Funding
Conflicts of Interest
References
- Torre, L.A.; Bray, F.; Siegel, R.L.; Ferlay, J.; Lortet-Tieulent, J.; Jemal, A. Global cancer statistics, 2012. CA Cancer J. Clin. 2015, 65, 87–108. [Google Scholar] [CrossRef] [PubMed] [Green Version]
- De Angelis, R.; Sant, M.; Coleman, M.P.; Francisci, S.; Baili, P.; Pierannunzio, D.; Trama, A.; Visser, O.; Brenner, H.; Ardanaz, E.; et al. Cancer survival in Europe 1999–2007 by country and age: Results of EUROCARE-5—A population-based study. Lancet Oncol. 2014, 15, 23–34. [Google Scholar] [CrossRef]
- Sacks, F.M.; Pfeffer, M.A.; Moye, L.A.; Rouleau, J.L.; Rutherford, J.D.; Cole, T.G.; Brown, L.; Warnica, J.W.; Arnold, J.M.; Wun, C.C.; et al. The effect of pravastatin on coronary events after myocardial infarction in patients with average cholesterol levels. Cholesterol and recurrent events trial investigators. N. Engl. J. Med. 1996, 335, 1001–1009. [Google Scholar] [CrossRef] [PubMed]
- Newman, T.B.; Hulley, S.B. Carcinogenicity of lipid-lowering drugs. JAMA 1996, 275, 55–60. [Google Scholar] [CrossRef]
- Demierre, M.F.; Higgins, P.D.; Gruber, S.B.; Hawk, E.; Lippman, S.M. Statins and cancer prevention. Nat. Rev. Cancer 2005, 5, 930–942. [Google Scholar] [CrossRef]
- Chan, K.K.; Oza, A.M.; Siu, L.L. The statins as anticancer agents. Clin. Cancer Res. 2003, 9, 10–19. [Google Scholar]
- Boudreau, D.M.; Yu, O.; Johnson, J. Statin use and cancer risk: A comprehensive review. Expert Opin. Drug Saf. 2010, 9, 603–621. [Google Scholar] [CrossRef] [Green Version]
- Jakobisiak, M.; Golab, J. Potential antitumor effects of statins (review). Int. J. Oncol. 2003, 23, 1055–1069. [Google Scholar] [CrossRef]
- Zeichner, S.; Mihos, C.G.; Santana, O. The pleiotropic effects and therapeutic potential of the hydroxy-methyl-glutaryl-CoA reductase inhibitors in malignancies: A comprehensive review. J. Cancer Res. Ther. 2012, 8, 176–183. [Google Scholar] [CrossRef]
- Scandinavian Simvastatin Survival Study Group. Randomised trial of cholesterol lowering in 4444 patients with coronary heart disease: The Scandinavian Simvastatin Survival Study (4S). Lancet 1994, 344, 1383–1389. [Google Scholar]
- Yokomichi, H.; Nagai, A.; Hirata, M.; Tamakoshi, A.; Kiyohara, Y.; Kamatani, Y.; Muto, K.; Ninomiya, T.; Matsuda, K.; Kubo, M.; et al. Statin use and all-cause and cancer mortality: BioBank Japan cohort. J. Epidemiol. 2017, 27, S84–S91. [Google Scholar] [CrossRef] [PubMed]
- Dale, K.M.; Coleman, C.I.; Henyan, N.N.; Kluger, J.; White, C.M. Statins and cancer risk: A meta-analysis. JAMA 2006, 295, 74–80. [Google Scholar] [CrossRef] [PubMed]
- Jeong, G.H.; Lee, K.H.; Kim, J.Y.; Eisenhut, M.; Kronbichler, A.; van der Vliet, H.J.; Hong, S.H.; Shin, J.I.; Gamerith, G. Effect of statin on cancer incidence: An umbrella systematic review and meta-analysis. J. Clin. Med. 2019, 8, 819. [Google Scholar] [CrossRef] [PubMed] [Green Version]
- Liberati, A.; Altman, D.G.; Tetzlaff, J.; Mulrow, C.; Gotzsche, P.C.; Ioannidis, J.P.; Clarke, M.; Devereaux, P.J.; Kleijnen, J.; Moher, D. The PRISMA statement for reporting systematic reviews and meta-analyses of studies that evaluate health care interventions: Explanation and elaboration. J. Clin. Epidemiol. 2009, 62, e1–e34. [Google Scholar] [CrossRef] [Green Version]
- Sacks, H.S.; Berrier, J.; Reitman, D.; Ancona-Berk, V.A.; Chalmers, T.C. Meta-analyses of randomized controlled trials. N. Engl. J. Med. 1987, 316, 450–455. [Google Scholar] [CrossRef]
- Higgins, J.P.; Thompson, S.G.; Spiegelhalter, D.J. A re-evaluation of random-effects meta-analysis. J. R. Stat. Soc. Ser. A (Stat. Soc.) 2009, 172, 137–159. [Google Scholar] [CrossRef] [Green Version]
- Fletcher, J. What is heterogeneity and is it important? BMJ 2007, 334, 94–96. [Google Scholar] [CrossRef]
- Egger, M.; Davey Smith, G.; Schneider, M.; Minder, C. Bias in meta-analysis detected by a simple, graphical test. BMJ 1997, 315, 629–634. [Google Scholar] [CrossRef] [Green Version]
- Sterne, J.A.; Sutton, A.J.; Ioannidis, J.P.; Terrin, N.; Jones, D.R.; Lau, J.; Carpenter, J.; Rucker, G.; Harbord, R.M.; Schmid, C.H.; et al. Recommendations for examining and interpreting funnel plot asymmetry in meta-analyses of randomised controlled trials. BMJ 2011, 343, d4002. [Google Scholar] [CrossRef] [Green Version]
- Kyrgiou, M.; Kalliala, I.; Markozannes, G.; Gunter, M.J.; Paraskevaidis, E.; Gabra, H.; Martin-Hirsch, P.; Tsilidis, K.K. Adiposity and cancer at major anatomical sites: Umbrella review of the literature. BMJ 2017, 356, j477. [Google Scholar] [CrossRef] [Green Version]
- Choi, E.K.; Park, H.B.; Lee, K.H.; Park, J.H.; Eisenhut, M.; van der Vliet, H.J.; Kim, G.; Shin, J.I. Body mass index and 20 specific cancers: Re-analyses of dose-response meta-analyses of observational studies. Ann. Oncol. Off. J. Eur. Soc. Med. Oncol. 2018, 29, 749–757. [Google Scholar] [CrossRef] [PubMed] [Green Version]
- Luo, Y.; She, D.L.; Xiong, H.; Fu, S.J.; Yang, L. The prognostic effect of statin use on urologic cancers: An updated meta-analysis of 35 observational studies. Medicine 2015, 94, e1523. [Google Scholar] [CrossRef] [PubMed]
- Mei, Z.; Liang, M.; Li, L.; Zhang, Y.; Wang, Q.; Yang, W. Effects of statins on cancer mortality and progression: A systematic review and meta-analysis of 95 cohorts including 1,111,407 individuals. Int. J. Cancer 2017, 140, 1068–1081. [Google Scholar] [CrossRef]
- Liu, B.; Yi, Z.; Guan, X.; Zeng, Y.X.; Ma, F. The relationship between statins and breast cancer prognosis varies by statin type and exposure time: A meta-analysis. Breast Cancer Res. Treat. 2017, 164, 1–11. [Google Scholar] [CrossRef] [PubMed]
- Manthravadi, S.; Shrestha, A.; Madhusudhana, S. Impact of statin use on cancer recurrence and mortality in breast cancer: A systematic review and meta-analysis. Int. J. Cancer 2016, 139, 1281–1288. [Google Scholar] [CrossRef] [PubMed]
- Zhong, S.; Zhang, X.; Chen, L.; Ma, T.; Tang, J.; Zhao, J. Statin use and mortality in cancer patients: Systematic review and meta-analysis of observational studies. Cancer Treat. Rev. 2015, 41, 554–567. [Google Scholar] [CrossRef]
- Gray, R.T.; Coleman, H.G.; Hughes, C.; Murray, L.J.; Cardwell, C.R. Statin use and survival in colorectal cancer: Results from a population-based cohort study and an updated systematic review and meta-analysis. Cancer Epidemiol. 2016, 45, 71–81. [Google Scholar] [CrossRef] [Green Version]
- Ling, Y.; Yang, L.; Huang, H.; Hu, X.; Zhao, C.; Huang, H.; Ying, Y. Prognostic significance of statin use in colorectal cancer: A systematic review and meta-analysis. Medicine 2015, 94, e908. [Google Scholar] [CrossRef]
- Cai, H.; Zhang, G.; Wang, Z.; Luo, Z.; Zhou, X. Relationship between the use of statins and patient survival in colorectal cancer: A systematic review and meta-analysis. PLoS ONE 2015, 10, e0126944. [Google Scholar] [CrossRef]
- Xie, W.; Ning, L.; Huang, Y.; Liu, Y.; Zhang, W.; Hu, Y.; Lang, J.; Yang, J. Statin use and survival outcomes in endocrine-related gynecologic cancers: A systematic review and meta-analysis. Oncotarget 2017, 8, 41508–41517. [Google Scholar] [CrossRef] [Green Version]
- Nayan, M.; Punjani, N.; Juurlink, D.N.; Finelli, A.; Austin, P.C.; Kulkarni, G.S.; Uleryk, E.; Hamilton, R.J. Statin use and kidney cancer survival outcomes: A systematic review and meta-analysis. Cancer Treat. Rev. 2017, 52, 105–116. [Google Scholar] [CrossRef]
- Li, X.; Zhou, J. Impact of postdiagnostic statin use on ovarian cancer mortality: A systematic review and meta-analysis of observational studies. Br. J. Clin. Pharm. 2018, 84, 1109–1120. [Google Scholar] [CrossRef] [Green Version]
- Jian-Yu, E.; Graber, J.M.; Lu, S.E.; Lin, Y.; Lu-Yao, G.; Tan, X.L. Effect of metformin and statin use on survival in pancreatic cancer patients: A systematic literature review and meta-analysis. Curr. Med. Chem. 2018, 25, 2595–2607. [Google Scholar] [CrossRef]
- Meng, Y.; Liao, Y.B.; Xu, P.; Wei, W.R.; Wang, J. Statin use and mortality of patients with prostate cancer: A meta-analysis. Onco Targets Ther. 2016, 9, 1689–1696. [Google Scholar] [CrossRef] [PubMed] [Green Version]
- Raval, A.D.; Thakker, D.; Negi, H.; Vyas, A.; Kaur, H.; Salkini, M.W. Association between statins and clinical outcomes among men with prostate cancer: A systematic review and meta-analysis. Prostate Cancer Prostatic Dis. 2016, 19, 151–162. [Google Scholar] [CrossRef] [PubMed]
- Mansourian, M.; Haghjooy-Javanmard, S.; Eshraghi, A.; Vaseghi, G.; Hayatshahi, A.; Thomas, J. Statins use and risk of breast cancer recurrence and death: A systematic review and meta-analysis of observational studies. J. Pharm. Pharm. Sci. 2016, 19, 72–81. [Google Scholar] [CrossRef] [PubMed]
- Park, H.S.; Schoenfeld, J.D.; Mailhot, R.B.; Shive, M.; Hartman, R.I.; Ogembo, R.; Mucci, L.A. Statins and prostate cancer recurrence following radical prostatectomy or radiotherapy: A systematic review and meta-analysis. Ann. Oncol. 2013, 24, 1427–1434. [Google Scholar] [CrossRef]
- DerSimonian, R.; Laird, N. Meta-analysis in clinical trials. Control. Clin. Trials 1986, 7, 177–188. [Google Scholar] [CrossRef]
- Bardou, M.; Barkun, A.; Martel, M. Effect of statin therapy on colorectal cancer. Gut 2010, 59, 1572–1585. [Google Scholar] [CrossRef] [Green Version]
- Kodach, L.L.; Bleuming, S.A.; Peppelenbosch, M.P.; Hommes, D.W.; van den Brink, G.R.; Hardwick, J.C.H. The effect of statins in colorectal cancer is mediated through the bone morphogenetic protein pathway. Gastroenterology 2007, 133, 1272–1281. [Google Scholar] [CrossRef]
- Hong, M.Y.; Seeram, N.P.; Zhang, Y.; Heber, D. Anticancer effects of Chinese red yeast rice versus monacolin K alone on colon cancer cells. J. Nutr. Biochem. 2008, 19, 448–458. [Google Scholar] [CrossRef] [PubMed] [Green Version]
- Cho, S.J.; Kim, J.S.; Kim, J.M.; Lee, J.Y.; Jung, H.C.; Song, I.S. Simvastatin induces apoptosis in human colon cancer cells and in tumor xenografts, and attenuates colitis-associated colon cancer in mice. Int. J. Cancer 2008, 123, 951–957. [Google Scholar] [CrossRef]
- Shimoyama, S. Statins are logical candidates for overcoming limitations of targeting therapies on malignancy: Their potential application to gastrointestinal cancers. Cancer Chemother. Pharm. 2011, 67, 729–739. [Google Scholar] [CrossRef] [PubMed]
- Siegel, R.L.; Miller, K.D.; Jemal, A. Cancer statistics, 2019. CA Cancer J. Clin. 2019, 69, 7–34. [Google Scholar] [CrossRef] [PubMed] [Green Version]
- Turner, R.M.; Bird, S.M.; Higgins, J.P. The impact of study size on meta-analyses: Examination of underpowered studies in Cochrane reviews. PLoS ONE 2013, 8, e59202. [Google Scholar] [CrossRef] [PubMed]
- Hulley, S.B.; Walsh, J.M.; Newman, T.B. Health policy on blood cholesterol. Time to change directions. Circulation 1992, 86, 1026–1029. [Google Scholar] [CrossRef] [Green Version]
- Ioannidis, J.P. Integration of evidence from multiple meta-analyses: A primer on umbrella reviews, treatment networks and multiple treatments meta-analyses. CMAJ 2009, 181, 488–493. [Google Scholar] [CrossRef] [Green Version]
- Ioannidis, J.P. The mass production of redundant, misleading, and conflicted systematic reviews and meta-analyses. Milbank Q. 2016, 94, 485–514. [Google Scholar] [CrossRef] [Green Version]
- Siontis, K.C.; Hernandez-Boussard, T.; Ioannidis, J.P. Overlapping meta-analyses on the same topic: Survey of published studies. BMJ (Clin. Res. Ed.) 2013, 347, f4501. [Google Scholar] [CrossRef] [Green Version]
- Park, J.H.; Eisenhut, M.; van der Vliet, H.J.; Shin, J.I. Statistical controversies in clinical research: Overlap and errors in the meta-analyses of microRNA genetic association studies in cancers. Ann. Oncol. 2017, 28, 1169–1182. [Google Scholar] [CrossRef]
- Markozannes, G.; Tzoulaki, I.; Karli, D.; Evangelou, E.; Ntzani, E.; Gunter, M.J.; Norat, T.; Ioannidis, J.P.; Tsilidis, K.K. Diet, body size, physical activity and risk of prostate cancer: An umbrella review of the evidence. Eur. J. Cancer 2016, 69, 61–69. [Google Scholar] [CrossRef] [PubMed]


| Type/Author, Year | Study Design | No of Study | No of Total Participants | Random Effects (Reported) (ES, 95%CI) | Random Effects (Re-Analyzed) (ES, 95%CI) | Fixed Effects (Re-Analyzed) (ES, 95%CI) | Largest Effect § | Egger | I2 (P) † | P (Random) | P (Fixed) | 95% PI (Random) | Small Study Effect | Same Direction | Evidence |
|---|---|---|---|---|---|---|---|---|---|---|---|---|---|---|---|
| Bladder cancer | |||||||||||||||
| Luo 2015 | Obs | 1 | 1117 | 1.14 (0.89–1.44) | 1.14 (0.89–1.44) | 1.14 (0.89–1.44) | 1.14 (0.89–1.44) | - | - | 0.286 | 0.286 | NA | - | No | Non-significant |
| Breast cancer | |||||||||||||||
| Mei 2017 | Cohort | 7 | 24,255 | 0.65 (0.43–0.99) | 0.65 (0.43–0.98) | 0.72 (0.67–0.77) | 0.78 (0.72–0.84) | 0.541 | 92.7 (<0.001) | 0.042 | <0.001 | 0.15–2.76 | No | Yes | Weak |
| Liu 2017 | Cohort | 8 | 68,373 | 0.72 (0.58–0.89) | 0.72 (0.58–0.89) | 0.74 (0.69–0.78) | 0.46 (0.38–0.55) | 0.702 | 87.4 (<0.001) | 0.002 | <0.001 | 0.36–1.44 | No | Yes | Weak |
| Manthravadi 2016 | Cohort | 8 | 40,756 | 0.66 (0.44–0.99) | 0.66 (0.44–0.99) | 0.64 (0.57–0.70) | 0.39 (0.33–0.46) | 0.864 | 89.0 (<0.001) | 0.043 | <0.001 | 0.18–2.40 | No | Yes | Weak |
| Zhong 2015 (post-diagnostic) | Obs | 6 | 51,265 | 0.75 (0.55–1.02) | 0.75 (0.55–1.03) | 0.72 (0.64–0.80) | 0.47 (0.38–0.59) | 0.816 | 77.8 (<0.001) | 0.079 | <0.001 | 0.27–2.09 | No | No | Non-significant |
| Zhong 2015 (pre-diagnostic) | Obs | 3 | 49,116 | 0.73 (0.62–0.86) | 0.73 (0.63–0.86) | 0.76 (0.69–0.83) | 0.60 (0.45–0.81) | 0.501 | 33.3 (0.269) | <0.001 | <0.001 | 0.18–2.95 | No | Yes | Suggestive |
| Colorectal cancer | |||||||||||||||
| Mei 2017 | Cohort | 9 | 44,476 | 0.76 (0.68–0.86) | 0.76 (0.68–0.86) | 0.75 (0.72–0.80) | 0.72 (0.67–0.78) | 0.793 | 67.3 (0.002) | <0.001 | <0.001 | 0.54–1.07 | No | Yes | Suggestive * |
| Gray 2016 (post-diagnostic) | Obs | 11 | 21,030 | 0.84 (0.73–0.98) | 0.85 (0.73–0.98) | 0.84 (0.79–0.90) | 0.90 (0.80–1.01) | 0.760 | 69.0 (<0.001) | 0.029 | <0.001 | 0.53–1.34 | No | No | Weak |
| Gray 2016 (pre-diagnostic) | Obs | 6 | 44,026 | 0.85 (0.76–0.96) | 0.85 (0.76–0.96) | 0.84 (0.80–0.88) | 0.85 (0.79–0.92) | 0.720 | 76.0 (<0.001) | 0.011 | <0.001 | 0.59–1.24 | No | Yes | Suggestive * |
| Ling 2015 (post-diagnostic) | Cohort | 5 | 10,038 | 0.93 (0.68–1.27) | 0.93 (0.68–1.27) | 0.81 (0.73–0.90) | 0.75 (0.66–0.84) | 0.443 | 69.4 (0.011) | 0.639 | <0.001 | 0.33–2.59 | No | No | Non-significant |
| Ling 2015 (pre-diagnostic) | Cohort | 4 | 12,396 | 0.73 (0.61–0.88) | 0.73 (0.62–0.86) | 0.74 (0.66–0.84) | 0.81 (0.68–0.96) | 0.251 | 19.9 (0.291) | <0.001 | <0.001 | 0.45–1.19 | No | Yes | Suggestive |
| Cai 2015 (post & pre-diagnostic) | Obs | 4 | 11,786 | 0.76 (0.61–0.95) | 0.79 (0.65–0.95) | 0.79 (0.65–0.95) | 0.71 (0.54–0.94) | 0.587 | 0.0 (0.447) | 0.013 | 0.013 | 0.52–1.18 | No | Yes | Suggestive |
| Cai 2015 (post-diagnostic) | Obs | 4 | 15,862 | 0.76 (0.68–0.85) | 0.76 (0.68–0.85) | 0.76 (0.68–0.85) | 0.75 (0.66–0.84) | 0.723 | 0.0 (0.393) | <0.001 | <0.001 | 0.60–0.96 | No | Yes | Convincing |
| Cai 2015 (pre-diagnostic) | Obs | 2 | 10,553 | 0.70 (0.54–0.91) | 0.70 (0.54–0.91) | 0.70 (0.54–0.91) | 0.71 (0.54–0.94) | - | 0.0 (0.795) | 0.007 | 0.007 | NA | - | Yes | - |
| Zhong 2015 (post-diagnostic) | Obs | 6 | 12,441 | 0.96 (0.76–1.22) | 0.97 (0.75–1.24) | 0.86 (0.77–0.95) | 0.75 (0.66–0.85) | 0.295 | 65.9 (0.004) | 0.792 | 0.003 | 0.45–2.09 | No | No | Weak |
| Zhong 2015 (pre-diagnostic) | Obs | 3 | 18,733 | 0.77 (0.66–0.89) | 0.78 (0.69–0.88) | 0.79 (0.72–0.87) | 0.82 (0.74–0.91) | 0.353 | 31.4 (0.300) | <0.001 | <0.001 | 0.27–2.25 | No | Yes | Suggestive |
| Endocrine-Related Gynecological Cancer | |||||||||||||||
| Xie 2017 | Obs | 9 | 5449 | - | 0.70 (0.58–0.83) | 0.71 (0.63–0.80) | 0.66 (0.55–0.80) | 0.250 | 33.3 (0.151) | <0.001 | <0.001 | 0.47–1.04 | No | Yes | Suggestive |
| Endometrial Cancer | |||||||||||||||
| Xie 2017 | Obs | 4 | 3460 | - | 0.80 (0.62–1.03) | 0.84 (0.69–1.01) | 0.92 (0.70–1.20) | 0.046 | 0.0 (0.680) | 0.083 | 0.058 | 0.34–1.89 | Yes | Yes | Non-significant |
| Zhong 2015 (post-diagnostic) | Obs | 3 | 3261 | 0.89 (0.72–1.09) | 0.86 (0.64–1.15) | 0.89 (0.72–1.09) | 0.92 (0.70–1.20) | 0.156 | 0.0 (0.203) | 0.309 | 0.255 | 0.05–13.49 | No | Yes | Non-significant |
| Kidney Cancer | |||||||||||||||
| Nayan 2017 | Overall | 7 | 11,491 | 0.74 (0.63–0.88) | 0.74 (0.63–0.88) | 0.78 (0.71–0.87) | 0.80 (0.66–0.97) | 0.057 | 51.8 (0.052) | 0.001 | <0.001 | 0.47–1.17 | Yes | Yes | Weak |
| Luo 2015 | Obs | 3 | 5881 | 0.81 (0.68–0.96) | 0.81 (0.69–0.96) | 0.82 (0.72–0.94) | 0.84 (0.69–1.00) | 0.378 | 26.0 (0.260) | 0.015 | 0.005 | 0.19–3.47 | No | No | Suggestive |
| Lymphoma | |||||||||||||||
| Zhong 2015 (post-diagnostic) | Obs | 3 | 782 | 1.15 (0.85–1.55) | 1.15 (0.85–1.55) | 1.15 (0.85–1.55) | 1.23 (0.88–1.71) | 0.195 | 0.0 (0.602) | 0.362 | 0.362 | 0.16–8.24 | No | Yes | Non-significant |
| Ovarian Cancer | |||||||||||||||
| Li 2018 | Obs | 7 | 16,389 | 0.74 (0.63–0.87) | 0.74 (0.63–0.87) | 0.79 (0.73–0.86) | 0.81 (0.72–0.90) | 0.061 | 55.0 (0.038) | <0.001 | <0.001 | 0.49–1.11 | No | Yes | Suggestive |
| Xie 2017 | Obs | 5 | 1989 | - | 0.63 (0.54–0.74) | 0.63 (0.54–0.74) | 0.66 (0.55–0.80) | 0.200 | 0.0 (0.680) | <0.001 | <0.001 | 0.48–0.82 | No | Yes | Convincing |
| Zhong 2015 (post-diagnostic) | Obs | 2 | 276 | 0.39 (0.22–0.71) | 0.39 (0.22–0.71) | 0.39 (0.22–0.71) | 0.24 (0.07–0.87) | - | 0.0 (0.395) | 0.002 | 0.002 | NA | - | Yes | - |
| Pancreatic Cancer | |||||||||||||||
| Jian-Yu 2018 | Overall | 6 | 12,057 | 0.75 (0.59–0.90) | 0.81 (0.69–0.95) | 0.92 (0.87–0.97) | 0.94 (0.89–1.01) | 0.008 | 81.1 (<0.001) | 0.009 | 0.001 | 0.52–1.26 | Yes | No | Weak |
| Prostate Cancer | |||||||||||||||
| Mei 2017 | Cohort | 10 | 73,716 | 0.72 (0.63–0.81) | 0.72 (0.63–0.81) | 0.89 (0.87–0.91) | 0.79 (0.76–0.82) | 0.044 | 95.0 (<0.001) | <0.001 | <0.001 | 0.46–1.12 | Yes | Yes | Weak |
| Meng 2016 (post-diagnostic) | Obs | 7 | 58,838 | 0.84 (0.71–0.99) | 0.77 (0.68–0.86) | 0.80 (0.76–0.83) | 0.79 (0.75–0.83) | 0.376 | 72.0 (0.002) | <0.001 | <0.001 | 0.54–1.09 | No | Yes | Suggestive * |
| Meng 2016 (pre-diagnostic) | Obs | 2 | 1337 | 0.56 (0.38–0.85) | 0.56 (0.38–0.83) | 0.56 (0.38–0.83) | 0.57 (0.38–0.85) | - | 0.0 (0.770) | 0.004 | 0.004 | NA | - | Yes | - |
| Raval 2016 | Cohort | 6 | 31,539 | 0.76 (0.63–0.90) | 0.76 (0.63–0.91) | 0.80 (−0.75–0.86) | 0.86 (0.78–0.95) | 0.503 | 71.0 (0.004) | 0.004 | <0.001 | 0.44–1.29 | No | Yes | Weak |
| Luo 2015 | Obs | 5 | 22,439 | 0.82 (0.70–0.97) | 0.83 (0.70–0.97) | 0.85 (0.78–0.93) | 0.86 (0.78–0.95) | 0.461 | 46.0 (0.110) | 0.022 | <0.001 | 0.52–1.31 | No | Yes | Suggestive |
| Zhong 2015 (post-diagnostic) | Obs | 3 | 18,814 | 0.59 (0.35–0.99) | 0.59 (0.34–1.01) | 0.82 (0.75–0.90) | 0.86 (0.78–0.95) | 0.228 | 84.1 (0.001) | 0.053 | <0.001 | 0.00–406.64 | No | No | Non-significant |
| Urothelial Tract Cancer | |||||||||||||||
| Zhong 2015 (post-diagnostic) | Obs | 5 | 9488 | 0.87 (0.75–1.00) | 0.87 (0.75–1.00) | 0.87 (0.79–0.95) | 0.89 (0.71–1.12) | 0.917 | 52.8 (0.070) | 0.049 | 0.001 | 0.56–1.34 | No | No | Weak |
| Type/Author, Year | Study Design | No of Study | No of Total Participants | Random Effects (Reported) (ES, 95%CI) | Random Effects (Re-Analyzed) (ES, 95%CI) | Fixed Effects (Re-Analyzed) (ES, 95%CI) | Largest Effect § | Egger | I2 (P) † | P (Random) | P (Fixed) | 95% PI (Random) | Small Study Effect | Same Direction | Evidence |
|---|---|---|---|---|---|---|---|---|---|---|---|---|---|---|---|
| Bladder cancer | |||||||||||||||
| Luo 2015 | Obs | 2 | 2619 | 1.06 (0.87–1.29) | 1.06 (0.87–1.29) | 1.06 (0.87–1.29) | 1.04 (0.84–1.28) | - | 0.0 (0.590) | 0.559 | 0.559 | NA | - | Yes | Non-significant |
| Breast cancer | |||||||||||||||
| Liu 2017 | Cohort | 8 | 196,120 | 0.73 (0.59–0.92) | 0.73 (0.58–0.92) | 0.73 (0.67–0.78) | 0.85 (0.74–0.98) | 0.997 | 85.6 (<0.001) | 0.007 | <0.001 | 0.34–1.58 | No | Yes | Weak |
| Manthravadi 2016 | Cohort | 6 | 46,970 | 0.30 (0.46–1.06) | 0.69 (0.45–1.06) | 0.62 (0.54–0.71) | 0.35 (0.28–0.45) | 0.591 | 86.0 (<0.001) | 0.091 | <0.001 | 0.16–2.92 | No | No | Non-significant |
| Mansourian 2016 | Obs | 13 | 99,610 | 0.85 (0.83–0.87) | 0.85 (0.82–0.88) | 0.85 (0.83–0.87) | 0.83 (0.80–0.86) | 0.465 | 8.6 (0.360) | <0.001 | <0.001 | NA | No | Yes | - |
| Zhong 2015 (post-diagnostic) | Obs | 3 | 49,116 | 0.60 (0.41–0.88) | 0.60 (0.39–0.92) | 0.60 (0.52–0.69) | 0.47 (0.39–0.57) | 0.995 | 84.1 (<0.001) | 0.018 | <0.001 | 0.00–106.05 | No | Yes | Weak |
| Zhong 2015 (pre-diagnostic) | Obs | 4 | 88,235 | 0.73 (0.61–0.89) | 0.77 (0.68–0.87) | 0.77 (0.68–0.87) | 0.60 (0.35–1.01) | 0.002 | 21.5 (0.428) | <0.001 | <0.001 | 0.59–1.01 | Yes | No | Suggestive |
| Colorectal cancer | |||||||||||||||
| Gray 2016 (post-diagnostic) | Obs | 4 | 19,152 | 0.84 (0.68–1.04) | 0.84 (0.68–1.04) | 0.82 (0.75–0.91) | 0.90 (0.77–1.05) | 0.887 | 67.0 (0.030) | 0.118 | <0.001 | 0.36–2.00 | No | Yes | Non-significant |
| Gray 2016 (pre-diagnostic) | Obs | 6 | 86,622 | 0.82 (0.79–0.86) | 0.82 (0.79–0.86) | 0.82 (0.79–0.86) | 0.81 (0.75–0.88) | 0.152 | 0.0 (0.570) | <0.001 | <0.001 | NA | No | Yes | - |
| Ling 2015 (post-diagnostic) | Cohort | 3 | 8667 | 0.70 (0.60–0.81) | 0.70 (0.60–0.82) | 0.70 (0.60–0.82) | 0.71 (0.61–0.84) | 0.219 | 0.0 (0.535) | <0.001 | <0.001 | 0.26–1.87 | No | Yes | Suggestive |
| Ling 2015 (pre-diagnostic) | Cohort | 6 | 74,042 | 0.80 (0.77–0.84) | 0.80 (0.77–0.84) | 0.80 (0.77–0.84) | 0.79 (0.74–0.85) | 0.231 | 10.8 (0.347) | <0.001 | <0.001 | 0.74–0.88 | No | Yes | Convincing |
| Cai 2015 (pre&post-diagnostic) | Obs | 6 | 69,949 | 0.80 (0.75–0.85) | 0.80 (0.75–0.85) | 0.80 (0.77–0.85) | 0.79 (0.74–0.85) | 0.172 | 19.3 (0.288) | <0.001 | <0.001 | 0.71–0.90 | No | Yes | Convincing |
| Cai 2015 (post-diagnostic) | Obs | 3 | 15,023 | 0.70 (0.60–0.81) | 0.70 (0.60–0.82) | 0.70 (0.60–0.82) | 0.71 (0.61–0.84) | 0.219 | 0.0 (0.535) | <0.001 | <0.001 | 0.26–1.87 | No | Yes | Suggestive |
| Cai 2015 (pre-diagnostic) | Obs | 5 | 69,375 | 0.80 (0.74–0.86) | 0.80 (0.74–0.86) | 0.81 (0.77–0.85) | 0.79 (0.74–0.85) | 0.298 | 28.3 (0.233) | <0.001 | <0.001 | 0.67–0.95 | No | Yes | Convincing |
| Zhong 2015 (post-diagnostic) | Obs | 4 | 11,070 | 0.79 (0.58–1.08) | 0.79 (0.58–1.08) | 0.77 (0.67–0.88) | 0.71 (0.61–0.83) | 0.959 | 60.5 (0.058) | 0.141 | <0.001 | 0.24–2.65 | No | No | Weak |
| Zhong 2015 (pre-diagnostic) | Obs | 3 | 25,081 | 0.82 (0.73–0.91) | 0.82 (0.74–0.90) | 0.83 (0.78–0.89) | 0.77 (0.68–0.88) | 0.414 | 36.2 (0.239) | <0.001 | <0.001 | 0.31–2.19 | No | Yes | Suggestive |
| Endocrine gynecological cancer | |||||||||||||||
| Xie 2017 | Obs | 4 | 1079 | - | 0.75 (0.55–1.01) | 0.72 (0.58–0.90) | 0.74 (0.54–1.02) | 0.357 | 35.1 (0.202) | 0.057 | 0.004 | 0.27–2.09 | No | Yes | Non-significant |
| Kidney cancer | |||||||||||||||
| Nayan 2017 | Overall | 6 | 10,337 | 0.67 (0.47–0.94) | 0.67 (0.48–0.94) | 0.81 (0.71–0.93) | 0.85 (0.72–1.01) | 0.120 | 67.0 (0.010) | 0.022 | 0.003 | 0.25–1.82 | No | No | Weak |
| Luo 2015 | Obs | 2 | 3273 | 0.71 (0.35–1.50) | 0.72 (0.35–1.51) | 0.84 (0.64–1.11) | 1.02 (0.74–1.39) | – | 82.0 (0.020) | 0.389 | 0.222 | NA | - | Yes | Non-significant |
| Ovarian cancer | |||||||||||||||
| Li 2018 | Obs | 3 | 27,690 | 0.87 (0.80–0.95) | 0.87 (0.80–0.95) | 0.87 (0.80–0.95) | 0.93 (0.81–1.08) | 0.577 | 0.0 (0.411) | 0.002 | 0.002 | 0.50–1.54 | No | No | Weak |
| Prostate cancer | |||||||||||||||
| Meng 2016 (post-diagnostic) | Obs | 4 | 57,058 | 0.64 (0.52–0.79) | 0.64 (0.52–0.79) | 0.73 (0.69–0.77) | 0.74 (0.70–0.79) | 0.254 | 82.0 (<0.001) | <0.001 | <0.001 | 0.27–1.55 | No | Yes | Suggestive * |
| Meng 2016 (pre-diagnostic) | Obs | 6 | 35,684 | 0.53 (0.29–0.98) | 0.54 (0.37–0.78) | 0.78 (0.72–0.84) | 0.81 (0.75–0.88) | 0.019 | 77.0 (<0.001) | 0.001 | <0.001 | 0.18–1.64 | Yes | Yes | Weak |
| Raval 2016 | Cohort | 5 | 21,306 | 0.76 (0.64–0.89) | 0.76 (0.64–0.89) | 0.76 (0.69–0.84) | 0.76 (0.66–0.88) | 0.593 | 30.0 (0.150) | 0.001 | <0.001 | 0.49–1.17 | No | Yes | Suggestive |
| Luo 2015 | Obs | 7 | 28,897 | 0.70 (0.59–0.83) | 0.70 (0.60–0.83) | 0.74 (0.68–0.82) | 0.76 (0.66–0.88) | 0.011 | 43.0 (0.100) | <0.001 | <0.001 | 0.48–1.04 | Yes | Yes | Suggestive |
| Zhong 2015 (post-diagnostic) | Obs | 3 | 19,322 | 0.77 (0.70–0.85) | 0.77 (0.70–0.85) | 0.77 (0.70–0.85) | 0.76 (0.66–0.88) | 0.973 | 0.0 (0.970) | <0.001 | <0.001 | 0.38–1.54 | No | Yes | Suggestive |
| Zhong 2015 (pre-diagnostic) | Obs | 3 | 5460 | 0.44 (0.20–0.93) | 0.44 (0.21–0.92) | 0.72 (0.62–0.82) | 0.78 (0.67–0.90) | 0.148 | 86.3 (0.001) | 0.029 | <0.001 | Not estimable | No | Yes | Suggestive * |
| Urothelial tract cancer | |||||||||||||||
| Zhong 2015 (post-diagnostic) | Obs | 4 | 6880 | 0.86 (0.65–1.16) | 0.87 (0.66–1.14) | 0.87 (0.76–1.01) | 0.86 (0.72–1.03) | 0.901 | 61.8 (0.073) | 0.307 | 0.070 | 0.30–2.53 | No | Yes | Non-significant |
| Type/Author, Year | Study Design | No of Study | No of Total Participants | Random Effects (Reported) (ES, 95%CI) | Random Effects (Re-Analyzed) (ES, 95%CI) | Fixed Effects (Re-Analyzed) (ES, 95%CI) | Largest Effect § | Egger | I2 (P) † | P (Random) | P (Fixed) | 95% PI (Random) | Small Study Effect | Same Direction | Evidence |
|---|---|---|---|---|---|---|---|---|---|---|---|---|---|---|---|
| Recurrence-free survival | |||||||||||||||
| Bladder cancer | |||||||||||||||
| Luo 2015 | Obs | 3 | 3571 | 1.05 (0.94–1.18) | 1.06 (0.94–1.19) | 1.06 (0.94–1.19) | 1.04 (0.96–1.24) | 0.844 | 0.0 (0.950) | 0.375 | 0.375 | 0.47–2.36 | No | Yes | Non-significant |
| Breast cancer | |||||||||||||||
| Manthravadi 2016 | Cohort | 10 | 32,373 | 0.64 (0.53–0.79) | 0.64 (0.52–0.79) | 0.69 (0.60–0.79) | 0.80 (0.64–1.00) | 0.093 | 44.0 (0.070) | <0.001 | <0.001 | 0.38–1.09 | Yes | Yes | Suggestive |
| Colorectal cancer | |||||||||||||||
| Cai 2015 | Obs | 2 | 1233 | 0.98 (0.36–2.70) | 0.98 (0.36–2.70) | 1.12 (0.58–2.15) | 1.28 (0.64–2.54) | – | 26.1 (0.345) | 0.975 | 0.730 | NA | - | Yes | Non-significant |
| Kidney cancer | |||||||||||||||
| Nayan 2017 | Overall | 4 | 2197 | 0.97 (0.89–1.06) | 0.97 (0.89–1.06) | 1.00 (0.99–1.01) | 1.09 (0.65–1.81) | 0.364 | 55.2 (0.082) | 0.524 | 0.899 | 0.70–1.36 | No | Yes | Non-significant |
| Luo 2015 | Obs | 3 | 5080 | 0.91 (0.54–1.55) | 0.91 (0.54–1.55) | 1.00 (0.81–1.23) | 1.22 (0.95–1.57) | 0.783 | 72.0 (0.030) | 0.736 | 0.991 | 0.47–2.36 | No | Yes | Non-significant |
| Prostate cancer | |||||||||||||||
| Park 2013 | Cohort | 13 | 21,185 | 0.90 (0.74–1.08) | 0.90 (0.74–1.08) | 0.92 (0.84–1.00) | 0.99 (0.83–1.18) | 0.649 | 69.6 (<0.001) | 0.252 | 0.057 | 0.48–1.67 | No | Yes | Non-significant |
| Progression-free survival | |||||||||||||||
| Bladder cancer | |||||||||||||||
| Luo 2015 | Obs | 2 | 2069 | 0.87 (0.65–1.15) | 0.87 (0.65–1.15) | 0.87 (0.65–1.15) | 0.77 (0.52–1.13) | 0.461 | 0.0 (0.370) | 0.320 | 0.320 | NA | No | Yes | Non-significant |
| Endocrine gynecological cancer | |||||||||||||||
| Xie 2017 | Obs | 3 | 421 | - | 0.69 (0.46–1.02) | 0.68 (0.49–0.93) | 0.65 (0.39–1.07) | 0.439 | 33.6 (0.222) | 0.066 | 0.018 | 0.02–27.87 | No | Yes | Non-significant |
| Kidney cancer | |||||||||||||||
| Nayan 2017 | Overall | 2 | 4965 | 0.92 (0.51–1.65) | 0.92 (0.51–1.65) | 1.00 (0.82–1.23) | 0.67 (0.47–0.96) | – | 86.2 (0.007) | 0.772 | 0.996 | NA | - | No | Non-significant |
| Prostate cancer | |||||||||||||||
| Luo 2015 | Obs | 5 | 6032 | 0.84 (0.62–1.14) | 0.84 (0.62–1.14) | 0.87 (0.71–1.05) | 1.10 (0.78–1.56) | 0.607 | 52 (0.080) | 0.260 | 0.148 | 0.34–2.10 | No | Yes | Non-significant |
| Disease-free survival | |||||||||||||||
| Colorectal cancer | |||||||||||||||
| Cai 2015 | Obs | 2 | 1233 | 1.13 (0.78–1.62) | 1.13 (0.78–1.62) | 1.13 (0.78–1.62) | 1.07 (0.68–1.67) | - | 0.0 (0.691) | 0.514 | 0.514 | NA | - | Yes | Non-significant |
| Cancer Type | No of Studies | No of Total Participants | Random Effects (RR, 95%CI) | P (Random) | Fixed Effects (RR, 95%CI) | P (Fixed) | Largest Effect § (RR, 95%CI) | D/N/I | Egger | I2 (P) † | 95% PI (Random) | 95% PI (Fixed) | Concordant Direction | Evidence |
|---|---|---|---|---|---|---|---|---|---|---|---|---|---|---|
| All-cause mortality | ||||||||||||||
| Bladder cancer | 1 | 1117 | 1.14 (0.89–1.44) | 0.286 | 1.14 (0.89–1.44) | 0.286 | 1.14 (0.89–1.44) | 0/1/0 | - | - | NA | NA | No | Non-significant |
| Breast cancer | 20 | 160,806 | 0.65 (0.55–0.77) | <0.001 | 0.66 (0.62–0.70) | <0.001 | 0.54 (0.44–0.67) | 12/0/8 | 0.787 | 85.2 (<0.001) | 0.33–1.29 | 0.34–1.28 | Yes | Suggestive * |
| Colorectal cancer | 24 | 85,231 | 0.81 (0.75–0.88) | <0.001 | 0.82 (0.80–0.86) | <0.001 | 0.82 (0.74–0.90) | 15/8/1 | 0.444 | 68.1 (<0.001) | 0.60–1.10 | 0.61–1.11 | Yes | Suggestive * |
| Endocrine-related gynecological cancer | 9 | 5449 | 0.70 (0.58–0.83) | <0.001 | 0.71 (0.63–0.80) | <0.001 | 0.66 (0.55–0.80) | 4/5/0 | 0.250 | 33.3 (0.151) | 0.47–1.04 | 0.49–1.03 | Yes | Suggestive |
| Endometrial cancer | 4 | 3460 | 0.80 (0.62–1.03) | 0.083 | 0.84 (0.69–1.01) | 0.058 | 0.92 (0.70–1.20) | 1/3/0 | 0.046 | 36.1 (0.196) | 0.34–1.89 | 0.38–1.82 | Yes | Non-significant |
| Kidney cancer | 7 | 11,491 | 0.74 (0.63–0.88) | 0.001 | 0.78 (0.71–0.87) | <0.001 | 0.80 (0.66–0.98) | 4/3/0 | 0.057 | 51.8 (0.053) | 0.47–1.17 | 0.51–1.20 | Yes | Weak |
| Lymphoma | 3 | 782 | 1.15 (0.85–1.55) | 0.362 | 1.15 (0.85–1.55) | 0.362 | 1.23 (0.88–1.71) | 0/3/0 | 0.195 | 0.0 (0.602) | 0.16–8.24 | 0.16–8.24 | Yes | Non-significant |
| Ovarian cancer | 7 | 16,307 | 0.74 (0.63–0.87) | <0.001 | 0.79 (0.73–0.86) | <0.001 | 0.81 (0.72–0.90) | 4/3/0 | 0.067 | 0.0 (0.411) | 0.49–1.12 | 0.55–1.15 | Yes | Suggestive |
| Pancreatic cancer | 6 | 12,057 | 0.81 (0.69–0.95) | 0.009 | 0.92 (0.87–0.97) | 0.001 | 0.94 (0.89–1.01) | 3/3/0 | 0.008 | 81.1 (<0.001) | 0.52–1.26 | 0.62–1.36 | No | Weak |
| Prostate cancer | 21 | 95,128 | 0.73 (0.67–0.81) | <0.001 | 0.89 (0.88–0.91) | <0.001 | 0.79 (0.75–0.83) | 15/6/0 | 0.002 | 89.9 (<0.001) | 0.50–1.08 | 0.61–1.30 | No | Weak |
| Urothelial tract cancer | 5 | 9488 | 0.87 (0.75–1.00) | 0.049 | 0.87 (0.79–0.95) | 0.001 | 0.89 (0.71–1.12) | 2/3/0 | 0.917 | 52.8 (0.070) | 0.56–1.34 | 0.58–1.29 | No | Weak |
| Cancer-specific mortality | ||||||||||||||
| Bladder cancer | 2 | 2619 | 1.06 (0.87–1.29) | 0.559 | 1.06 (0.87–1.29) | 0.559 | 1.04 (0.84–1.28) | 0/2/0 | - | 0.0 (0.590) | NA | NA | Yes | Non-significant |
| Breast cancer | 28 | 424,694 | 0.71 (0.65–0.78) | <0.001 | 0.82 (0.80–0.84) | <0.001 | 0.83 (0.80–0.86) | 12/16/0 | 0.044 | 84.0 (<0.001) | 0.50–1.02 | 0.58–1.16 | Yes | Weak |
| Colorectal cancer | 13 | 118,996 | 0.81 (0.78–0.85) | <0.001 | 0.82 (0.79–0.85) | <0.001 | 0.77 (0.69–0.87) | 8/5/0 | 0.282 | 26.2 (0.180) | 0.72–0.92 | 0.74–0.90 | Yes | Convincing |
| Endocrine-related gynecological cancer | 4 | 1079 | 0.75 (0.55–1.01) | 0.057 | 0.72 (0.58–0.90) | 0.004 | 0.74 (0.54–1.02) | 1/3/0 | 0.357 | 35.1 (0.202) | 0.27–2.09 | 0.29–1.82 | Yes | Non-significant |
| Kidney cancer | 6 | 10,337 | 0.67 (0.48–0.94) | 0.022 | 0.81 (0.71–0.93) | 0.003 | 0.85 (0.72–1.01) | 3/3/0 | 0.120 | 66.6 (0.011) | 0.25–1.82 | 0.33–1.98 | No | Weak |
| Ovarian cancer | 3 | 27,690 | 0.87 (0.80–0.95) | 0.002 | 0.87 (0.80–0.95) | 0.002 | 0.93 (0.81–1.08) | 1/2/0 | 0.577 | 0.0 (0.411) | 0.50–1.54 | 0.50–1.54 | No | Weak |
| Prostate cancer | 15 | 101,378 | 0.66 (0.58–0.74) | <0.001 | 0.74 (0.71–0.78) | <0.001 | 0.74 (0.70–0.79) | 11/4/0 | 0.010 | 68.3 (<0.001) | 0.47–0.93 | 0.54–1.02 | Yes | Weak |
| Urothelial tract cancer | 4 | 6880 | 0.87 (0.66–1.14) | 0.307 | 0.87 (0.76–1.01) | 0.070 | 0.86 (0.72–1.03) | 1/3/0 | 0.901 | 61.8 (0.073) | 0.30–2.53 | 0.34–2.22 | Yes | Non-significant |
| Recurrence-free survival | ||||||||||||||
| Bladder cancer | 3 | 3571 | 1.06 (0.94–1.19) | 0.375 | 1.06 (0.94–1.19) | 0.375 | 1.04 (0.96–1.24) | 0/3/0 | 0.844 | 0.0 (0.950) | 0.47–2.36 | 0.47–2.36 | Yes | Non-significant |
| Breast cancer | 10 | 32,373 | 0.64 (0.52–0.79) | <0.001 | 0.69 (0.60–0.79) | <0.001 | 0.80 (0.64–1.00) | 6/4/0 | 0.093 | 44.0 (0.070) | 0.38–1.09 | 0.42–1.14 | Yes | Weak |
| Colorectal cancer | 2 | 1233 | 0.98 (0.36–2.70) | 0.975 | 1.12 (0.58–2.15) | 0.730 | 1.28 (0.64–2.54) | 0/2/0 | - | 26.1 (0.345) | NA | NA | Yes | Non-significant |
| Kidney cancer | 4 | 2197 | 0.97 (0.89–1.06) | 0.524 | 1.00 (0.99–1.01) | 0.899 | 1.09 (0.65–1.81) | 1/3/0 | 0.364 | 56.8 (0.074) | 0.70–1.36 | 0.36–1.31 | Yes | Non-significant |
| Prostate cancer | 13 | 21,185 | 0.90 (0.74–1.08) | 0.252 | 0.92 (0.84–1.00) | 0.057 | 0.99 (0.83–1.18) | 5/7/1 | 0.649 | 69.6 (<0.001) | 0.48–1.67 | 0.50–1.66 | Yes | Non-significant |
| Progression-free survival | ||||||||||||||
| Bladder cancer | 2 | 2069 | 0.87 (0.65–1.15) | 0.320 | 0.87 (0.65–1.15) | 0.320 | 0.77 (0.52–1.13) | 0/2/0 | 0.461 | 0.0 (0.370) | NA | NA | Yes | Non-significant |
| Endocrine-related gynecological cancer | 3 | 421 | 0.69 (0.46–1.02) | 0.066 | 0.68 (0.49–0.93) | 0.018 | 0.65 (0.39–1.07) | 1/2/0 | 0.439 | 33.6 (0.222) | 0.02–27.87 | 0.02–19.47 | Yes | Non-significant |
| Kidney cancer | 2 | 4965 | 0.92 (0.51–1.65) | 0.772 | 1.00 (0.82–1.23) | 0.996 | 0.67 (0.47–0.96) | 1/1/0 | - | 86.2 (0.007) | NA | NA | No | Non-significant |
| Prostate cancer | 5 | 6032 | 0.84 (0.62–1.14) | 0.260 | 0.87 (0.71–1.05) | 0.148 | 1.10 (0.78–1.56) | 2/3/0 | 0.607 | 52 (0.080) | 0.34–2.10 | 0.38–2.00 | Yes | Non-significant |
| Disease-free survival | ||||||||||||||
| Colorectal cancer | 2 | 1,233 | 1.13 (0.78–1.62) | 0.514 | 1.13 (0.78–1.62) | 0.514 | 1.07 (0.68–1.67) | 0/2/0 | - | 0.0 (0.691) | NA | NA | Yes | Non-significant |
| Evidence Category | All-Cause Mortality * | Cancer-Specific Mortality | Recurrence Free Survival | Progression-Free Survival | Disease-Free Survival |
|---|---|---|---|---|---|
| Convincing | - | Colorectal cancer (0.82; 0.79–0.85) | - | - | - |
| Suggestive | Breast cancer (0.65; 0.55–0.77) Colorectal cancer (0.82; 0.75–0.88) Endocrine-related gynecological cancer (0.71; 0.58–0.83) Ovarian cancer (0.74; 0.63–0.87) | - | - | - | - |
| Weak | Kidney cancer (0.73; 0.71–0.87) Pancreatic cancer (0.81; 0.69–0.95) Prostate cancer (0.89; 0.88–0.91) Urothelial tract cancer (0.87; 0.75–1.00) | Breast cancer (0.71; 0.65–0.78) Kidney cancer (0.67; 0.48–0.94) Ovarian cancer (0.87; 0.80–0.95) Prostate cancer (0.66; 0.58–0.74) | Breast cancer (0.64; 0.52–0.79) | - | - |
| Non-significant | Bladder cancer Endometrial cancer Lymphoma | Bladder cancer Endocrine-related gynecological cancer Urothelial tract cancer | Bladder cancer Colorectal cancer Kidney cancer Prostate cancer | Bladder cancer Endocrine-related gynecological cancer Kidney cancer Prostate cancer | Colorectal cancer |
© 2020 by the authors. Licensee MDPI, Basel, Switzerland. This article is an open access article distributed under the terms and conditions of the Creative Commons Attribution (CC BY) license (http://creativecommons.org/licenses/by/4.0/).
Share and Cite
Jeong, G.H.; Lee, K.H.; Kim, J.Y.; Eisenhut, M.; Kronbichler, A.; van der Vliet, H.J.; Shin, J.I.; Gamerith, G. Statin and Cancer Mortality and Survival: An Umbrella Systematic Review and Meta-Analysis. J. Clin. Med. 2020, 9, 326. https://0-doi-org.brum.beds.ac.uk/10.3390/jcm9020326
Jeong GH, Lee KH, Kim JY, Eisenhut M, Kronbichler A, van der Vliet HJ, Shin JI, Gamerith G. Statin and Cancer Mortality and Survival: An Umbrella Systematic Review and Meta-Analysis. Journal of Clinical Medicine. 2020; 9(2):326. https://0-doi-org.brum.beds.ac.uk/10.3390/jcm9020326
Chicago/Turabian StyleJeong, Gwang Hun, Keum Hwa Lee, Jong Yeob Kim, Michael Eisenhut, Andreas Kronbichler, Hans J. van der Vliet, Jae Il Shin, and Gabriele Gamerith. 2020. "Statin and Cancer Mortality and Survival: An Umbrella Systematic Review and Meta-Analysis" Journal of Clinical Medicine 9, no. 2: 326. https://0-doi-org.brum.beds.ac.uk/10.3390/jcm9020326