Analysis of Faecal Zonulin and Calprotectin Concentrations in Healthy Children During the First Two Years of Life. An Observational Prospective Cohort Study

 , , , ,
Abstract
:1. Introduction
2. Materials and Methods
2.1. Subject Characteristics
2.2. Ethical Information
2.3. Enzyme Immunoassays
2.4. Statistical Analyses
3. Results
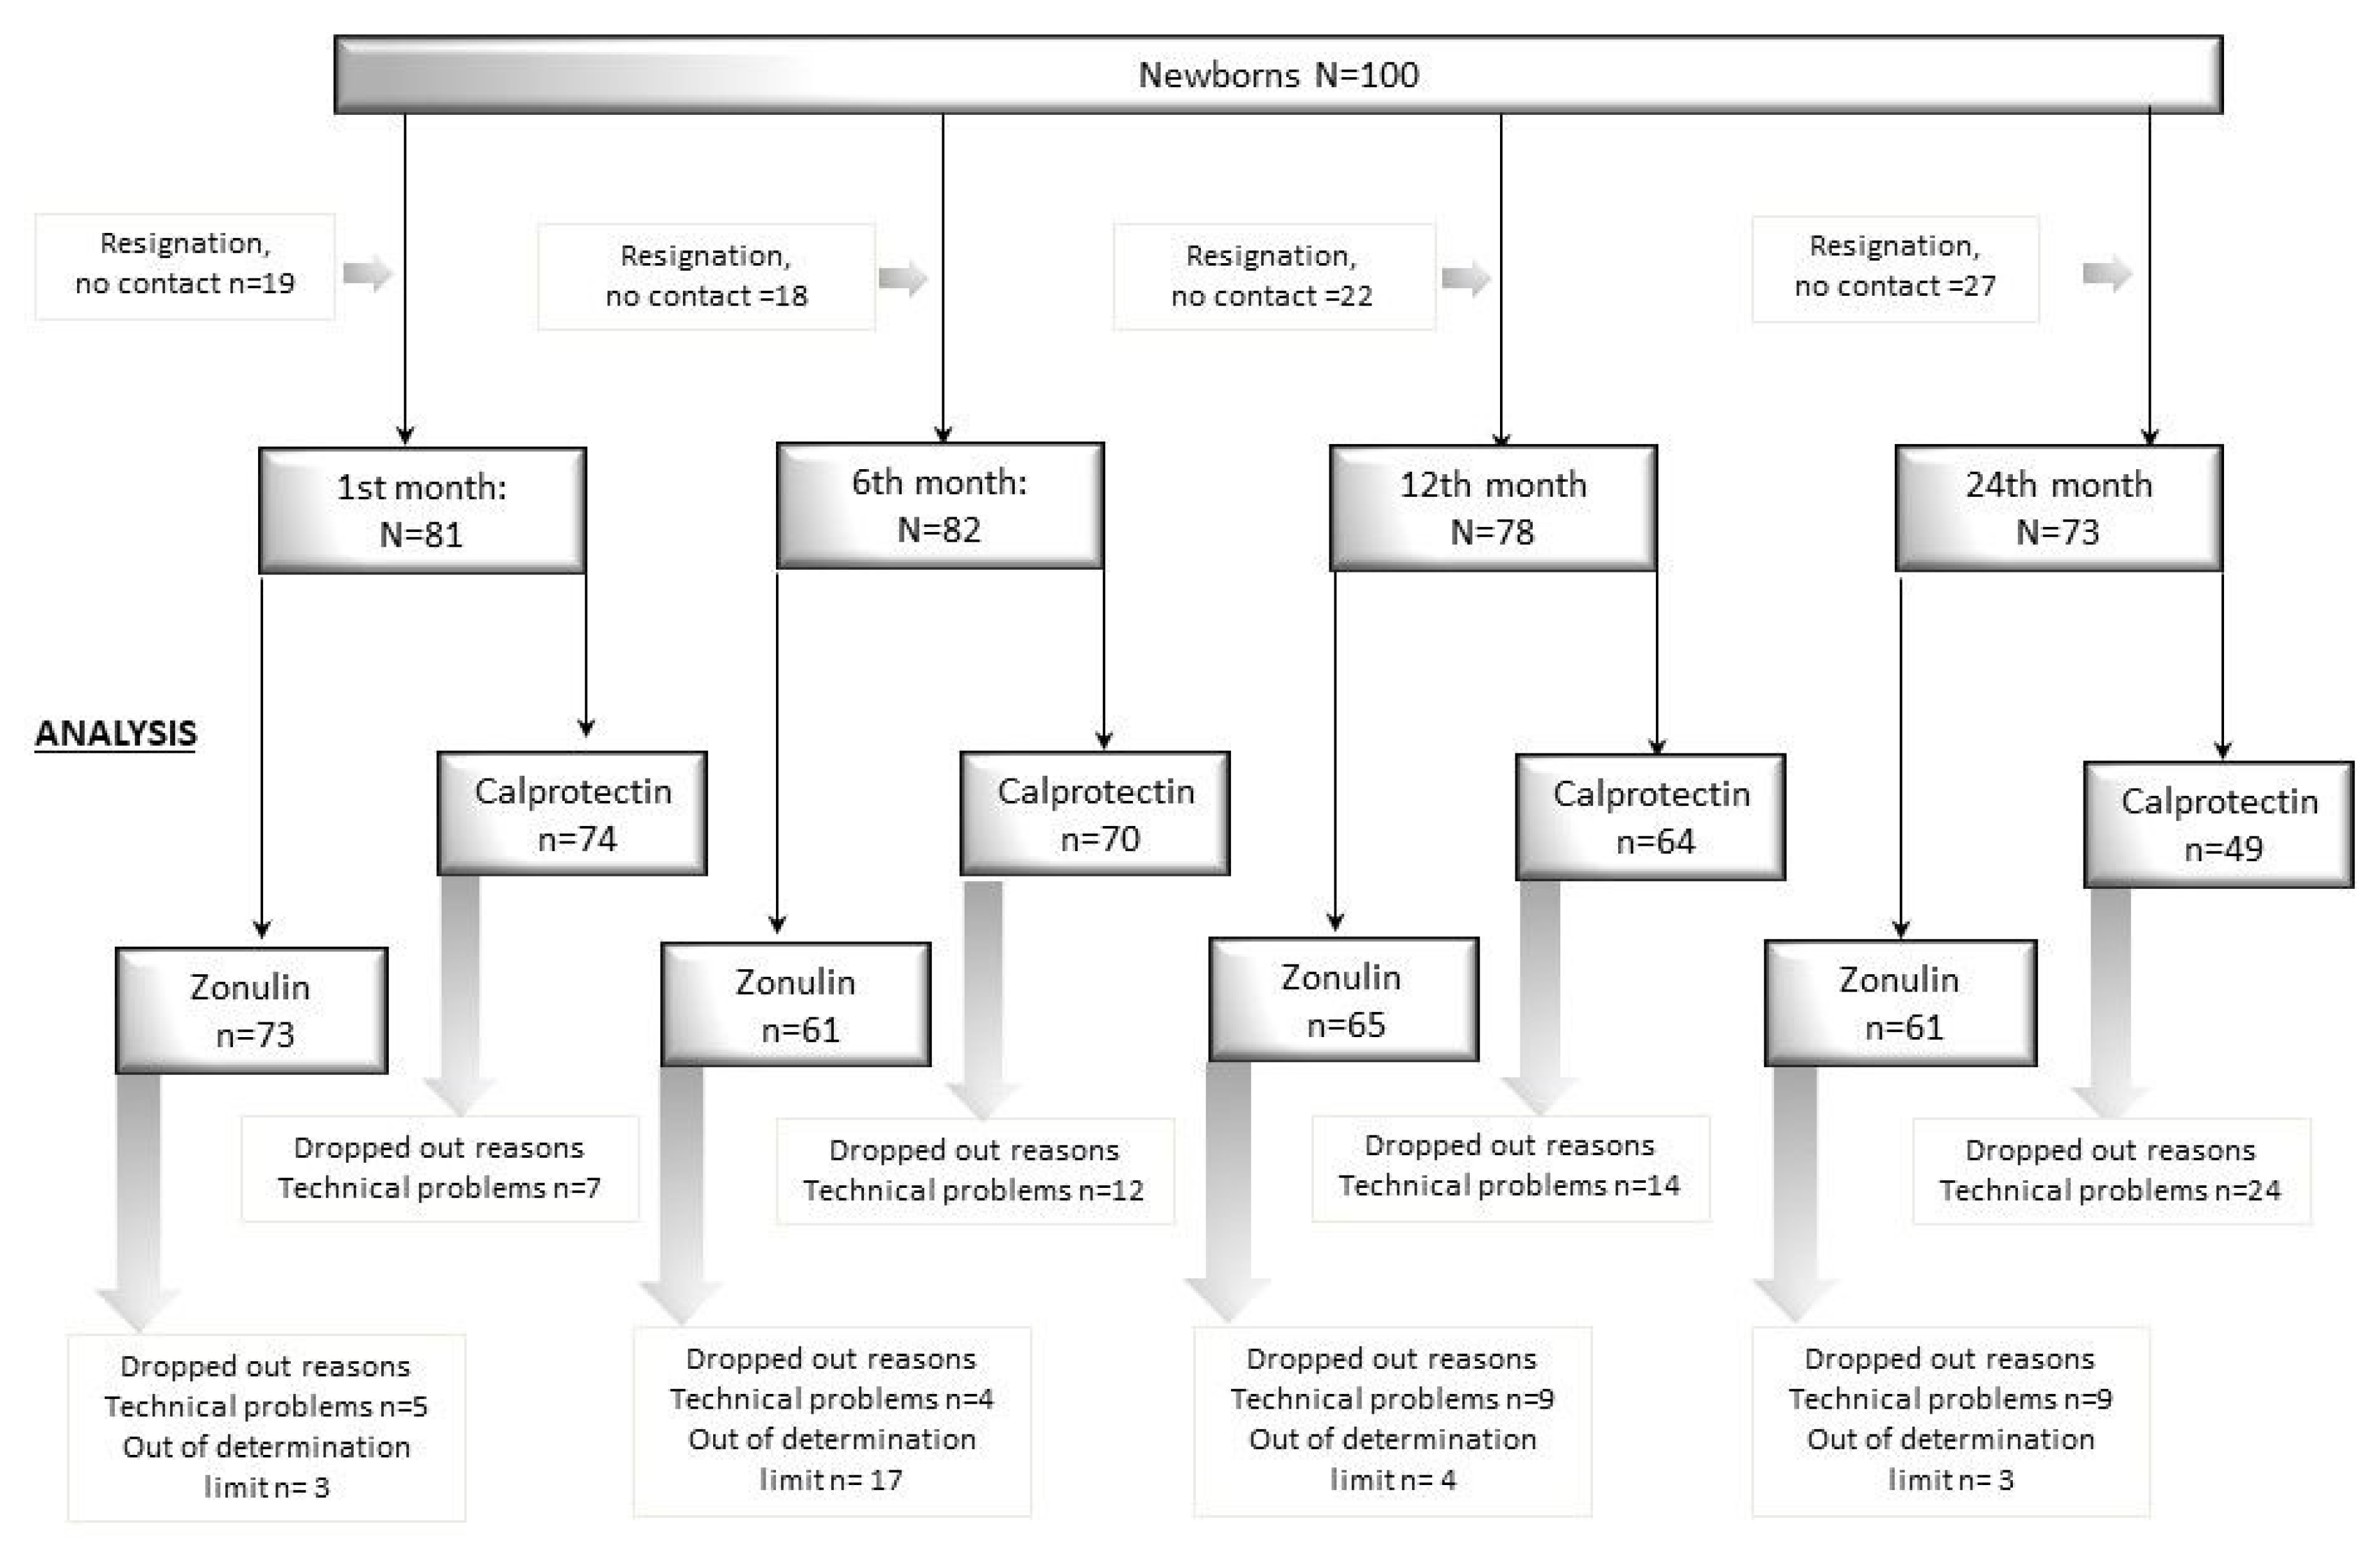
3.1. Population
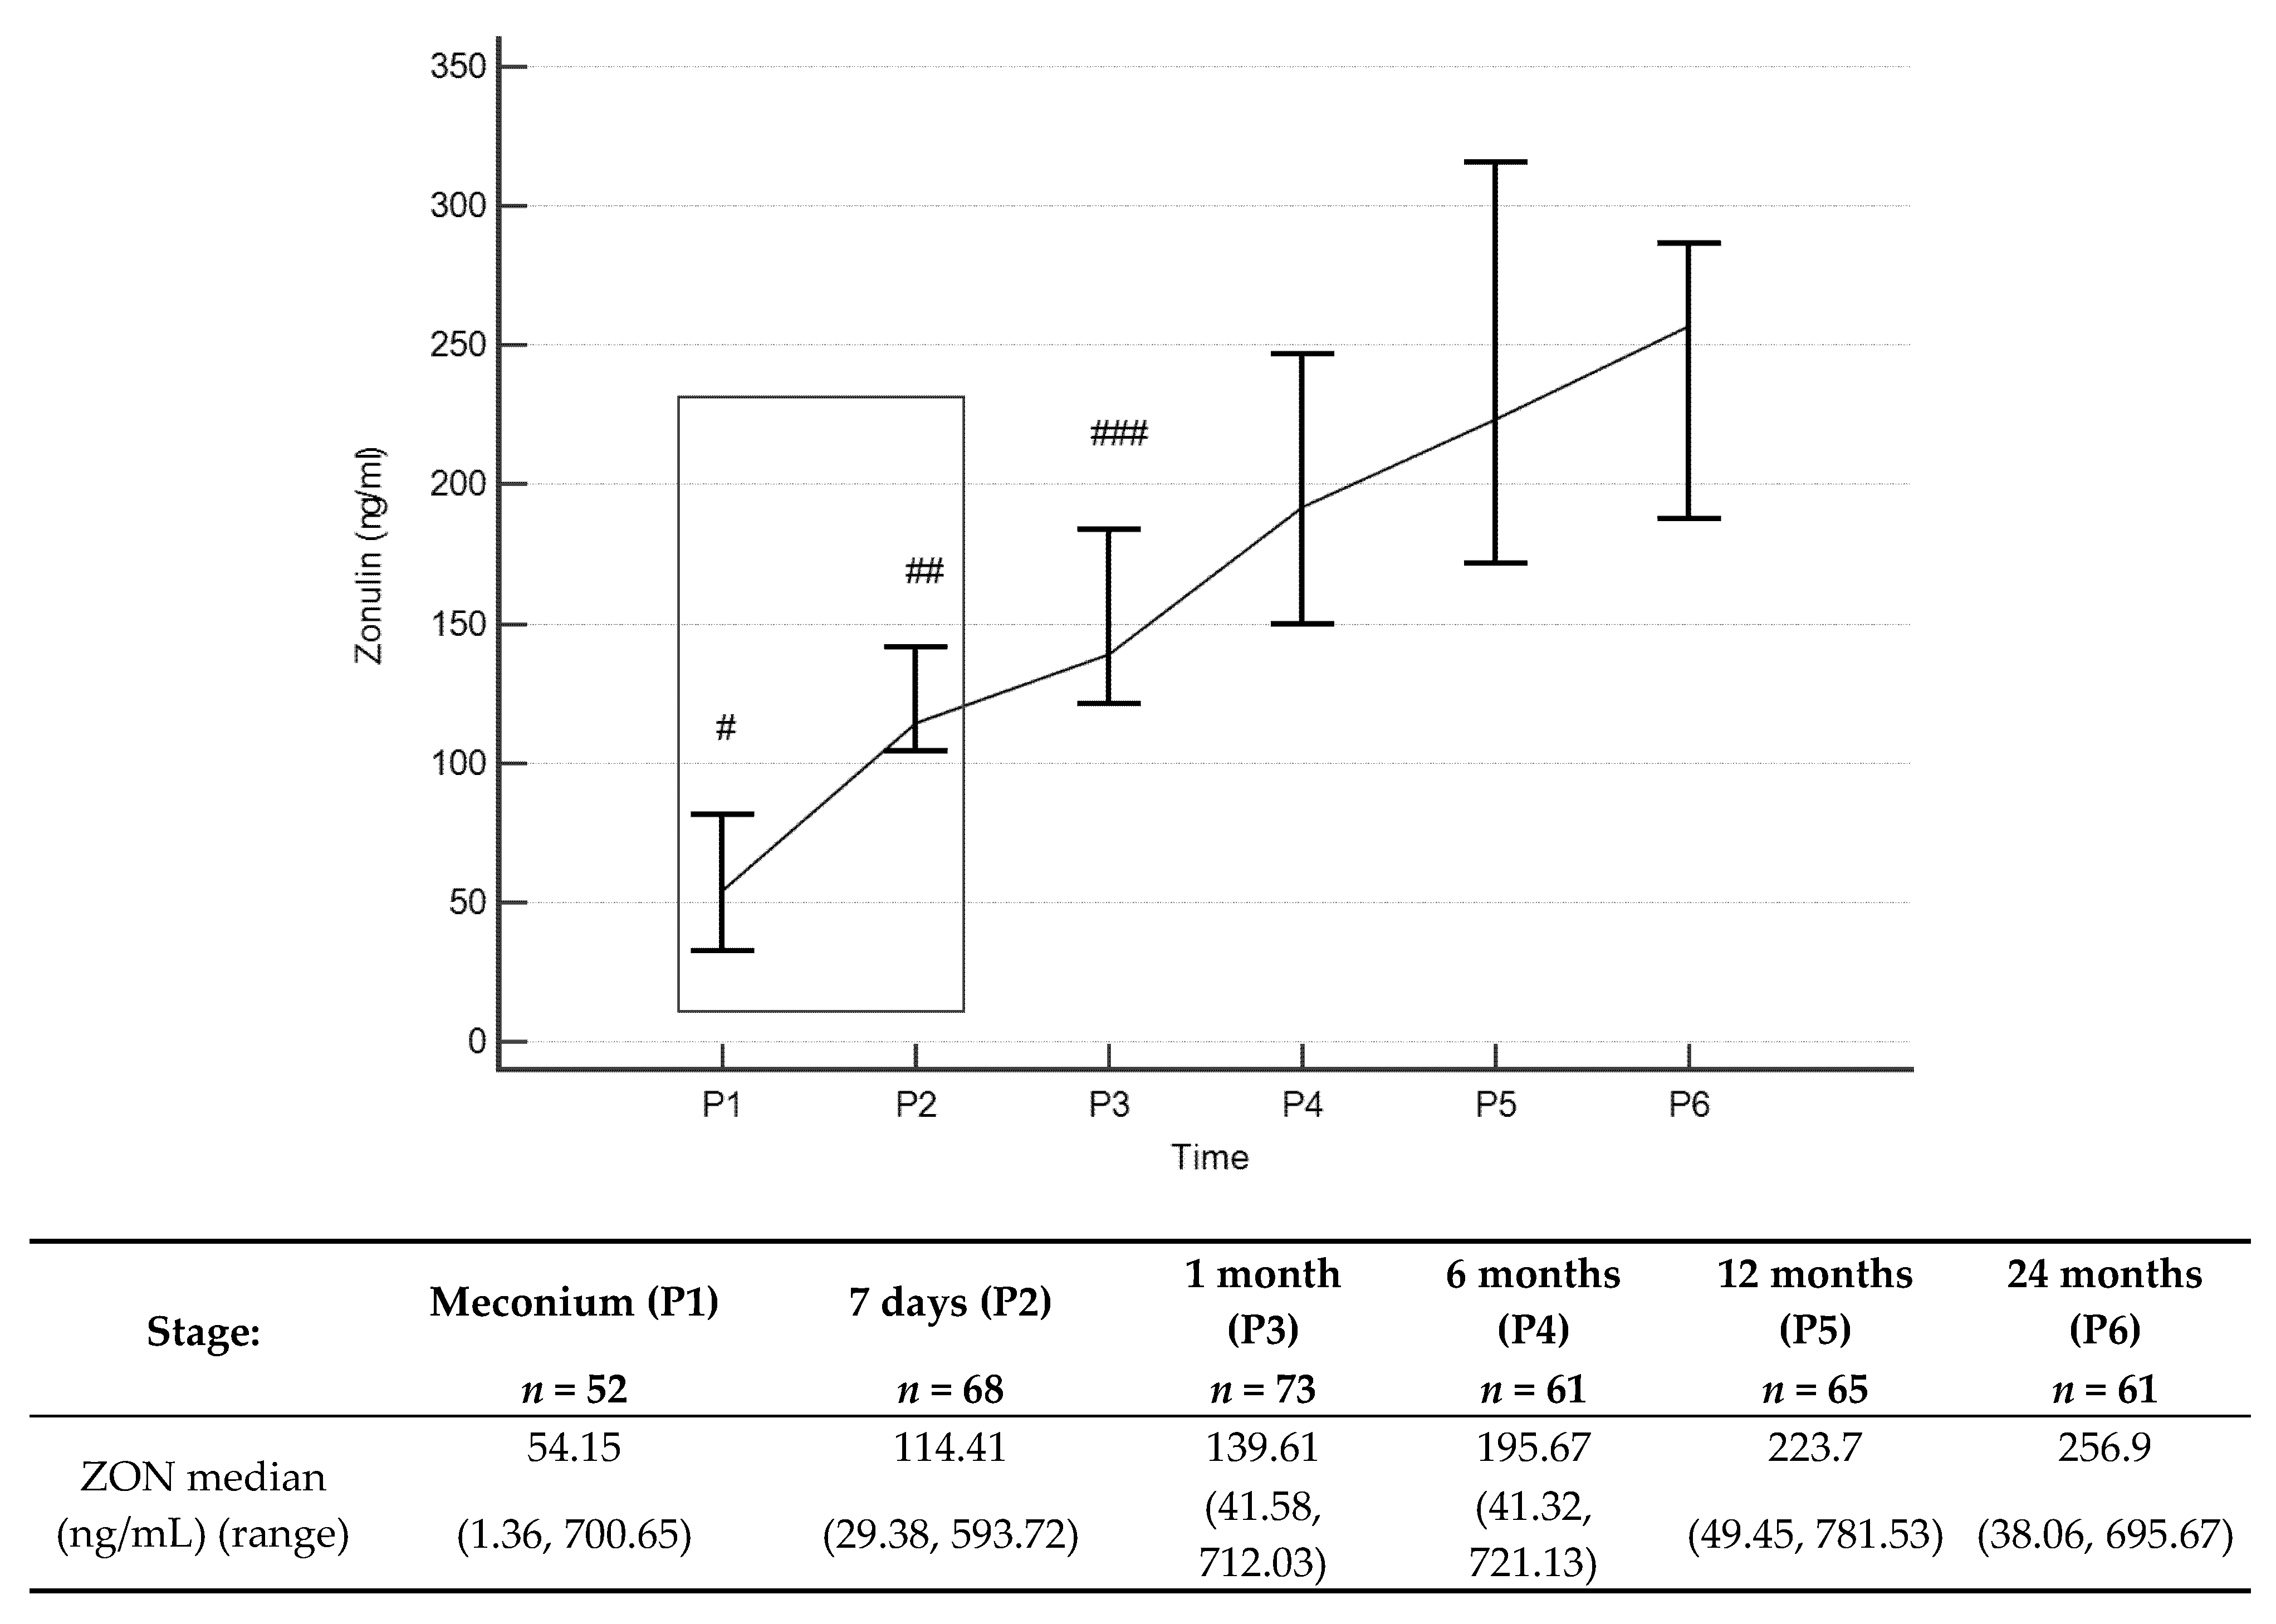
3.2. Zonulin Concentrations
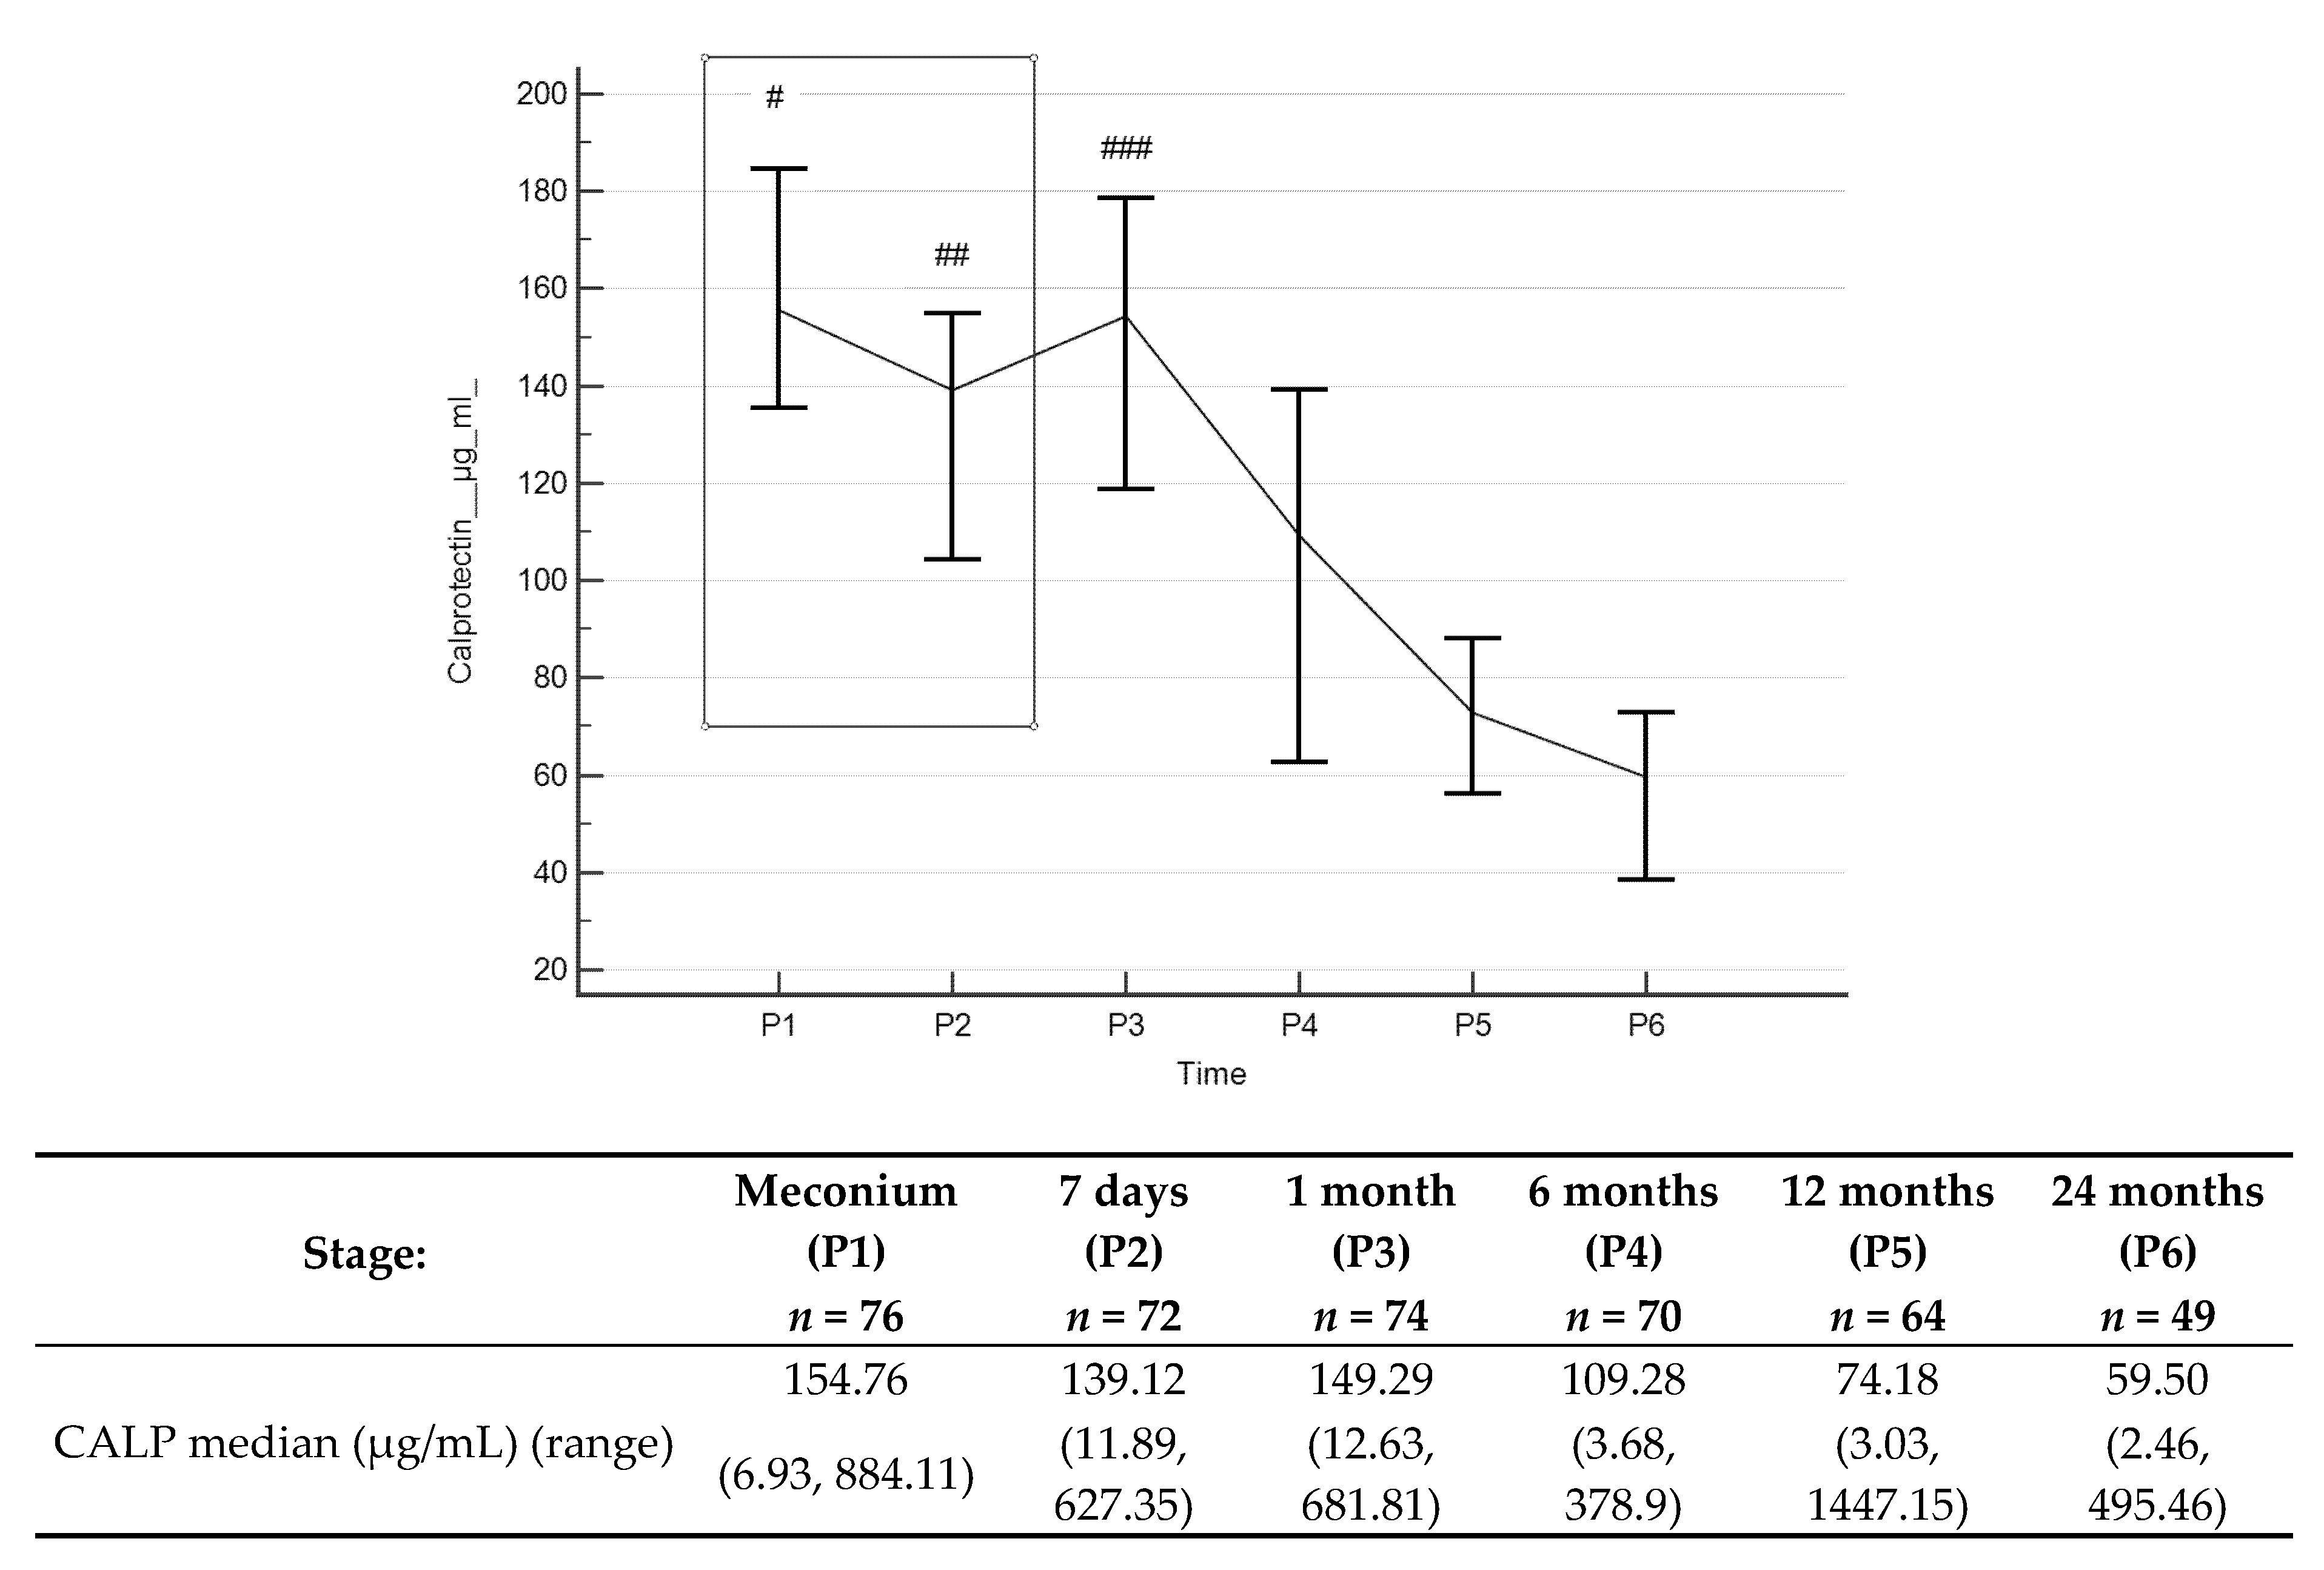
3.3. Calprotectin Concentrations
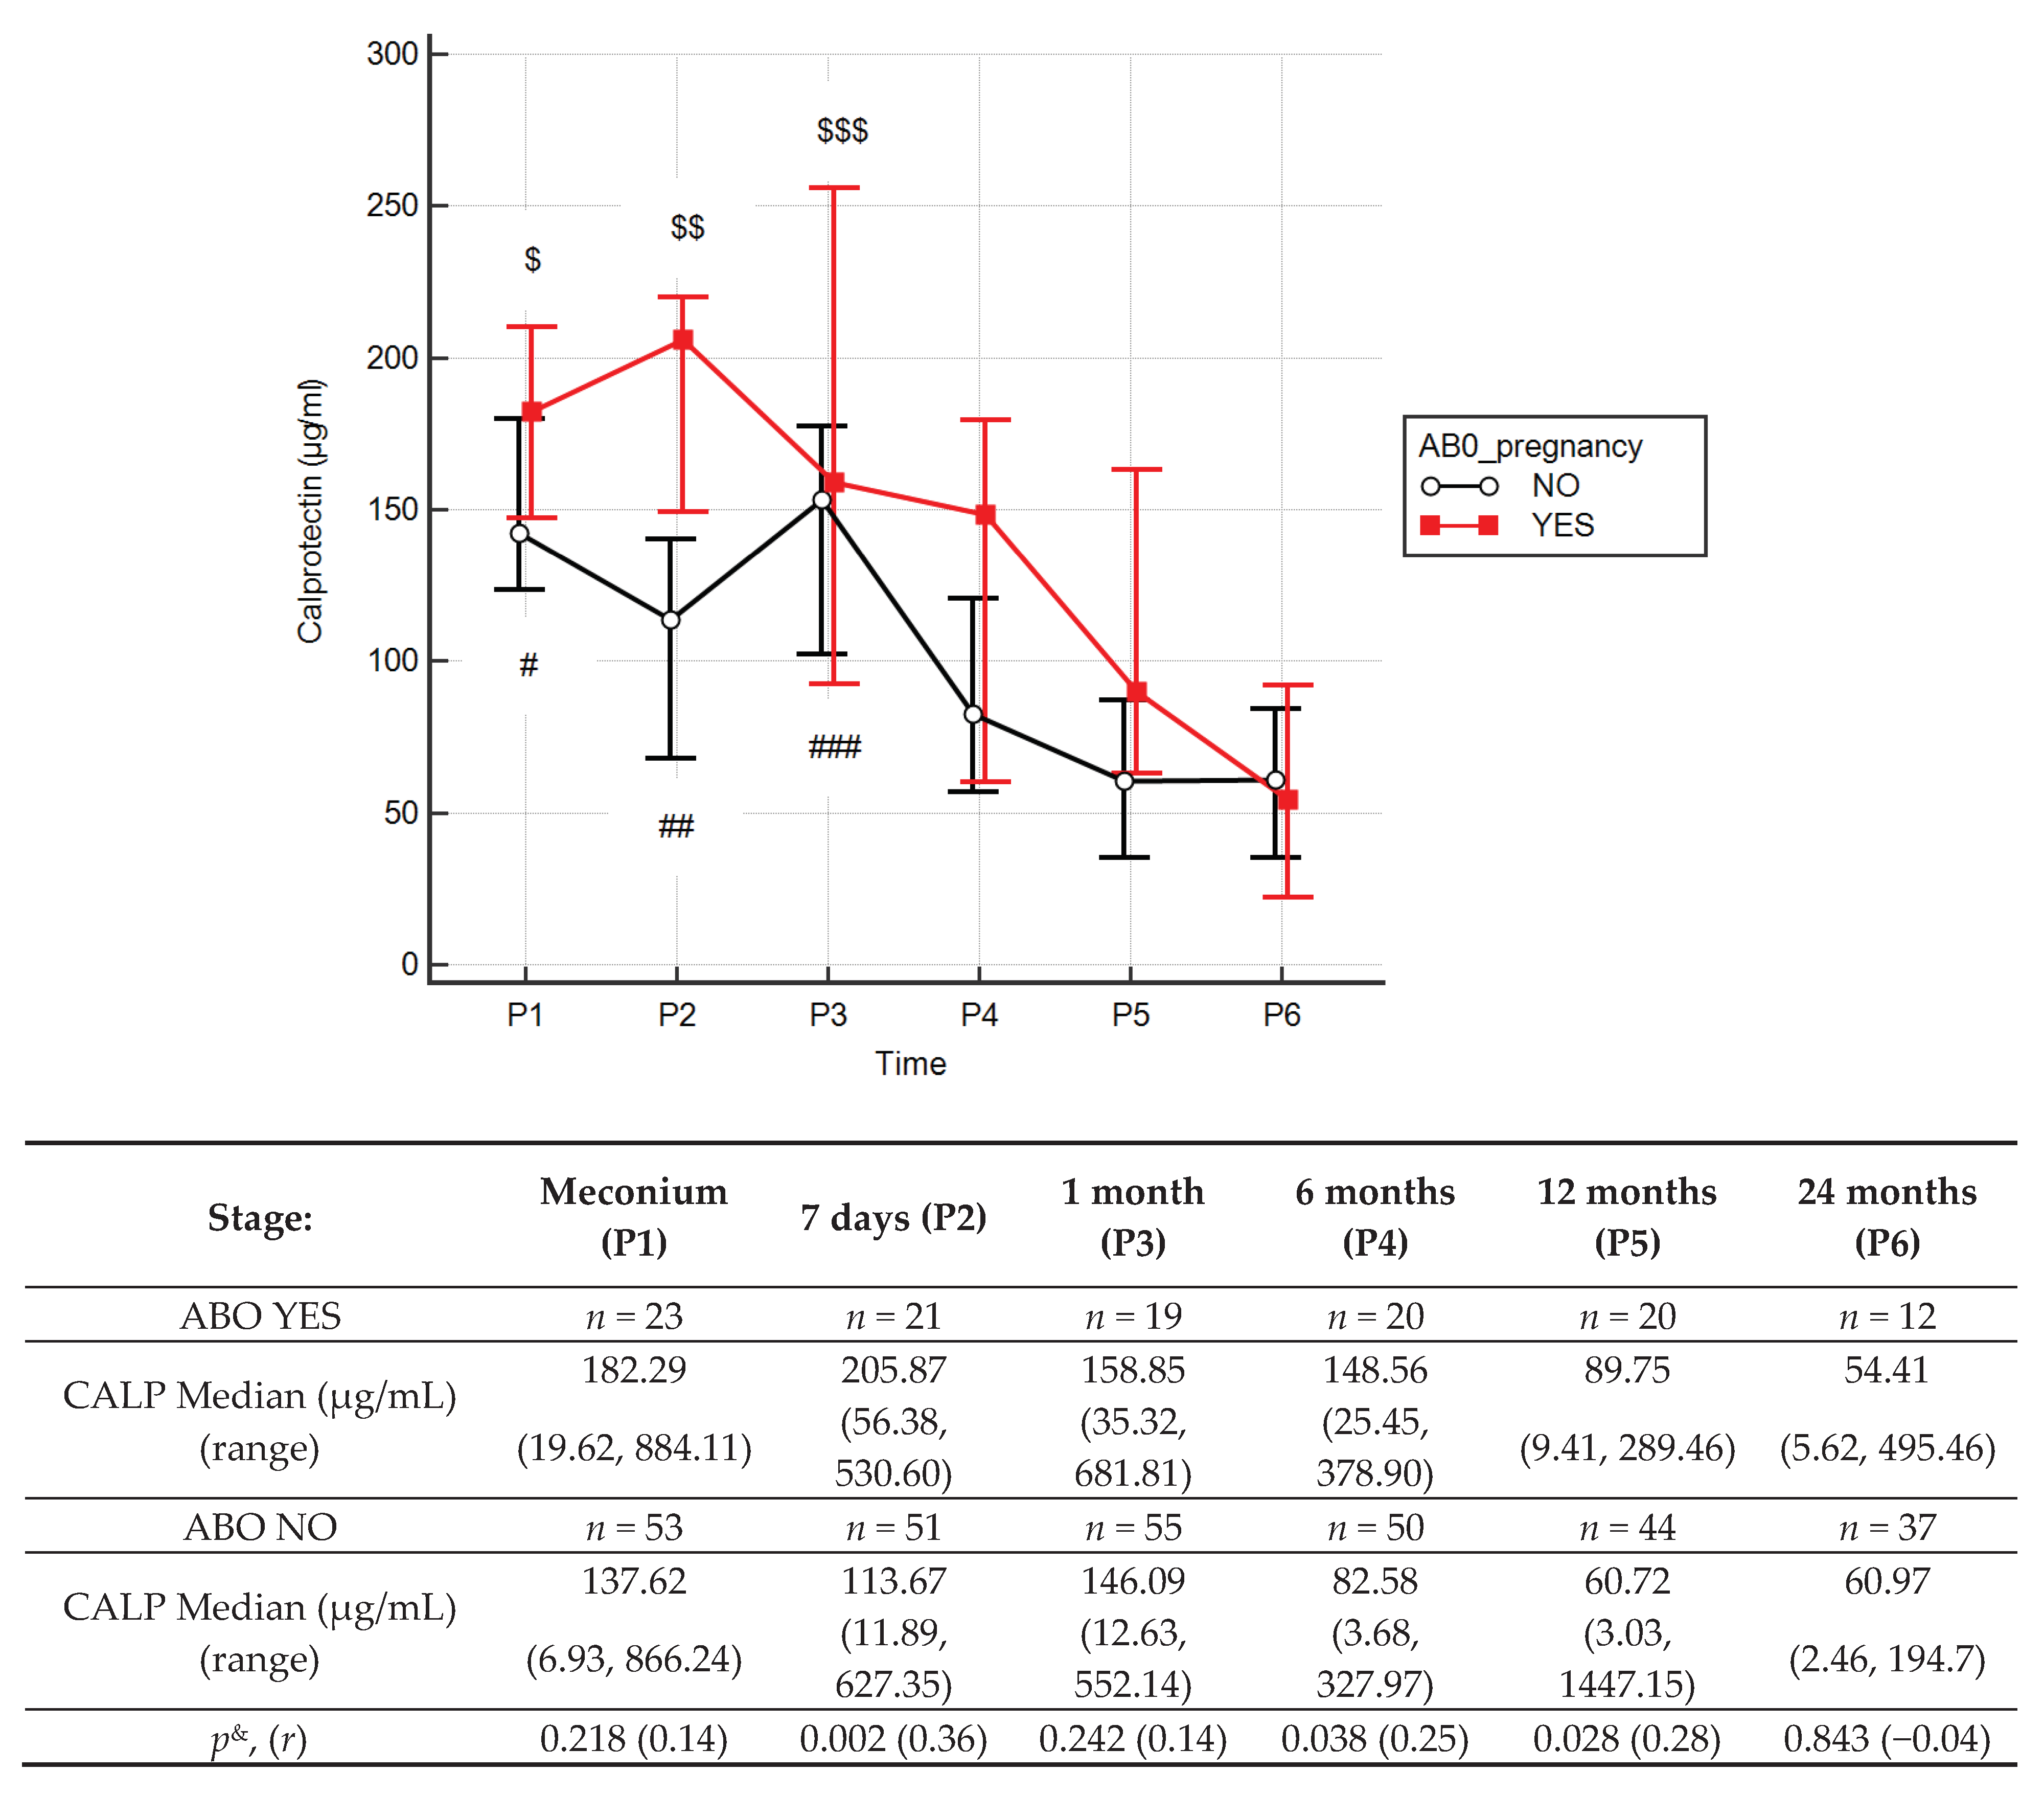
3.4. Effects of Antibiotic Therapy During Pregnancy
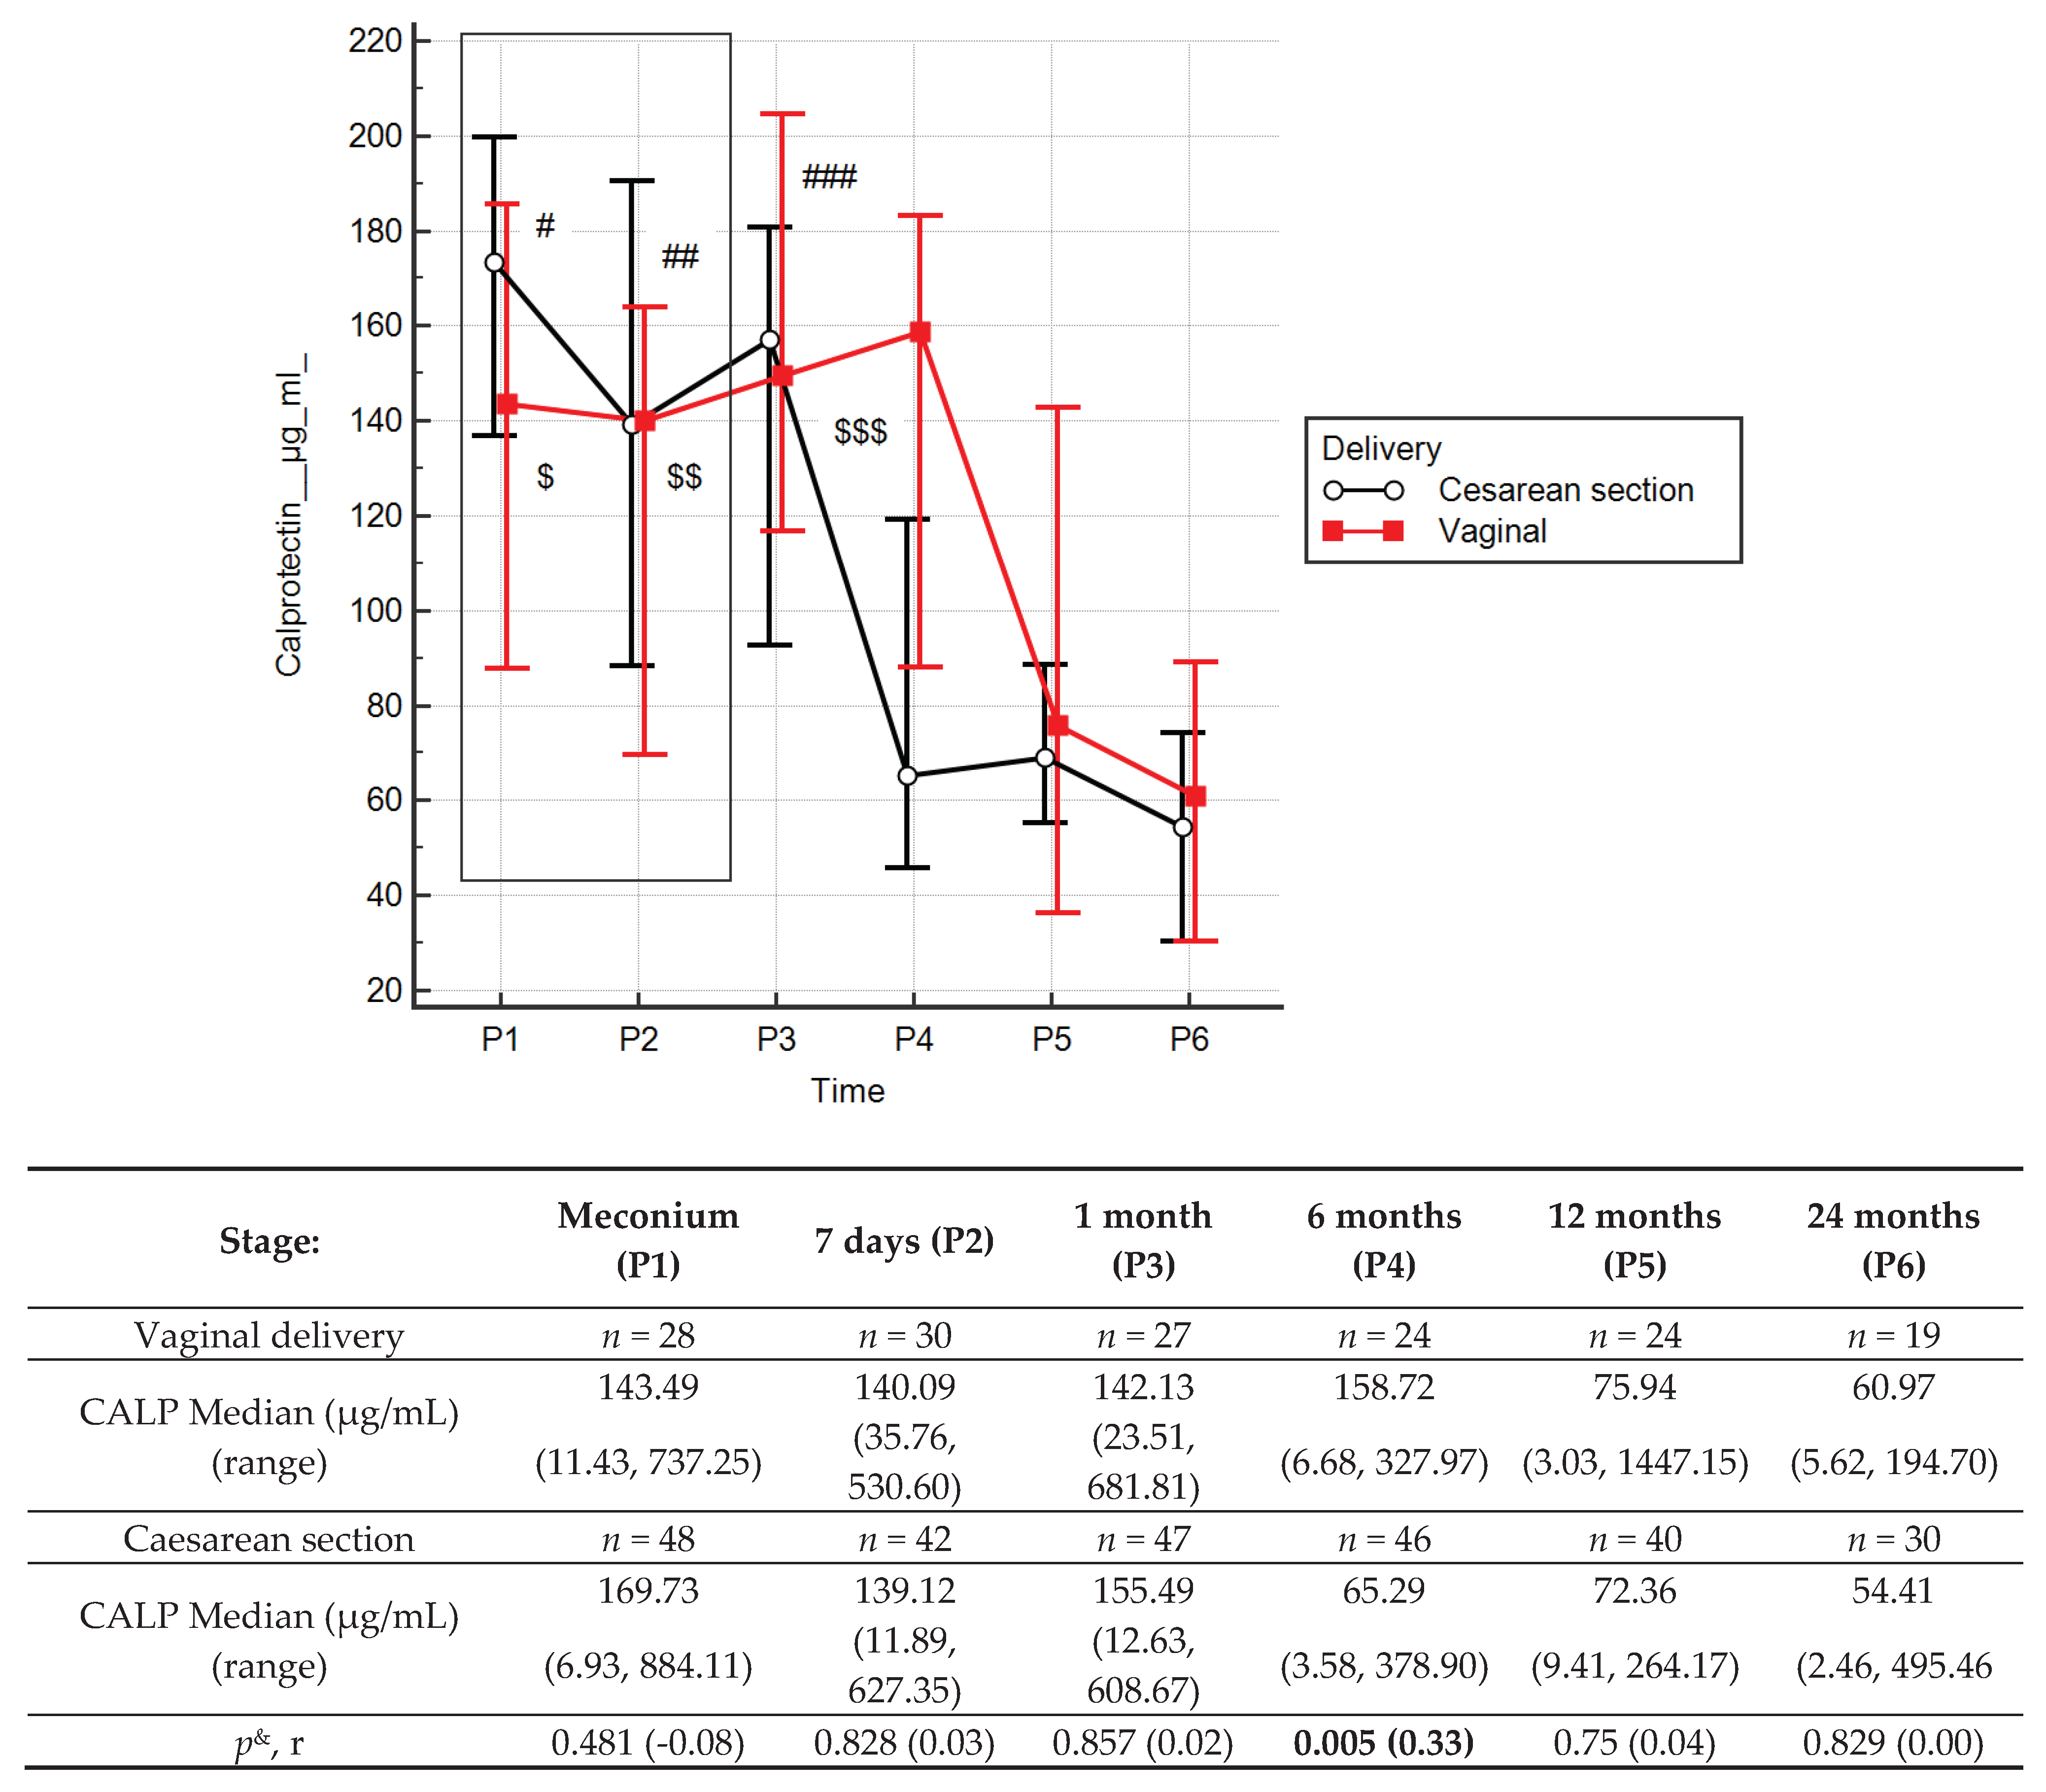
3.5. Effects of Type of Delivery
3.6. Effects of BMI Increase in Pregnant Women and Body Mass Up to Two Years Old
3.7. Effects of Antibiotic Therapy and of Type of Feeding in Children Up to 2 Years Old
4. Discussion
Limitations
5. Conclusions
Supplementary Materials
Author Contributions
Funding
Conflicts of Interest
References
- Kerr, C.A.; Grice, D.M.; Tran, C.D.; Bauer, D.C.; Li, D.; Hendry, P.; Hannan, G.N. Early life events influence whole-of-life metabolic health via gut microflora and gut permeability. Crit. Rev. Microbiol. 2015, 41, 326–340. [Google Scholar] [CrossRef]
- Drozdowski, L.A.; Clandinin, T.; Thomson, A.B. Ontogeny, growth and development of the small intestine: Understanding pediatric gastroenterology. World J. Gastroenterol. 2010, 16, 787–799. [Google Scholar] [PubMed]
- Shulman, R.J.; Schanler, R.J.; Lau, C.; Heitkemper, M.; Ou, C.N.; Smith, E.O. Early Feeding, Antenatal Glucocorticoids, and Human Milk Decrease Intestinal Permeability in Preterm Infants. Pediatr. Res. 1998, 44, 519–523. [Google Scholar] [CrossRef] [PubMed]
- van Elburg, R.M.; Fetter, W.P.F.; Bunkers, C.M.; Heymans, H.S.A. Intestinal permeability in relation to birth weight and gestational and postnatal age. Arch. Dis. Child. Fetal Neonatal Ed. 2003, 88, 52–55. [Google Scholar] [CrossRef] [Green Version]
- Insoft, R.M.; Sanderson, I.R.; Walker, W.A. Development of immune function in the intestine and its role in neonatal diseases. Pediatr. Clin. North Am. 1996, 43, 551–571. [Google Scholar] [CrossRef]
- Teichberg, S.; Isolauri, E.; Wapnir, R.A.; Roberts, B.; Lifshitz, F. Development of the neonatal rat small intestinal barrier to nonspecific macromolecular absorption: Effect of early weaning to artificial diets. Pediatr. Res. 1990, 28, 31–37. [Google Scholar] [CrossRef] [PubMed] [Green Version]
- Veereman-Wauters, G. Neonatal gut development and postnatal adaptation. Eur. J. Pediatr. 1996, 155, 627–632. [Google Scholar] [CrossRef]
- Molès, J.P.; Tuaillon, E.; Kankasa, C.; Bedin, A.S.; Nagot, N.; Marchant, A.; McDermid, J.M.; Van de Perre, P. Breastmilk cell trafficking induces microchimerism-mediated immune system maturation in the infant. Pediatr. Allergy Immunol. Off. Publ. Eur. Soc. Pediatr. Allergy Immunol. 2018, 29, 133–143. [Google Scholar] [CrossRef] [PubMed]
- Fasano, A.; Baudry, B.; Pumplin, D.W.; Wasserman, S.S.; Tall, B.D.; Ketley, J.M.; Kaper, J.B. Vibrio cholerae produces a second enterotoxin, which affects intestinal tight junctions. Proc. Natl. Acad. Sci. USA 1991, 88, 5242–5246. [Google Scholar] [CrossRef] [Green Version]
- Baudry, B.; Fasano, A.; Ketley, J.; Kaper, J.B. Cloning of a gene (zot) encoding a new toxin produced by Vibrio cholerae. Infect. Immun. 1992, 60, 428–434. [Google Scholar] [CrossRef] [Green Version]
- Tsukita, S.; Furuse, M. Identification of two distinct types of four-transmembrane domain proteins, occludin and claudins: Towards new physiology in paracellular pathway. Seikagaku 2000, 72, 155–162. [Google Scholar] [PubMed]
- Fink, M.P. Intestinal epithelial hyperpermeability: Update on the pathogenesis of gut mucosal barrier dysfunction in critical illness. Curr. Opin. Crit. Care 2003, 9, 143–151. [Google Scholar] [CrossRef] [PubMed]
- Sapone, A.; de Magistris, L.; Pietzak, M.; Clemente, M.G.; Tripathi, A.; Cucca, F.; Lampis, R.; Kryszak, D.; Cartenì, M.; Generoso, M.; et al. Zonulin upregulation is associated with increased gut permeability in subjects with type 1 diabetes and their relatives. Diabetes 2006, 55, 1443–1449. [Google Scholar] [CrossRef] [PubMed] [Green Version]
- Vanuytsel, T.; Vermeire, S.; Cleynen, I. The role of Haptoglobin and its related protein, Zonulin, in inflammatory bowel disease. Tissue Barriers 2013, 1, 27321. [Google Scholar] [CrossRef] [PubMed] [Green Version]
- Tripathi, A.; Lammers, K.M.; Goldblum, S.; Shea-Donohue, T.; Netzel-Arnett, S.; Buzza, M.S.; Antalis, T.M.; Vogel, S.N.; Zhao, A.; Yang, S.; et al. Identification of human zonulin, a physiological modulator of tight junctions, as prehaptoglobin-2. Proc. Natl. Acad. Sci. USA 2009, 106, 16799–16804. [Google Scholar] [CrossRef] [PubMed] [Green Version]
- Fasano, A.; Not, T.; Wang, W.; Uzzau, S.; Berti, I.; Tommasini, A.; Goldblum, S.E. Zonulin, a newly discovered modulator of intestinal permeability, and its expression in coeliac disease. Lancet Lond. Engl. 2000, 355, 1518–1519. [Google Scholar] [CrossRef]
- Wang, W.; Uzzau, S.; Goldblum, S.E.; Fasano, A. Human zonulin, a potential modulator of intestinal tight junctions. J. Cell Sci. 2000, 113, 4435–4440. [Google Scholar]
- Rougé, C.; Butel, M.J.; Piloquet, H.; Ferraris, L.; Legrand, A.; Vodovar, M.; Voyer, M.; de la Cochetière, M.F.; Darmaun, D.; Rozé, J.C. Fecal Calprotectin Excretion in Preterm Infants during the Neonatal Period. PLoS ONE 2010, 5, e11083. [Google Scholar] [CrossRef] [Green Version]
- Watts, T.; Berti, I.; Sapone, A.; Gerarduzzi, T.; Not, T.; Zielke, R.; Fasano, A. Role of the intestinal tight junction modulator zonulin in the pathogenesis of type I diabetes in BB diabetic-prone rats. Proc. Natl. Acad. Sci. USA 2005, 102, 2916–2921. [Google Scholar] [CrossRef] [Green Version]
- Drago, S.; El Asmar, R.; Di Pierro, M.; Grazia Clemente, M.; Tripathi, A.; Sapone, A.; Thakar, M.; Iacono, G.; Carroccio, A.; D’Agate, C.; et al. Gliadin, zonulin and gut permeability: Effects on celiac and non-celiac intestinal mucosa and intestinal cell lines. Scand. J. Gastroenterol. 2006, 41, 408–419. [Google Scholar] [CrossRef]
- Moreno-Navarrete, J.M.; Sabater, M.; Ortega, F.; Ricart, W.; Fernández-Real, J.M. Circulating zonulin, a marker of intestinal permeability, is increased in association with obesity-associated insulin resistance. PLoS ONE 2012, 7, 37160. [Google Scholar] [CrossRef] [PubMed] [Green Version]
- Jayashree, B.; Bibin, Y.S.; Prabhu, D.; Shanthirani, C.S.; Gokulakrishnan, K.; Lakshmi, B.S.; Mohan, V.; Balasubramanyam, M. Increased circulatory levels of lipopolysaccharide (LPS) and zonulin signify novel biomarkers of proinflammation in patients with type 2 diabetes. Mol. Cell. Biochem. 2014, 388, 203–210. [Google Scholar] [CrossRef] [PubMed]
- Oord, T.; Hornung, N. Fecal calprotectin in healthy children. Scand. J. Clin. Lab. Investig. 2014, 74, 254–258. [Google Scholar] [CrossRef] [PubMed]
- Beşer, Ö.F.; Sancak, S.; Erkan, T.; Kutlu, T.; Çokuğraş, H.; Çokuğraş, F.Ç. Can Fecal Calprotectin Level Be Used as a Markers of Inflammation in the Diagnosis and Follow-Up of Cow’s Milk Protein Allergy? Allergy Asthma Immunol. Res. 2014, 6, 33–38. [Google Scholar] [CrossRef] [Green Version]
- Orivuori, L.; Mustonen, K.; de Goffau, M.C.; Hakala, S.; Paasela, M.; Roduit, C.; Dalphin, J.C.; Genuneit, J.; Lauener, R.; Riedler, J.; et al. High level of fecal calprotectin at age 2 months as a marker of intestinal inflammation predicts atopic dermatitis and asthma by age 6. Clin. Exp. Allergy J. Br. Soc. Allergy Clin. Immunol. 2015, 45, 928–939. [Google Scholar] [CrossRef]
- Peura, S.; Fall, T.; Almqvist, C.; Andolf, E.; Hedman, A.; Pershagen, G.; Helmersson-Karlqvist, J.; Larsson, A. Normal values for calprotectin in stool samples of infants from the population-based longitudinal born into life study. Scand. J. Clin. Lab. Invest. 2018, 78, 120–124. [Google Scholar] [CrossRef]
- Albanna, E.A.; Ahmed, H.S.; Awad, H.A. Stool calprotectin in necrotizing enterocolitis. J. Clin. Neonatol. 2014, 3, 16. [Google Scholar]
- Labaere, D.; Smismans, A.; Van Olmen, A.; Christiaens, P.; D’Haens, G.; Moons, V.; Cuyle, P.J.; Frans, J.; Bossuyt, P. Comparison of six different calprotectin assays for the assessment of inflammatory bowel disease. United Eur. Gastroenterol. J. 2014, 2, 30–37. [Google Scholar] [CrossRef] [Green Version]
- Łoniewska, B.; Węgrzyn, D.; Adamek, K.; Kaczmarczyk, M.; Skonieczna-Żydecka, K.; Adler, G.; Jankowska, A.; Uzar, I.; Kordek, A.; Celewicz, M.; et al. The Influence of Maternal-Foetal Parameters on Concentrations of Zonulin and Calprotectin in the Blood and Stool of Healthy Newborns during the First Seven Days of Life. An Observational Prospective Cohort Study. J. Clin. Med. 2019, 8, 473. [Google Scholar] [CrossRef] [Green Version]
- Catassi, C.; Bonucci, A.; Coppa, G.V.; Carlucci, A.; Giorgi, P.L. Intestinal permeability changes during the first month: Effect of natural versus artificial feeding. J. Pediatr. Gastroenterol. Nutr. 1995, 21, 383–386. [Google Scholar] [CrossRef]
- Noone, C.; Menzies, I.S.; Banatvala, J.E.; Scopes, J.W. Intestinal permeability and lactose hydrolysis in human rotaviral gastroenteritis assessed simultaneously by non-invasive differential sugar permeation. Eur. J. Clin. Invest. 1986, 16, 217–225. [Google Scholar] [CrossRef] [PubMed]
- Kalach, N.; Rocchiccioli, F.; de Boissieu, D.; Benhamou, P.H.; Dupont, C. Intestinal permeability in children: Variation with age and reliability in the diagnosis of cow’s milk allergy. Acta Paediatr. Oslo Nor. 2001, 90, 499–504. [Google Scholar] [CrossRef]
- Weaver, L.T.; Laker, M.F.; Nelson, R.; Lucas, A. Milk feeding and changes in intestinal permeability and morphology in the newborn. J. Pediatr. Gastroenterol. Nutr. 1987, 6, 351–358. [Google Scholar] [CrossRef] [PubMed]
- Sharma, R.; Young, C.; Neu, J. Molecular modulation of intestinal epithelial barrier: Contribution of microbiota. J. Biomed. Biotechnol. 2010, 2010, 305879. [Google Scholar] [CrossRef] [Green Version]
- Tarko, A.; Suchojad, A.; Michalec, M.; Majcherczyk, M.; Brzozowska, A.; Maruniak-Chudek, I. Zonulin: A Potential Marker of Intestine Injury in Newborns. Dis. Markers 2017, 2017. [Google Scholar] [CrossRef]
- Saleem, B.; Okogbule-Wonodi, A.C.; Fasano, A.; Magder, L.S.; Ravel, J.; Kapoor, S.; Viscardi, R.M. Intestinal Barrier Maturation in Very Low Birthweight Infants: Relationship to Feeding and Antibiotic Exposure. J. Pediatr. 2017, 183, 31–36. [Google Scholar] [CrossRef] [Green Version]
- Scheffler, L.; Crane, A.; Heyne, H.; Tönjes, A.; Schleinitz, D.; Ihling, C.H.; Stumvoll, M.; Kovacs, P.; Heiker, J.T. Widely used commercial ELISA for human Zonulin reacts with Complement C3 rather than preHaptoglobin2. bioRxiv 2017. [Google Scholar] [CrossRef]
- Fasano, A. Regulation of intercellular tight junctions by zonula occludens toxin and its eukaryotic analogue zonulin. Ann. N.Y. Acad. Sci. 2000, 915, 214–222. [Google Scholar] [CrossRef]
- Malíčková, K.; Francová, I.; Lukáš, M.; Kolář, M.; Králíková, E.; Bortlík, M.; Ďuricová, D.; Štěpánková, L.; Zvolská, K.; Pánková, A.; et al. Fecal zonulin is elevated in Crohn’s disease and in cigarette smokers. Pract. Lab. Med. 2017, 9, 39–44. [Google Scholar] [CrossRef]
- Lamprecht, M.; Bogner, S.; Schippinger, G.; Steinbauer, K.; Fankhauser, F.; Hallstroem, S.; Schuetz, B.; Greilberger, J.F. Probiotic supplementation affects markers of intestinal barrier, oxidation, and inflammation in trained men; a randomized, double-blinded, placebo-controlled trial. J. Int. Soc. Sports Nutr. 2012, 9, 45. [Google Scholar] [CrossRef] [Green Version]
- Nissen, A.C.; van Gils, C.E.; Menheere, P.P.; Van den Neucker, A.M.; van der Hoeven, M.A.; Forget, P.P. Fecal calprotectin in healthy term and preterm infants. J. Pediatr. Gastroenterol. Nutr. 2004, 38, 107–108. [Google Scholar] [CrossRef] [PubMed]
- Kapel, N.; Campeotto, F.; Kalach, N.; Baldassare, M.; Butel, M.J.; Dupont, C. Faecal calprotectin in term and preterm neonates. J. Pediatr. Gastroenterol. Nutr. 2010, 51, 542–547. [Google Scholar] [CrossRef] [PubMed]
- Baldassarre, M.E.; Altomare, M.A.; Fanelli, M.; Carbone, D.; Di Bitonto, G.; Mautone, A.; Laforgia, N. Does calprotectin represent a regulatory factor in host defense or a drug target in inflammatory disease? Endocr. Metab. Immune Disord. Drug Targets 2007, 7, 1–5. [Google Scholar] [CrossRef] [PubMed]
- Lee, Y.M.; Min, C.Y.; Choi, Y.J.; Jeong, S.J. Delivery and feeding mode affects fecal calprotectin levels in infants <7months old. Early Hum. Dev. 2017, 108, 45–48. [Google Scholar] [PubMed]
- Li, F.; Ma, J.; Geng, S.; Wang, J.; Liu, J.; Zhang, J.; Sheng, X. Fecal Calprotectin Concentrations in Healthy Children Aged 1–18 Months. PLoS ONE 2015, 10, e0119574. [Google Scholar] [CrossRef] [PubMed] [Green Version]
- Rugtveit, J.; Fagerhol, M.K. Age-dependent variations in fecal calprotectin concentrations in children. J. Pediatr. Gastroenterol. Nutr. 2002, 34, 323–324. [Google Scholar] [CrossRef] [PubMed]
- Fagerberg, U.L.; Lööf, L.; Merzoug, R.D.; Hansson, L.O.; Finkel, Y. Fecal calprotectin levels in healthy children studied with an improved assay. J. Pediatr. Gastroenterol. Nutr. 2003, 37, 468–472. [Google Scholar] [CrossRef]
- Olafsdottir, E.; Aksnes, L.; Fluge, G.; Berstad, A. Faecal calprotectin levels in infants with infantile colic, healthy infants, children with inflammatory bowel disease, children with recurrent abdominal pain and healthy children. Acta Paediatr. Oslo Nor. 2002, 91, 45–50. [Google Scholar] [CrossRef]
- Sýkora, J.; Siala, K.; Huml, M.; Varvařovská, J.; Schwarz, J.; Pomahačová, R. Evaluation of faecal calprotectin as a valuable non-invasive marker in distinguishing gut pathogens in young children with acute gastroenteritis. Acta Paediatr. Oslo Nor. 2010, 99, 1389–1395. [Google Scholar] [CrossRef]
- Campeotto, F.; Butel, M.; Kalach, N.; Derrieux, S.; Aubert-Jacquin, C.; Barbot, L.; Francoual, C.; Dupont, C.; Kapel, N. High faecal calprotectin concentrations in newborn infants. Arch. Dis. Child. Fetal Neonatal Ed. 2004, 89, 353–355. [Google Scholar] [CrossRef] [Green Version]
- Savino, F.; Castagno, E.; Calabrese, R.; Viola, S.; Oggero, R.; Miniero, R. High faecal calprotectin levels in healthy, exclusively breast-fed infants. Neonatology 2010, 97, 299–304. [Google Scholar] [CrossRef] [PubMed]
- Weaver, L.T.; Laker, M.F.; Nelson, R. Intestinal permeability in the newborn. Arch. Dis. Child. 1984, 59, 236–241. [Google Scholar] [CrossRef] [PubMed]
- Splíchal, I.; Fagerhol, M.K.; Trebichavský, I.; Splíchalová, A.; Schulze, J. The effect of intestinal colonization of germ-free pigs with Escherichia coli on calprotectin levels in plasma, intestinal and bronchoalveolar lavages. Immunobiology 2005, 209, 681–687. [Google Scholar] [CrossRef] [PubMed]
- Nash, S.; Stafford, J.; Madara, J.L. Effects of polymorphonuclear leukocyte transmigration on the barrier function of cultured intestinal epithelial monolayers. J. Clin. Investig. 1987, 80, 1104–1113. [Google Scholar] [CrossRef] [PubMed] [Green Version]
- Røseth, A.G.; Fagerhol, M.K.; Aadland, E.; Schjønsby, H. Assessment of the neutrophil dominating protein calprotectin in feces. A methodologic study. Scand. J. Gastroenterol. 1992, 27, 793–798. [Google Scholar] [CrossRef]
- Dorosko, S.M.; MacKenzie, T.; Connor, R.I. Fecal Calprotectin Concentrations are Higher in Exclusively Breastfed Infants Compared to those who are Mixed-Fed. Available online: https://0-link-galegroup-com.brum.beds.ac.uk/apps/doc/A182815553/AONE?sid=lms (accessed on 30 January 2020).
- Hestvik, E.; Tumwine, J.K.; Tylleskar, T.; Grahnquist, L.; Ndeezi, G.; Kaddu-Mulindwa, D.H.; Aksnes, L.; Olafsdottir, E. Faecal calprotectin concentrations in apparently healthy children aged 0–12 years in urban Kampala, Uganda: A community-based survey. BMC Pediatr. 2011, 11, 9. [Google Scholar] [CrossRef] [Green Version]
- Berni Canani, R.; Rapacciuolo, L.; Romano, M.T.; Tanturri de Horatio, L.; Terrin, G.; Manguso, F.; Cirillo, P.; Paparo, F.; Troncone, R. Diagnostic value of faecal calprotectin in paediatric gastroenterology clinical practice. Dig. Liver Dis. 2004, 36, 467–470. [Google Scholar] [CrossRef]
- Ezri, J.; Nydegger, A. Pediatrics. Fecal calprotectin in children: Use and interpretation. Rev. Med. Suisse 2011, 7, 69–70. [Google Scholar]
- Davidson, F.; Lock, R.J. Paediatric reference ranges for faecal calprotectin: A UK study. Ann. Clin. Biochem. 2017, 54, 214–218. [Google Scholar] [CrossRef]
- Campeotto, F.; Baldassarre, M.; Butel, M.J.; Viallon, V.; Nganzali, F.; Soulaines, P.; Kalach, N.; Lapillonne, A.; Laforgia, N.; Moriette, G.; et al. Fecal calprotectin: Cutoff values for identifying intestinal distress in preterm infants. J. Pediatr. Gastroenterol. Nutr. 2009, 48, 507–510. [Google Scholar]
- von Roon, A.C.; Karamountzos, L.; Purkayastha, S.; Reese, G.E.; Darzi, A.W.; Teare, J.P.; Paraskeva, P.; Tekkis, P.P. Diagnostic precision of fecal calprotectin for inflammatory bowel disease and colorectal malignancy. Am. J. Gastroenterol. 2007, 102, 803–813. [Google Scholar] [CrossRef] [PubMed]
- Zhu, Q.; Li, F.; Wang, J.; Shen, L.; Sheng, X. Fecal Calprotectin in Healthy Children Aged 1–4 Years. PLoS ONE 2016, 11, e0150725. [Google Scholar] [CrossRef] [PubMed] [Green Version]
- Tamboli, C.P.; Richard, F.; Colombel, J.F. Fecal calprotectin in Crohn’s disease: New family ties. Gastroenterology 2003, 124, 1972–1974. [Google Scholar] [CrossRef]
- Chen, C.C.; Huang, J.L.; Chang, C.J.; Kong, M.S. Fecal calprotectin as a correlative marker in clinical severity of infectious diarrhea and usefulness in evaluating bacterial or viral pathogens in children. J. Pediatr. Gastroenterol. Nutr. 2012, 55, 541–547. [Google Scholar] [CrossRef]
- Vaos, G.; Kostakis, I.D.; Zavras, N.; Chatzemichael, A. The role of calprotectin in pediatric disease. BioMed Res. Int. 2013, 2013, 542363. [Google Scholar] [CrossRef] [Green Version]
- Turner, J.R. Intestinal mucosal barrier function in health and disease. Nat. Rev. Immunol. 2009, 9, 799–809. [Google Scholar] [CrossRef]
- Shen, L.; Weber, C.R.; Raleigh, D.R.; Yu, D.; Turner, J.R. Tight junction pore and leak pathways: A dynamic duo. Annu. Rev. Physiol. 2011, 73, 283–309. [Google Scholar] [CrossRef] [Green Version]
- Weber, C.R.; Raleigh, D.R.; Su, L.; Shen, L.; Sullivan, E.A.; Wang, Y.; Turner, J.R. Epithelial myosin light chain kinase activation induces mucosal interleukin-13 expression to alter tight junction ion selectivity. J. Biol. Chem. 2010, 285, 12037–12046. [Google Scholar] [CrossRef] [Green Version]
- Su, L.; Nalle, S.C.; Shen, L.; Turner, E.S.; Singh, G.; Breskin, L.A.; Khramtsova, E.A.; Khramtsova, G.; Tsai, P.Y.; Fu, Y.X.; et al. TNFR2 activates MLCK-dependent tight junction dysregulation to cause apoptosis-mediated barrier loss and experimental colitis. Gastroenterology 2013, 145, 407–415. [Google Scholar] [CrossRef] [Green Version]
- Gitter, A.H.; Wullstein, F.; Fromm, M.; Schulzke, J.D. Epithelial barrier defects in ulcerative colitis: Characterization and quantification by electrophysiological imaging. Gastroenterology 2001, 121, 1320–1328. [Google Scholar] [CrossRef]
- Fasano, A. All disease begins in the (leaky) gut: Role of zonulin-mediated gut permeability in the pathogenesis of some chronic inflammatory diseases. F1000 Res. 2020, 9. [Google Scholar] [CrossRef] [PubMed]
- Żak-Gołąb, A.; Kocełak, P.; Aptekorz, M.; Zientara, M.; Juszczyk, Ł.; Martirosian, G.; Chudek, J.; Olszanecka-Glinianowicz, M. Gut Microbiota, Microinflammation, Metabolic Profile, and Zonulin Concentration in Obese and Normal Weight Subjects. Available online: https://www.hindawi.com/journals/ije/2013/674106/ (accessed on 30 January 2020).
- Mokkala, K.; Tertti, K.; Rönnemaa, T.; Vahlberg, T.; Laitinen, K. Evaluation of serum zonulin for use as an early predictor for gestational diabetes. Nutr. Diabetes 2017, 7, 253. [Google Scholar] [CrossRef] [PubMed] [Green Version]
- Pedersen, L.; Nybo, M.; Poulsen, M.K.; Henriksen, J.E.; Dahl, J.; Rasmussen, L.M. Plasma calprotectin and its association with cardiovascular disease manifestations, obesity and the metabolic syndrome in type 2 diabetes mellitus patients. BMC Cardiovasc. Disord. 2014, 14, 196. [Google Scholar] [CrossRef] [PubMed] [Green Version]
- Calcaterra, V.; De Amici, M.; Leonard, M.M.; De Silvestri, A.; Pelizzo, G.; Buttari, N.; Michev, A.; Leggio, M.; Larizza, D.; Cena, H. Serum Calprotectin Level in Children: Marker of Obesity and its Metabolic Complications. Ann. Nutr. Metab. 2018, 73, 177–183. [Google Scholar] [CrossRef]
- Josefsson, S.; Bunn, S.K.; Domellöf, M. Fecal calprotectin in very low birth weight infants. J. Pediatr. Gastroenterol. Nutr. 2007, 44, 407–413. [Google Scholar] [CrossRef]
- Rutayisire, E.; Huang, K.; Liu, Y.; Tao, F. The mode of delivery affects the diversity and colonization pattern of the gut microbiota during the first year of infants’ life: A systematic review. BMC Gastroenterol. 2016, 16, 86. [Google Scholar] [CrossRef] [Green Version]
- Stokholm, J.; Thorsen, J.; Chawes, B.L.; Schjørring, S.; Krogfelt, K.A.; Bønnelykke, K.; Bisgaard, H. Cesarean section changes neonatal gut colonization. J. Allergy Clin. Immunol. 2016, 138, 881–889. [Google Scholar] [CrossRef]
- Sandall, J.; Tribe, R.M.; Avery, L.; Mola, G.; Visser, G.H.; Homer, C.S.; Gibbons, D.; Kelly, N.M.; Kennedy, H.P.; Kidanto, H.; et al. Short-term and long-term effects of caesarean section on the health of women and children. Lancet Lond. Engl. 2018, 392, 1349–1357. [Google Scholar] [CrossRef]
- Fairlie, T.; Zell, E.R.; Schrag, S. Effectiveness of intrapartum antibiotic prophylaxis for prevention of early-onset group B streptococcal disease. Obstet. Gynecol. 2013, 121, 570–577. [Google Scholar] [CrossRef] [Green Version]
- Didier, C.; Streicher, M.P.; Chognot, D.; Campagni, R.; Schnebelen, A.; Messer, J.; Donato, L.; Langer, B.; Meyer, N.; Astruc, D.; et al. Late-onset neonatal infections: Incidences and pathogens in the era of antenatal antibiotics. Eur. J. Pediatr. 2012, 171, 681–687. [Google Scholar] [CrossRef]
- Azad, M.B.; Bridgman, S.L.; Becker, A.B.; Kozyrskyj, A.L. Infant antibiotic exposure and the development of childhood overweight and central adiposity. Int. J. Obes. 2014, 38, 1290–1298. [Google Scholar] [CrossRef] [PubMed]
- Vael, C.; Verhulst, S.L.; Nelen, V.; Goossens, H.; Desager, K.N. Intestinal microflora and body mass index during the first three years of life: An observational study. Gut Pathog. 2011, 3, 8. [Google Scholar] [CrossRef] [PubMed] [Green Version]
- Salvatore, S.; Baldassarre, M.E.; Di Mauro, A.; Laforgia, N.; Tafuri, S.; Bianchi, F.P.; Dattoli, E.; Morando, L.; Pensabene, L.; Meneghin, F.; et al. Neonatal Antibiotics and Prematurity are Associated with an Increased Risk of Functional Gastrointestinal Disorders in the First Year of Life. J. Pediatr. 2019, 212, 44–51. [Google Scholar] [CrossRef] [PubMed] [Green Version]
- Gomez de Agüero, M.; Ganal-Vonarburg, S.C.; Fuhrer, T.; Rupp, S.; Uchimura, Y.; Li, H.; Steinert, A.; Heikenwalder, M.; Hapfelmeier, S.; Sauer, U.; et al. The maternal microbiota drives early postnatal innate immune development. Science 2016, 351, 1296–1302. [Google Scholar] [CrossRef]
- de Freitas, M.B.; Moreira, E.A.M.; Tomio, C.; Moreno, Y.M.F.; Daltoe, F.P.; Barbosa, E.; Neto, N.L.; Buccigrossi, V.; Guarino, A. Altered intestinal microbiota composition, antibiotic therapy and intestinal inflammation in children and adolescents with cystic fibrosis. PLoS ONE 2018, 13, e0198457. [Google Scholar] [CrossRef]
- Palleja, A.; Mikkelsen, K.H.; Forslund, S.K.; Kashani, A.; Allin, K.H.; Nielsen, T.; Hansen, T.H.; Liang, S.; Feng, Q.; Zhang, C.; et al. Recovery of gut microbiota of healthy adults following antibiotic exposure. Nat. Microbiol. 2018, 3, 1255–1265. [Google Scholar] [CrossRef] [PubMed]
- Oswari, H.; Prayitno, L.; Dwipoerwantoro, P.G.; Firmansyah, A.; Makrides, M.; Lawley, B.; Kuhn-Sherlock, B.; Cleghorn, G.; Tannock, G.W. Comparison of stool microbiota compositions, stool alpha1-antitrypsin and calprotectin concentrations, and diarrhoeal morbidity of Indonesian infants fed breast milk or probiotic/prebiotic-supplemented formula. J. Paediatr. Child Health 2013, 49, 1032–1039. [Google Scholar] [CrossRef]
- Rosti, L.; Braga, M.; Fulcieri, C.; Sammarco, G.; Manenti, B.; Costa, E. Formula milk feeding does not increase the release of the inflammatory marker calprotectin, compared to human milk. Pediatr. Medica Chir. Med. Surg. Pediatr. 2011, 33, 178–181. [Google Scholar]
- Li, F.; Ma, J.; Geng, S.; Wang, J.; Ren, F.; Sheng, X. Comparison of the different kinds of feeding on the level of fecal calprotectin. Early Hum. Dev. 2014, 90, 471–475. [Google Scholar] [CrossRef]
- Asgarshirazi, M.; Shariat, M.; Nayeri, F.; Dalili, H.; Abdollahi, A. Comparison of Fecal Calprotectin in Exclusively Breastfed and Formula or Mixed Fed Infants in the First Six Months of Life. Acta Med. Iran. 2017, 55, 53–58. [Google Scholar]
- Taylor, S.N.; Basile, L.A.; Ebeling, M.; Wagner, C.L. Intestinal Permeability in Preterm Infants by Feeding Type: Mother’s Milk Versus Formula. Breastfeed. Med. 2009, 4, 11–15. [Google Scholar] [CrossRef] [PubMed] [Green Version]


| Characteristic | Newborns (N = 100) | |||
|---|---|---|---|---|
| Gender: (% male) | 54.0 | |||
| Birth weight (g) | ||||
| (mean ± SD) | 3427 ± 455 | |||
| (range) | (2140, 4960) | |||
| ≤ 15th percentile | 15% | |||
| ≥ 85th percentile | 12% | |||
| Characteristic | Mothers (N = 100) | |||
| Vaginal childbirth | 39% (n = 39) | |||
| Antibiotic therapy during pregnancy | 30% (n = 30) | |||
| Antibiotic therapy at delivery | 81% (n = 81) | |||
| Body ass index (BMI) (kg/m2) increase during pregnancy (mean, range) | 5.7 (−1.12, 11.2) | |||
| BMI before pregnancy (%) | < 18.5 | ≥ 25 < 30 | ≤ 18.5 < 25 | ≥ 30 |
| 12% | 20% | 56% | 12% | |
| BMI before delivery (%) | < 18.5 | ≥ 25 < 30 | ≤ 18.5 < 25 | ≥ 30 |
| 0% | 36% | 16% | 48% | |
| Mass gain (kg) during pregnancy | < 12 | 12–18 | >18 36% | |
| 25% | 39% | |||
| Characteristic | Age of Children (months) | |||
|---|---|---|---|---|
| 1 | 6 | 12 | 24 | |
| N = 81 | N = 82 | N = 78 | N = 73 | |
| Gender (% male) | 53.0 % (n = 43) | 52.4% (n = 43) | 51.3 % (n = 40) | 47.9 % (n = 35) |
| Method of delivery (% vaginal) | 35.0 % (n = 29) | 35.4% (n = 30) | 37.2 % (n = 29) | 35.6 % (n = 26) |
| Antibiotics (%) | 3.7 % (n = 3) | 21.9% (n = 18) | 41.0 % (n = 32) | 74.0 % (n = 54) |
| Birth weight: | ||||
| ≤ 15th percentile | 14.8% (n = 12) | 12.2% (n = 10) | 12.8% (n = 10) | 12.3% (n = 9) |
| ≥ 85th percentile | 13.6% (n = 11) | 13.4% (n = 11) | 12.8% (n = 10) | 12.3% (n = 9) |
| Mass (kg) at each age: | ||||
| (mean + SD) | 4.537 ± 0.611 | 7.953 ± 1.095 | 10.131 ± 1.129 | 12.91 ± 1.642 |
| (range) | (2.780, 5.970) | (6, 10) | (7.89, 13) | (10, 17) |
| ≤ 15th percentile | 12.3% (n = 10) | 20.7 % (n = 17) | 1.3 % (n = 1) | 2.7 % (n = 2) |
| 15–85th percentile | 64.2 % (n = 52) | 54.9 % (n = 45) | 64.1 % (n = 50) | 61.6 % (n = 45) |
| ≥ 85th percentile | 24.7 % (n = 20) | 24.4 % (n = 20) | 34.6 % (n = 27) | 35.6 % (n = 26) |
| Feeding method (% artificial) | 18.5 % (n = 15) | 48.8 % (n = 40) | 83.3 % (n = 65) | 95.9 % (n = 70) |
© 2020 by the authors. Licensee MDPI, Basel, Switzerland. This article is an open access article distributed under the terms and conditions of the Creative Commons Attribution (CC BY) license (http://creativecommons.org/licenses/by/4.0/).
Share and Cite
Łoniewska, B.; Adamek, K.; Węgrzyn, D.; Kaczmarczyk, M.; Skonieczna-Żydecka, K.; Clark, J.; Adler, G.; Tousty, J.; Uzar, I.; Tousty, P.; et al. Analysis of Faecal Zonulin and Calprotectin Concentrations in Healthy Children During the First Two Years of Life. An Observational Prospective Cohort Study. J. Clin. Med. 2020, 9, 777. https://0-doi-org.brum.beds.ac.uk/10.3390/jcm9030777
Łoniewska B, Adamek K, Węgrzyn D, Kaczmarczyk M, Skonieczna-Żydecka K, Clark J, Adler G, Tousty J, Uzar I, Tousty P, et al. Analysis of Faecal Zonulin and Calprotectin Concentrations in Healthy Children During the First Two Years of Life. An Observational Prospective Cohort Study. Journal of Clinical Medicine. 2020; 9(3):777. https://0-doi-org.brum.beds.ac.uk/10.3390/jcm9030777
Chicago/Turabian StyleŁoniewska, Beata, Karolina Adamek, Dagmara Węgrzyn, Mariusz Kaczmarczyk, Karolina Skonieczna-Żydecka, Jeremy Clark, Grażyna Adler, Joanna Tousty, Izabela Uzar, Piotr Tousty, and et al. 2020. "Analysis of Faecal Zonulin and Calprotectin Concentrations in Healthy Children During the First Two Years of Life. An Observational Prospective Cohort Study" Journal of Clinical Medicine 9, no. 3: 777. https://0-doi-org.brum.beds.ac.uk/10.3390/jcm9030777