On-Treatment Decrease of Serum Interleukin-6 as a Predictor of Clinical Response to Biologic Therapy in Patients with Inflammatory Bowel Diseases

 ,
,  , , ,
, , ,  , ,
, ,  ,
,  , ,
, , 
Abstract
:1. Introduction
2. Materials and Methods
2.1. Patients
2.2. Measurement of Serum Zonulin, sCD163, and Cytokines
2.3. Outcomes
2.4. Statistical Analysis
3. Results
3.1. Cross-Sectional Analysis
3.2. Longitudinal Analysis
4. Discussion
5. Conclusions
Supplementary Materials
Author Contributions
Conflicts of Interest
References
- Torres, J.; Mehandru, S.; Colombel, J.F.; Peyrin-Biroulet, L. Crohn’s disease. Lancet 2017, 389, 1741–1755. [Google Scholar] [CrossRef]
- Gargallo, C.J.; Lué, A.; Gomollon, F. Biosimilars in inflammatory bowel disease. Minerva Med. 2017, 108, 239–254. [Google Scholar]
- Caviglia, G.P.; Rosso, C.; Ribaldone, D.G.; Dughera, F.; Fagoonee, S.; Astegiano, M.; Pellicano, R. Physiopathology of intestinal barrier and the role of zonulin. Minerva Biotecnol. 2019, 31, 83–92. [Google Scholar] [CrossRef]
- Khan, I.; Ullah, N.; Zha, L.; Bai, Y.; Khan, A.; Zhao, T.; Che, T.; Zhang, C. Alteration of Gut Microbiota in Inflammatory Bowel Disease (IBD): Cause or Consequence? IBD Treatment Targeting the Gut Microbiome. Pathogens 2019, 8, 126. [Google Scholar] [CrossRef] [PubMed] [Green Version]
- Actis, G.C.; Pellicano, R.; Fagoonee, S.; Ribaldone, D.G. History of Inflammatory Bowel Diseases. J. Clin. Med. 2019, 8, 1970. [Google Scholar] [CrossRef] [PubMed] [Green Version]
- Fasano, A. Zonulin and its regulation of intestinal barrier function: The biological door to inflammation, autoimmunity, and cancer. Physiol. Rev. 2011, 91, 151–175. [Google Scholar] [CrossRef] [PubMed] [Green Version]
- Kim, D.H.; Cheon, J.H. Pathogenesis of Inflammatory Bowel Disease and Recent Advances in Biologic Therapies. Immune Netw. 2017, 17, 25–40. [Google Scholar] [CrossRef] [PubMed] [Green Version]
- Caviglia, G.P.; Dughera, F.; Ribaldone, D.G.; Rosso, C.; Abate, M.L.; Pellicano, R.; Bresso, F.; Smedile, A.; Saracco, G.M.; Astegiano, M. Serum zonulin in patients with inflammatory bowel disease: A pilot study. Minerva Med. 2019, 110, 95–100. [Google Scholar] [CrossRef] [PubMed]
- Ahluwalia, B.; Moraes, L.; Magnusson, M.K.; Öhman, L. Immunopathogenesis of inflammatory bowel disease and mechanisms of biological therapies. Scand. J. Gastroenterol. 2018, 53, 379–389. [Google Scholar] [CrossRef]
- Fasano, A. All disease begins in the (leaky) gut: Role of zonulin-mediated gut permeability in the pathogenesis of some chronic inflammatory diseases. F1000Research 2020, 9. [Google Scholar] [CrossRef]
- Dige, A.; Støy, S.; Thomsen, K.L.; Hvas, C.L.; Agnholt, J.; Dahlerup, J.F.; Møller, H.J.; Grønbaek, H. Soluble CD163, a specific macrophage activation marker, is decreased by anti-TNF-α antibody treatment in active inflammatory bowel disease. Scand. J. Immunol. 2014, 80, 417–423. [Google Scholar] [CrossRef] [PubMed]
- Schreiner, P.; Neurath, M.F.; Ng, S.C.; El-Omar, E.M.; Sharara, A.I.; Kobayashi, T.; Hisamatsu, T.; Hibi, T.; Rogler, G. Mechanism-Based Treatment Strategies for IBD: Cytokines, Cell Adhesion Molecules, JAK Inhibitors, Gut Flora, and More. Inflamm. Intest. Dis. 2019, 4, 79–96. [Google Scholar] [CrossRef] [PubMed]
- Kayal, M.; Shah, S. Ulcerative Colitis: Current and Emerging Treatment Strategies. J. Clin. Med. 2020, 9, 94. [Google Scholar] [CrossRef] [PubMed] [Green Version]
- Berg, D.R.; Colombel, J.F.; Ungaro, R. The Role of Early Biologic Therapy in Inflammatory Bowel Disease. Inflamm. Bowel. Dis. 2019, 25, 1896–1905. [Google Scholar] [CrossRef]
- Yanai, H.; Hanauer, S.B. Assessing response and loss of response to biological therapies in IBD. Am. J. Gastroenterol. 2011, 106, 685–698. [Google Scholar] [CrossRef] [PubMed]
- Magro, F.; Gionchetti, P.; Eliakim, R.; Ardizzone, S.; Armuzzi, A.; Barreiro-de Acosta, M.; Burisch, J.; Gecse, K.B.; Hart, A.L.; Hindryckx, P.; et al. Third European evidence-based consensus on diagnosis and management of ulcerative colitis. Part 1: Definitions, diagnosis, extra-intestinal manifestations, pregnancy, cancer surveillance, surgery, and ileo-anal pouch disorders. J. Crohns Colitis 2017, 11, 649–670. [Google Scholar] [CrossRef]
- Gomollón, F.; Dignass, A.; Annese, V.; Tilg, H.; Van Assche, G.; Lindsay, J.O.; Peyrin-Biroulet, L.; Cullen, G.J.; Daperno, M.; Kucharzik, T.; et al. 3rd European evidence-based consensus on the diagnosis and management of Crohn’s disease 2016: Part 1: Diagnosis and medical management. J. Crohn Colitis 2017, 11, 3–25. [Google Scholar] [CrossRef] [Green Version]
- Silverberg, M.S.; Satsangi, J.; Ahmad, T.; Arnott, I.D.; Bernstein, C.N.; Brant, S.R.; Caprilli, R.; Colombel, J.F.; Gasche, C.; Geboes, K.; et al. Toward an integrated clinical, molecular and serological classification of inflammatory bowel disease: Report of a working party of the 2005 Montreal world congress of gastroenterology. Can. J. Gastroenterol. 2005, 19, 5–36. [Google Scholar] [CrossRef]
- Harvey, R.F.; Bradshaw, M.J. Measuring Crohn’s disease activity. Lancet 1980, 1, 1134–1135. [Google Scholar] [CrossRef]
- Lewis, J.D.; Chuai, S.; Nessel, L.; Lichtenstein, G.R.; Aberra, F.N.; Ellenberg, J.H. Use of the noninvasive components of the Mayo score to assess clinical response in ulcerative colitis. Inflamm. Bowel. Dis. 2008, 14, 1660–1666. [Google Scholar] [CrossRef] [Green Version]
- Peyrin-Biroulet, L.; Sandborn, W.; Sands, B.E.; Reinisch, W.; Bemelman, W.; Bryant, R.V.; D’Haens, G.; Dotan, I.; Dubinsky, M.; Feagan, B.; et al. Selecting Therapeutic Targets in Inflammatory Bowel Disease (STRIDE): Determining Therapeutic Goals for Treat-to-Target. Am. J. Gastroenterol. 2015, 110. [Google Scholar] [CrossRef]
- Arrieta, M.C.; Madsen, K.; Doyle, J.; Meddings, J. Reducing small intestinal permeability attenuates colitis in the IL10 gene-deficient mouse. Gut 2009, 58, 41–48. [Google Scholar] [CrossRef] [PubMed] [Green Version]
- Singh, P.; Silvester, J.; Chen, X.; Xu, H.; Sawhney, V.; Rangan, V.; Iturrino, J.; Nee, J.; Duerksen, D.R.; Lembo, A. Serum zonulin is elevated in IBS and correlates with stool frequency in IBS-D. United Eur. Gastroenterol. J. 2019, 7, 709–715. [Google Scholar] [CrossRef] [PubMed] [Green Version]
- Linsalata, M.; Riezzo, G.; D’Attoma, B.; Clemente, C.; Orlando, A.; Russo, F. Noninvasive biomarkers of gut barrier function identify two subtypes of patients suffering from diarrhoea predominant-IBS: A case-control study. BMC Gastroenterol. 2018, 18, 167. [Google Scholar] [CrossRef] [PubMed] [Green Version]
- Kamada, N.; Hisamatsu, T.; Okamoto, S.; Chinen, H.; Kobayashi, T.; Sato, T.; Sakuraba, A.; Kitazume, M.T.; Sugita, A.; Koganei, K.; et al. Unique CD14 intestinal macrophages contribute to the pathogenesis of Crohn disease via IL-23/IFN-gamma axis. J. Clin. Investig. 2008, 118, 2269–2280. [Google Scholar]
- Wallace, K.L.; Zheng, L.B.; Kanazawa, Y.; Shih, D.Q. Immunopathology of inflammatory bowel disease. World J. Gastroenterol. 2014, 20, 6–21. [Google Scholar] [CrossRef]
- Huang, Y.; Chen, Z. Inflammatory bowel disease related innate immunity and adaptive immunity. Am. J. Transl. Res. 2016, 8, 2490–2497. [Google Scholar]
- Franzè, E.; Caruso, R.; Stolfi, C.; Sarra, M.; Cupi, M.L.; Caprioli, F.; Monteleone, I.; Zorzi, F.; De Nitto, D.; Colantoni, A.; et al. Lesional accumulation of CD163-expressing cells in the gut of patients with inflammatory bowel disease. PLoS ONE 2013, 8, e69839. [Google Scholar] [CrossRef]
- Marafini, I.; Sedda, S.; Dinallo, V.; Monteleone, G. Inflammatory cytokines: From discoveries to therapies in IBD. Expert. Opin. Biol. 2019, 19, 1207–1217. [Google Scholar] [CrossRef]
- Bertani, L.; Antonioli, L.; Fornai, M.; Tapete, G.; Baiano Svizzero, G.; Marchi, S.; Blandizzi, C.; Costa, F. Evaluation of cytokine levels as putative biomarkers to predict the pharmacological response to biologic therapy in inflammatory bowel diseases. Minerva Gastroenterol. Dietol. 2019, 65, 298–308. [Google Scholar] [CrossRef]
- Bertani, L.; Baglietto, L.; Antonioli, L.; Fornai, M.; Tapete, G.; Albano, E.; Ceccarelli, L.; Mumolo, M.G.; Pellegrini, C.; Lucenteforte, E.; et al. Assessment of serum cytokines predicts clinical and endoscopic outcomes to vedolizumab in ulcerative colitis patients. Br. J. Clin. Pharm. 2020. [Google Scholar] [CrossRef] [PubMed]
- Suzuki, Y.; Matsui, T.; Ito, H.; Ashida, T.; Nakamura, S.; Motoya, S.; Matsumoto, T.; Sato, N.; Ozaki, K.; Watanabe, M.; et al. Circulating Interleukin 6 and Albumin, and Infliximab Levels Are Good Predictors of Recovering Efficacy After Dose Escalation Infliximab Therapy in Patients with Loss of Response to Treatment for Crohn’s Disease: A Prospective Clinical Trial. Inflamm. Bowel. Dis. 2015, 21, 2114–2122. [Google Scholar] [CrossRef] [PubMed]
- Nishida, Y.; Hosomi, S.; Watanabe, K.; Watanabe, K.; Yukawa, T.; Otani, K.; Nagami, Y.; Tanaka, F.; Taira, K.; Kamata, N.; et al. Serum interleukin-6 level is associated with response to infliximab in ulcerative colitis. Scand. J. Gastroenterol. 2018, 53, 579–585. [Google Scholar] [CrossRef] [PubMed]
- Wine, E.; Mack, D.R.; Hyams, J.; Otley, A.R.; Markowitz, J.; Crandall, W.V.; Leleiko, N.; Muise, A.M.; Griffiths, A.M.; Turner, D. Interleukin-6 is associated with steroid resistance and reflects disease activity in severe pediatric ulcerative colitis. J. Crohns Colitis 2013, 7, 916–922. [Google Scholar] [CrossRef] [Green Version]


| IBD (n = 101) | IBS (n = 19) | p-Value | |
|---|---|---|---|
| Age (years), median (range) | 48 (18–80) | 43 (18–69) | 0.067 |
| Gender (M/F) | 62/39 | 6/13 | 0.023 |
| Disease (CD/UC) | 72/29 | ||
| Montreal classification | |||
| CD (L1/L2/L3) | 24/4/43 | ||
| UC (E1/E2/E3) | 4/9/16 | ||
| Clinical activity | |||
| Remission | 27 | ||
| Mild | 40 | ||
| Moderate | 28 | ||
| Severe | 6 | ||
| Disease duration (years), median (range) | 14 (1–49) | ||
| Previous surgery (yes/no) | 48/53 | ||
| Smoke (current/never/ex) | 23/42/36 | ||
| Biochemical activity | |||
| FC (µg/g), median (95% CI) | 602 (395–997) | ||
| CRP (mg/L), median (95% CI) | 7.0 (5.0–9.0) | ||
| ESR (positive/negative/N/A) | 45/35/21 |
| IBD (n = 101) | IBS (n = 19) | p-Value | |
|---|---|---|---|
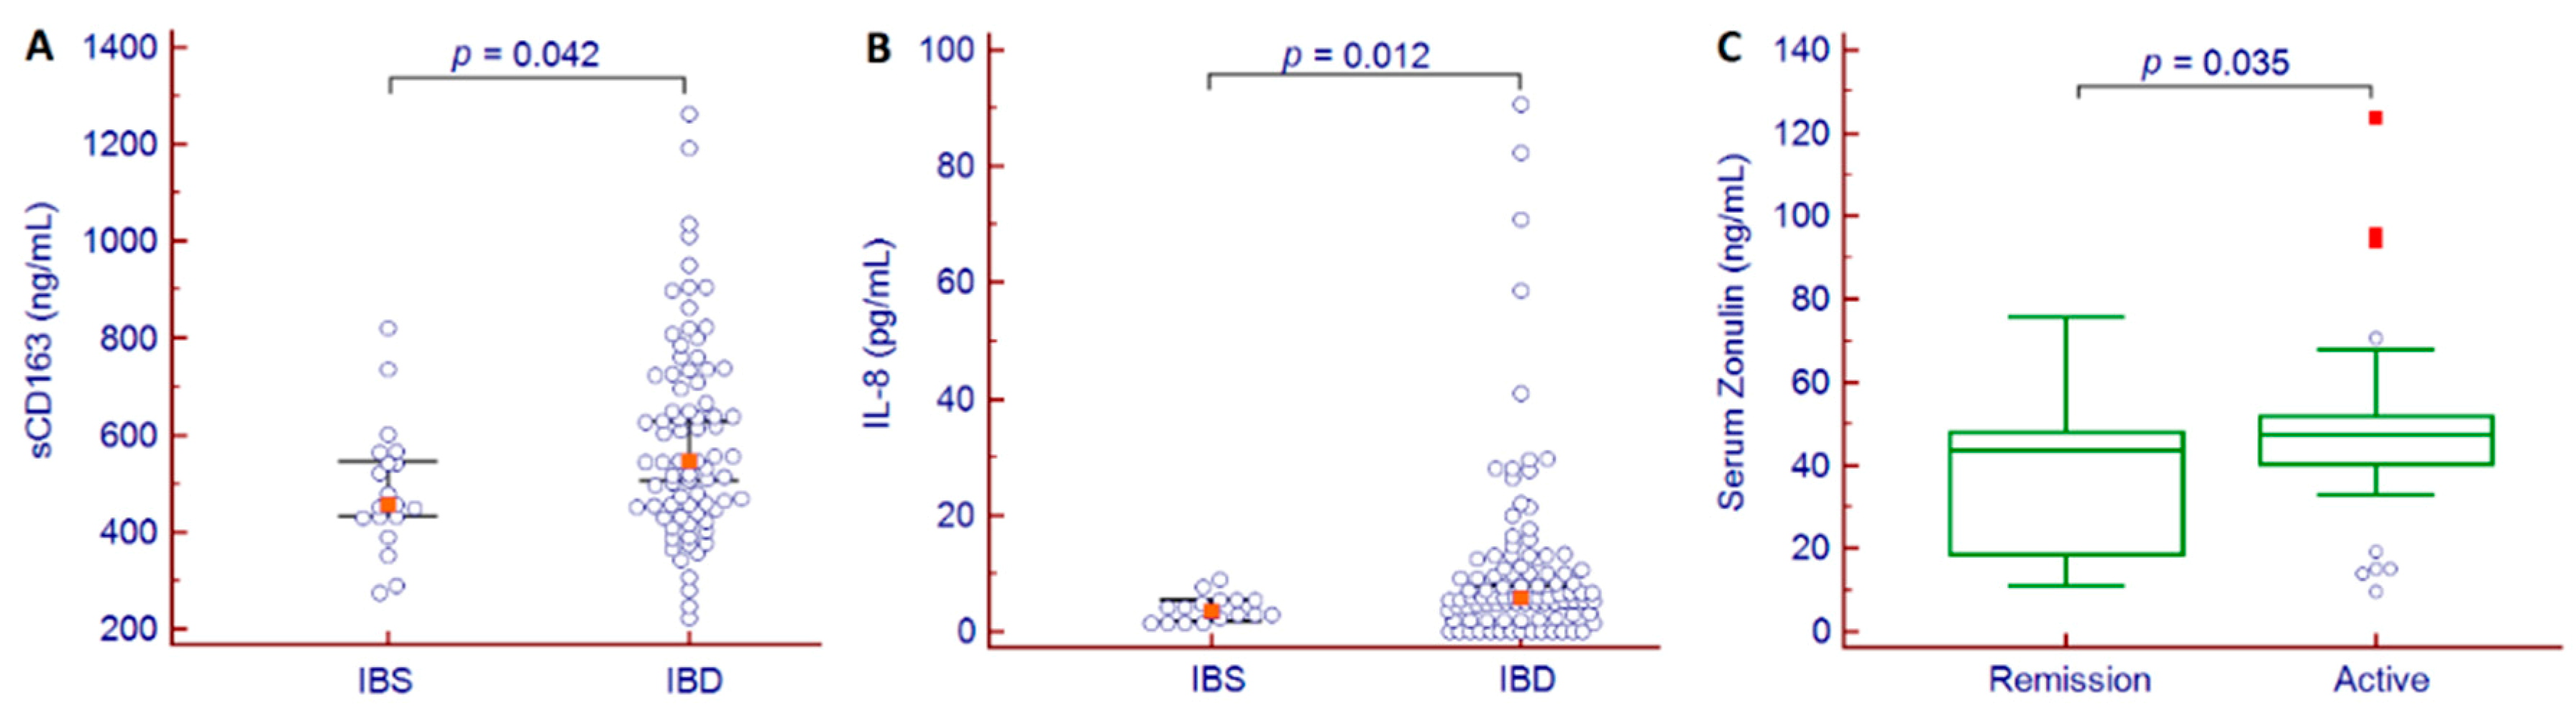
| Zonulin (ng/mL), median (95% CI) | 45.3 (43.5–47.8) | 43.3 (37.2–46.4) | 0.322 |
| sCD163 (ng/mL), median (95% CI) | 547 (506–629) | 456 (432–548) | 0.042 |
| IL-1β (pg/mL), median (95% CI) | n.q. | n.q. | |
| IL-4 (pg/mL), median (95% CI) | n.q. | n.q. | |
| IL-6 (pg/mL), median (95% CI) | 2.52 (1.43–4.27) | 4.23 (2.87–7.06) | 0.140 |
| IL-8 (pg/mL), median (95% CI) | 5.79 (5.15–7.96) | 3.47 (1.97–5.32) | 0.012 |
| IL-10 (pg/mL), median (95% CI) | 0.01 (0.01–1.12) | n.q. | |
| IL-12(p70) (pg/mL), median (95% CI) | n.q. | n.q. | |
| IL-17 (pg/mL), median (95% CI) | n.q. | n.q. | |
| IL-23 (pg/mL), median (95% CI) | n.q. | n.q. | |
| IL-33 (pg/mL), median (95% CI) | 0.18 (0.01–15.50) | n.q. | |
| IFNγ (pg/mL), median (95% CI) | n.q. | n.q. | |
| TNFα (pg/mL), median (95% CI) | 10.48 (8.30–14.21) | 5.69 (2.23–11.09) | 0.159 |
| n | T0 | T1 | p-Value | |
|---|---|---|---|---|
| Zonulin (ng/mL), median (95% CI) | 60 | 46.0 (43.4–49.3) | 45.6 (42.0–50.9) | 0.722 |
| Responders | 32 | 44.2 (41.8–48.0) | 43.1 (39.4–50.2) | 0.981 |
| Non-responders | 28 | 48.6 (43.3–53.4) | 48.7 (42.1–54.0) | 0.568 |
| sCD163 (ng/mL), median (95% CI) | 60 | 520 (464–603) | 567 (498–607) | 0.818 |
| Responders | 32 | 503 (450–560) | 515 (447–599) | 0.838 |
| Non-responders | 28 | 552 (465–652) | 607 (500–670) | 0.864 |
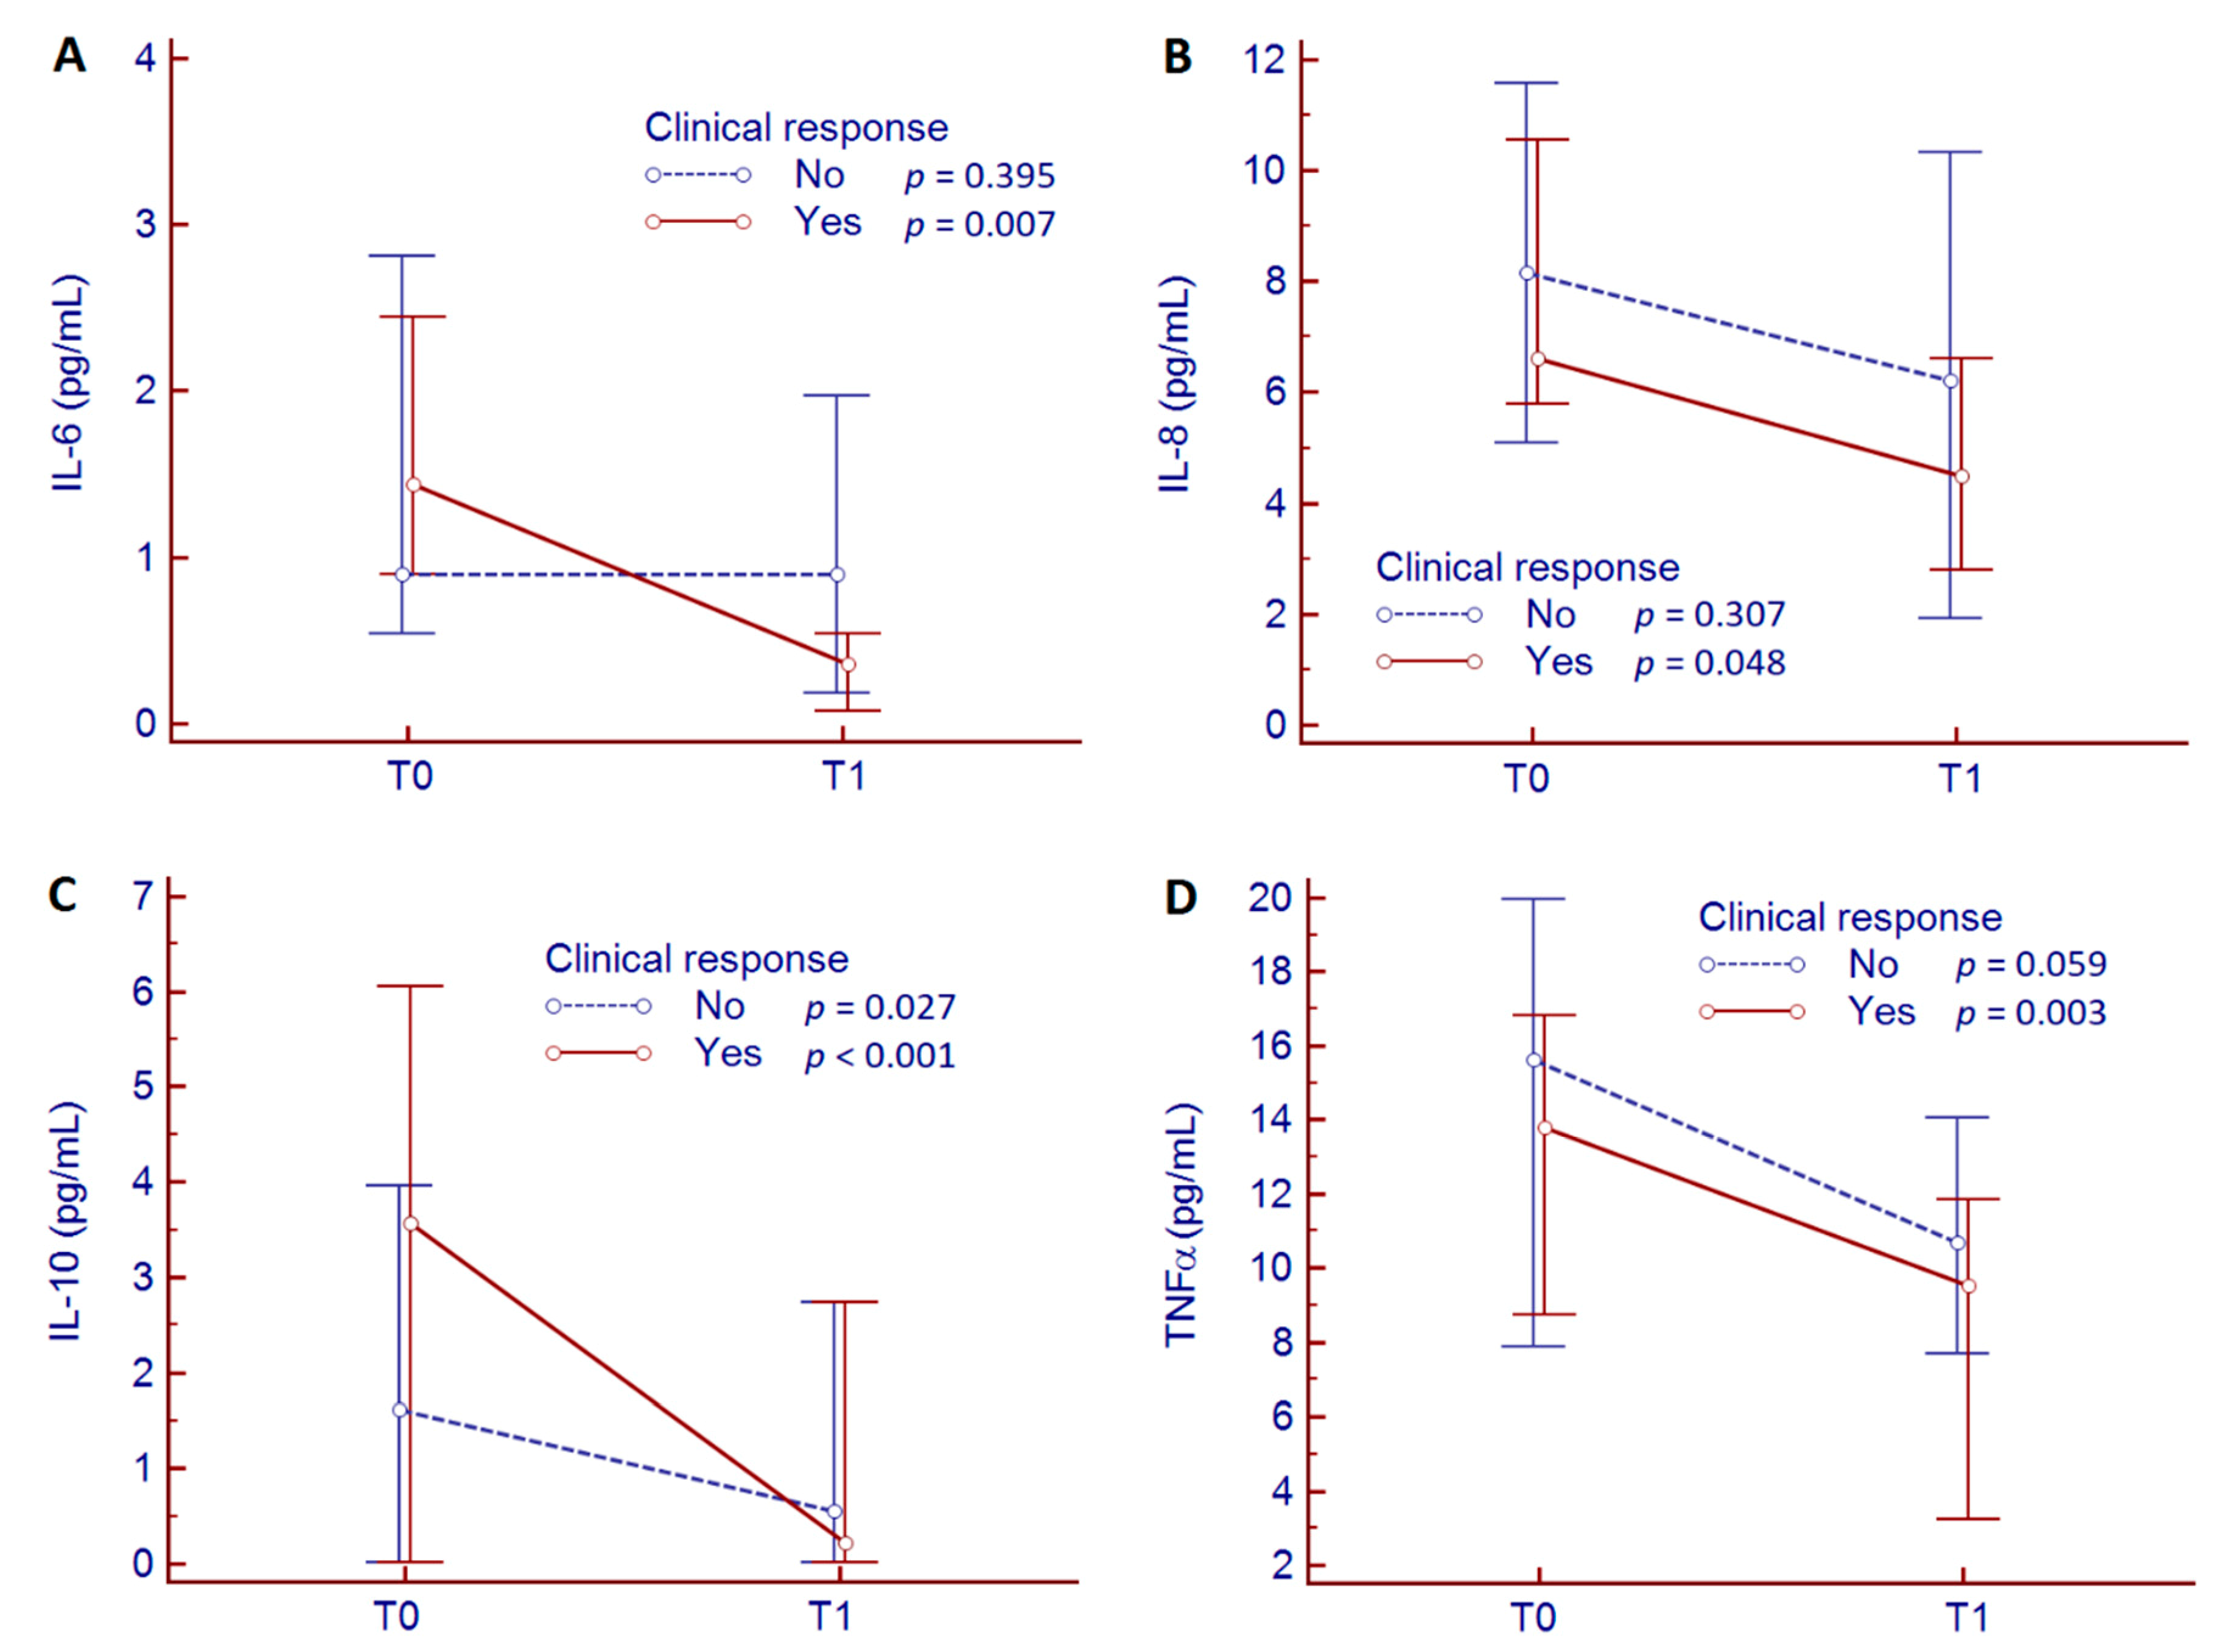
| IL-6 (pg/mL), median (95% CI) | 60 | 1.08 (0.71–2.32) | 0.54 (0.18–1.09) | 0.013 |
| Responders | 32 | 1.44 (0.90–2.45) | 0.36 (0.07–0.54) | 0.007 |
| Non-responders | 28 | 0.90 (0.54–2.81) | 0.90 (0.18–1.97) | 0.395 |
| IL-8 (pg/mL), median (95% CI) | 60 | 7.30 (5.79–10.02) | 5.04 (3.19–6.86) | 0.043 |
| Responders | 32 | 6.62 (5.79–10.56) | 4.50 (2.79–6.62) | 0.048 |
| Non-responders | 28 | 8.15 (5.09–11.57) | 6.22 (1.92–10.33) | 0.307 |
| IL-10 (pg/mL), median (95% CI) | 60 | 1.89 (0.48–4.95) | 0.26 (0.01–2.74) | <0.001 |
| Responders | 32 | 3.56 (0.01–6.05) | 0.23 (0.01–2.74) | <0.001 |
| Non-responders | 28 | 1.61 (0.01–3.96) | 0.56 (0.01–2.74) | 0.027 |
| IL-33 (pg/mL), median (95% CI) | 60 | 8.76 (0.09–43.16) | 4.64 (0.01–33.56) | 0.126 |
| Responders | 32 | 8.76 (0.07–49.86) | 4.64 (0.01–46.01) | 0.433 |
| Non-responders | 28 | 16.87 (0.01–57.87) | 0.01 (0.01–36.71) | 0.151 |
| TNFα (pg/mL), median (95% CI) | 60 | 14.46 (9.78–16.76) | 10.40 (7.86–11.86) | <0.001 |
| Responders | 32 | 13.79 (8.75–16.82) | 9.51 (3.25–11.86) | 0.003 |
| Non-responders | 28 | 15.60 (7.86–19.97) | 10.69 (7.67–14.04) | 0.059 |
© 2020 by the authors. Licensee MDPI, Basel, Switzerland. This article is an open access article distributed under the terms and conditions of the Creative Commons Attribution (CC BY) license (http://creativecommons.org/licenses/by/4.0/).
Share and Cite
Caviglia, G.P.; Rosso, C.; Stalla, F.; Rizzo, M.; Massano, A.; Abate, M.L.; Olivero, A.; Armandi, A.; Vanni, E.; Younes, R.; et al. On-Treatment Decrease of Serum Interleukin-6 as a Predictor of Clinical Response to Biologic Therapy in Patients with Inflammatory Bowel Diseases. J. Clin. Med. 2020, 9, 800. https://0-doi-org.brum.beds.ac.uk/10.3390/jcm9030800
Caviglia GP, Rosso C, Stalla F, Rizzo M, Massano A, Abate ML, Olivero A, Armandi A, Vanni E, Younes R, et al. On-Treatment Decrease of Serum Interleukin-6 as a Predictor of Clinical Response to Biologic Therapy in Patients with Inflammatory Bowel Diseases. Journal of Clinical Medicine. 2020; 9(3):800. https://0-doi-org.brum.beds.ac.uk/10.3390/jcm9030800
Chicago/Turabian StyleCaviglia, Gian Paolo, Chiara Rosso, Francesco Stalla, Martina Rizzo, Alessandro Massano, Maria Lorena Abate, Antonella Olivero, Angelo Armandi, Ester Vanni, Ramy Younes, and et al. 2020. "On-Treatment Decrease of Serum Interleukin-6 as a Predictor of Clinical Response to Biologic Therapy in Patients with Inflammatory Bowel Diseases" Journal of Clinical Medicine 9, no. 3: 800. https://0-doi-org.brum.beds.ac.uk/10.3390/jcm9030800