Complex Immunometabolic Profiling Reveals the Activation of Cellular Immunity and Biliary Lesions in Patients with Severe COVID-19

 , , ,
, , ,
Abstract
:
1. Introduction
2. Patients and Methods
2.1. Patient Cohort and Study Design
2.2. Laboratory Parameters
2.3. Lymphocyte Subsets
2.4. Immunohistochemistry
2.5. Statistical Analysis
3. Results
3.1. Clinical Course of the Disease
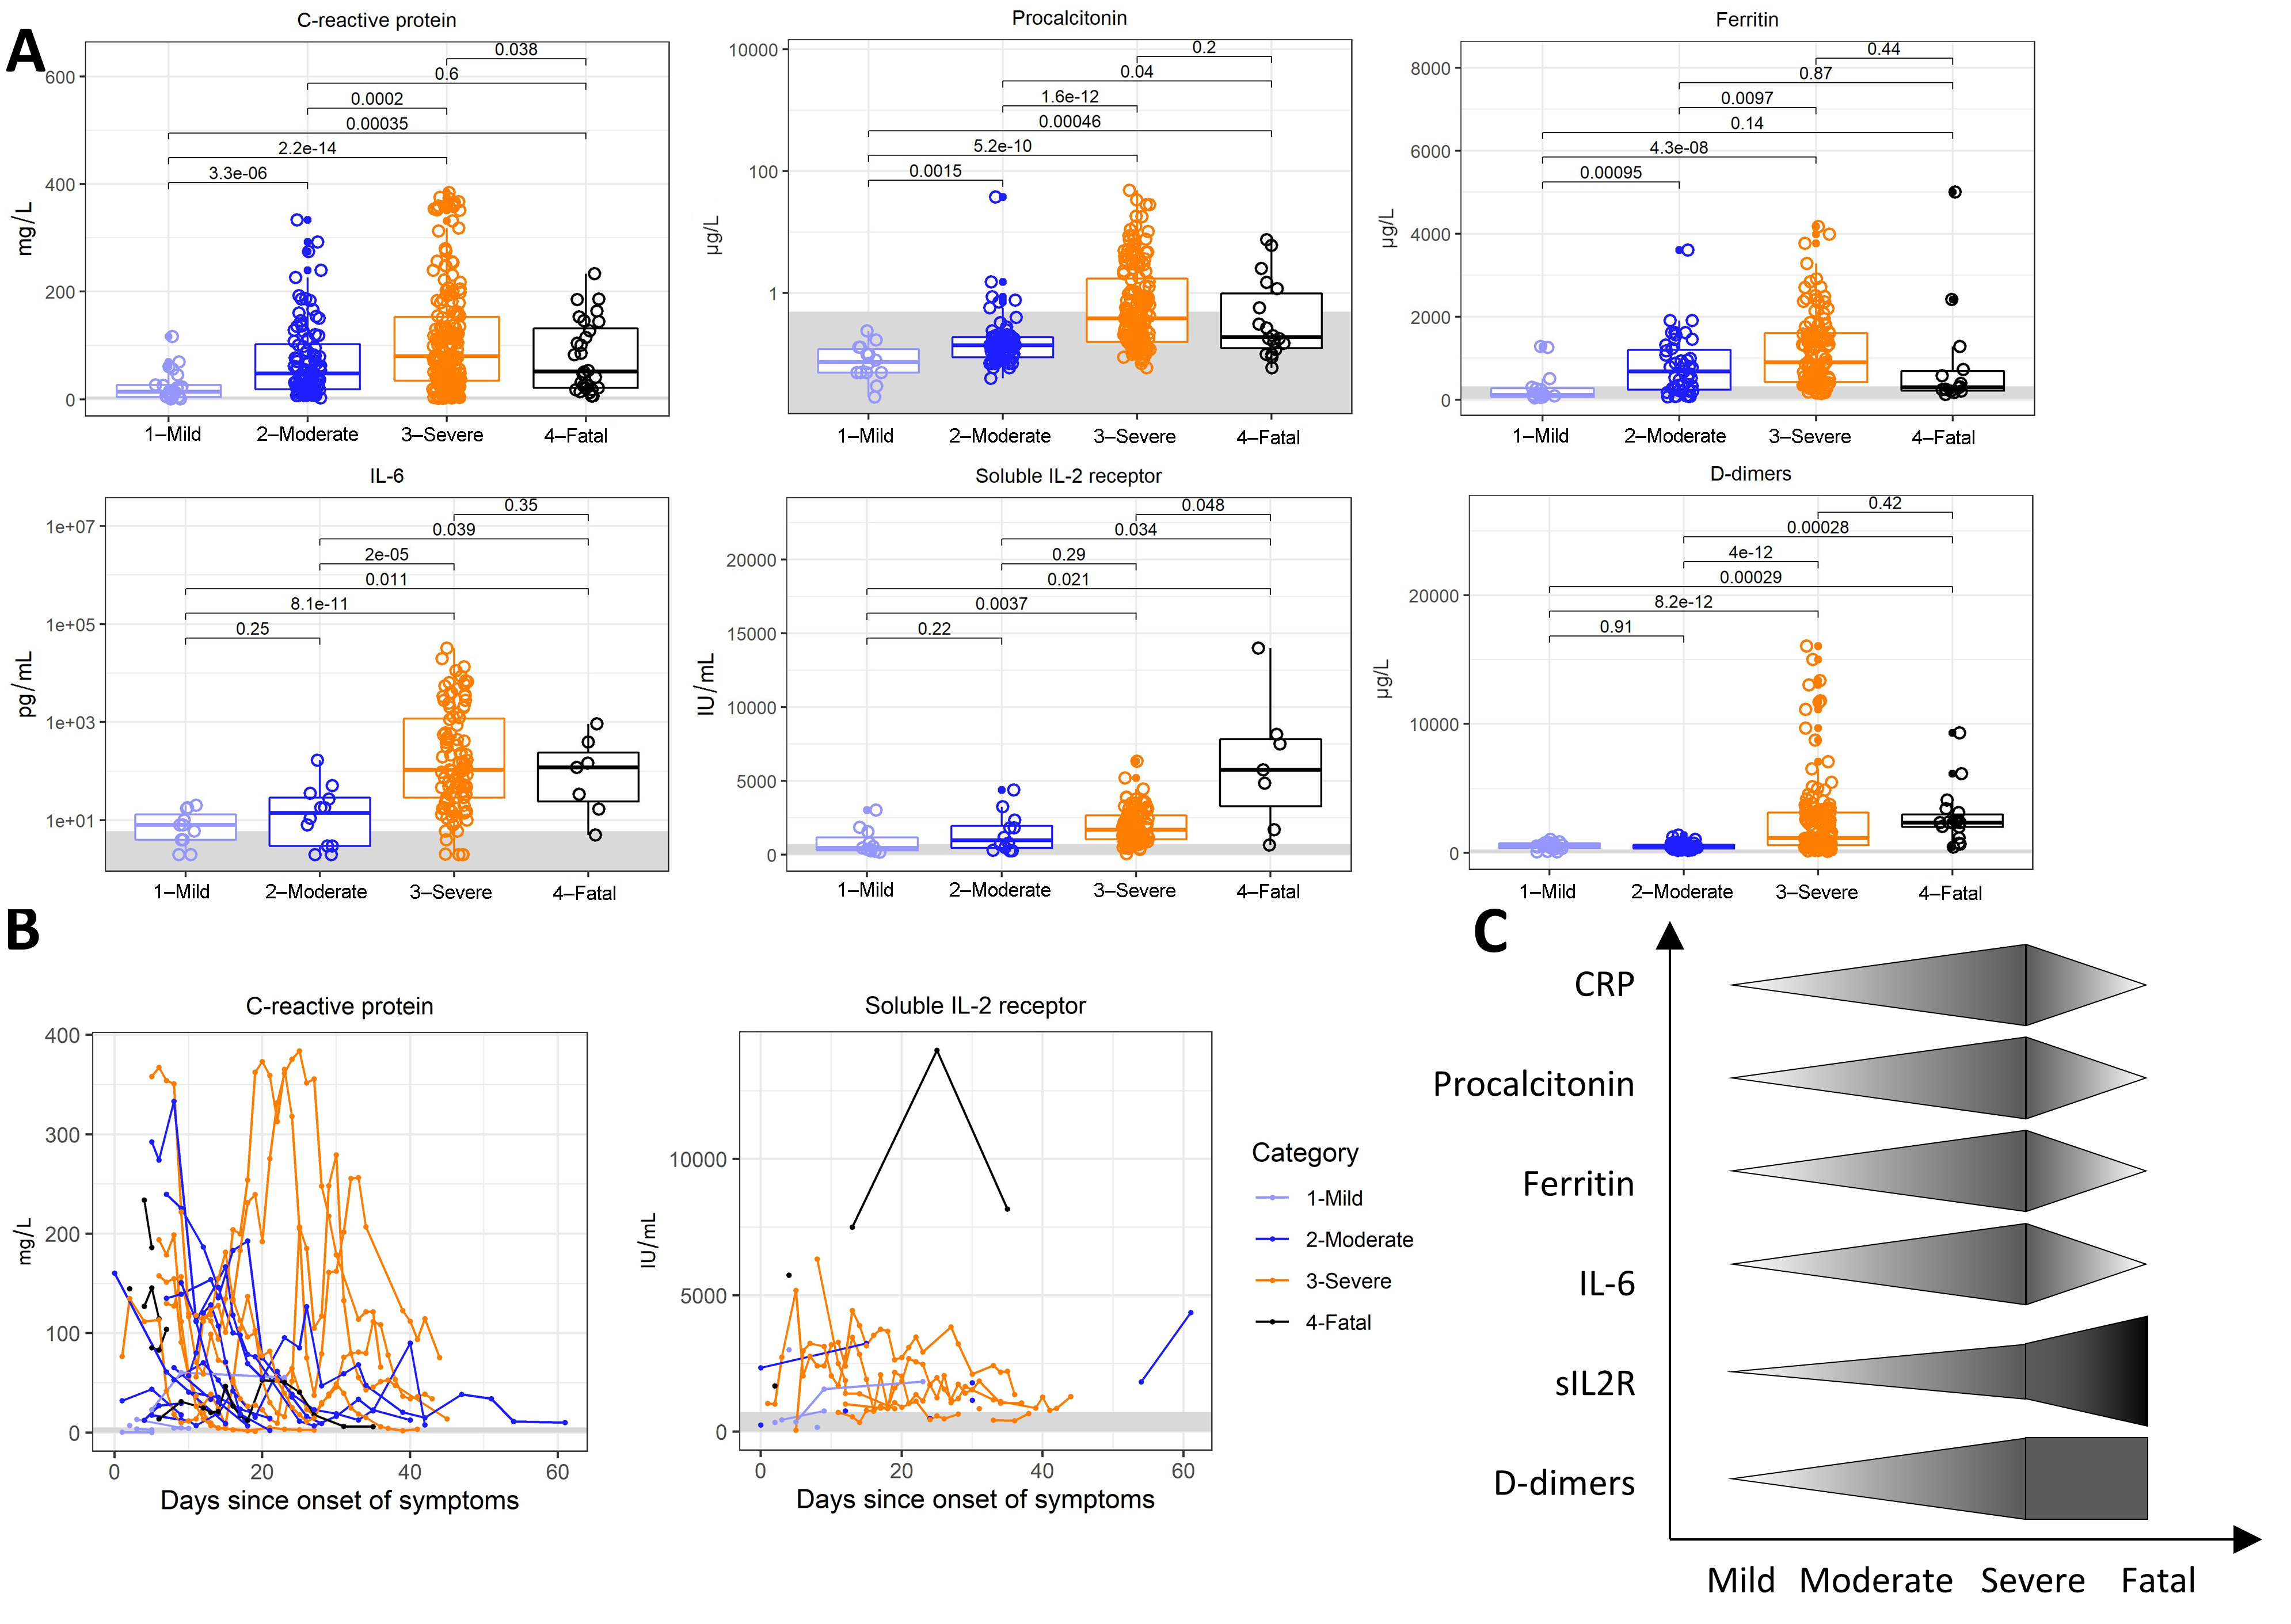
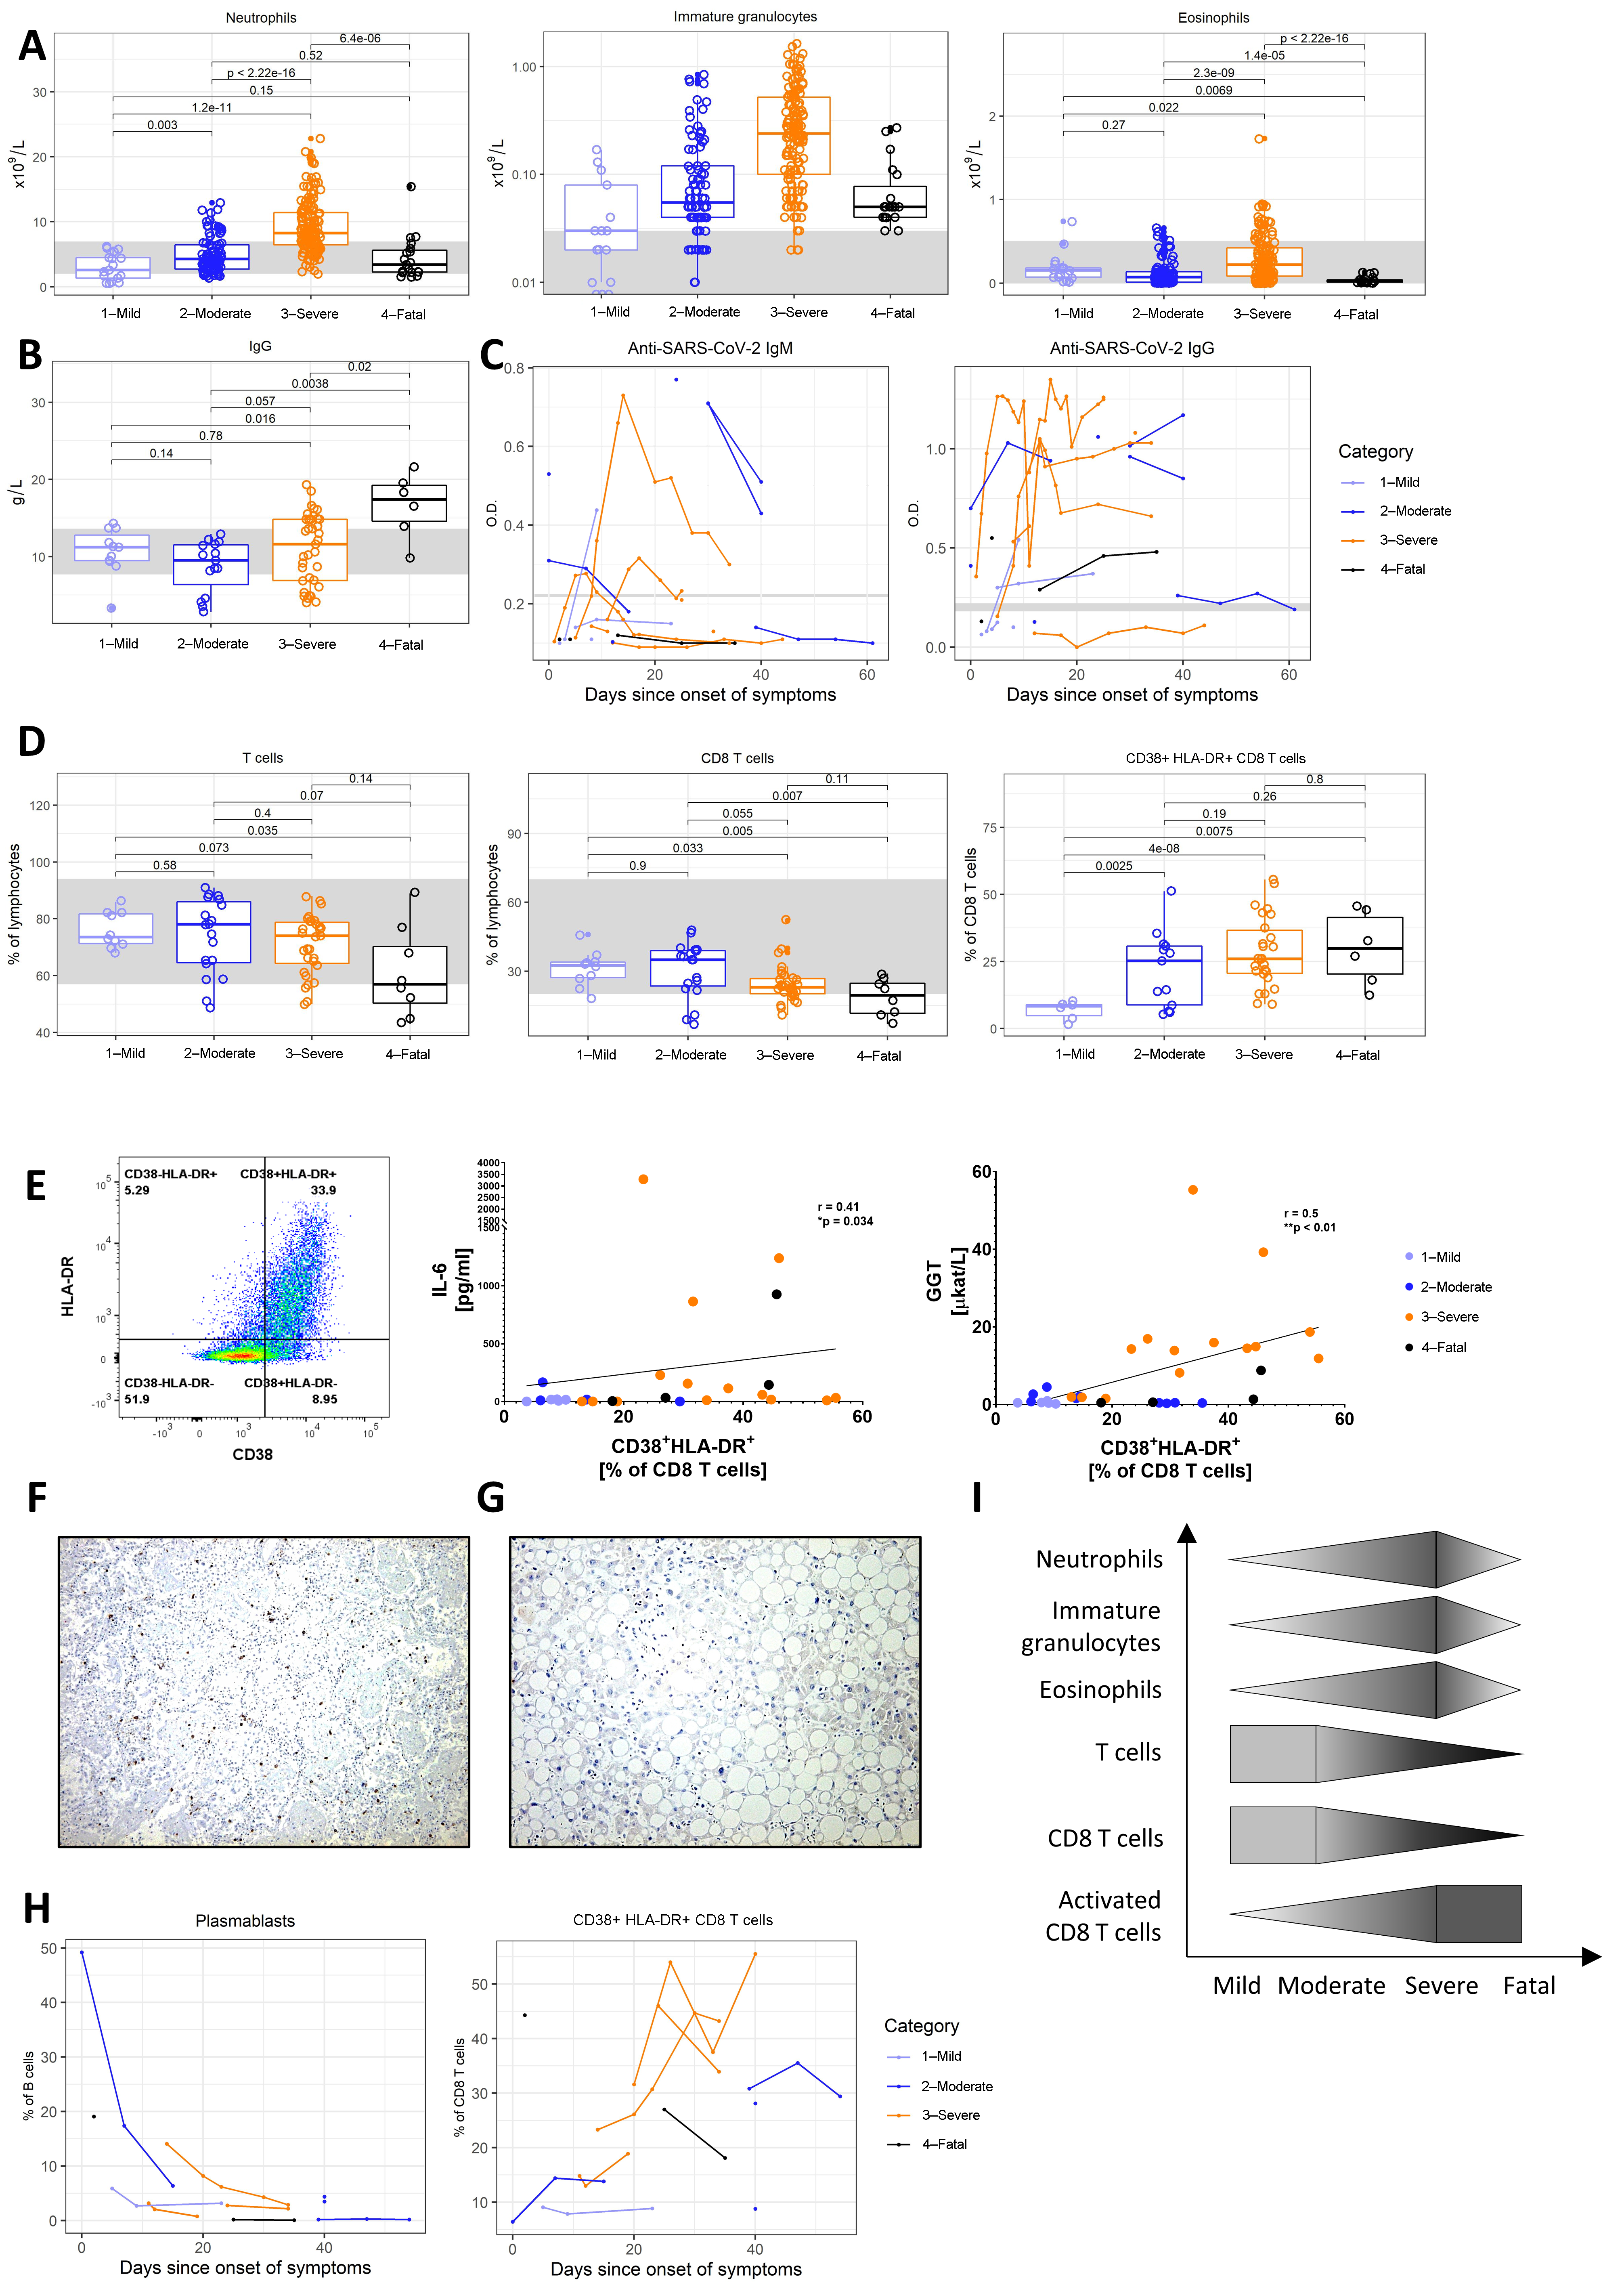
3.2. Inflammation
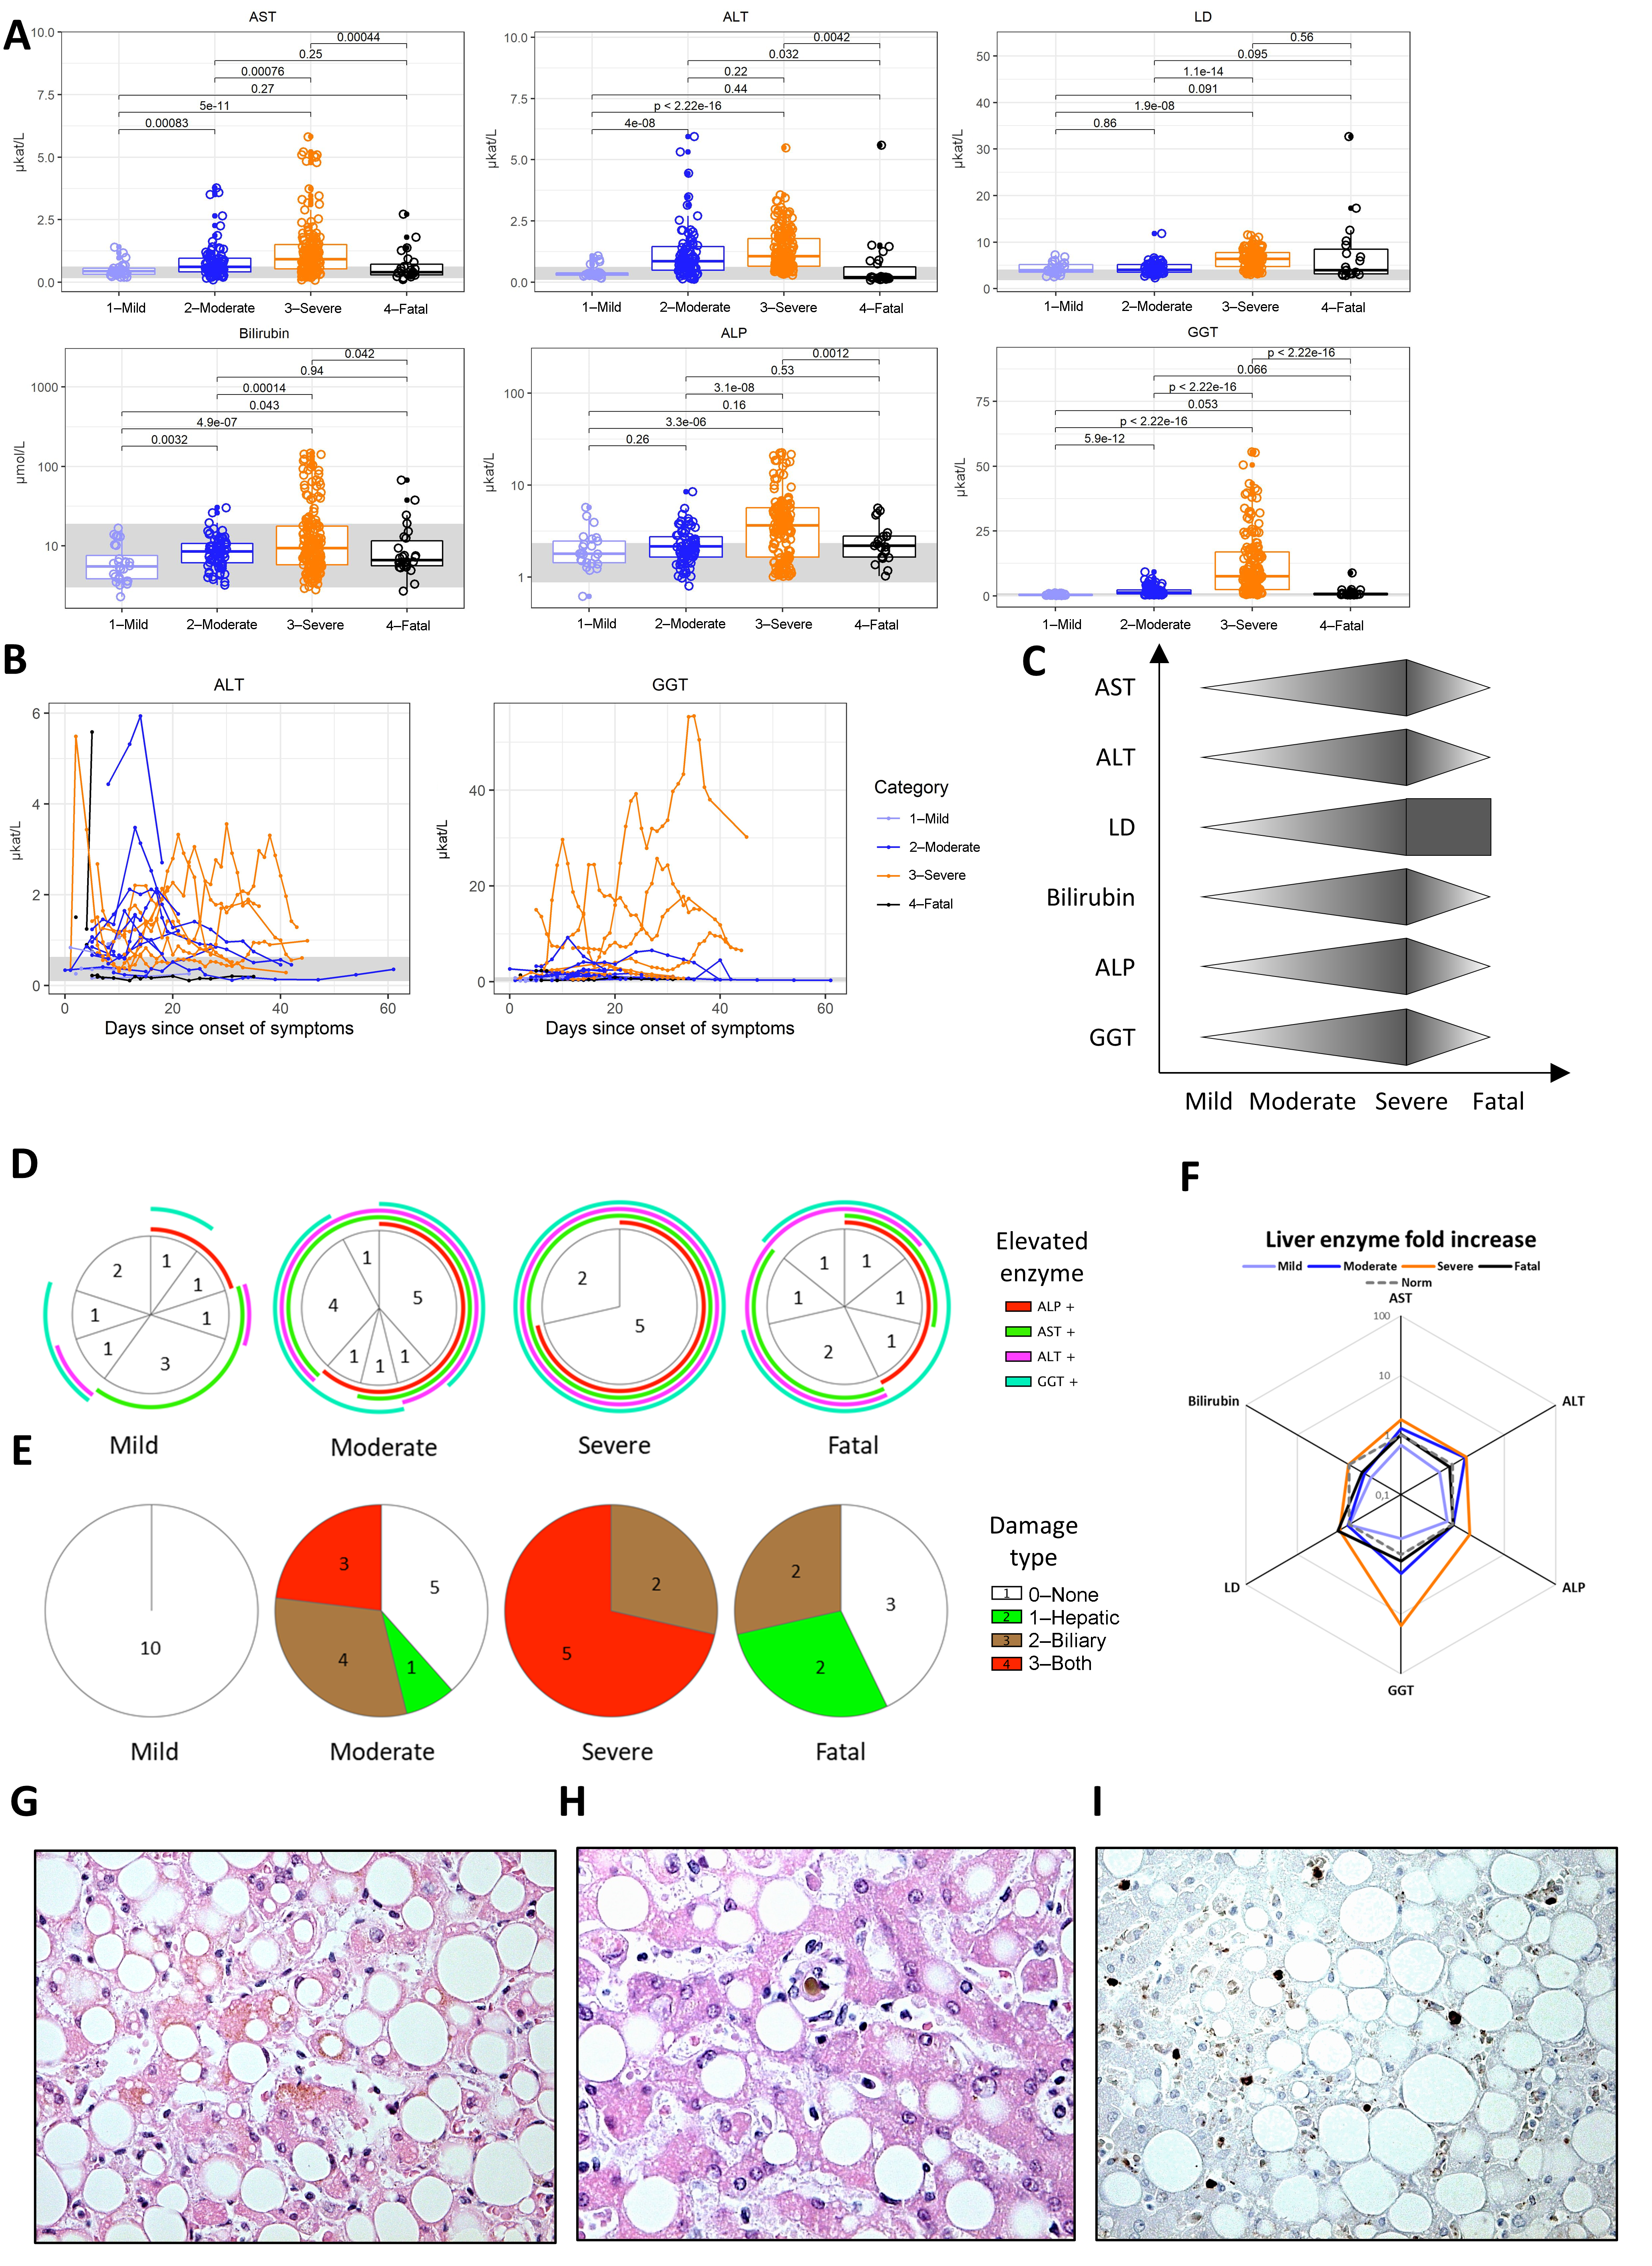
3.3. Hepatopathy
3.4. Immune Response
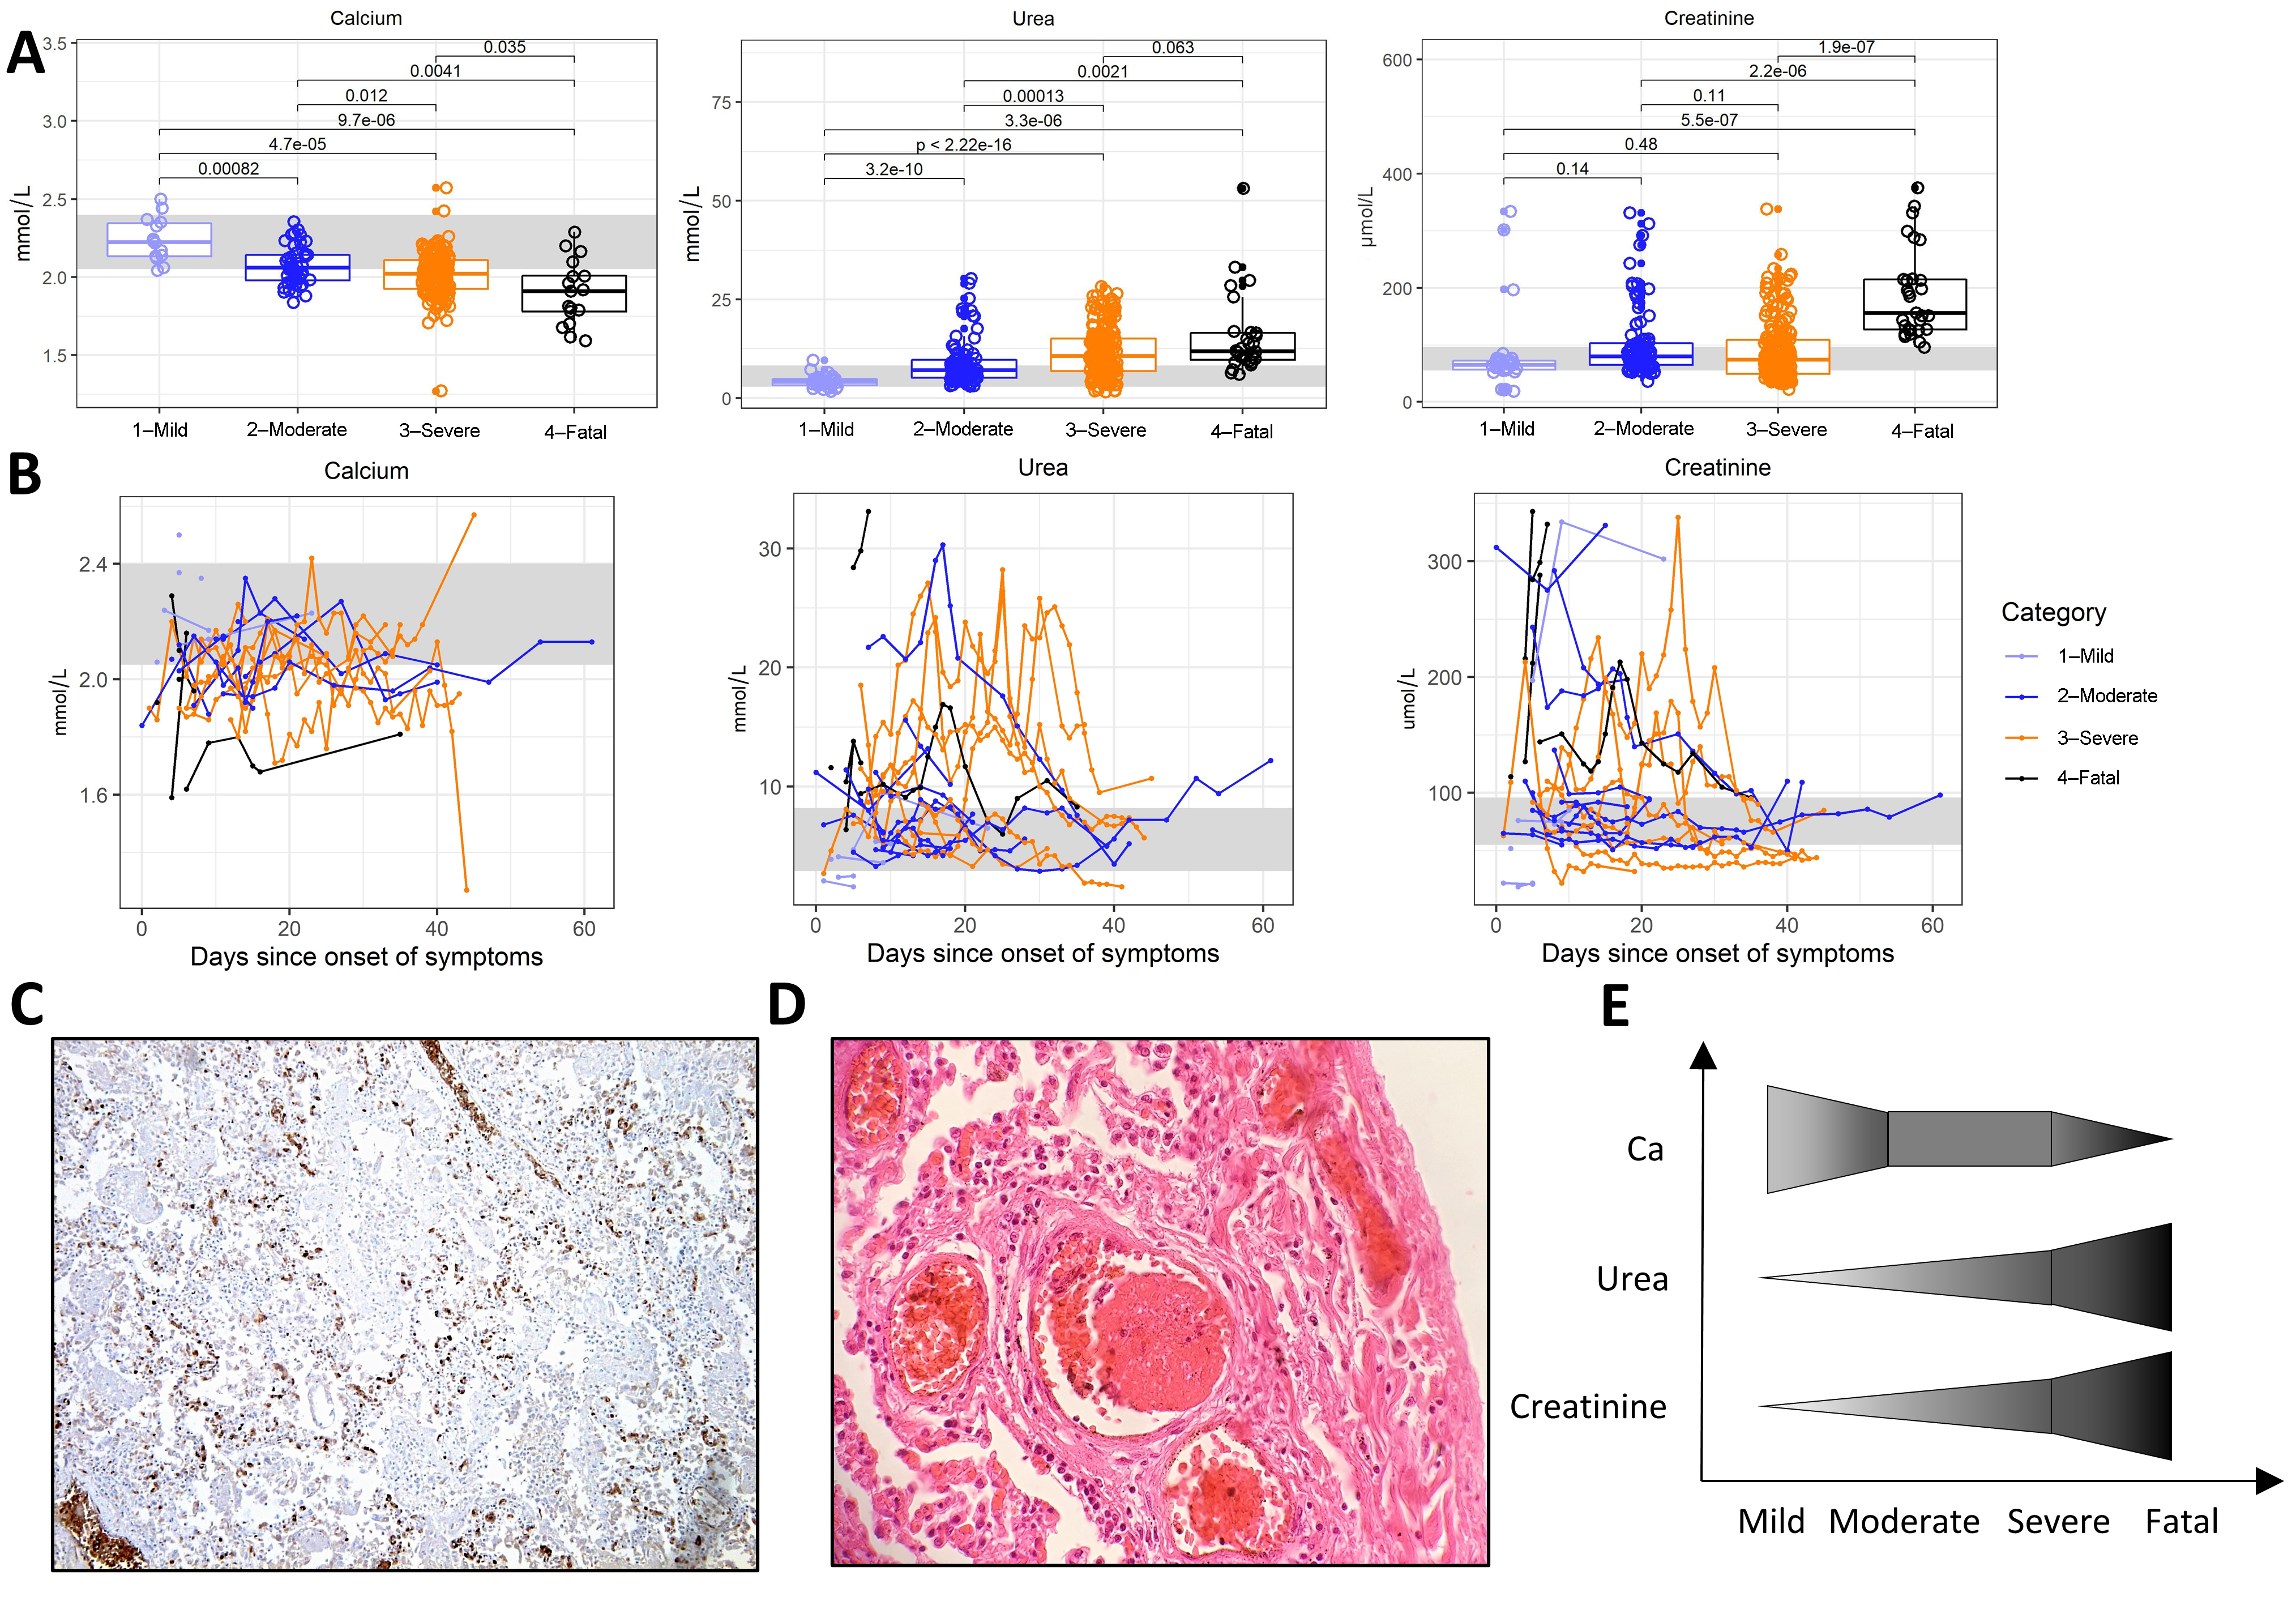
3.5. Kidney and Lung Damage
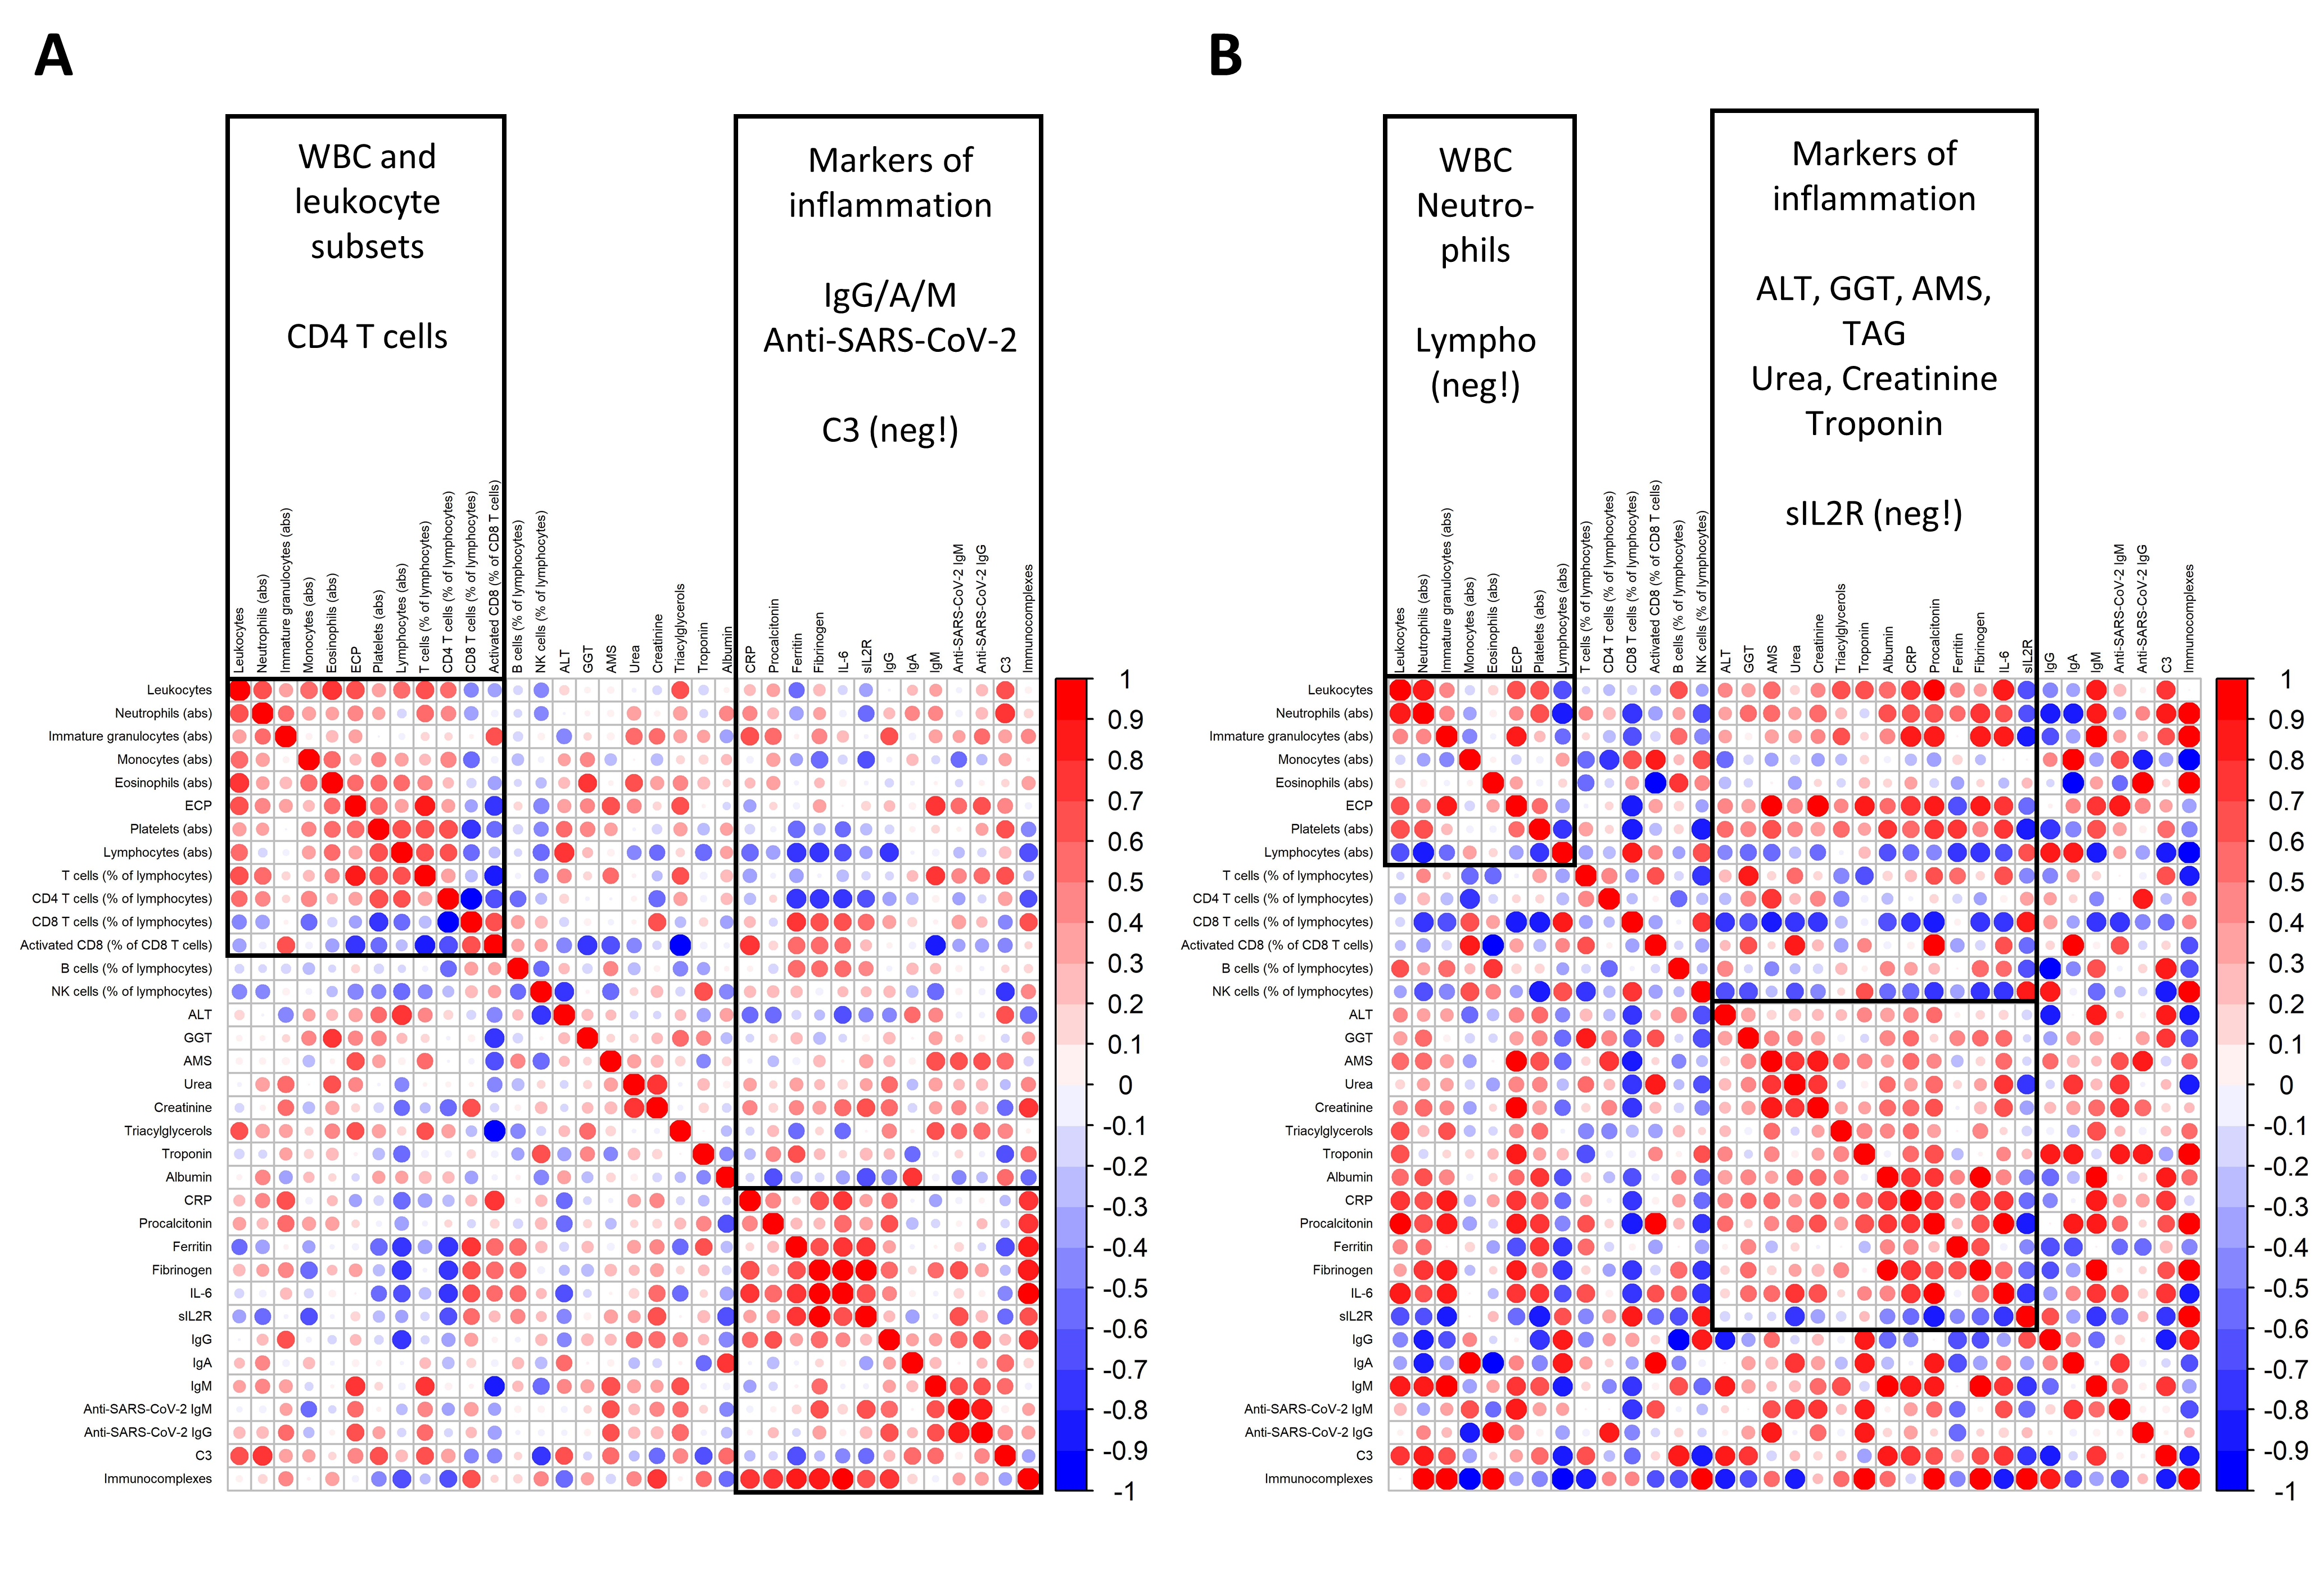
3.6. Discoordination of the Immune Response
4. Discussion
5. Conclusions
Supplementary Materials
Author Contributions
Funding
Acknowledgments
Conflicts of Interest
References
- World Health Organization Coronavirus Disease (COVID-19) Pandemic. Available online: https://www.who.int/emergencies/diseases/novel-coronavirus-2019 (accessed on 15 September 2020).
- ECDC COVID-19 Pandemic. Available online: https://www.ecdc.europa.eu/en/covid-19-pandemic (accessed on 15 September 2020).
- Huang, C.; Wang, Y.; Li, X.; Ren, L.; Zhao, J.; Hu, Y.; Zhang, L.; Fan, G.; Xu, J.; Gu, X.; et al. Clinical features of patients infected with 2019 novel coronavirus in Wuhan, China. Lancet 2020, 395, 497–506. [Google Scholar] [CrossRef] [Green Version]
- Zhou, F.; Yu, T.; Du, R.; Fan, G.; Liu, Y.; Liu, Z.; Xiang, J.; Wang, Y.; Song, B.; Gu, X.; et al. Clinical course and risk factors for mortality of adult inpatients with COVID-19 in Wuhan, China: A retrospective cohort study. Lancet 2020, 6736, 1–9. [Google Scholar] [CrossRef]
- Zhang, J.; Dong, X.; Cao, Y.; Yuan, Y.; Yang, Y.; Yan, Y.; Akdis, C.A.; Gao, Y. Clinical characteristics of 140 patients infected with SARS-CoV-2 in Wuhan, China. Allergy 2020, 75, 1730–1741 all.14238. [Google Scholar] [CrossRef] [PubMed]
- Yang, X.; Yu, Y.; Xu, J.; Shu, H.; Xia, J.; Liu, H.; Wu, Y.; Zhang, L.; Yu, Z.; Fang, M.; et al. Clinical course and outcomes of critically ill patients with SARS-CoV-2 pneumonia in Wuhan, China: A single-centered, retrospective, observational study. Lancet Respir. Med. 2020, 8, 475–481. [Google Scholar] [CrossRef] [Green Version]
- Chen, T.; Wu, D.; Chen, H.; Yan, W.; Yang, D.; Chen, G.; Ma, K.; Xu, D.; Yu, H.; Wang, H.; et al. Clinical characteristics of 113 deceased patients with coronavirus disease 2019: Retrospective study. BMJ 2020, 368, m1091. [Google Scholar] [CrossRef] [Green Version]
- Chen, Y.; Guo, Y.; Pan, Y.; Zhao, Z.J. Structure analysis of the receptor binding of 2019-nCoV. Biochem. Biophys. Res. Commun. 2020, 525, 135–140. [Google Scholar] [CrossRef]
- Letko, M.; Marzi, A.; Munster, V. Functional assessment of cell entry and receptor usage for SARS-CoV-2 and other lineage B betacoronaviruses. Nat. Microbiol. 2020, 5, 562–569. [Google Scholar] [CrossRef] [Green Version]
- Shang, J.; Wan, Y.; Luo, C.; Ye, G.; Geng, Q.; Auerbach, A.; Li, F. Cell entry mechanisms of SARS-CoV-2. Proc. Natl. Acad. Sci. USA 2020, 117, 11727–11734. [Google Scholar] [CrossRef]
- Chai, X.; Hu, L.; Zhang, Y.; Han, W.; Lu, Z.; Ke, A.; Zhou, J.; Shi, G.; Fang, N.; Fan, J.; et al. Specific ACE2 Expression in Cholangiocytes May Cause Liver Damage After 2019-nCoV Infection. bioRxiv 2020. [Google Scholar] [CrossRef] [Green Version]
- Varga, Z.; Flammer, A.J.; Steiger, P.; Haberecker, M.; Andermatt, R.; Zinkernagel, A.S.; Mehra, M.R.; Schuepbach, R.A.; Ruschitzka, F.; Moch, H. Endothelial cell infection and endotheliitis in COVID-19. Lancet 2020, 395, 1417–1418. [Google Scholar] [CrossRef]
- Xu, H.; Zhong, L.; Deng, J.; Peng, J.; Dan, H.; Zeng, X.; Li, T.; Chen, Q. High expression of ACE2 receptor of 2019-nCoV on the epithelial cells of oral mucosa. Int. J. Oral Sci. 2020, 12, 1–5. [Google Scholar] [CrossRef] [PubMed]
- Zou, X.; Chen, K.; Zou, J.; Han, P.; Hao, J.; Han, Z. Single-cell RNA-seq data analysis on the receptor ACE2 expression reveals the potential risk of different human organs vulnerable to 2019-nCoV infection. Front. Med. 2020, 14, 185–192. [Google Scholar] [CrossRef] [PubMed] [Green Version]
- Radzikowska, U.; Ding, M.; Tan, G.; Zhakparov, D.; Peng, Y.; Wawrzyniak, P.; Wang, M.; Li, S.; Morita, H.; Altunbulakli, C.; et al. Distribution of ACE2, CD147, CD26 and other SARS-CoV-2 associated molecules in tissues and immune cells in health and in asthma, COPD, obesity, hypertension, and COVID-19 risk factors. Allergy 2020. [Google Scholar] [CrossRef] [PubMed]
- Puelles, V.G.; Lütgehetmann, M.; Lindenmeyer, M.T.; Sperhake, J.P.; Wong, M.N.; Allweiss, L.; Chilla, S.; Heinemann, A.; Wanner, N.; Liu, S.; et al. Multiorgan and Renal Tropism of SARS-CoV-2. N. Engl. J. Med. 2020. [Google Scholar] [CrossRef]
- Ackermann, M.; Verleden, S.E.; Kuehnel, M.; Haverich, A.; Welte, T.; Laenger, F.; Vanstapel, A.; Werlein, C.; Stark, H.; Tzankov, A.; et al. Pulmonary Vascular Endothelialitis, Thrombosis, and Angiogenesis in Covid-19. N. Engl. J. Med. 2020, 383, 120–128. [Google Scholar] [CrossRef]
- Carsana, L.; Sonzogni, A.; Nasr, A.; Rossi, R.S.; Pellegrinelli, A.; Zerbi, P.; Rech, R.; Colombo, R.; Antinori, S.; Corbellino, M.; et al. Pulmonary post-mortem findings in a series of COVID-19 cases from northern Italy: A two-centre descriptive study. Lancet Infect. Dis. 2020. [Google Scholar] [CrossRef]
- Li, D.; Chen, Y.; Liu, H.; Jia, Y.; Li, F.; Wang, W.; Wu, J.; Wan, Z.; Cao, Y.; Zeng, R. Immune dysfunction leads to mortality and organ injury in patients with COVID-19 in China: Insights from ERS-COVID-19 study. Signal Transduct. Target. Ther. 2020, 5, 62. [Google Scholar] [CrossRef]
- Qin, C.; Zhou, L.; Hu, Z.; Zhang, S.; Yang, S.; Tao, Y.; Xie, C.; Ma, K.; Shang, K.; Wang, W.; et al. Dysregulation of immune response in patients with COVID-19 in Wuhan, China. Clin. Infect. Dis. 2020, 2019, 4–10. [Google Scholar] [CrossRef]
- Cao, X. COVID-19: Immunopathology and its implications for therapy. Nat. Rev. Immunol. 2020, 20, 269–270. [Google Scholar] [CrossRef] [Green Version]
- Gong, J.; Dong, H.; Xia, S.Q.; Huang, Y.Z.; Wang, D.; Zhao, Y.; Liu, W.; Tu, S.; Zhang, M.; Wang, Q.; et al. Correlation Analysis Between Disease Severity and Inflammation-related Parameters in Patients with COVID-19 Pneumonia. medRxiv 2020. [Google Scholar] [CrossRef] [Green Version]
- Zhang, B.; Zhou, X.; Zhu, C.; Feng, F.; Qiu, Y.; Feng, J.; Jia, Q.; Song, Q.; Zhu, B.; Wang, J. Immune phenotyping based on neutrophil-to-lymphocyte ratio and IgG predicts disease severity and outcome for patients with COVID-19. medRxiv 2020. [Google Scholar] [CrossRef] [PubMed]
- Tan, M.; Liu, Y.; Zhou, R.; Deng, X.; Li, F.; Liang, K.; Shi, Y. Immunopathological characteristics of coronavirus disease 2019 cases in Guangzhou, China. Immunology 2020. [Google Scholar] [CrossRef] [PubMed]
- Xu, Z.; Shi, L.; Wang, Y.; Zhang, J.; Huang, L.; Zhang, C.; Liu, S.; Zhao, P.; Liu, H.; Zhu, L.; et al. Pathological findings of COVID-19 associated with acute respiratory distress syndrome. Lancet Respir. Med. 2020, 8, 420–422. [Google Scholar] [CrossRef]
- Zheng, H.Y.; Zhang, M.; Yang, C.X.; Zhang, N.; Wang, X.C.; Yang, X.P.; Dong, X.Q.; Zheng, Y.T. Elevated exhaustion levels and reduced functional diversity of T cells in peripheral blood may predict severe progression in COVID-19 patients. Cell. Mol. Immunol. 2020. [CrossRef]
- Zheng, M.; Gao, Y.; Wang, G.; Song, G.; Liu, S.; Sun, D.; Xu, Y.; Tian, Z. Functional exhaustion of antiviral lymphocytes in COVID-19 patients. Cell. Mol. Immunol. 2020, 7–9. [Google Scholar] [CrossRef] [Green Version]
- Jain, V.; Yuan, J.-M. Predictive symptoms and comorbidities for severe COVID-19 and intensive care unit admission: A systematic review and meta-analysis. Int. J. Public Health 2020. [Google Scholar] [CrossRef]
- Li, X.; Xu, S.; Yu, M.; Wang, K.; Tao, Y.; Zhou, Y.; Shi, J.; Zhou, M.; Wu, B.; Yang, Z.; et al. Risk factors for severity and mortality in adult COVID-19 inpatients in Wuhan. J. Allergy Clin. Immunol. 2020. [Google Scholar] [CrossRef]
- Skevaki, C.; Fragkou, P.C.; Cheng, C.; Xie, M.; Renz, H. Laboratory characteristics of patients infected with the novel SARS-CoV-2 virus. J. Infect. 2020. [CrossRef]
- Wu, C.; Chen, X.; Cai, Y.; Xia, J.; Zhou, X.; Xu, S.; Huang, H.; Zhang, L.; Zhou, X.; Du, C.; et al. Risk Factors Associated with Acute Respiratory Distress Syndrome and Death in Patients with Coronavirus Disease 2019 Pneumonia in Wuhan, China. JAMA Intern. Med. 2020, 180, 934–943. [Google Scholar] [CrossRef] [Green Version]
- Wang, D.; Hu, B.; Hu, C.; Zhu, F.; Liu, X.; Zhang, J.; Wang, B.; Xiang, H.; Cheng, Z.; Xiong, Y.; et al. Clinical Characteristics of 138 Hospitalized Patients With 2019 Novel Coronavirus–Infected Pneumonia in Wuhan, China. JAMA 2020, 323, 1061. [Google Scholar] [CrossRef]
- Roederer, M.; Nozzi, J.L.; Nason, M.C. SPICE: Exploration and analysis of post-cytometric complex multivariate datasets. Cytom. Part A 2011, 79, 167–174. [Google Scholar] [CrossRef] [PubMed] [Green Version]
- Zhang, Y.; Zheng, L.; Liu, L.; Zhao, M.; Xiao, J.; Zhao, Q. Liver impairment in COVID‐19 patients: A retrospective analysis of 115 cases from a single centre in Wuhan city, China. Liver Int. 2020. [Google Scholar] [CrossRef] [PubMed] [Green Version]
- Thi Hong Nguyen, C.; Kambe, N.; Kishimoto, I.; Ueda-Hayakawa, I.; Okamoto, H. Serum soluble interleukin-2 receptor level is more sensitive than angiotensin-converting enzyme or lysozyme for diagnosis of sarcoidosis and may be a marker of multiple organ involvement. J. Dermatol. 2017, 44, 789–797. [Google Scholar] [CrossRef] [PubMed] [Green Version]
- Klok, F.A.; Kruip, M.J.H.A.; van der Meer, N.J.M.; Arbous, M.S.; Gommers, D.A.M.P.J.; Kant, K.M.; Kaptein, F.H.J.; van Paassen, J.; Stals, M.A.M.; Huisman, M.V.; et al. Incidence of thrombotic complications in critically ill ICU patients with COVID-19. Thromb. Res. 2020, 191, 145–147. [Google Scholar] [CrossRef]
- Wilk, A.J.; Rustagi, A.; Zhao, N.Q.; Roque, J.; Martínez-Colón, G.J.; McKechnie, J.L.; Ivison, G.T.; Ranganath, T.; Vergara, R.; Hollis, T.; et al. A single-cell atlas of the peripheral immune response in patients with severe COVID-19. Nat. Med. 2020, 26, 1070–1076. [Google Scholar] [CrossRef]
- Moratto, D.; Chiarini, M.; Giustini, V.; Serana, F.; Magro, P.; Roccaro, A.M.; Imberti, L.; Castelli, F.; Notarangelo, L.D.; Quiros-Roldan, E. Flow Cytometry Identifies Risk Factors and Dynamic Changes in Patients with COVID-19. J. Clin. Immunol. 2020. [Google Scholar] [CrossRef]
- Pan, X.; Baldauf, H.M.; Keppler, O.T.; Fackler, O.T. Restrictions to HIV-1 replication in resting CD4 + T lymphocytes. Cell Res. 2013, 23, 876–885. [Google Scholar] [CrossRef] [Green Version]
- Zhang, Y.; Wang, X.; Li, X.; Xi, D.; Mao, R.; Wu, X.; Cheng, S.; Sun, X.; Yi, C.; Ling, Z.; et al. Potential contribution of increased soluble IL-2R to lymphopenia in COVID-19 patients. Cell. Mol. Immunol. 2020, 17, 878–880. [Google Scholar] [CrossRef]
- Zhang, C.; Shi, L.; Wang, F.S. Liver injury in COVID-19: Management and challenges. Lancet Gastroenterol. Hepatol. 2020, 5, 428–430. [Google Scholar] [CrossRef]
- Bangash, M.N.; Patel, J.; Parekh, D. COVID-19 and the liver: Little cause for concern. Lancet Gastroenterol. Hepatol. 2020, 5, 529–530. [Google Scholar] [CrossRef] [Green Version]
- Cai, Q.; Huang, D.; Yu, H.; Zhu, Z.; Xia, Z.; Su, Y.; Li, Z.; Zhou, G.; Gou, J.; Qu, J.; et al. COVID-19: Abnormal liver function tests. J. Hepatol. 2020. [Google Scholar] [CrossRef] [PubMed]
- Yang, L.; Han, Y.; Nilsson-Payant, B.E.; Gupta, V.; Wang, P.; Duan, X.; Tang, X.; Zhu, J.; Zhao, Z.; Jaffré, F.; et al. A Human Pluripotent Stem Cell-based Platform to Study SARS-CoV-2 Tropism and Model Virus Infection in Human Cells and Organoids. Cell Stem Cell 2020, S1934–S5909, 30282–30284. [Google Scholar] [CrossRef] [PubMed]
- Cheng, Y.; Luo, R.; Wang, K.; Zhang, M.; Wang, Z.; Dong, L.; Li, J.; Yao, Y.; Ge, S.; Xu, G. Kidney disease is associated with in-hospital death of patients with COVID-19. Kidney Int. 2020, 97, 829–838. [Google Scholar] [CrossRef] [PubMed]
- Su, H.; Yang, M.; Wan, C.; Yi, L.X.; Tang, F.; Zhu, H.Y.; Yi, F.; Yang, H.C.; Fogo, A.B.; Nie, X.; et al. Renal histopathological analysis of 26 postmortem findings of patients with COVID-19 in China. Kidney Int. 2020, 98, 219–227. [Google Scholar] [CrossRef]


| Cohort | n (%) (Sex) 1 | Age (Years) 2 | Pneumonia on X-ray | Oxygen Therapy | Mechanical Ventilation | Dialysis | Hydroxychloroquin | Azithromycin | Other Therapy |
|---|---|---|---|---|---|---|---|---|---|
| All patients | 37 (100%) (17 F, 20 M) | 0.2–96.7 (60.6 ± 27.6) | 24 (65%) | 21 (57%) | 10 (27%) | 6 (16%) | 15 (43%) | 11 (30%) | - |
| Mild | 10 (27%) (6 F, 4 M) | 0.2–80.0 (29.8 ± 22.6) | 0 (0%) | 1 (10%) | 0 (0%) | 1 (10%) | 0 (0%) | 0 (0%) | - |
| Moderate | 13 (35%) (6 F, 7 M) | 44.4–96.7 (76.8 ± 13.6) | 13 (100%) | 11 (85%) | 0 (0%) | 1 (8%) | 7 (54%) | 4 (31%) | 1 steroid |
| Severe | 7 (19%) (3 F, 4 M) | 8.5–73.6 (52.0 ± 19.0) | 6 (86%) | 3 (43%) | 7 (100%) | 2 (28%) | 6 (85%) | 4 (57%) | 3 steroids 2 tocilizumab 1 remdesivir 1 cytosorb |
| Fatal | 7 (19%) (2 F, 5 M) | 56.7–94.8 (83.4 ± 12.5) | 5 (71%) | 6 (85%) | 3 (43%) | 2 (28%) | 2 (28%) | 3 (43%) | 2 steroids |
© 2020 by the authors. Licensee MDPI, Basel, Switzerland. This article is an open access article distributed under the terms and conditions of the Creative Commons Attribution (CC BY) license (http://creativecommons.org/licenses/by/4.0/).
Share and Cite
Klocperk, A.; Bloomfield, M.; Parackova, Z.; Zentsova, I.; Vrabcova, P.; Balko, J.; Meseznikov, G.; Casas Mendez, L.F.; Grandcourtova, A.; Sipek, J.; et al. Complex Immunometabolic Profiling Reveals the Activation of Cellular Immunity and Biliary Lesions in Patients with Severe COVID-19. J. Clin. Med. 2020, 9, 3000. https://0-doi-org.brum.beds.ac.uk/10.3390/jcm9093000
Klocperk A, Bloomfield M, Parackova Z, Zentsova I, Vrabcova P, Balko J, Meseznikov G, Casas Mendez LF, Grandcourtova A, Sipek J, et al. Complex Immunometabolic Profiling Reveals the Activation of Cellular Immunity and Biliary Lesions in Patients with Severe COVID-19. Journal of Clinical Medicine. 2020; 9(9):3000. https://0-doi-org.brum.beds.ac.uk/10.3390/jcm9093000
Chicago/Turabian StyleKlocperk, Adam, Marketa Bloomfield, Zuzana Parackova, Irena Zentsova, Petra Vrabcova, Jan Balko, Grigorij Meseznikov, Luis Fernando Casas Mendez, Alzbeta Grandcourtova, Jan Sipek, and et al. 2020. "Complex Immunometabolic Profiling Reveals the Activation of Cellular Immunity and Biliary Lesions in Patients with Severe COVID-19" Journal of Clinical Medicine 9, no. 9: 3000. https://0-doi-org.brum.beds.ac.uk/10.3390/jcm9093000