1. Introduction
Engineering plastics have become an important component of modern industry as a construction material, due to their good mechanical properties at low weight. Under Noise-Vibration-Harshness (NVH) aspects, plastics show a reduced structure-borne sound transmission and sound radiation behavior compared to metallic components due to their viscoelastic damping properties [
1]. The challenge is to describe the microstructural mechanics of the short glass fiber-reinforced plastics in a suitable material model for a reliable prediction of the structural dynamics behavior.
For the description of the microstructural mechanics of short fiber-reinforced plastics, different approaches were pursued, which are mainly based on the investigations of Eshelby [
2]. Assuming that the fibers have an ellipsoidal shape, the local stress and strain fields of the individual phases in the composite were calculated with a localization equation. This describes the mean-field theory according to the Mori-Tanaka model [
3] and builds the basis for extended models like Hill’s self-consistent model [
4], Benveniste´s reformulation of the Mori-Tanaka model [
5] or the second-moment mean-field homogenization model of Dogri et al. [
6].
A look at the microstructure of fiber-reinforced plastics shows that a high crystalline interphase is formed between the fibers and the matrix [
7]. In this context, three-phase models such as the Reconsidered-Double-Inclusion (RDI) model [
7] were developed to characterize the material properties more precisely. An overview of currently available material models is given in [
8,
9].
For the prediction of the structural dynamics of plastic components, established simulation methods generate anisotropic, linear-elastic material models [
1]. In this context, the integrative simulation method as a coupling between process and structure simulation has become an essential tool for the efficient design of short fiber-reinforced plastic components [
10]. Here, the fiber orientation tensors were coupled to the mesh of the components to demonstrate the anisotropic material properties. This condition allows an adequate description of the anisotropic stiffness of short fiber-reinforced plastics in the elastic range.
For the description of the damping of plastics, reduced damping models such as Rayleigh or modal damping are still used today [
1,
11]. The main disadvantage is that the damping constants are usually iteratively optimized using a reverse engineering approach based on experimental data. Furthermore, the stiffness and damping of short fiber-reinforced plastics varies depending on the excitation frequency, temperature and humidity [
12]. This effect is also neglected when defining a static material model for the stiffness and damping.
Under the usage of Prony-series it is possible to model the frequency-dependent viscoelastic material behavior of the plastics more accurate. Thereby, a linear interpolation of the material properties between a defined number of interpolation points is performed and weighted by a sum function. Park and Schapery [
13] as well as Breuer et al. [
14] have demonstrated a successfully application of Prony-series formation for the description of the frequency-dependent stiffness of fiber-reinforced plastics.
In this work, a novel anisotropic viscoelastic material model based on the RDI model and Prony-series formation is proposed, to describe the frequency-, temperature- and humidity-dependent stiffness and damping of short glass fiber-reinforced thermoplastics.
2. Methodology and Approach
In order to achieve the aim of this work, the first step is to define the material model. Therefore, the existing RDI model has been extended to the Arbitrary-Reconsidered-Double-Inclusion (ARDI) model, by using the complex modulus to consider the damping behavior. Afterwards, the orientation distribution function (ODF) has been reconstructed according to the maximum entropy method (MEM) [
15] for a number of orientation tensors. This method allows the creation of a discrete ARDI material database.
In the next step, the execution and evaluation process of the experiments have been defined. For the execution of the bending vibration tests, a system for the uniaxial vibration excitation of test specimens [
16] has been used. The positioning of this system in a climatic chamber allows the execution of the bending vibration tests under defined temperature and humidity conditions.
The evaluation of the bending vibration tests was carried out with the resonance-curve method [
17] and the 3 dB method [
18]. In this context, the evaluation of the bending vibration tests of pure thermoplastic material specimens provides the storage and loss modulus for the calibration of the ARDI model. The evaluation of the bending vibration tests of the glass fiber-reinforced thermoplastics provides the structural dynamics behavior in the form of an accelerance frequency response function (FRF) for a comparison to the simulation.
The present work focuses on the thermoplastics PA66 (polyamide 6.6) and PPA (polyphthalamide) as pure matrix materials and in the reinforced state with 30 (GF30) and 50 (GF50) weight percent glass fibers.
The bending vibration tests of the plastics were performed under conditioning of 23 °C with 0% relative humidity (rh), 130 °C with 0% rh and 23 °C with 50% rh. The selected temperatures and humidities were derived from the temperatures and humidities where the plastics of this work are typically used (23 °C, 0% rh) but also where the selected plastics can still be used in a technically useful way (maximum humidity 50% rh, maximum temperature 130 °C).
The micro-computed topography (µ-CT) measurements of the glass fiber-reinforced materials allow the determination of the experimental fiber orientation tensors. The µ-CT specimens have been prepared from the center of the plate material from the same batch as the bending specimens. Based on these µ-CT results, it is possible to adjust the setup of the filling simulation to improve the quality for predicting the fiber orientation. Based on the calculated velocity field of the flow, the Folgar-Tucker model has been used to determine the fiber orientation tensor [
19].
In the next step, a nearest neighbor mapping process has been used to couple the calculated fiber orientation tensors from the computational fluid dynamic (CFD) mesh of the filling simulation to the finite-element (FE) model mesh. Then, the material properties from the ARDI material database have been assigned for each element of the component according to the smallest error deviation of the Euclidean standard of the orientation tensors.
In the last step the calculation of the structural dynamics for each continuum element under update of the stiffness and damping tensor has been performed. For this, a linear-viscoelastic material law based on a Prony-series formulation via subroutine (UMAT) has been used [
14].
The comparison of the results of the existing RDI to the ARDI model allows the assessment of the significant extension to the state of the art. For this purpose, the existing RDI model has been combined with a global modal damping (GMD) behavior approach. The GMD behavior has been modeled as ratio between stiffness and damping tensor and thus corresponds to the dissipation factor.
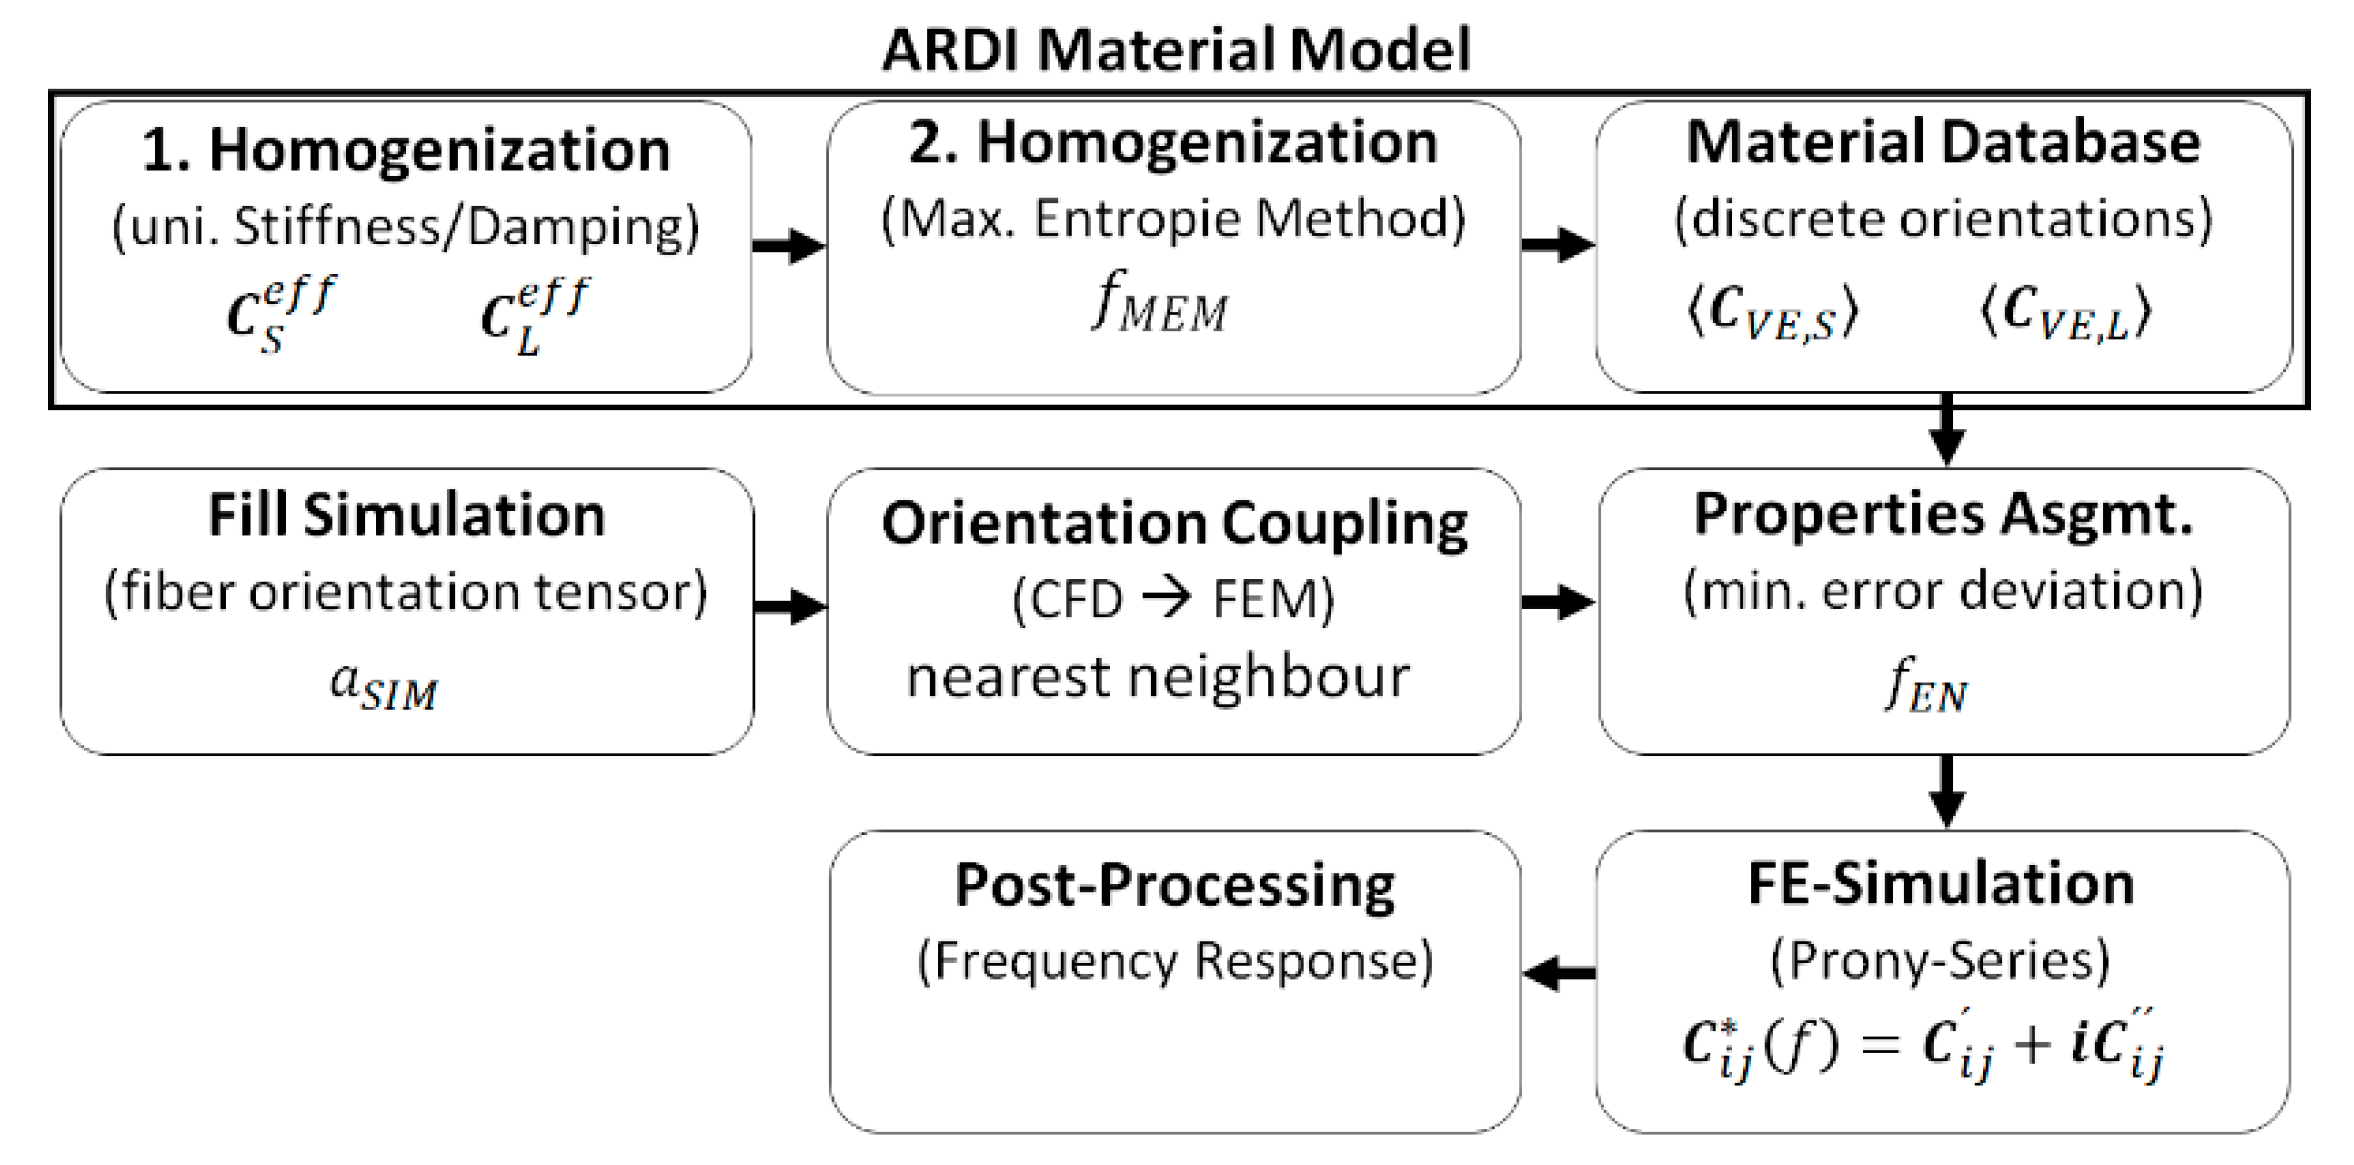
The calculation of the FRF of the bending specimens allows a comparison to the experiments and an assessment of the quality of the developed ARDI model for the selected temperatures and humidities. Thus, it is possible to assess whether the ARDI model is able to simulate a wide range of humidity and temperature conditions under the usage of the defined calibration method. The concept of this work is shown in
Figure 1.
3. Arbitrary-Reconsidered-Double-Inclusion (ARDI) Material Model
This section presents the equations of the ARDI model and corresponding, the implementation of the model in a simulation routine. The ARDI model consists of four significant steps: the first and second homogenization step, the generation of a material database and the property assignment.
3.1. First Homogenization Step
The ARDI model is based on the RDI model according to literature [
7]. The RDI model is a two-step homogenization method to characterize three-phase composite structures with respect to a unidirectional, transversal-isotropic effective composite stiffness. In semi-crystalline thermoplastics, the three phases are the fibers, the matrix and a highly crystalline interphase between matrix and fiber. The effective stiffness tensor has been calculated by Equation (1):
with
and
Here,
represents a fourth rank stiffness tensor,
the fiber volume fraction and
a strain concentration tensor. The index
stands for the matrix,
for the inclusion (e.g., glass fibers) and
for the coating or interphase. A detailed derivation of Equation (1) is given in [
7]. Assuming that the main damping contribution in the composite is introduced by the matrix [
20], Equation (1) has been modified to Equation (4):
Here, the fibers and interphases have a negligible damping behavior. Therefore, the determined total damping tensor of the matrix material is reduced by the volume fraction of the fibers and the interphases. Furthermore, represents a fourth rank damping tensor.
The tensors
,
and
have been assumed as transversal-isotropic stiffness
or damping
matrices and have been determined by the inverse of the matrix
according to Equation (5):
with
as unidirectional module and
as Poisson´s ratio of the respective phase
and depending on whether the storage or loss module
have been used. The values of
correspond to experimental determined storage
or loss module
.
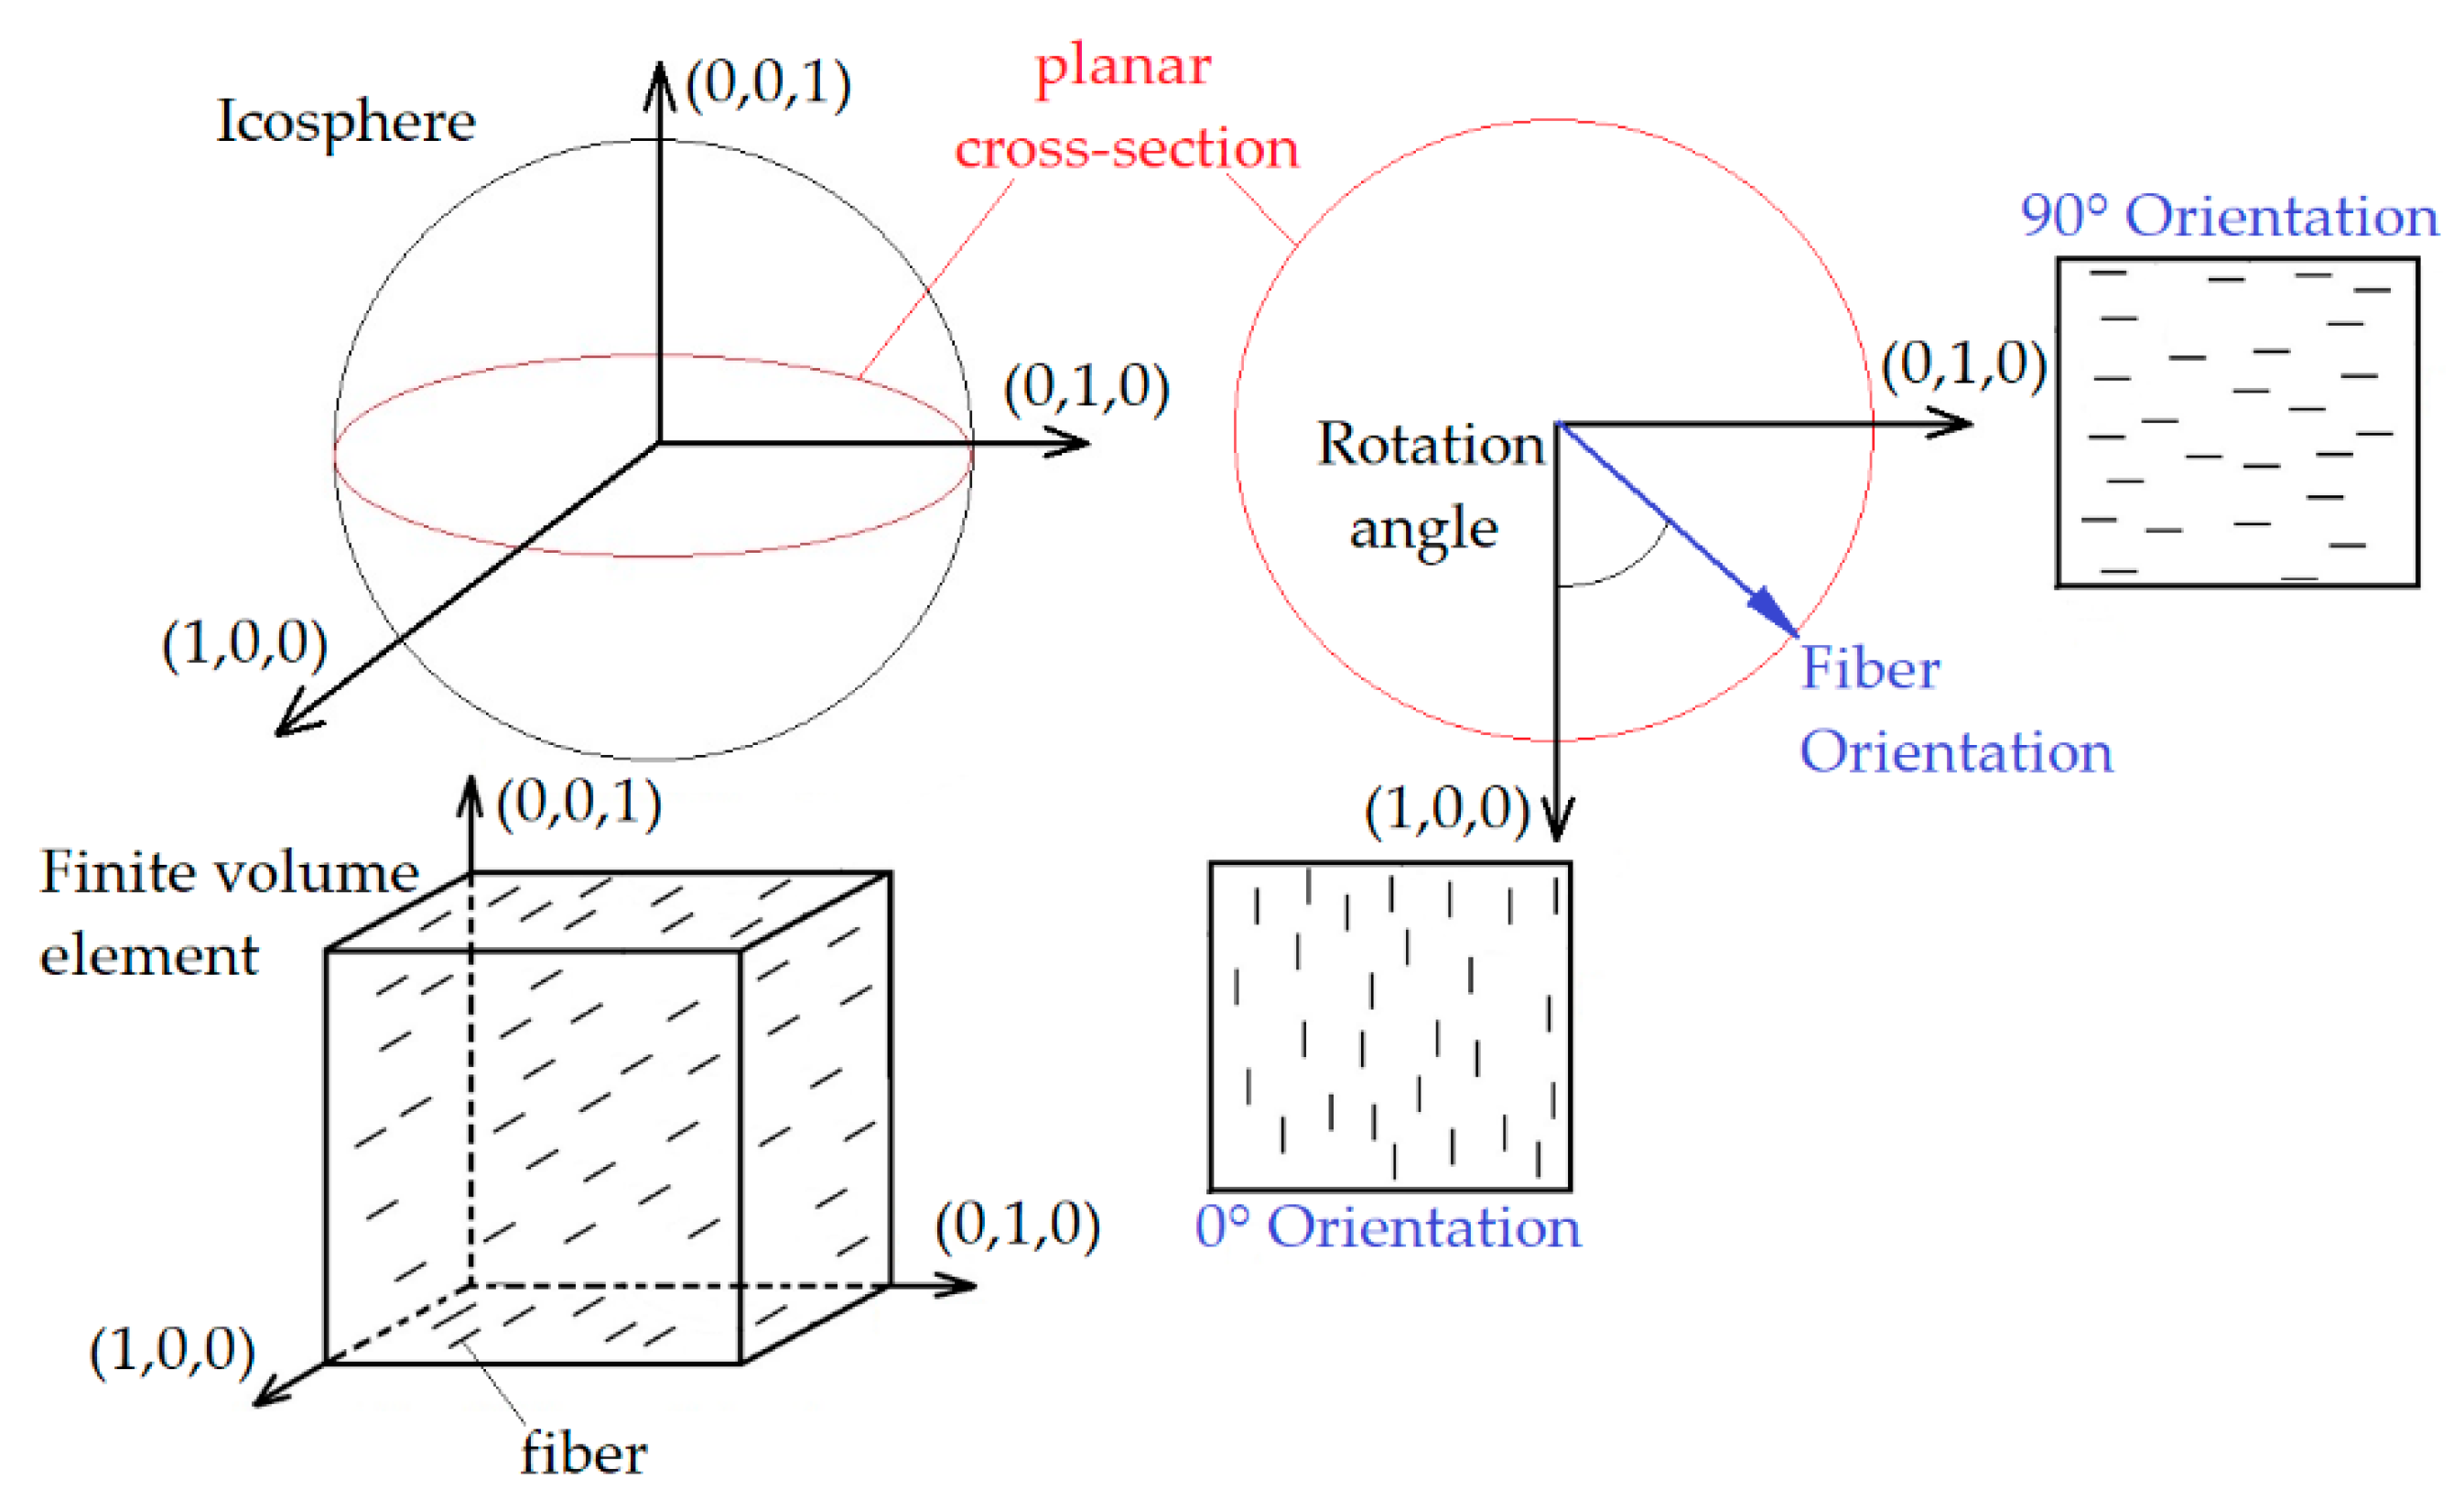
In the next step, the effective tensors have been rotated in discrete directions. For this, the spatial construction of an icosphere has been used. A detailed description can be found in [
15]. In the next step, the effective tensors are rotated into a discrete number of directions of the icosphere, according to Equation (6):
The rotation matrix
is defined by:
with
and
. Furthermore:
corresponds to an orthogonal transformation matrix from the basis vectors
and
, whereby:
and
with
as unit tensor. A detailed derivation of the rotation matrix
can be found in [
21,
22].
3.2. Second Homogenization Step
In the second homogenization step, the ODF is reconstructed for a discrete number of eigenvalue combinations according to the MEM. As result, it is possible to calculate the effective composite stiffness and damping over a sum function for all of these discrete eigenvalue combinations.
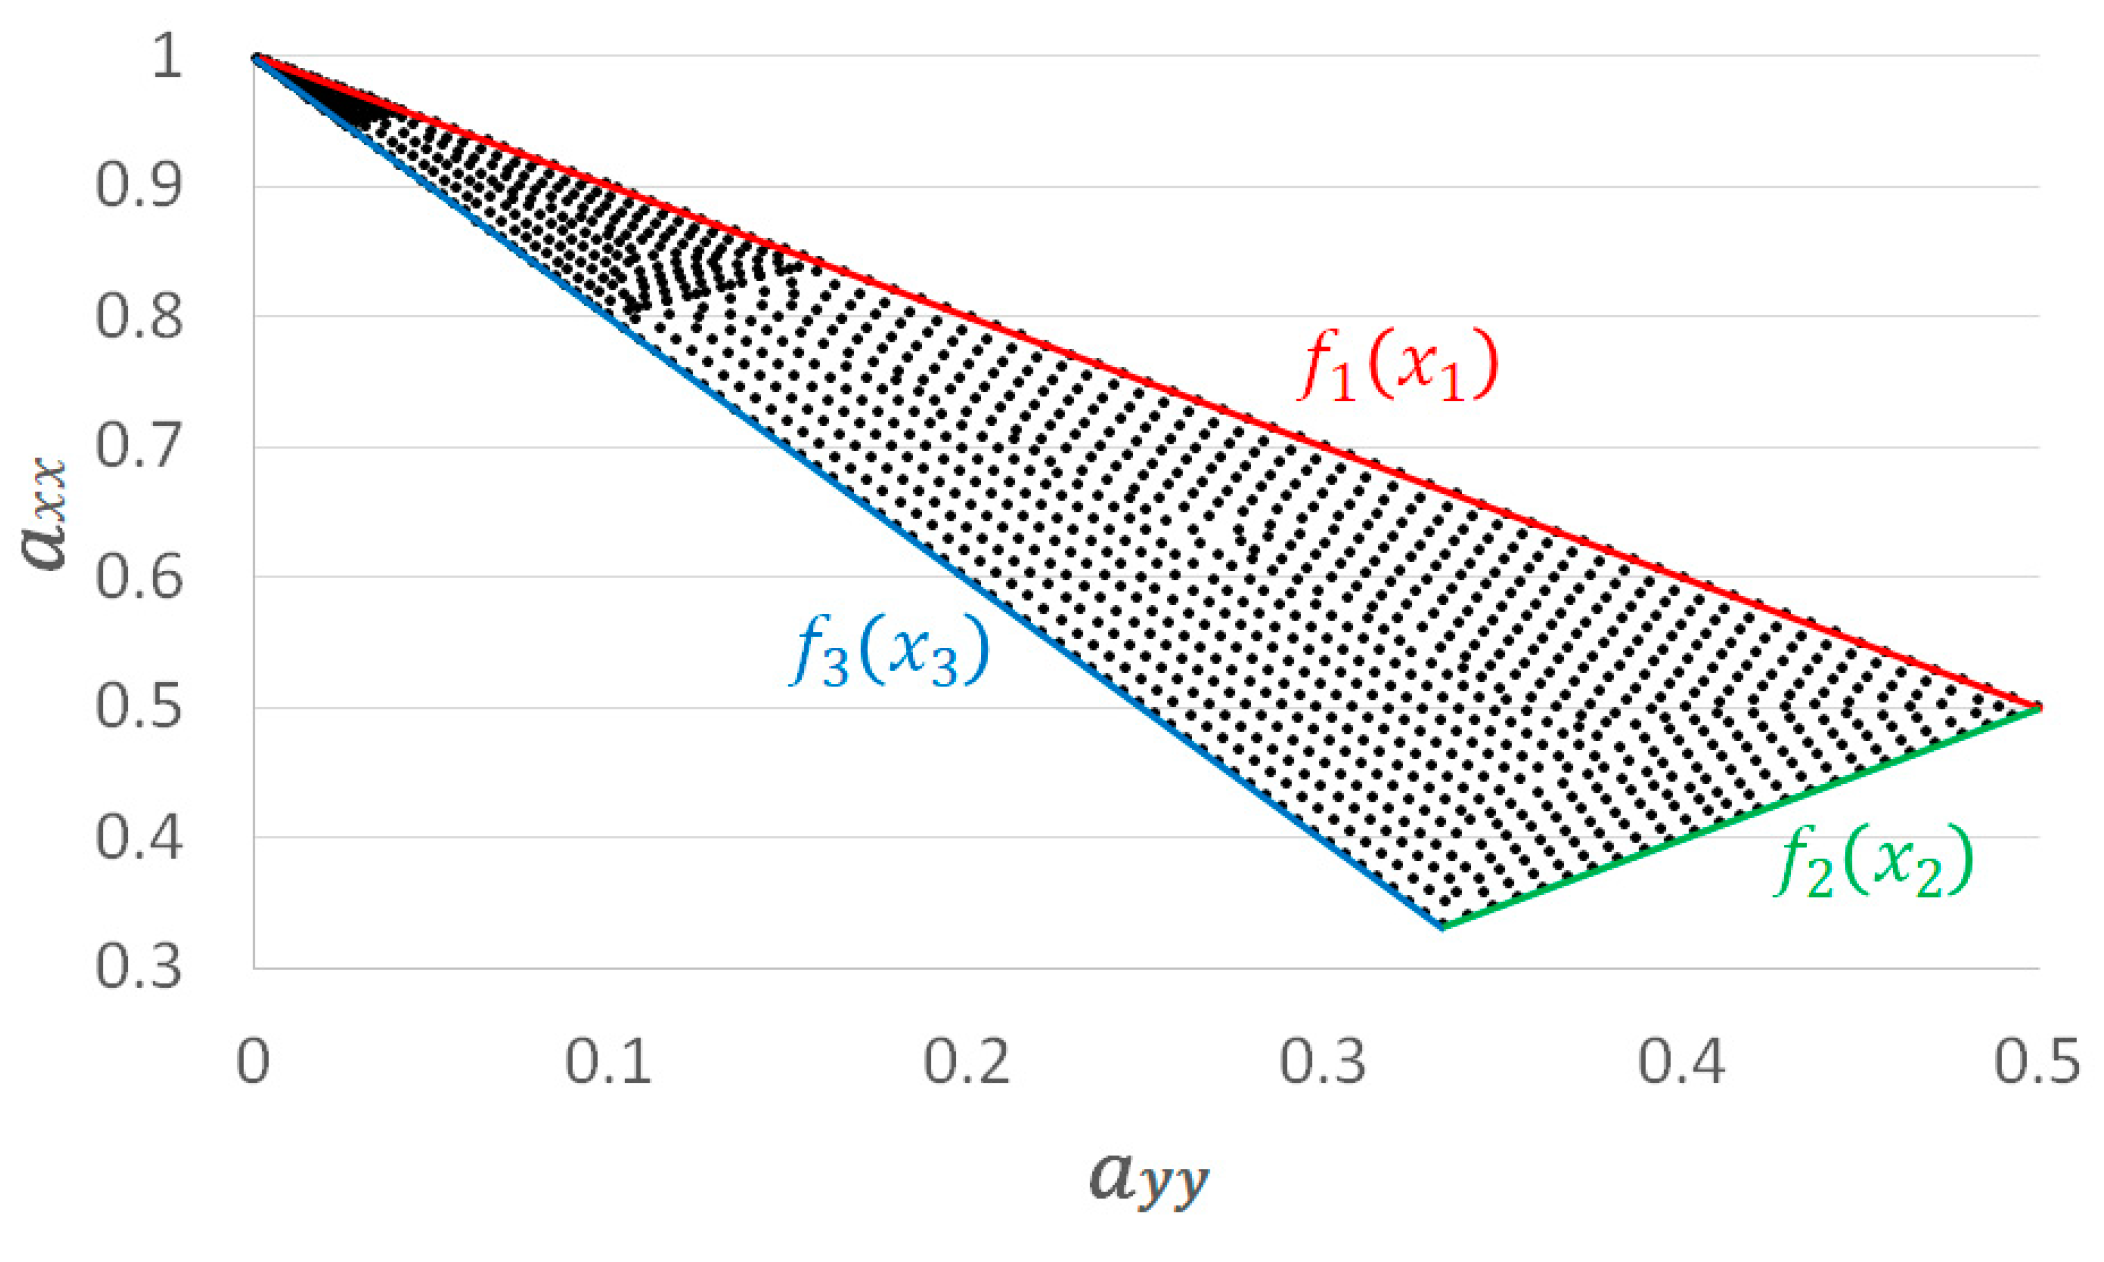
First, a discrete number of eigenvalue combinations has been generated. The eigenvalues represent the reduced second order orientation tensor and can accept values between the following equations:
with
,
and
. The intersection points of these equations represent a two-dimensional triangle. A meshing of the inner area of this triangle has been implemented on basis of a Delaunay method [
23]. As a result, the coordinates of the mesh nodes correspond to a discrete number of two dimensional eigenvalue combinations. With regard to the following two boundary conditions:
the complete second order orientation tensor:
can be derived for all of these mesh nodes.
Figure 2 shows the meshed two-dimensional triangle with the corresponding eigenvalue combinations.
Next, the MEM is applied to reconstruct the ODF for the discrete number of eigenvalue combinations of the previous step. This leads to a discrete number of ODFs. The MEM uses the entropy to assess the coherence to an existing information content. In case of ODF reconstruction, the entropy represents the deviation of the calculated probability. The MEM has been used due to the following advantage: The method is based on a physical approach without the necessary of a closure formulation and can reconstruct a large area of fiber orientation distribution, with respectively small error deviations compared to other reconstruction methods [
15].
A Bingham distribution function has been used for reconstructing the ODF. This implementation corresponds to a normal distribution on the unit sphere. The general bivariate MEM has been reformulated to a minimization problem. Thereby the deviation (entropy) between a calculated and a given second order fiber orientation tensor is minimized. The minimization problem can be defined with the MEM as:
whereby:
and
correspond to the surface points of the icosphere.
,
and
correspond to the entries of the major axis of a given second order fiber orientation tensor of the previous step.
is the probability which the fibers in a volume element point in discrete direction
. A detailed derivation of the corresponding equations of the MEM is given in [
15].
3.3. Material Database
For the determination of the representative composite stiffness, the orientation averaging approach after Advani and Tucker [
24] has been used. Thereby, the individual stiffness in discrete directions multiplied by the corresponding value of a given ODF results in the effective composite stiffness, according to:
and transferred to the composite damping applies:
This approach of a sum function for describing the effective composite stiffness has already been successfully used in existing studies [
7,
25,
26,
27,
28]. The approach of a sum function to describe the effective damping of a composite material represents a new methodology. On the use of a discrete numbers of ODFs, it is possible to create a material database consisting of a defined number of composite stiffness 〈
〉 and damping tensors 〈
〉.
In the next step, an assignment of the properties from the material database to the volume elements of the components to be calculated has been performed. It is based on the principle of the smallest error deviation of the Euclidean standard between the fiber orientation tensor of the elements of the components and the stored orientation tensors of the database. Here:
has been minimized, where:
corresponds to the orientation tensors of the volume elements of the component and:
corresponds to an orientation tensor of the material database.
3.4. User-Defined Material Subroutine
In the present work, the frequency-dependent, linear-viscoelastic material behavior of the plastics has been calculated using a Prony-series into a user subroutine (UMAT) in the FE software Abaqus version 2017. Thereby, the frequency dependent stiffness tensor
has been determined by a Prony-series:
corresponds to the stiffness tensor at start frequency
and is determined by inserting the experimental determined
in Formula (5) and inversion. The Prony-series elements of the stiffness matrix result from the evaluation of
at the selected support point
. For the Prony support points result:
where
is the total number of selected interpolation support points. The Prony support point
has been inserted in Equation (5) and inverted to the Prony stiffness tensor
. Following, the stress of a volume element with viscoelastic material behavior can be defined as:
whereby
is determined as Prony strain. A detailed description of the used Prony series formulation can be found in [
14].
In the present work, an extended approach is followed to consider the frequency-dependent damping behavior. The frequency-dependent stiffness defined in Equation (30) has been extended by the damping tensor to:
where
corresponds to the frequency-dependent damping tensor and
to the complex number. Thus:
can be treated as a complex module. The frequency-dependent damping tensor
is also determined by a Prony-series with
corresponds to the damping tensor at start frequency and corresponds to the Prony damping part, which are formulated with , analogous to the procedure described above.
4. Bending Vibration Tests
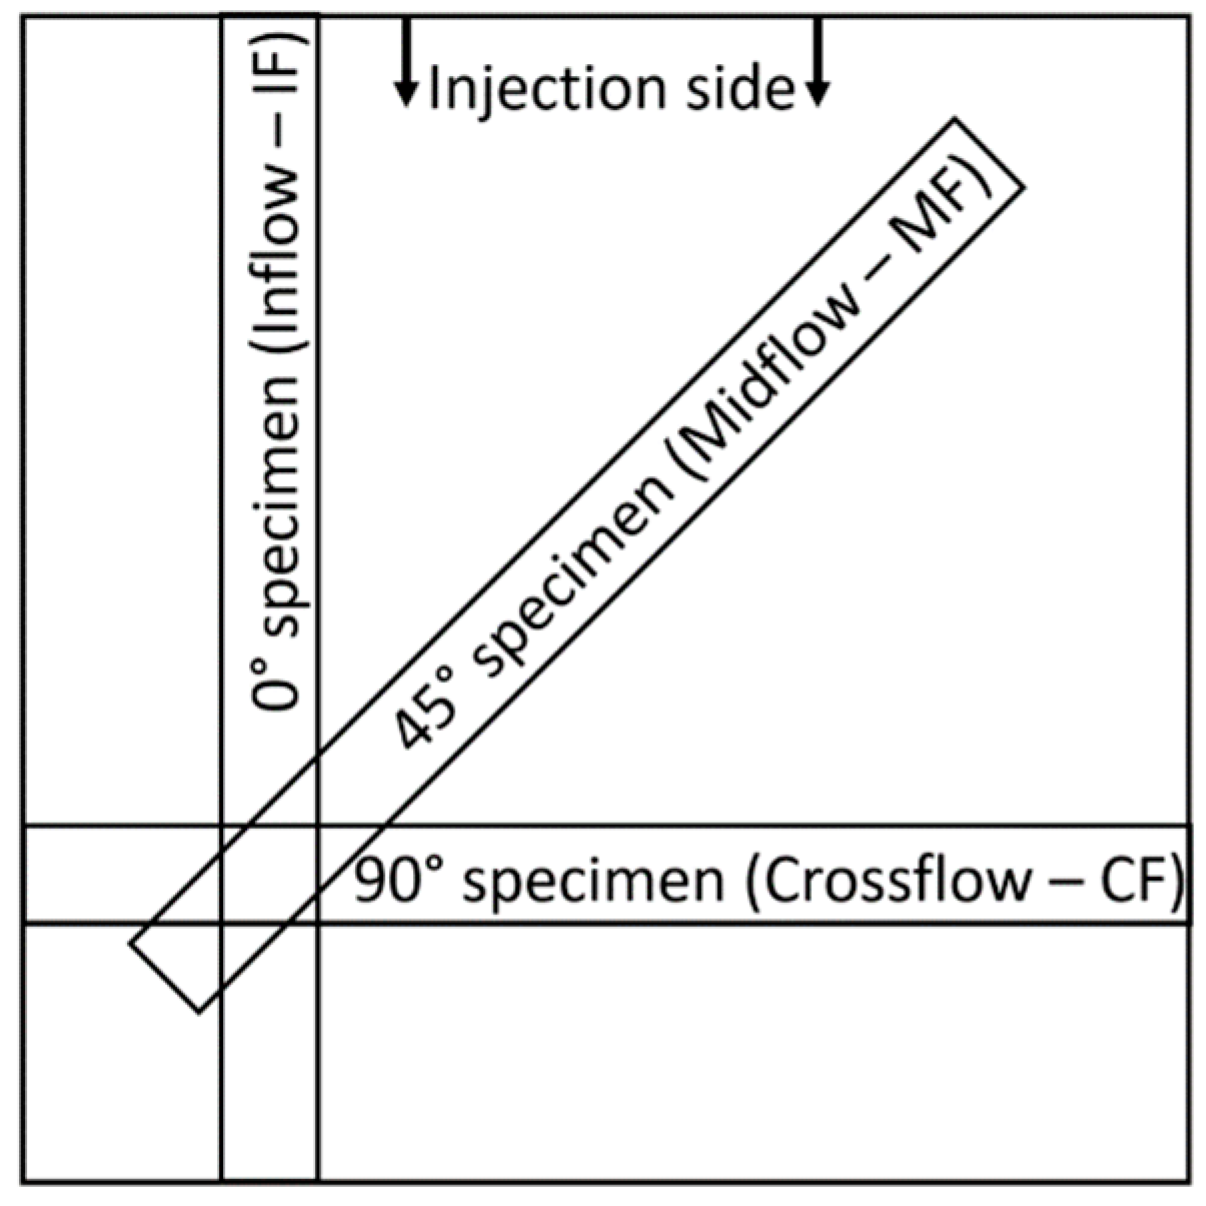
The determination of the dynamic material properties of the glass fiber-reinforced plastics has been carried out on bending specimens with the dimension 180 × 15 × 2 mm which have been prepared from an injection molded plate material at 0° (Inflow - IF), 45° (Midflow - MF) and 90° (Crossflow - CF) to the flow direction, according to
Figure 3. The injection molded plate material dimension is 180 × 180 × 2 mm. With regard to
Figure 3, the bending specimens of the pure matrix plate material have been prepared as 0° oriented respected to the injection flow direction. Preliminary investigations show that the dynamic material properties of the pure matrix material do not differ with variation of the direction of orientation.
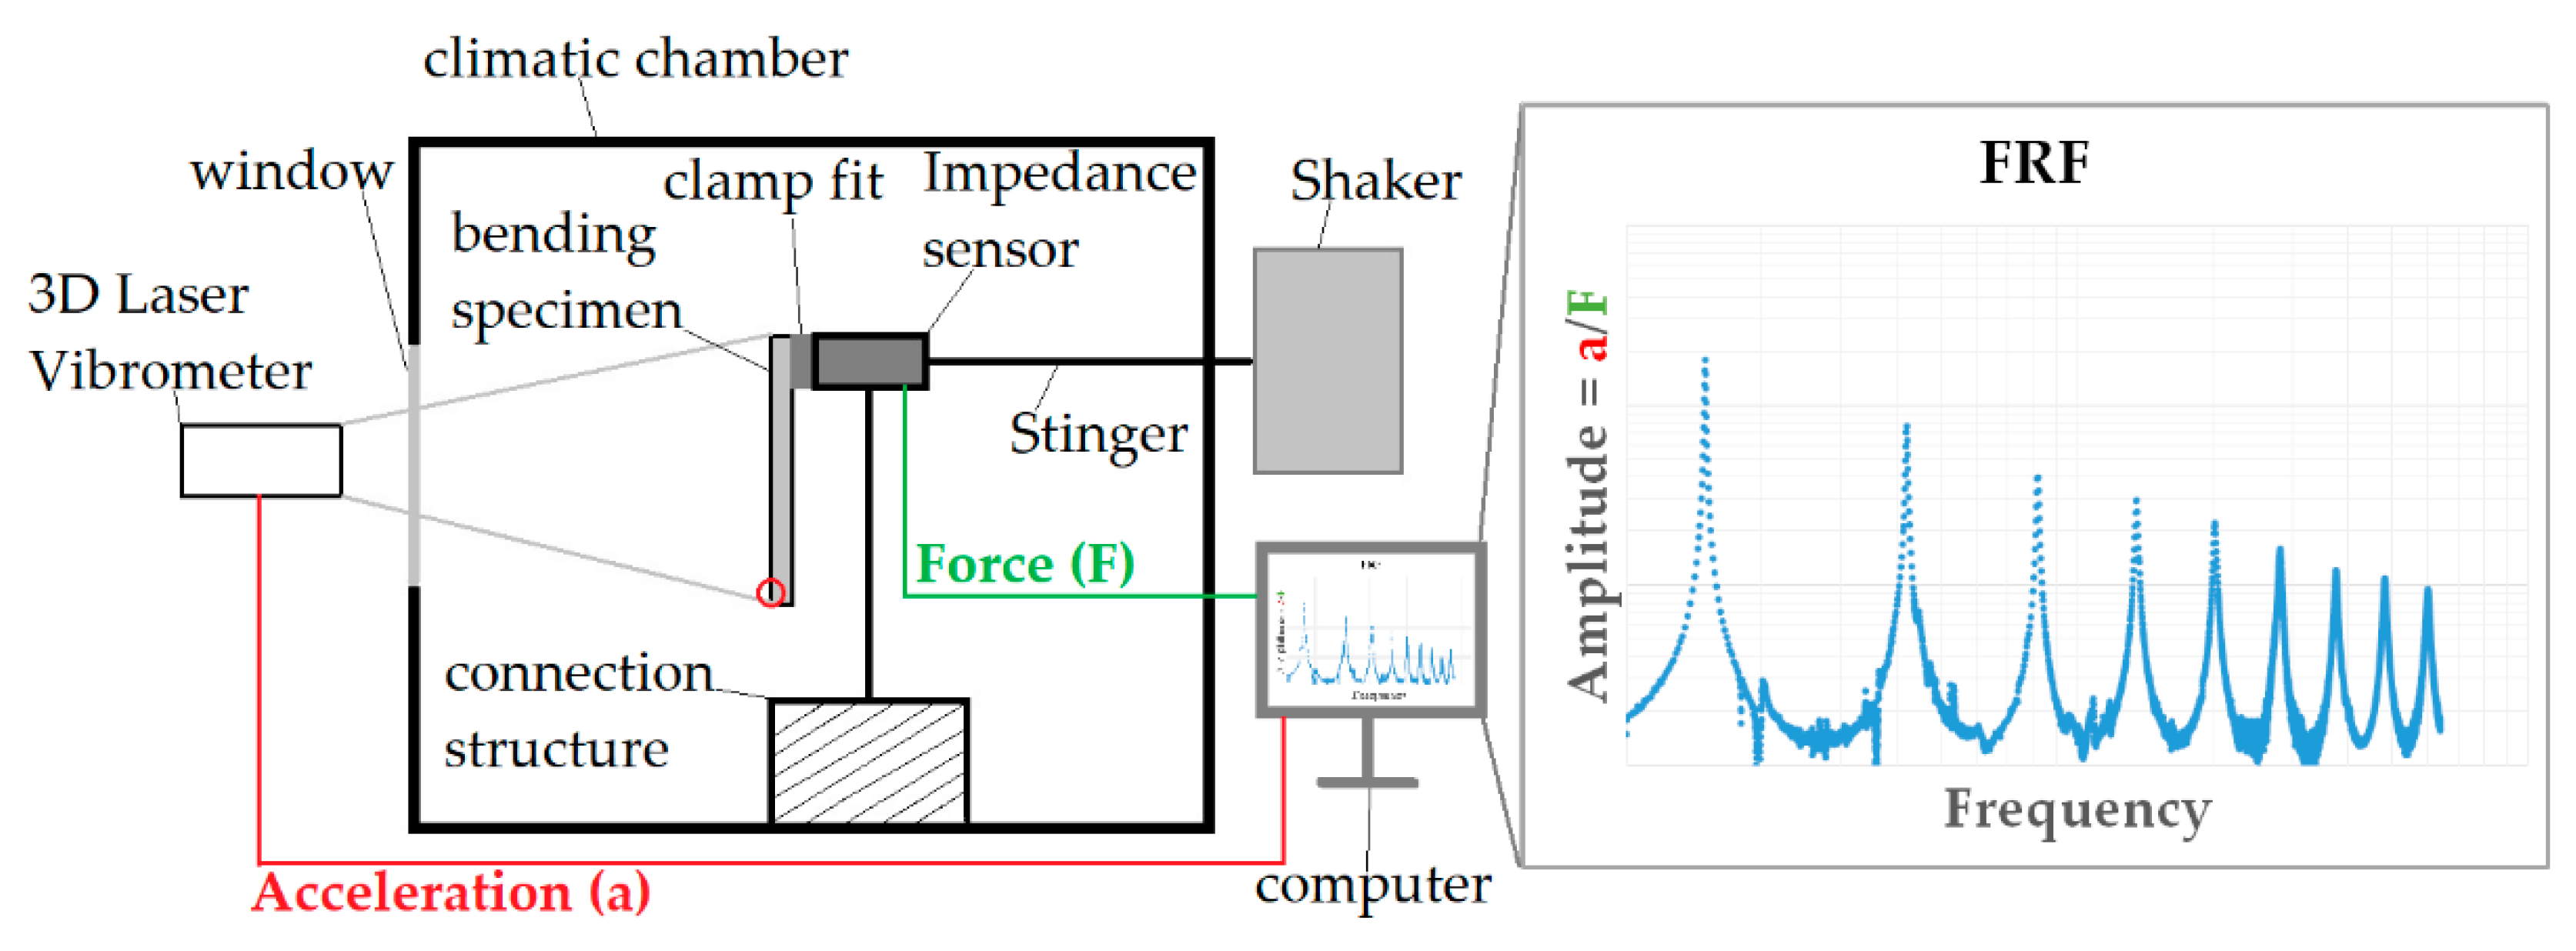
The bending specimens have been applied to a connection structure via a clamp fit. A shaker with stinger connection to this structure allows a uniaxial vibration excitation of the test specimens. Furthermore, the testing structure has been placed in a climatic chamber and allows a vibration excitation of the specimens under defined temperature and humidity conditions.
To excite the specimens, the shaker was driven with a defined sine sweep in the range from 100 Hz to 8 kHz. The acceleration of the specimens under vibration excitation has been recorded by using the PSV-500-3D scanning laser Vibrometer of the company Polytec. The excitation force of the specimens has been recorded using a Type 8001 impedance sensor of the company Brüel & Kjaer. Thus, it is possible to determine the FRF of the bending specimens as ratio between the displacement of the lower end of the specimens and the applied excitation force. A detailed description of the method used to characterize the dynamic material properties is given in [
16].
Figure 4 shows schematically the used test arrangement with resulting FRF.
Assuming a fixed-free connection and excitation of an Euler-Bernoulli beam, the
-th natural frequency
has been obtained according to:
where
is the storage modulus of the material,
is the moment of inertia of the bending specimen,
is the density of the material,
is the cross-sectional area of the bending specimen,
is the length of the specimen.
is a characteristic factor for describing the shape of natural oscillation as a function of the bearing of the beam. This can be determined using:
for the
-th natural frequency and
. Switching Equation (34) to the storage module results with:
Equation (36) allows to evaluate the FRF of the bending vibration tests at the occurring resonance frequencies to the storage module. Using linear inter- and extrapolation, the storage module as function of the frequency has been determined. Furthermore, under conditioning and testing the plastics in the climatic chamber, it is possible to determine the frequency-, temperature- and humidity-dependent storage modulus .
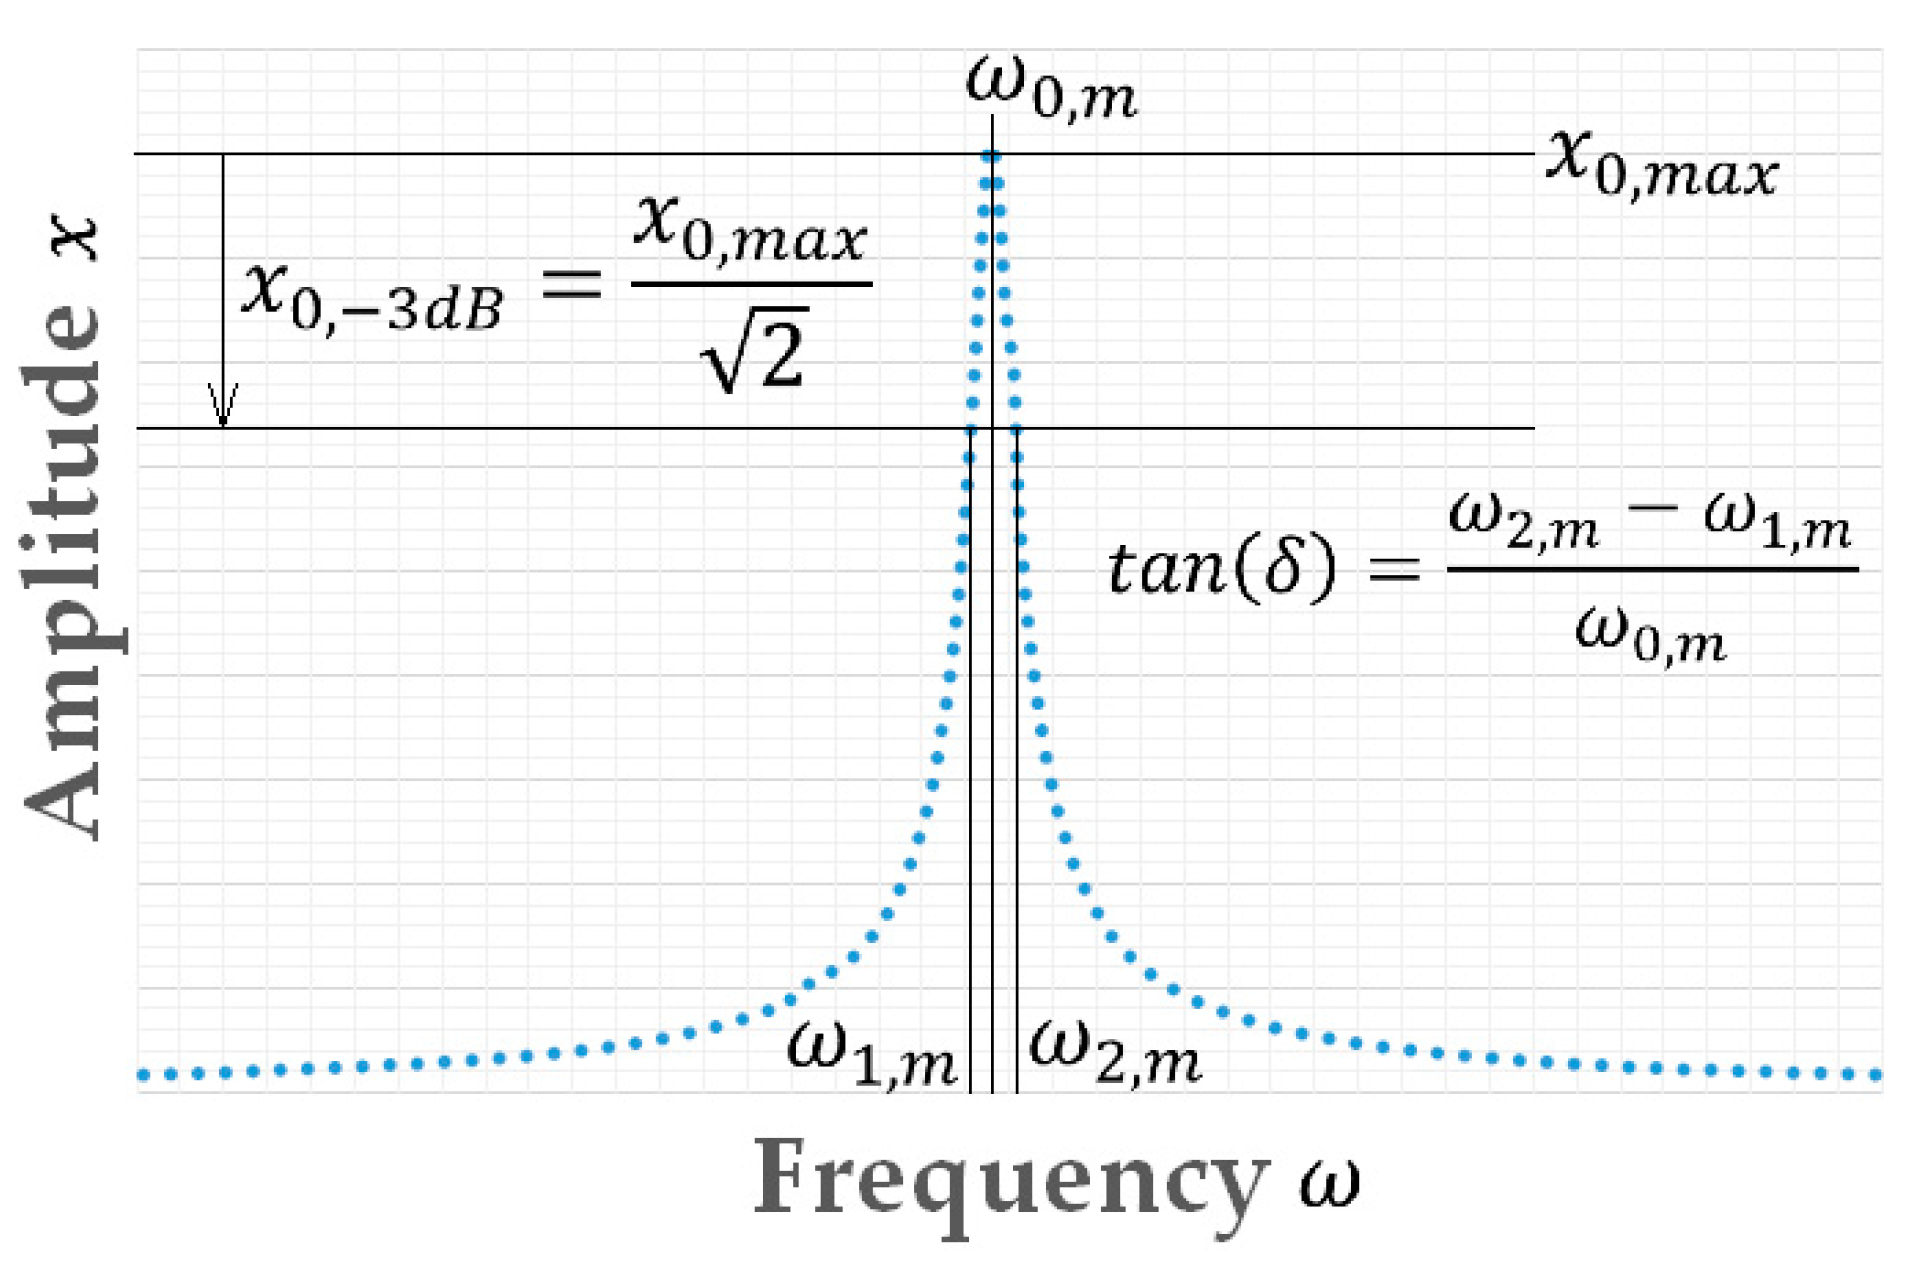
Following, the dissipation factor
at
-th natural frequency can be determined using the 3 dB method [
18] according to
Figure 5.
Equation (37) describes the relationship between dissipation factor, storage and loss module with:
Thus, it is possible to convert Equation (37) to the loss modulus and determine the loss modulus as function of the frequency, temperature and humidity by linear inter- and extrapolation over the frequency. As result, the values of and allow calibrating the ARDI model.
5. Simulation
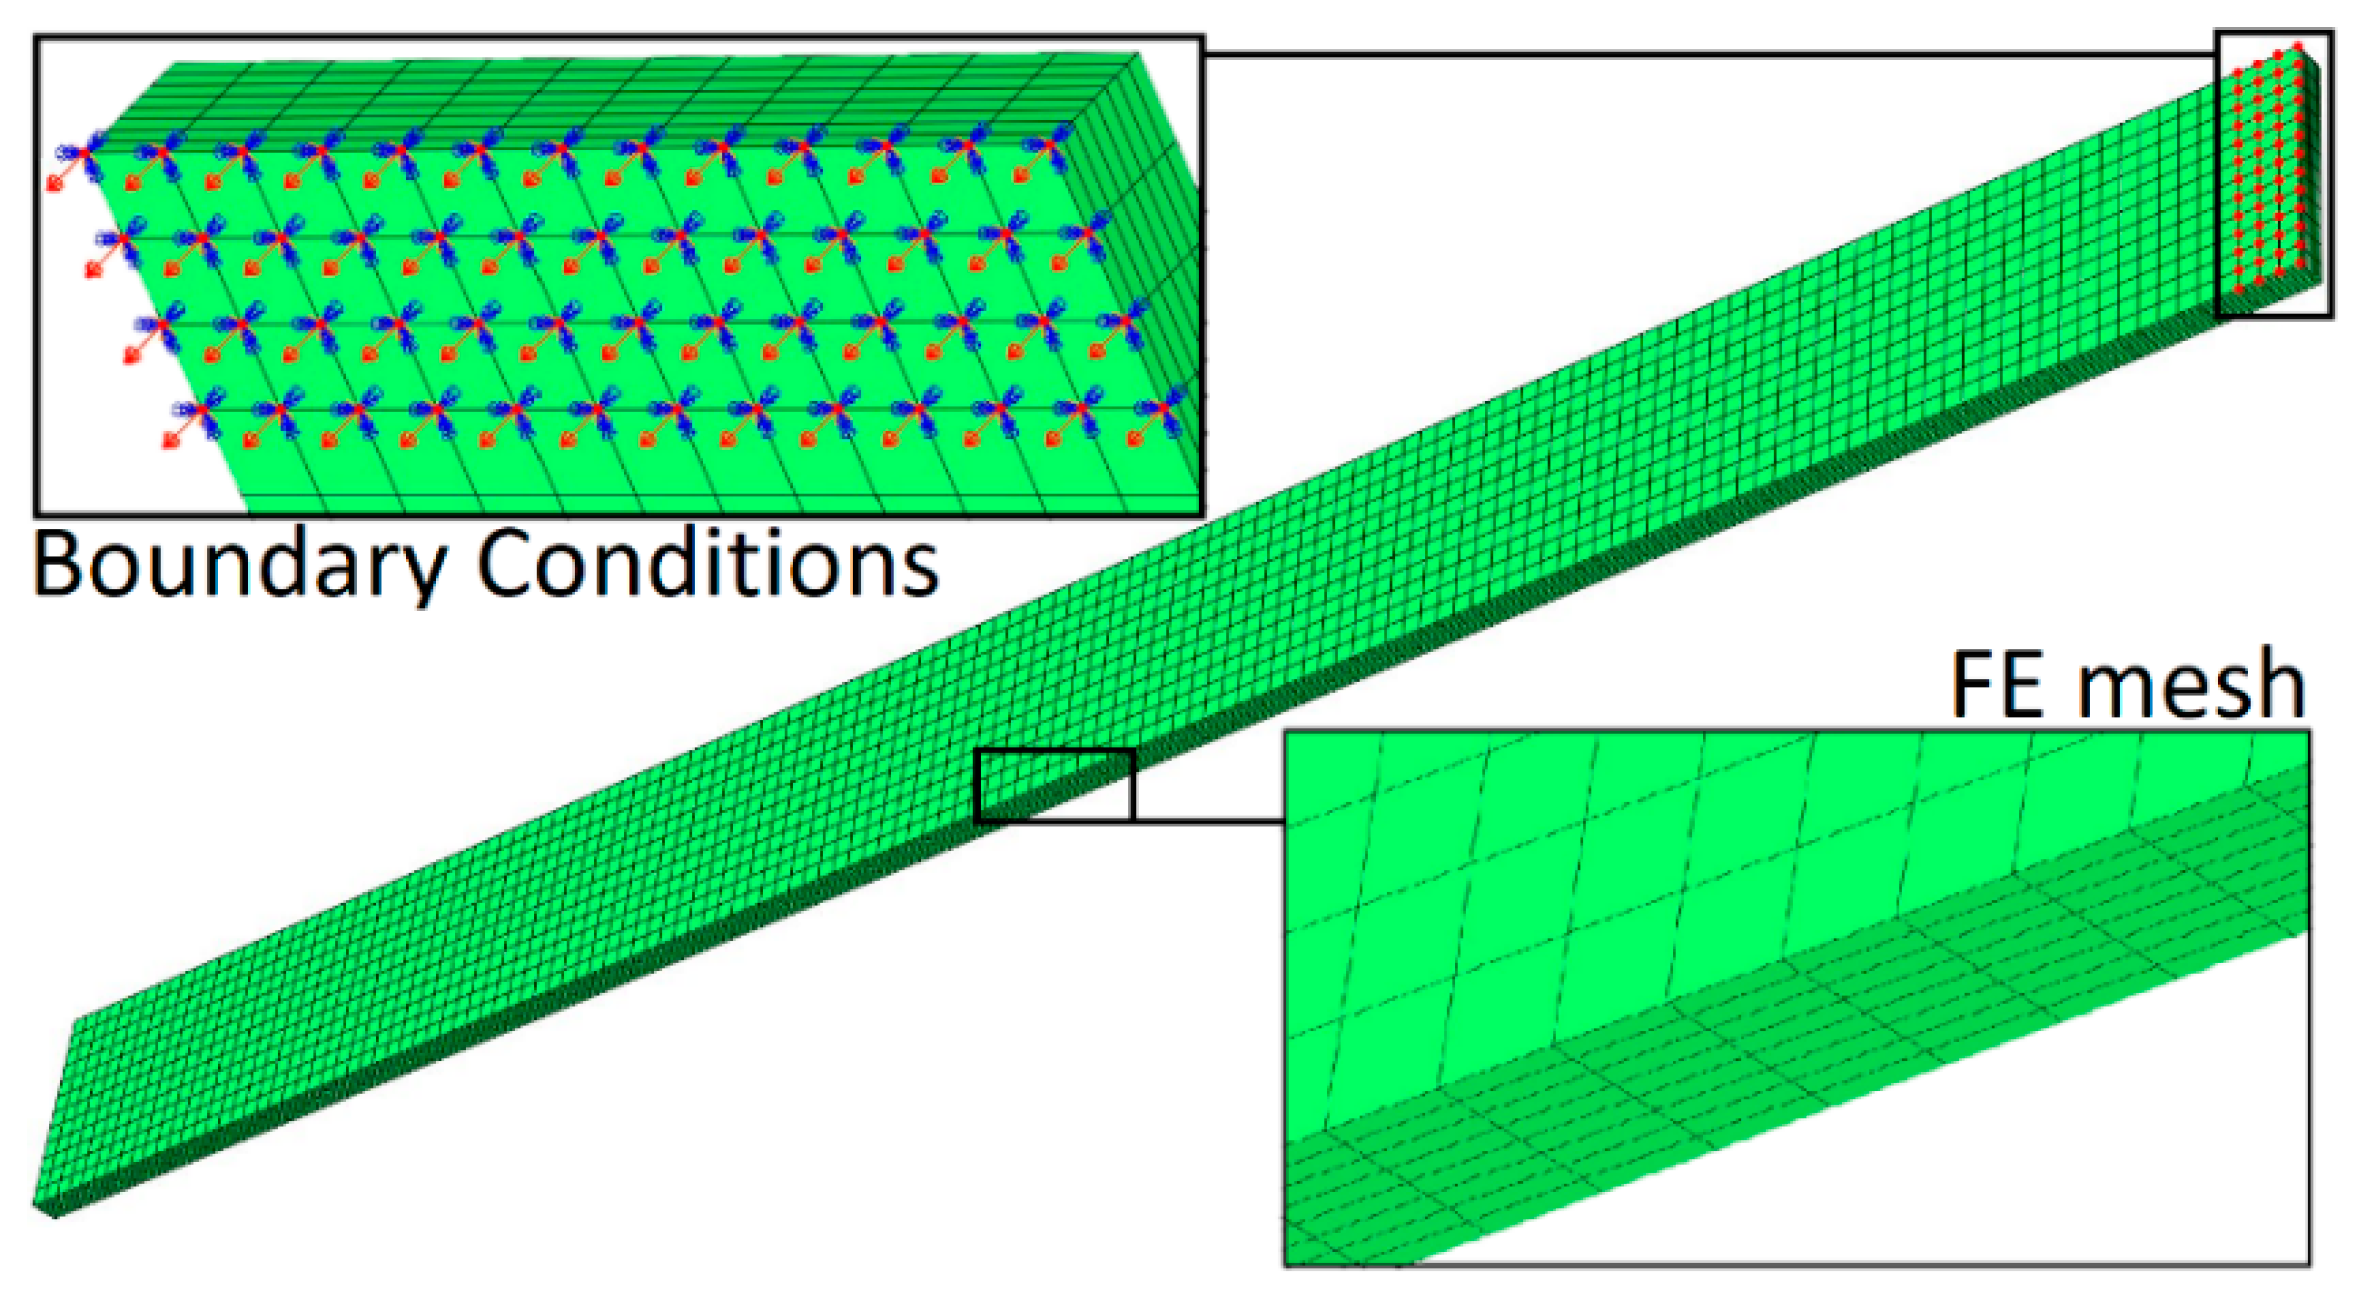
In the present work, the developed ARDI material model has been applied to investigate the structural dynamics of a bending specimen. Starting point is the geometry of the bending specimen with the dimension 180x15x2mm. Using Abaqus CAE version 2017, this geometry has been discretized into 27,000 C3D8 tetrahedral elements. This corresponds to an element size of 1x1x0.2 mm and thus 10 elements across the thickness. A fixed-free boundary condition has been applied. As result, in the simulation, the upper area of the bending specimen has been excited unidirectional with a force amplitude, whereas all other directions have been blocked against movement.
Figure 6 shows the discretized bending specimen with applied boundary conditions.
6. Results
6.1. Stiffness and Damping Behaviour
The unidirectional, transversal-isotropic, fourth ranked stiffness
and damping
tensors were rotated by the rotation matrix
into different planar spatial directions of the icosphere and thus resulting fiber directions in the plain, corresponding to
Figure 7.
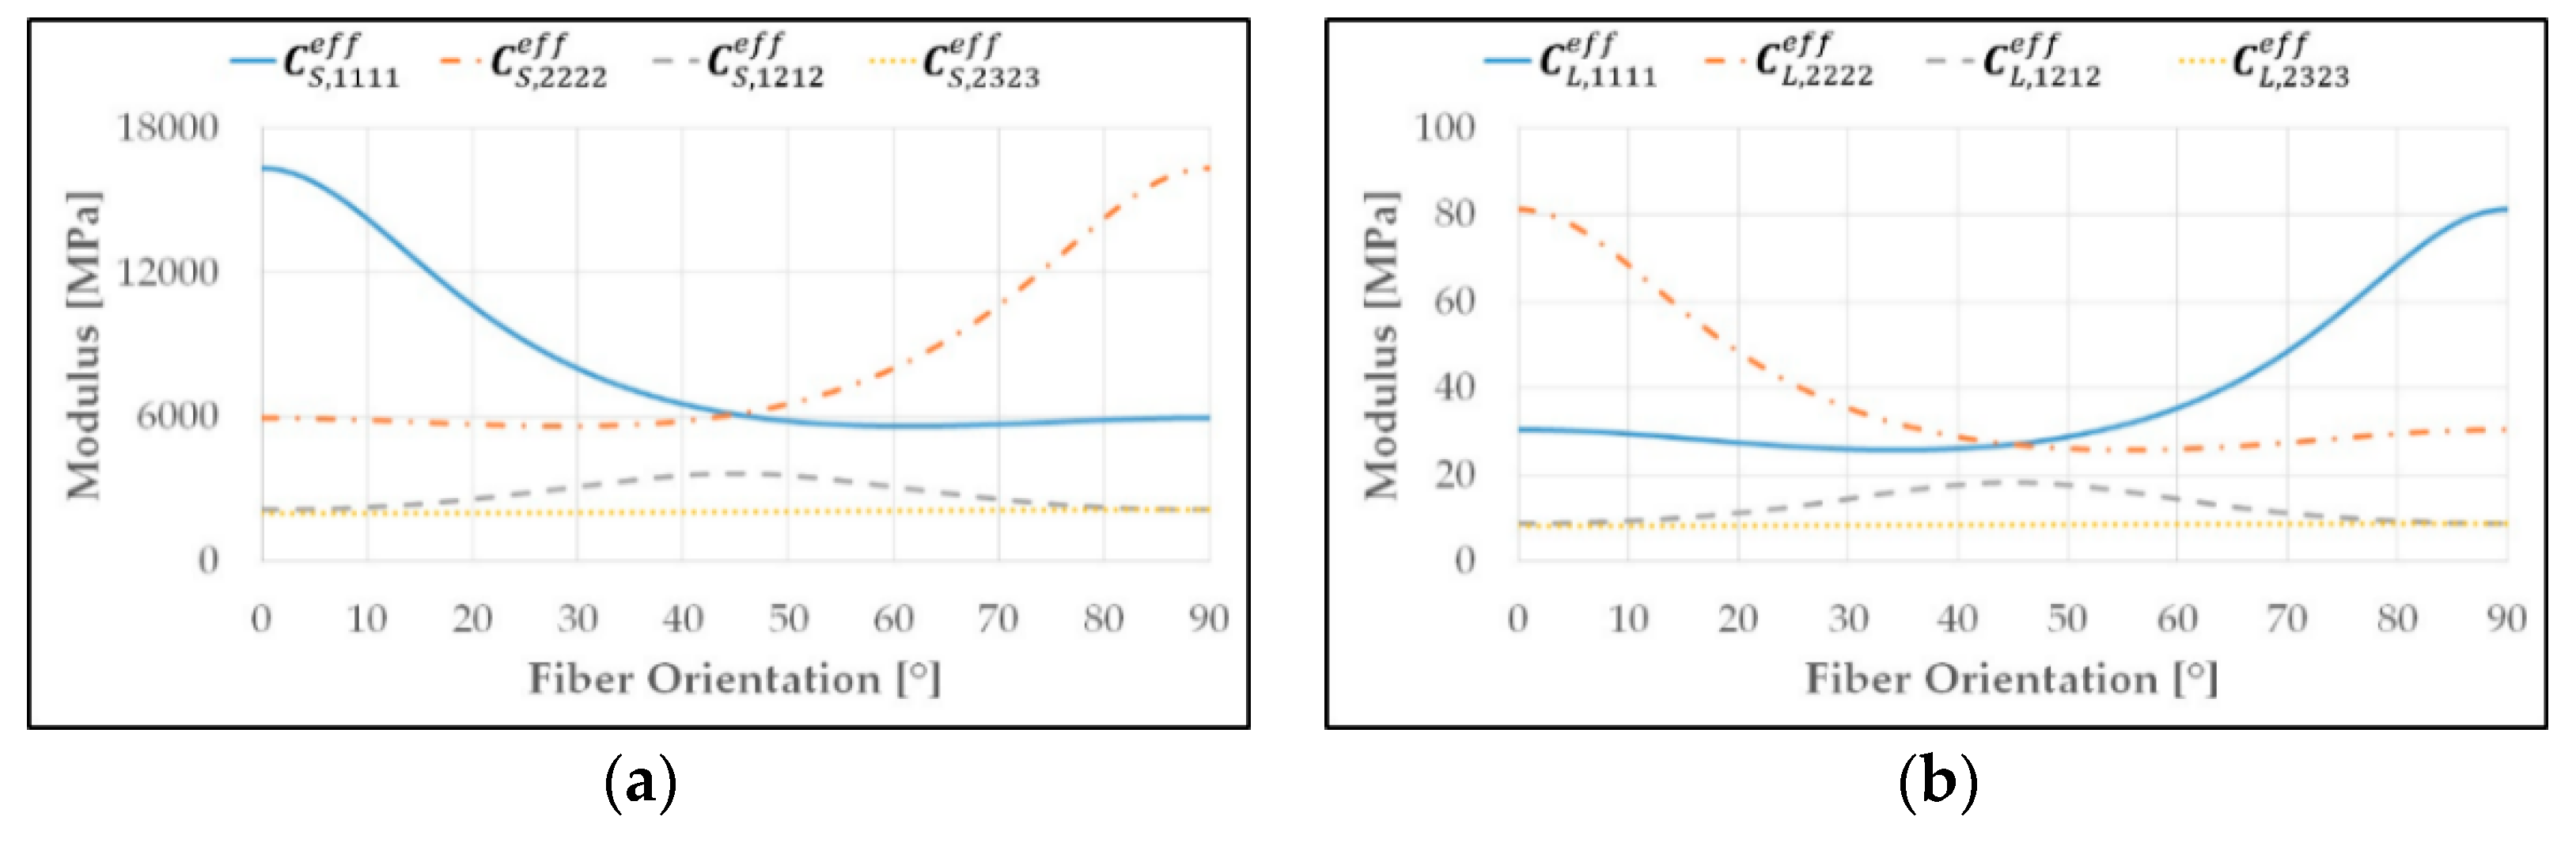
describes the modulus orientated to the main global –direction and depending on whether the experimental determined storage or loss modulus has been used to calibrate the tensor. Following, describes the modulus in the –direction. is equal to due to the used transversal-isotropic behavior. and describes the main transverse modulus components.
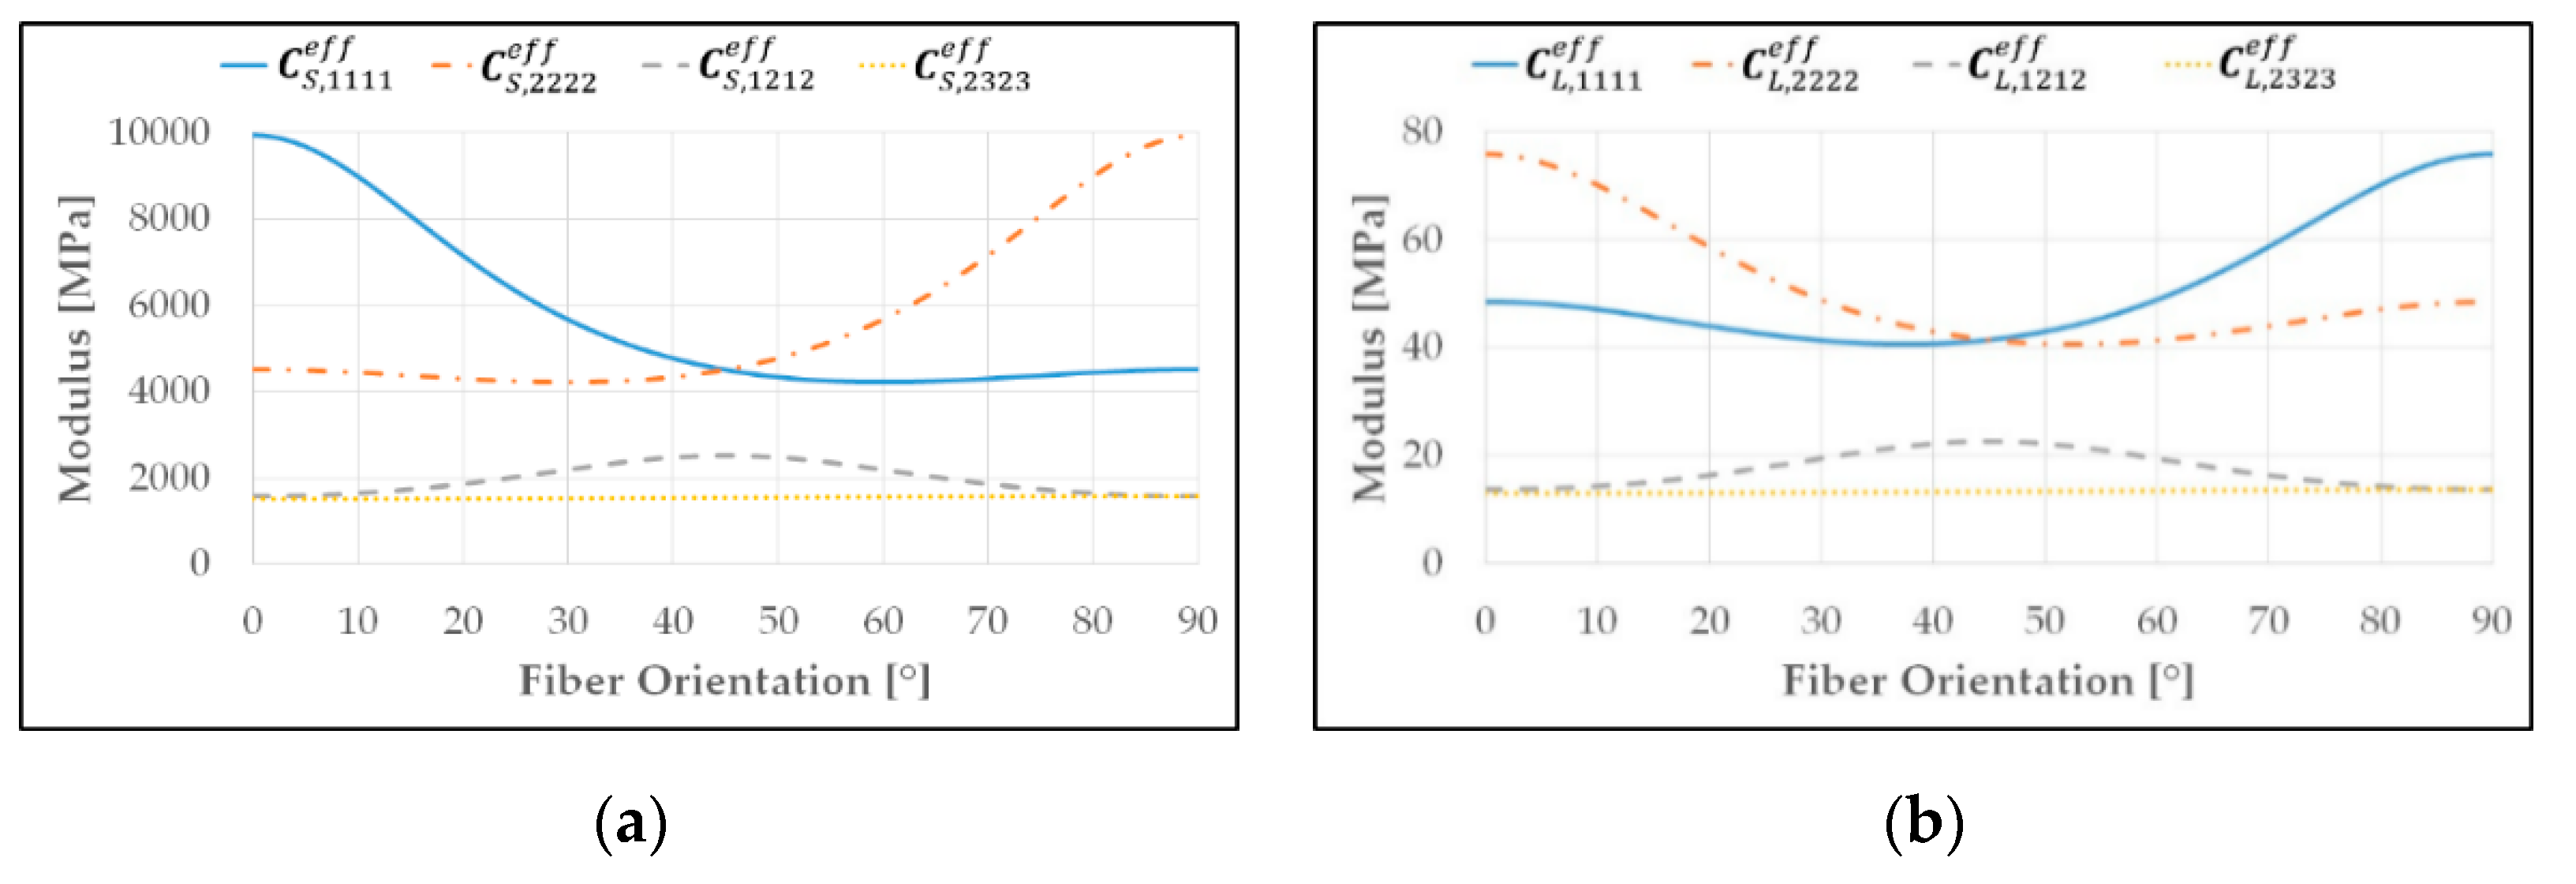
Figure 8 shows the main matrix entries of the fourth ranked stiffness
and damping tensor
of PA66-GF30 at 23 °C and 0% rh.
Figure 8a shows that the stiffness in the main axis direction
is highest, when all fibers pointing in the main
–direction (0°). As the angle deviation of the fibers from the main axis increases, the stiffness
decreases, whereas the stiffness perpendicular to the main axis
remains relatively constant. This applies up to a rotation angle of the fibers of about 45°. The transverse modulus
increases continuously with a rotation from 0 to 45° and reaches its maximum under 45° fiber orientation. At this point, the trend of the modulus
and
reverses for a further rotation from 45 to 90°. In this case, the transverse modulus
is constant due to the planar rotation.
Figure 8b shows that the damping
is lowest, when all fibers pointing in the main
–direction (0°), while the damping perpendicular
is highest. This is due to the used definition of the damping tensor. Here, the strain concentration tensor, which includes the geometry tensor of the ellipsoid inclusions, increase the more fibers point in the main axis direction. Thus, the effective composite damping decrease.
As the angle deviation of the fibers from the main axis increases, the damping perpendicular decreases, whereas the damping in the main axis remains relatively constant up to a rotation angle of the fibers of about 45°. Following, the trend of the modulus and reverses for a further rotation from 45 to 90°, comparable to the stiffness tensor.
Figure 9 shows the matrix entries of the fourth ranked stiffness
and damping tensor
of PPA-GF50 at 23 °C and 0% rh. Due to the same definition of the stiffness and damping tensors, the trend of the curves of the tensor components of PPA-GF50 are comparable to the PA66-GF30, according to
Figure 8. Due to the increased fiber volume fraction, the stiffness tensor of the PPA-GF50 is increased. The damping tensors of the PPA-GF50 are comparable to the PA66-GF30. This is due to an increased damping tensor of the pure PPA matrix material, but stronger reduction of this damping tensor due to an increased fiber volume fraction.
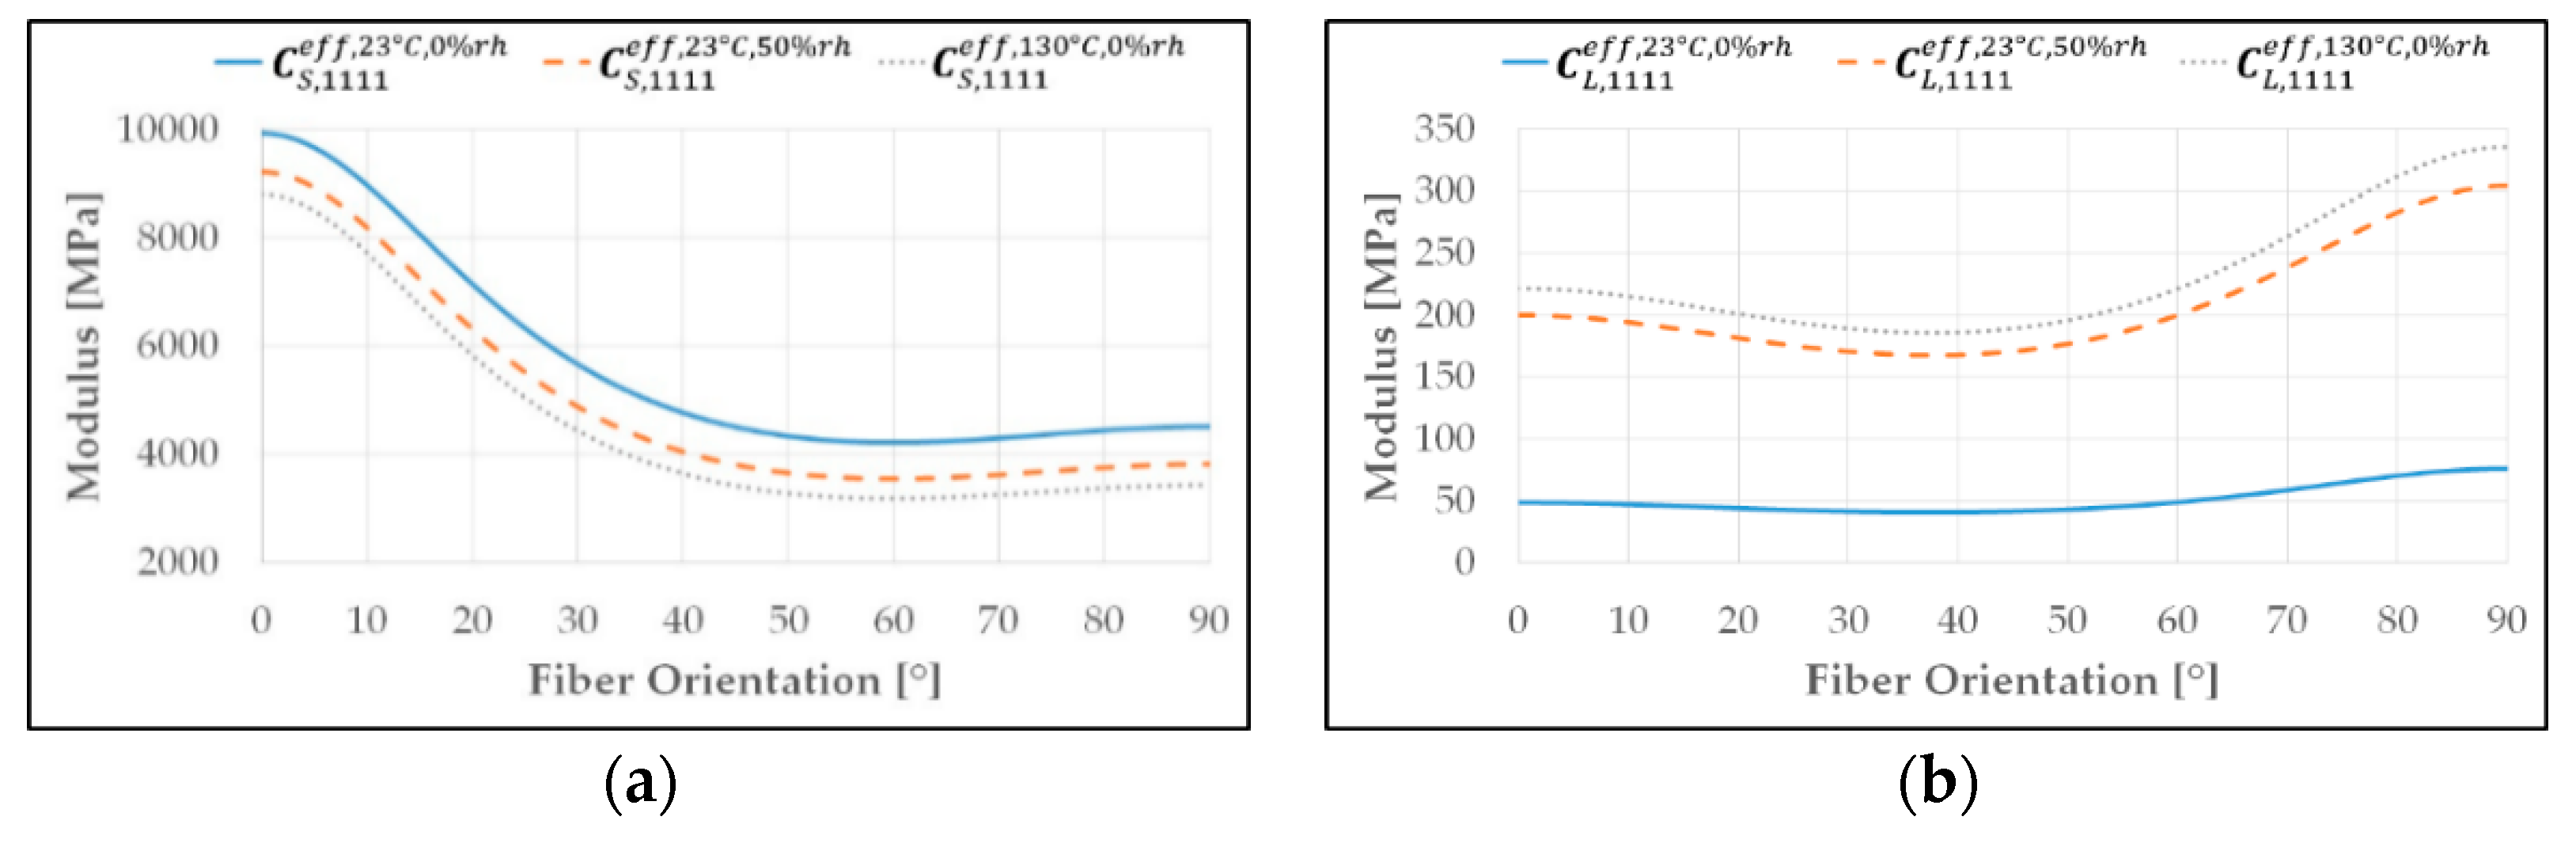
Figure 10 shows the main matrix entry of the stiffness
and damping tensor
of PA66-GF30 at 23 °C and 0% rh, 23 °C and 50% rh, 130 °C and 0% rh.
Figure 10a shows that the stiffness decreases with increasing humidity and temperature.
Figure 10b shows that damping increases sharply with an increase in humidity and temperature. The influence of temperature increase is more pronounced than the influence of humidity increase. Both, the decrease in stiffness and the increase in damping is generally due to the softening behavior of the matrix material with an increase in humidity or temperature [
29,
30].
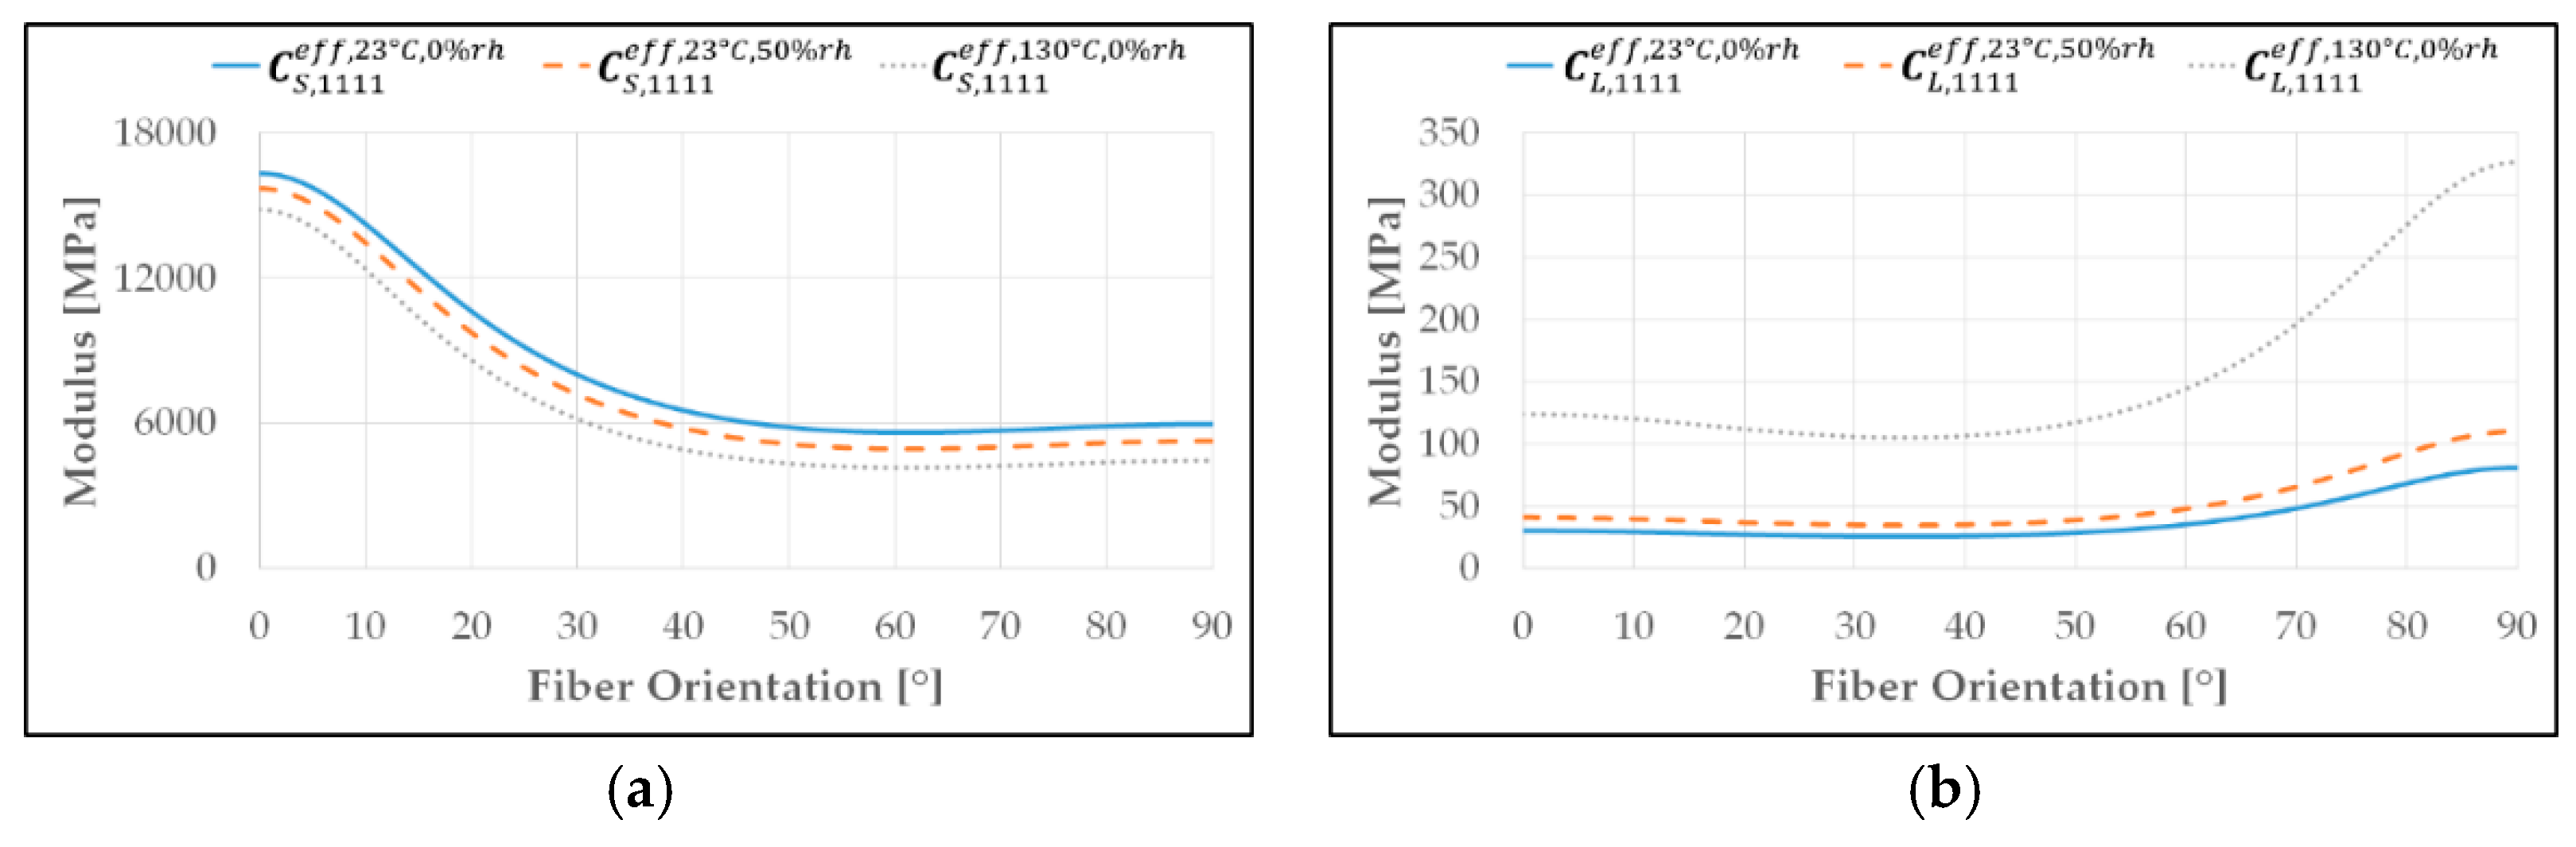
Figure 11 shows the main matrix entry of the stiffness
and damping tensor
of PPA-GF50 at 23 °C and 0% rh, 23 °C and 50% rh, 130 °C and 0% rh. In comparison to
Figure 10,
Figure 11 also shows that the stiffness of the PPA-GF50 decreases with an increase in humidity and temperature, while damping increases. In comparison to PA66-GF30, the influence of the increase in humidity on the stiffness and damping of the PPA-GF50 is less pronounced, as the PPA matrix material has a reduced water absorption capacity [
31].
6.2. µ-CT Measurement and Filling Simulation
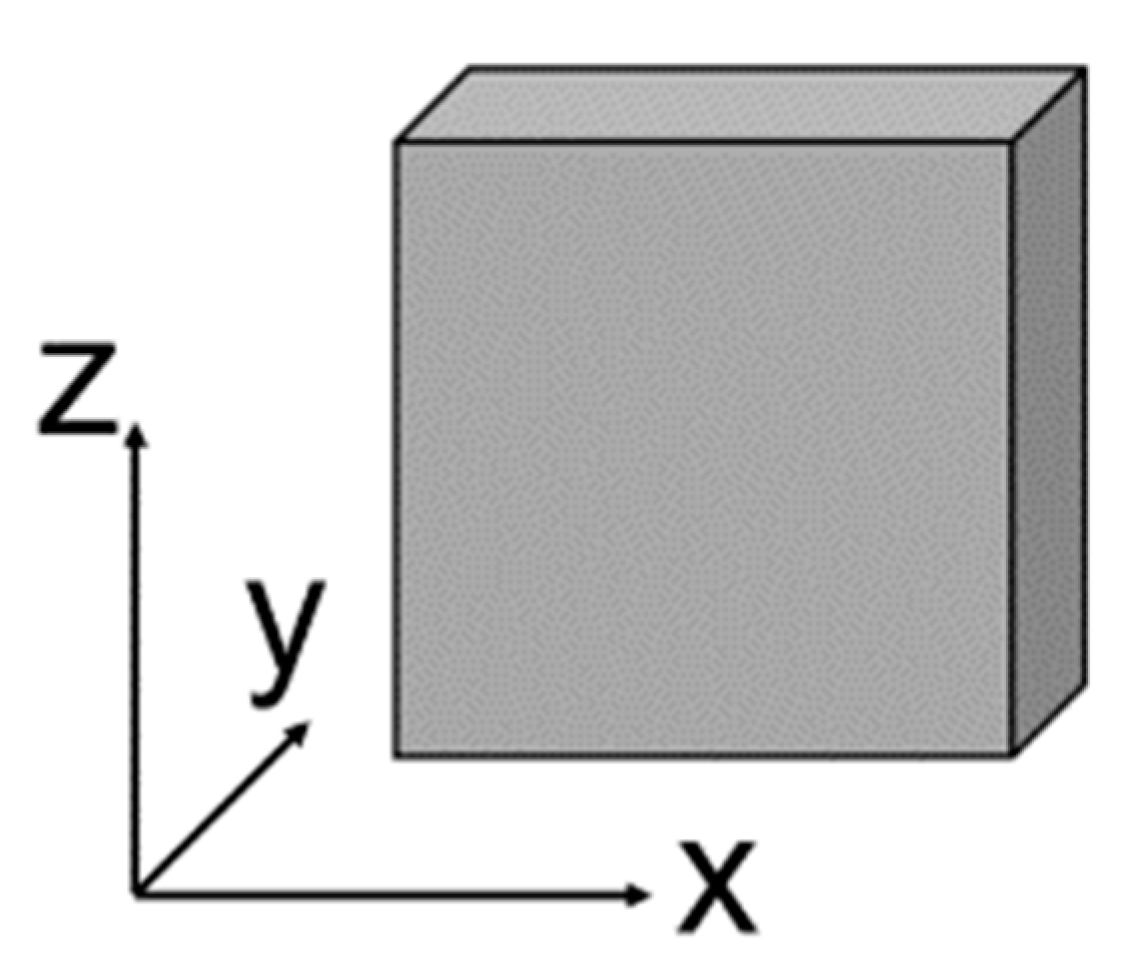
The convention of the axis system of the µ-CT specimens is shown schematically in
Figure 12. In this case, the z-direction corresponds to the injection flow direction. Using the filling simulation of the three-dimensional geometry of the plate material, it is possible to derive the second order fiber orientation tensor
. The filling simulation in this work was performed with the software CADMould by the company PART Engineering.
In the first step of the filling simulation, a CFD mesh of the plate material has been generated. Then the process parameters for the production of the material plate have been set. The process parameters of the PA66-GF30 originates from the material database of the CADMould software and the parameters of the PPA-GF50 have been taken from a specification of the manufacturer. In the next step, the filling simulation has been performed. The fiber orientation tensors of the filling simulation
of the plate material have been evaluated at the same center positions of the plate material comparable to the µ-CT investigations. The measured
and calculated
fiber orientation tensors of the PA66-GF30 plate material are shown in
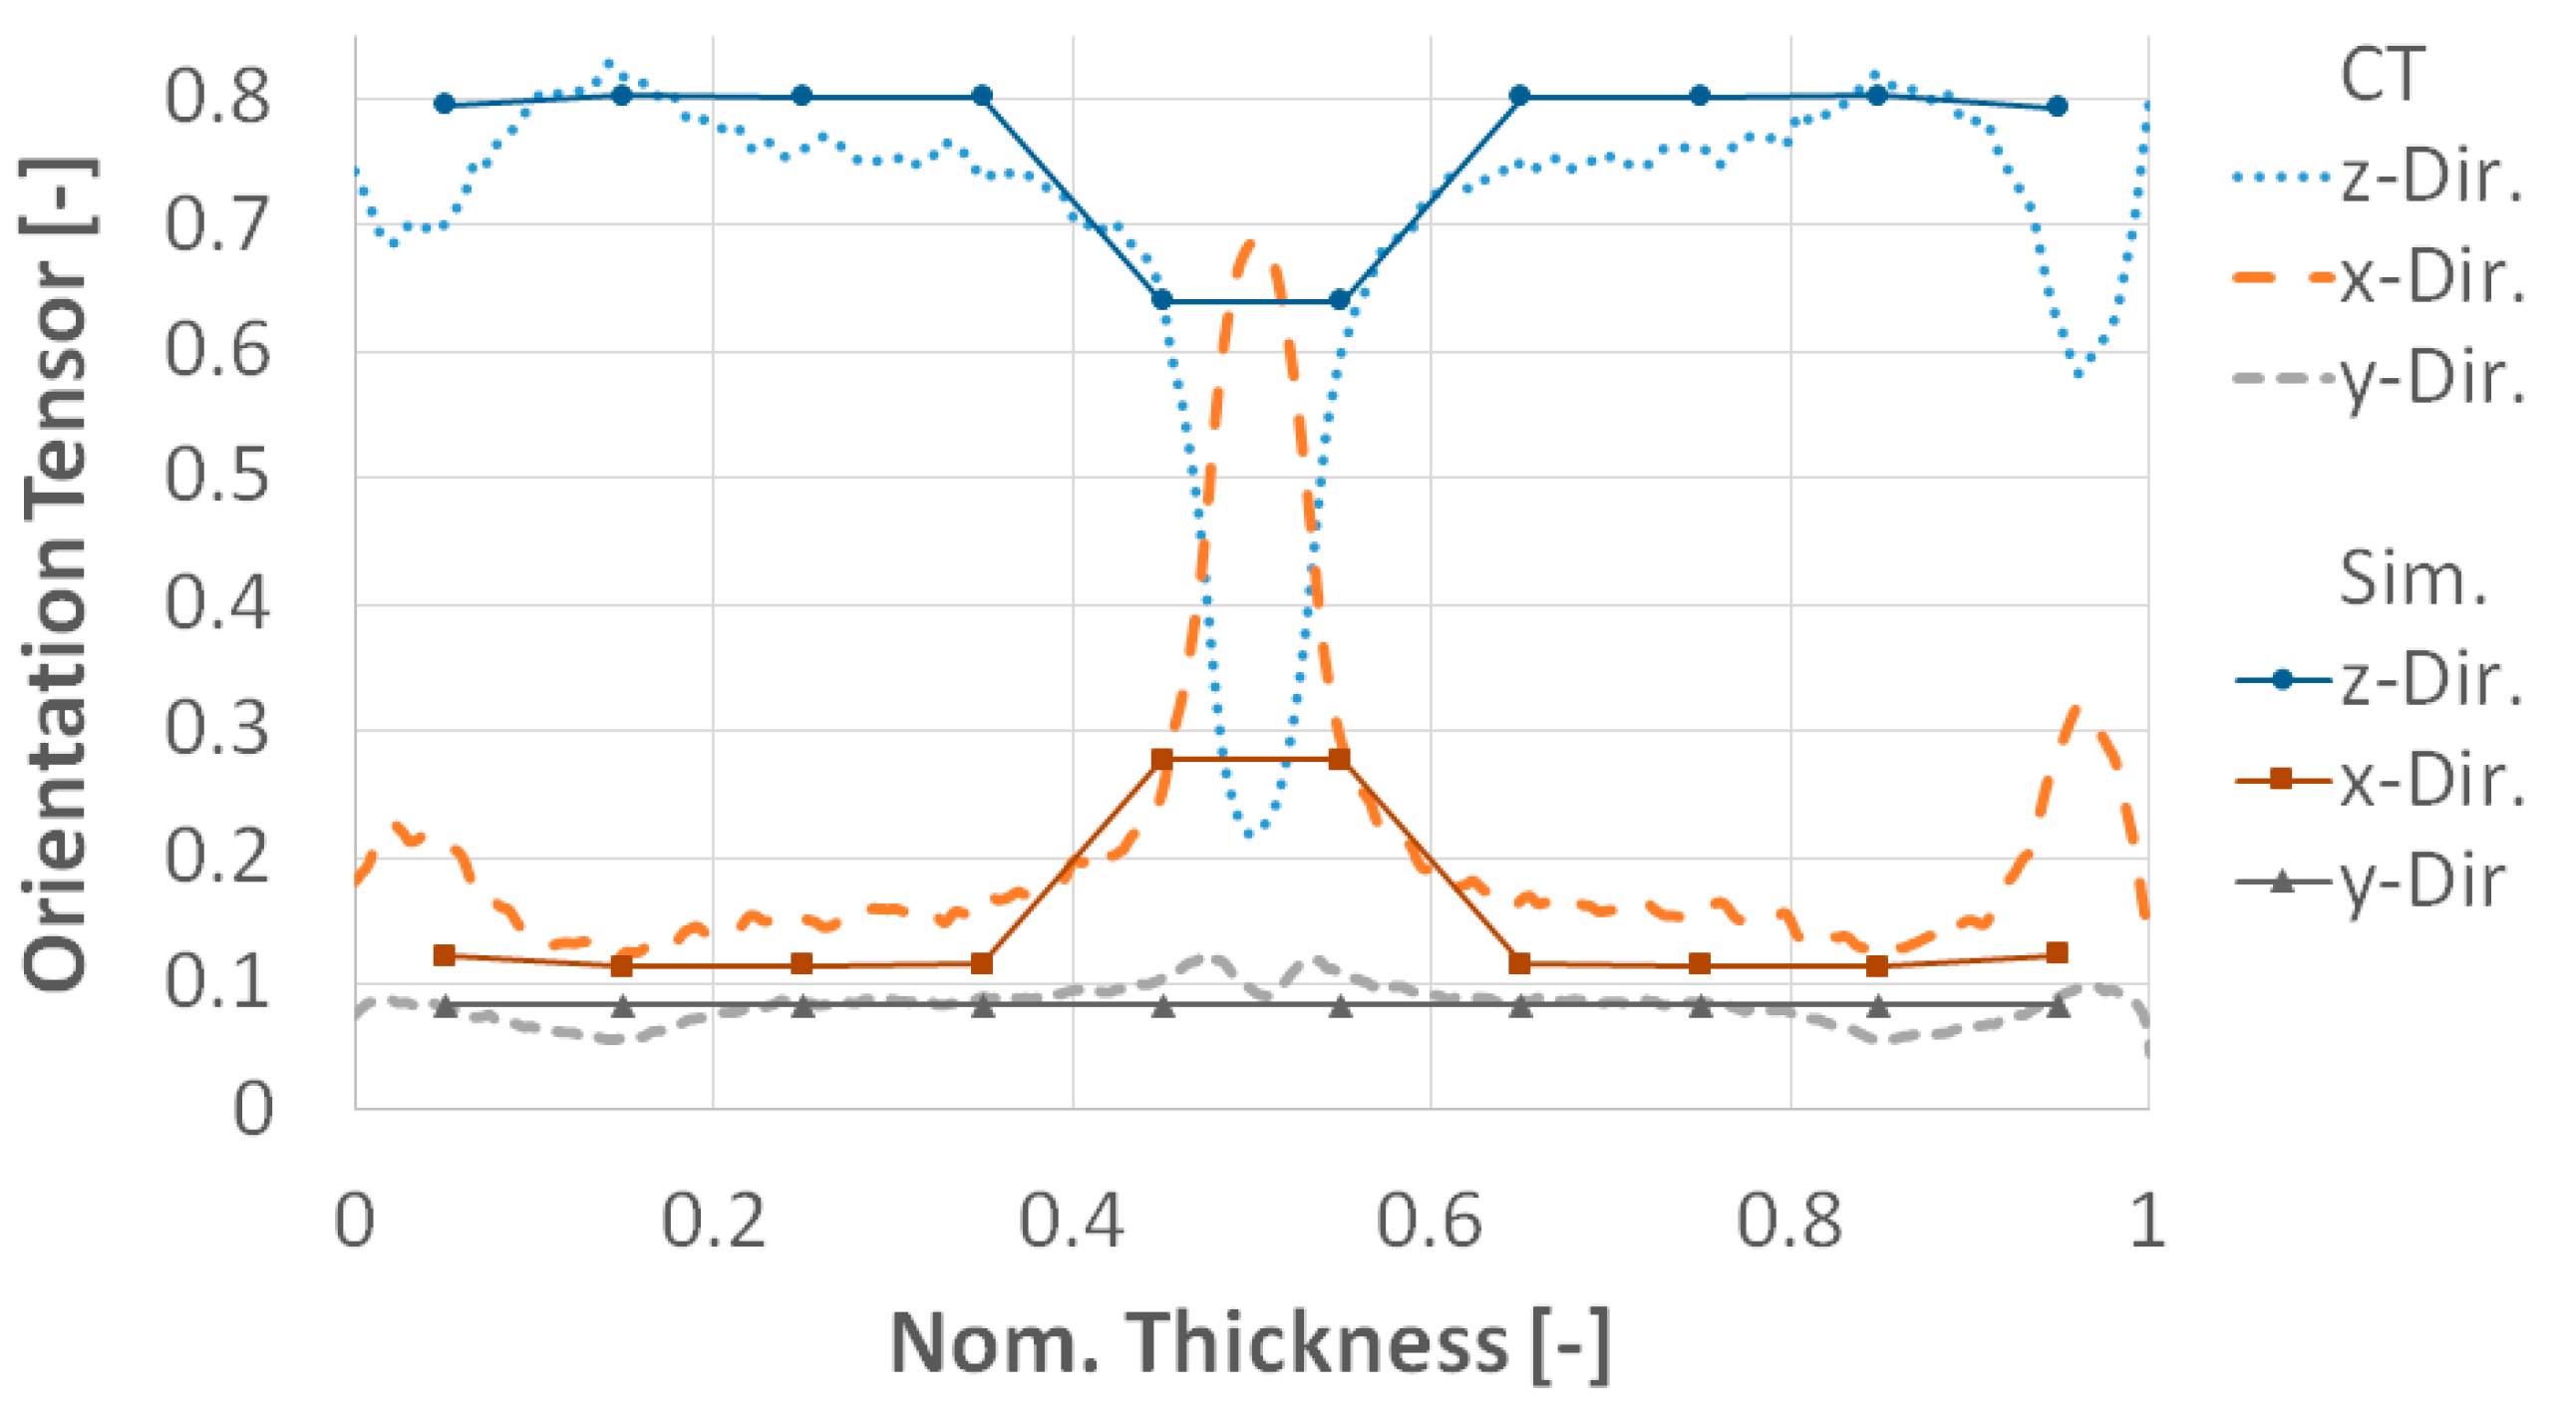
Figure 13.
Figure 13 shows that the PA66-GF30 has a narrow, but very pronounced edge and middle layer. Furthermore,
Figure 13 shows a good correlation of the trend of the measured fiber orientation tensors of the PA66-GF30 in comparison to the filling simulation. Only the pronounced orientation gradient in the middle layer is not covered due to the absence of an evaluation point in the middle of the plate. This is associated with loss of information. As result, the orientation tensor in flow direction is slightly increased in the middle of the flow channel.
The measured
and calculated
fiber orientation tensors of the PPA-GF50 plate material are shown in
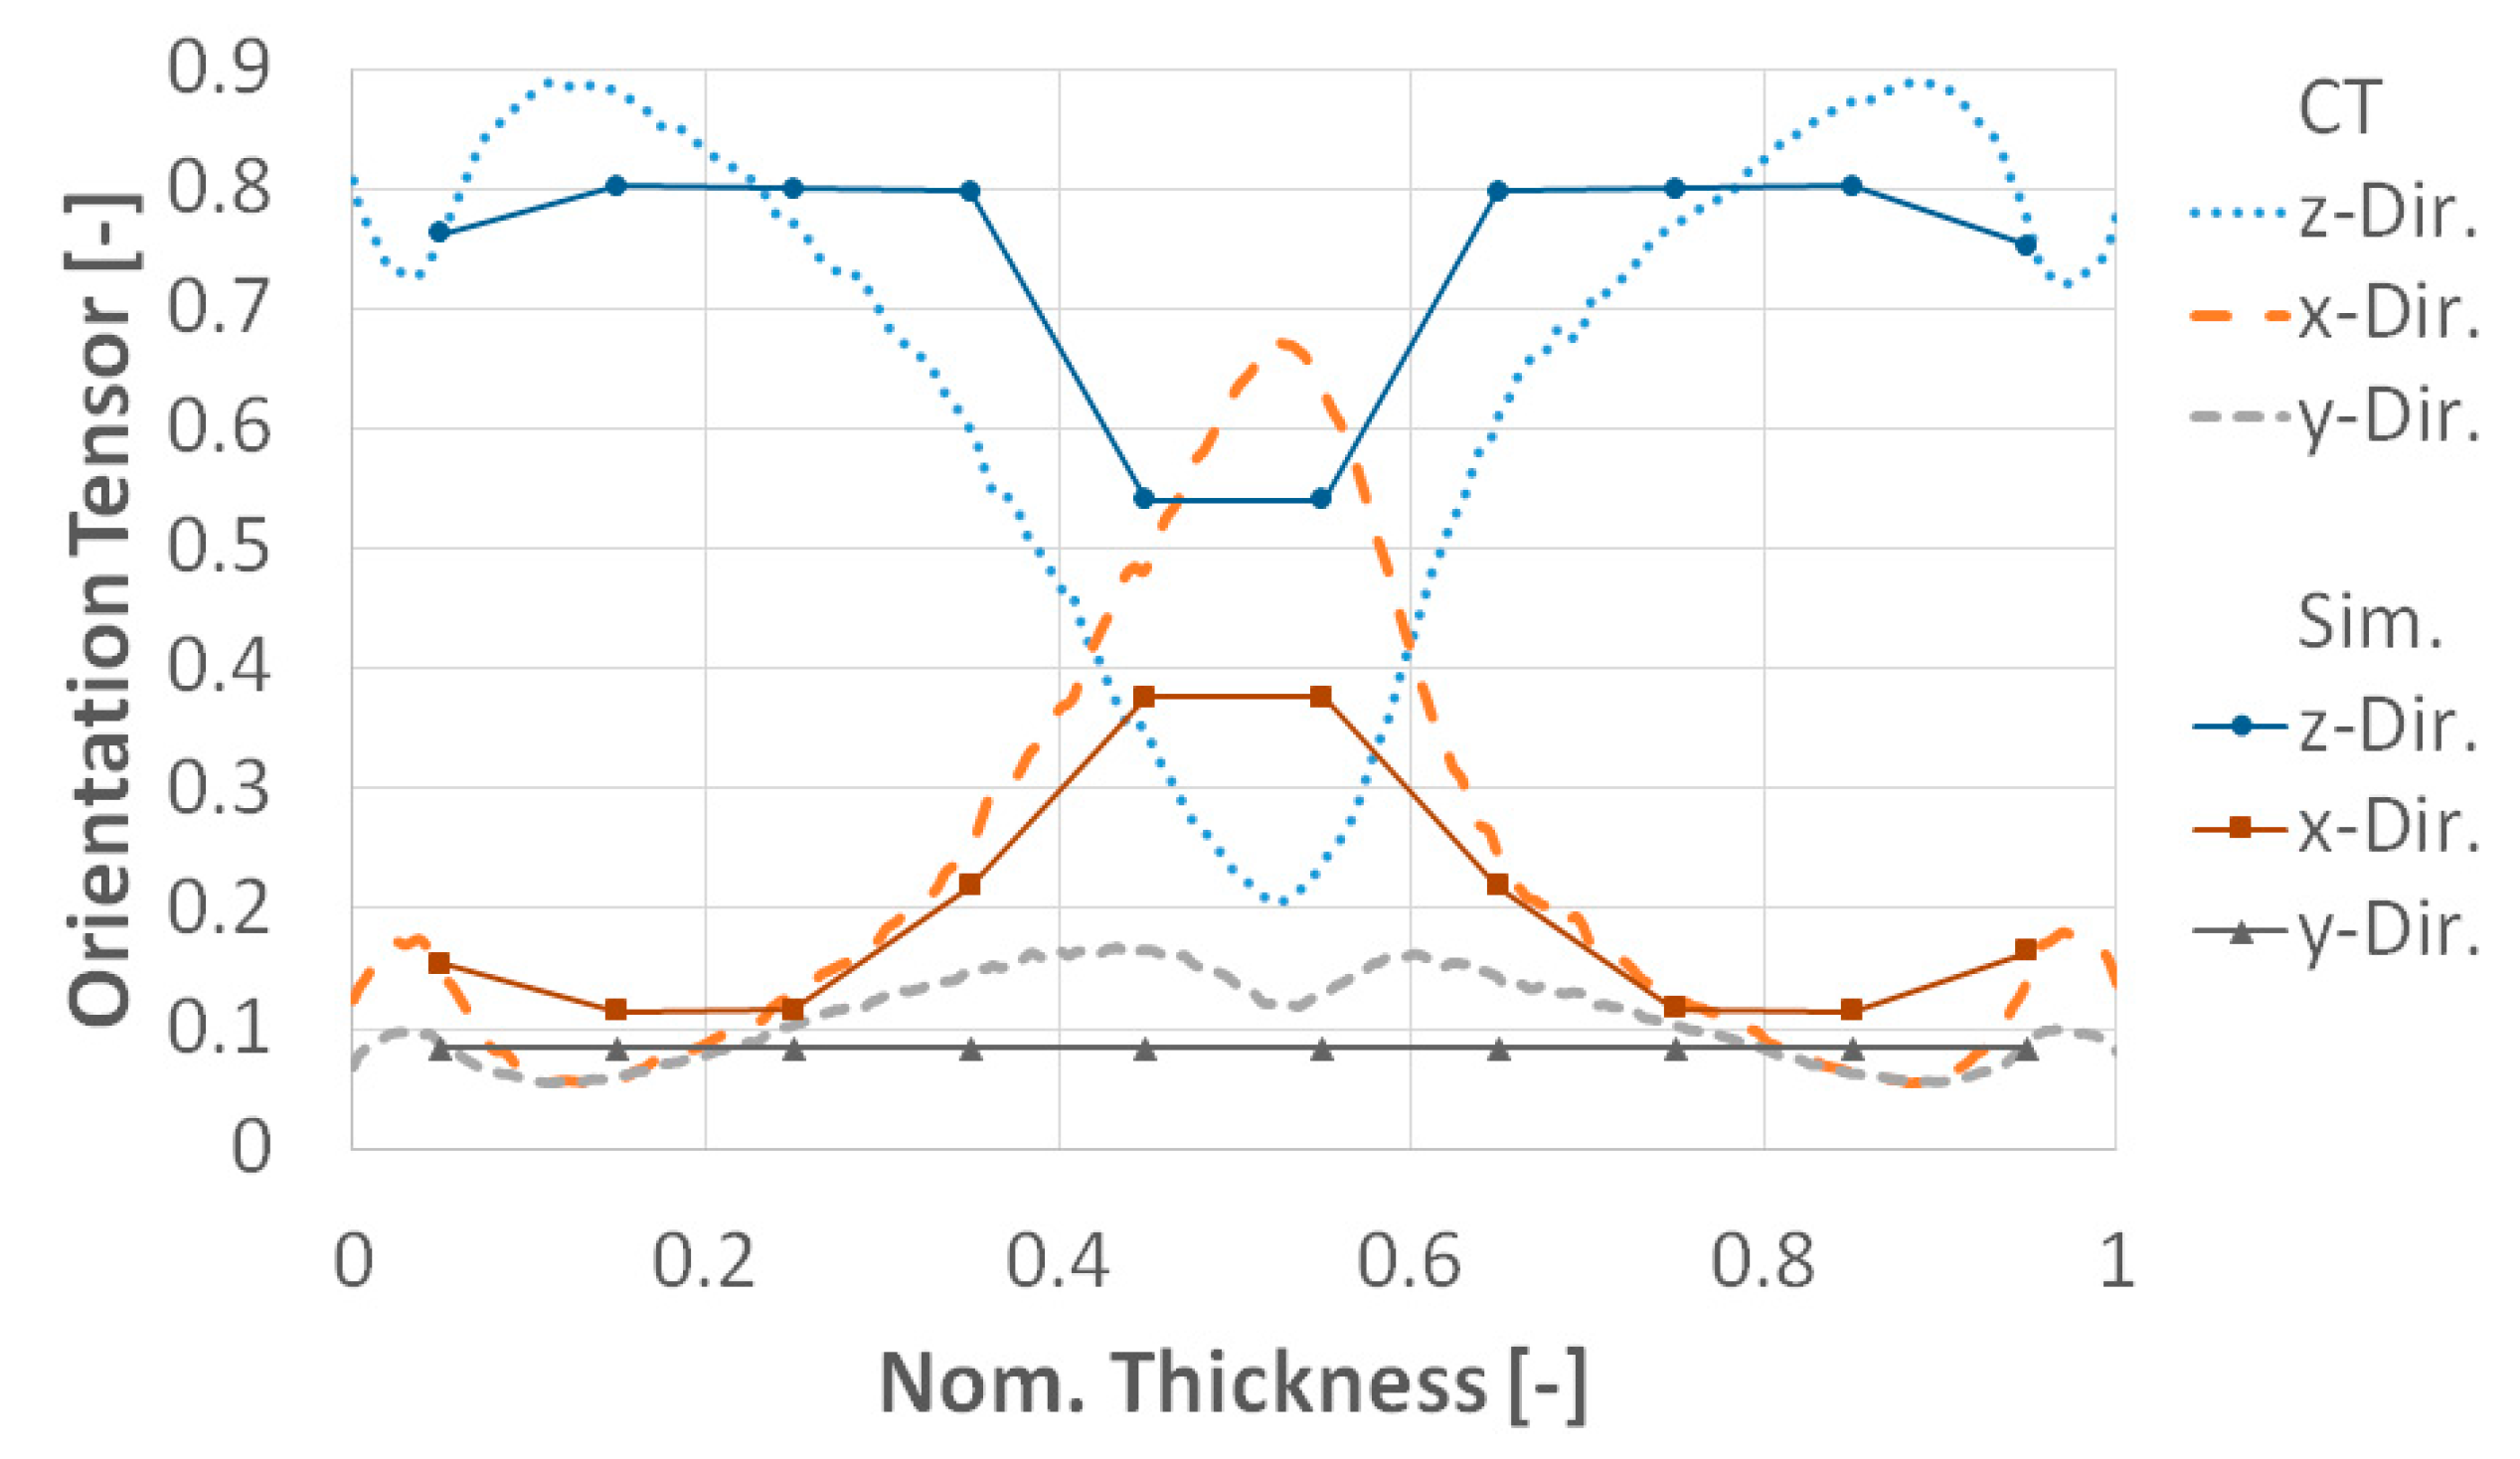
Figure 14.
Figure 14 shows that the PPA-GF50 has a continuous transition from edge to middle layer. As result, there is a broad and strong pronounced middle layer.
Figure 14 also shows that the continuous transition and thus the change in the orientation gradient of the PPA-GF50 material does not show a good correspondence to the filling simulation. The result is a loss of information in the middle of the flow channel comparable to the PA66-GF30, which also leads to an increase of the orientation tensor in the flow direction.
The comparison shows that the calculated fiber orientation tensors of the filling simulation are sufficient to be used for the calculation of the direction-dependent material properties. In this case, an adjustment of the settings of the filling simulation was purposeful.
6.3. Orientation Tensor Mapping Procedure
In order use the calculated second order fiber orientation tensor for the FE simulation of the structural dynamics, the data of the filling simulation (CFD) have been transferred. This has been done using the nearest neighbor principle.
The vector distance between the nodes of the CFD and FE mesh has been evaluated. Any node of the FE mesh with the smallest distance to another node of the CFD mesh has been assigned to each other. As result, the eigenvalues have been transferred from the CFD to the FE mesh. The assignment of the eigenvectors of the elements has been performed to the same principle. The eigenvectors describe the position of the elements (local coordinate system) relative to a base (global coordinate system).
In order to keep the loss of information low, a fine discretization of the FE mesh is necessary. For the mapping process the software Converse has been used. In addition, [
10,
32] describes the principle of the nearest neighbor in more detail.
Figure 15 shows the fiber orientation tensor of the filling simulation of the plate material, as well as the transferred fiber orientation tensor to the geometry of an IF bending specimen.
6.4. Comparison between RDI and the ARDI Model
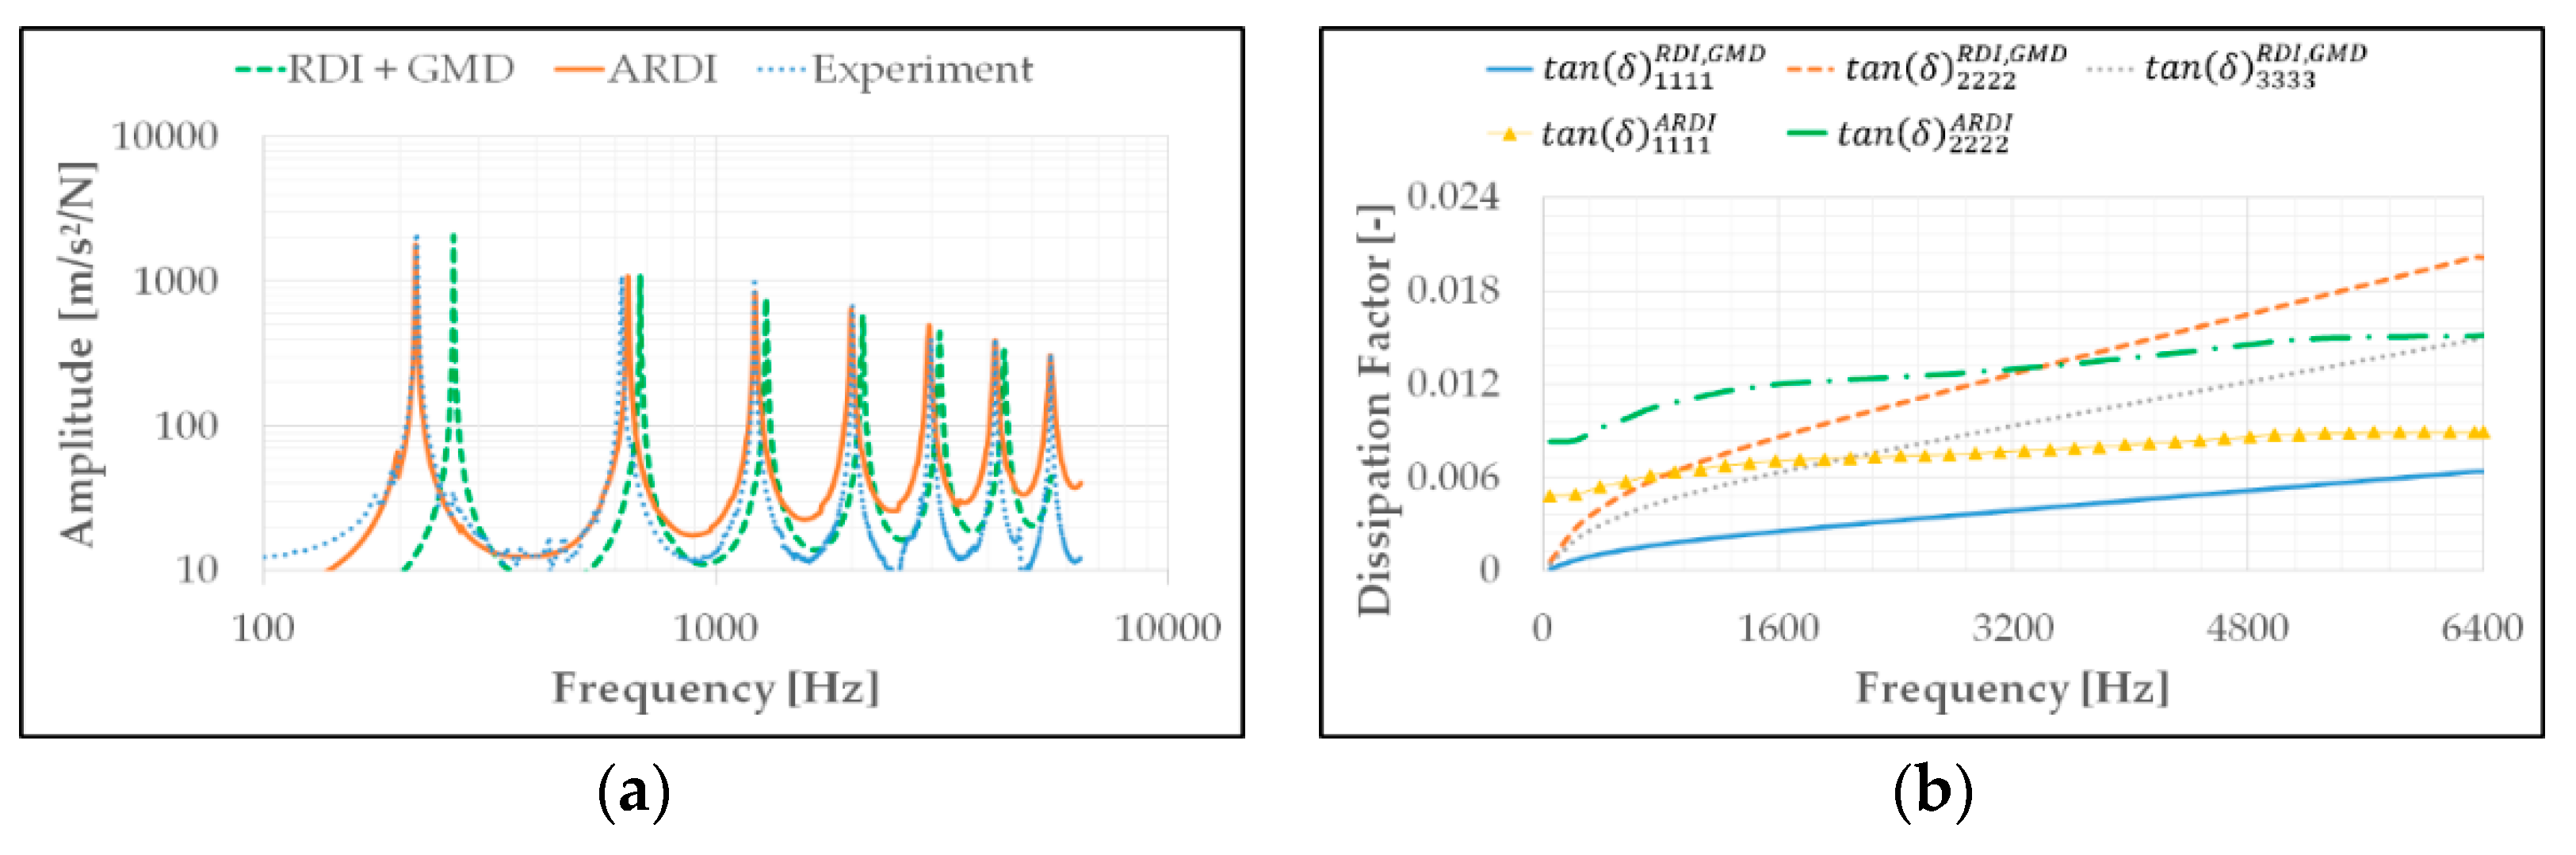
Figure 16a shows the FRF of the RDI model combined with the approach of a GMD behavior.
The RDI model is based on the definition of a homogenized, unidirectional, transversal-isotropic stiffness tensor and does not provide a reconstruction of ODFs for different fiber orientation tensors. As result, the stiffness tensor can only be rotated in discrete spatial directions.
Following, the comparison of the FRF of the RDI model with the experiment shows that the natural frequencies are shifted towards higher frequencies, corresponding to
Figure 16a. This is due to a stiffer behavior of the modelled stiffness tensor of the RDI model compared to the experiments. In structural dynamics, an increase in the stiffness is shown by a shift of the natural frequencies to higher frequencies. This is derived from the resonance-curve method and Equations (34) to (36).
Furthermore,
Figure 16a shows the FRF of the extended ARDI model. Using the MEM to reconstruct discrete ODFs, the effective composite stiffness can be reconstructed very well by the ARDI model. The result is that the ARDI model shows a good agreement of the natural frequencies of the FRF compared to the experiment.
Corresponding to the 3 dB method, the amplitude of the FRF is a parameter to assess the damping of a system. In the present case, both the RDI model with GMD behavior and the ARDI model shows a good agreement of the amplitude of the FRF in comparison with the experiment. The optimization of the GMD behavior has been performed numerically in a reverse engineering approach using Altair HyperStudy software and the FRF of the experiment.
Figure 16b shows the dissipation factors
as ratios of the main entries of the stiffness and damping tensors of the RDI and ARDI model as a function of frequency. The dissipation factors of the RDI model
start uniformly at 0 Hz with a value of 0. After a curved increase a linear course follows with different slopes up to the maximum frequency. The dissipation factor pointing in the main axis direction
is lowest and the dissipation factor perpendicular to the main axis direction
is highest. The dissipation factor in thickness direction
is slightly reduced compared to
.
In comparison, the dissipation factors of the ARDI model do not start with a value of 0 at 0 Hz, whereas the further course is approximately linear to maximum frequency. Furthermore, the dissipation factor in the main axis direction is lowest and the dissipation factor perpendicular to the main axis direction is highest. The dissipation factor in thickness direction is identical to the dissipation factor , due to the used transversal-isotropic behavior.
On the one hand, the comparison shows that the reverse engineering approach is a good method to determine the dissipation factors and thus the components of the damping tensor, if there exists no knowledge about the damping of an entire system. This is shown by a good agreement of the amplitudes of the FRF of the RDI model with GMD behavior compared to the experiment.
On the other hand, the stiffness tensor of the RDI model does not represent a reliable input for the simulation due to a too stiff behavior. This shows the main disadvantage of the reverse engineering approach, it is a pure numerical optimization of the damping behavior based on the defined input of the simulation.
In comparison, the ARDI model provides a material-specific description of the stiffness and damping tensors based on calibration data of bending vibration tests. This is shown by a good agreement of the natural frequencies and the amplitudes of the FRF of the ARDI model compared to the experiment.
6.5. FRFs of ARDI Model
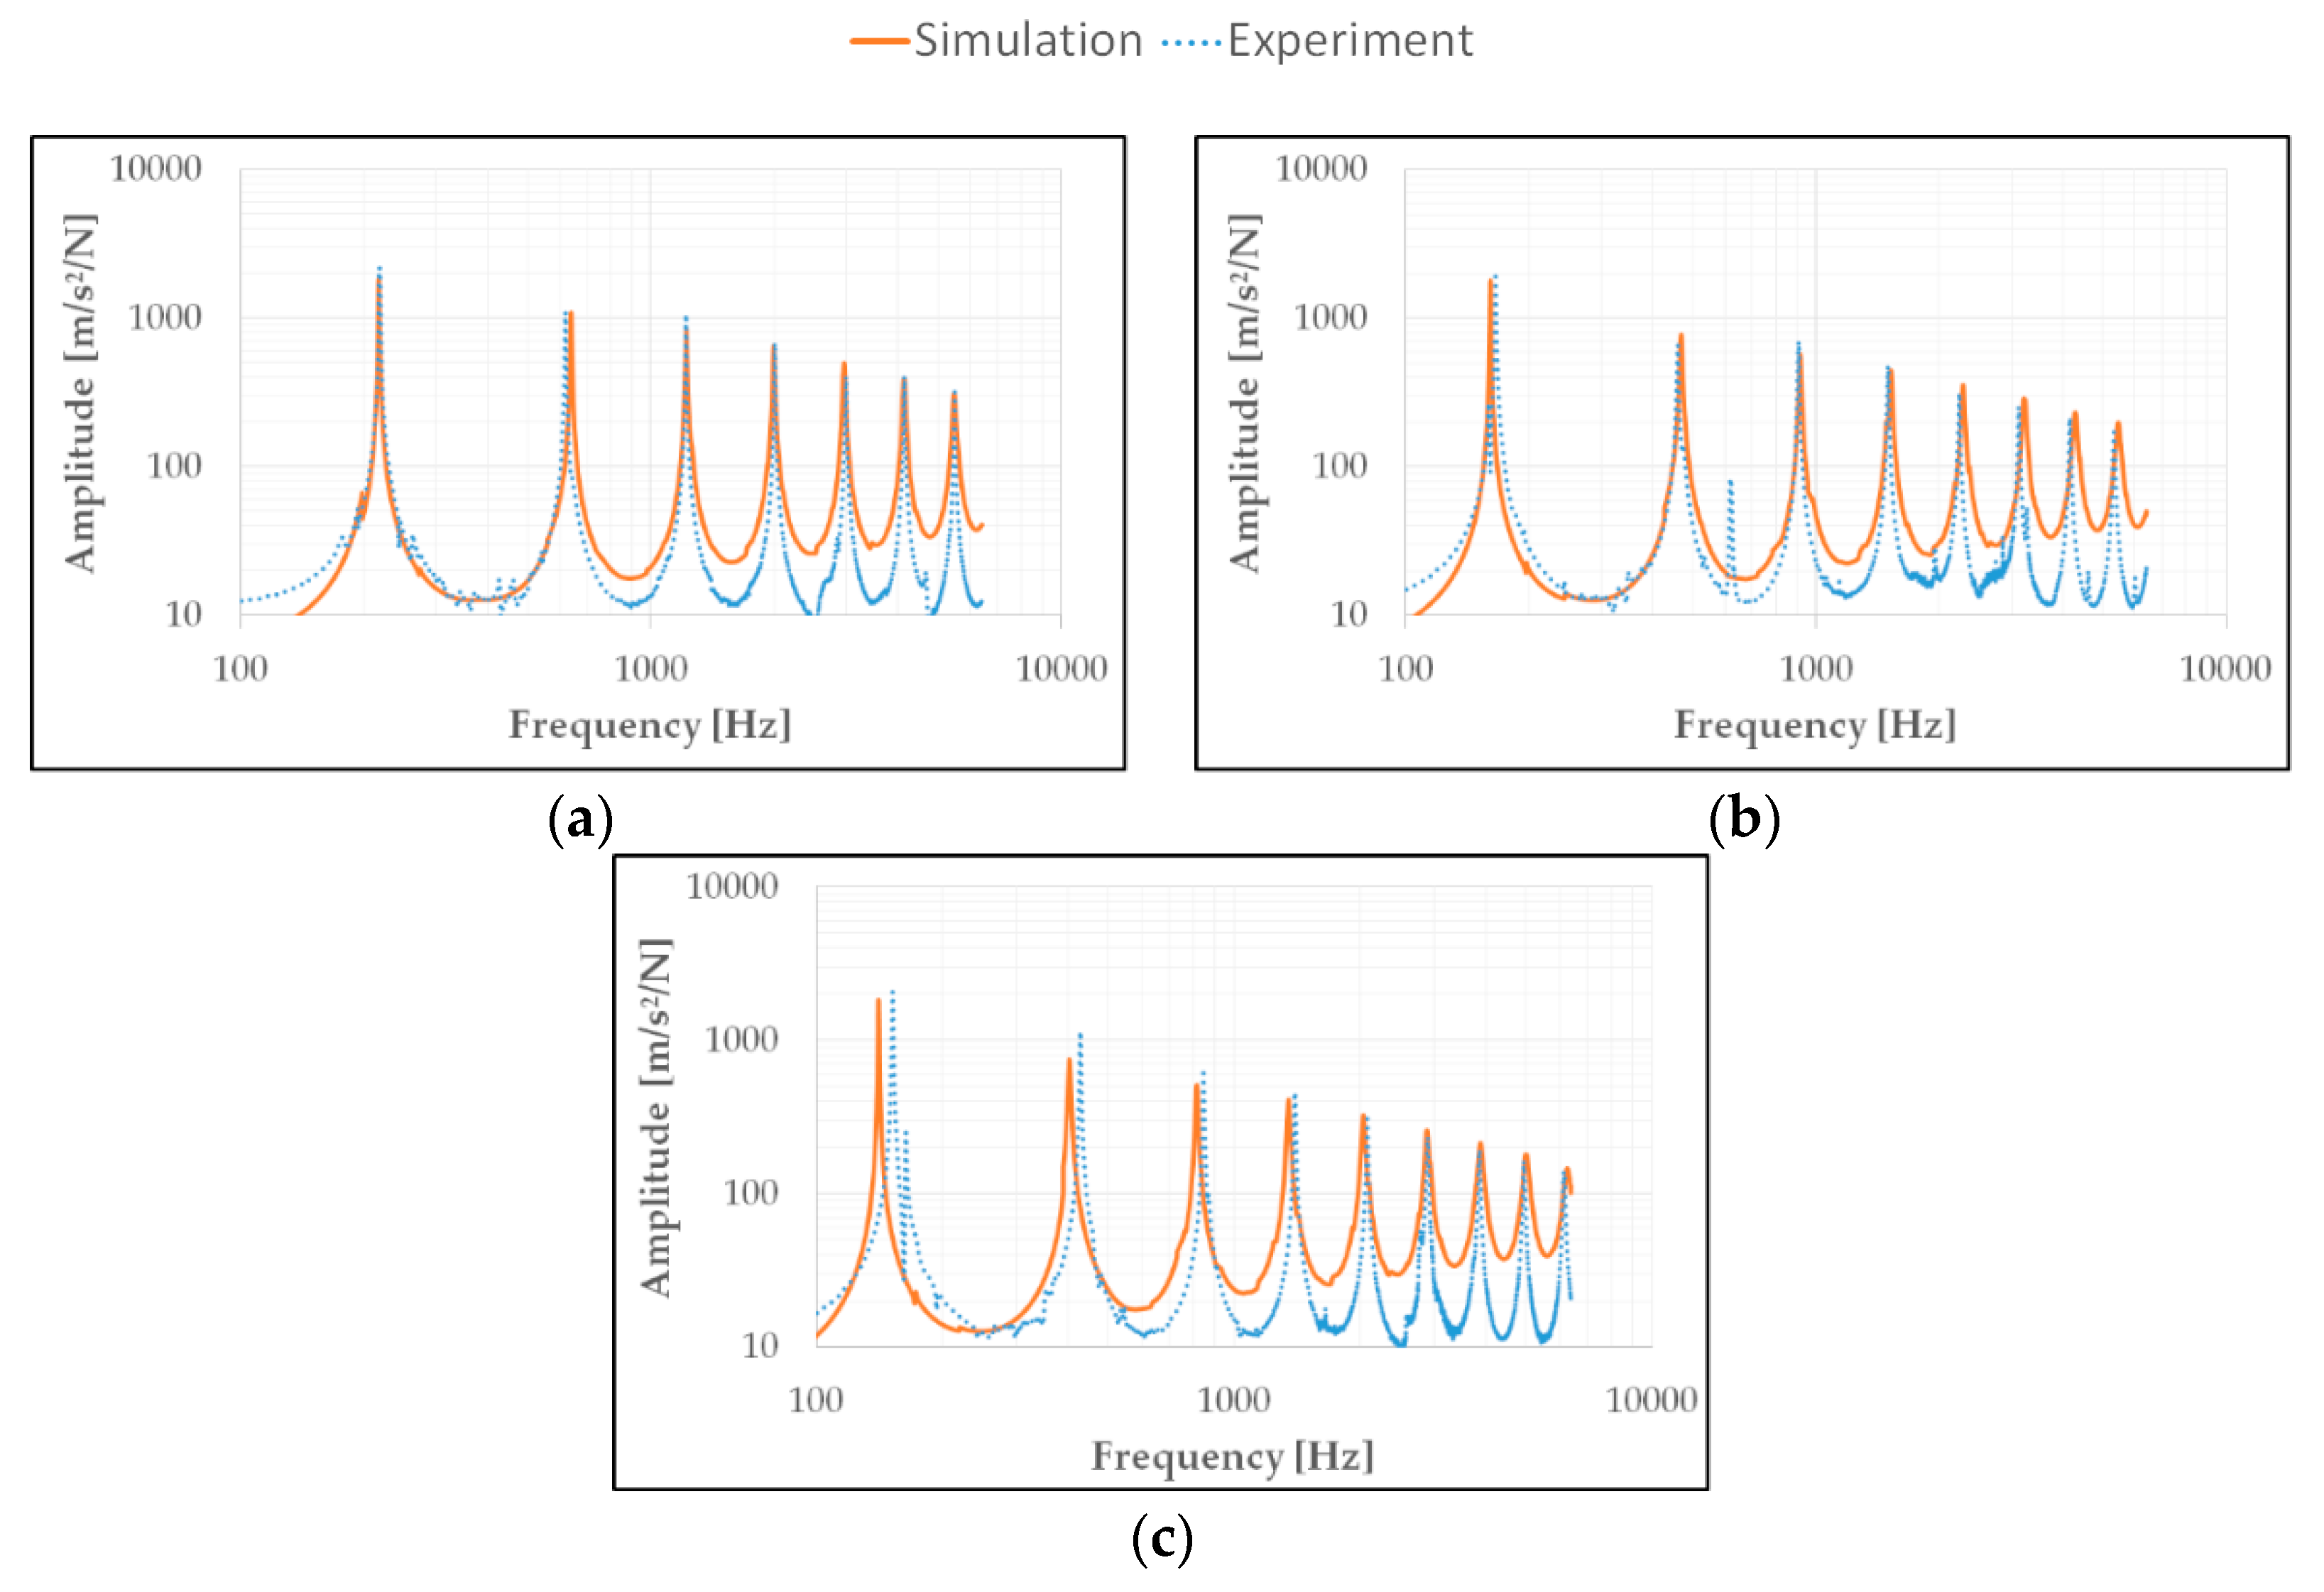
Figure 17 shows the FRF of the IF, MF and CF bending specimens of the PA66-GF30 at 23 °C and 0% rh.
Figure 17 shows that the IF-FRF has the highest stiffness (high natural frequencies). This is due to the high orientation of the fibers in the flow direction of the IF specimens, which correlates with the resulting stiffness. As result, the stiffness of the PA66-GF30 decreases (reduced natural frequencies) with increasing deviation to the IF direction of the material.
Furthermore, the damping increases with increasing deviation of the fibers from the direction of propagation of the vibrations. Energy dissipation in the matrix and at the fibers can be considered as potential physical reason. The more the fibers are transverse to the direction of loading, the more energy is dissipated at the fibers and the interphases. Vice versa, the more fibers in the direction of the vibrations, the lower the damping, since the fibers and interphases act like a vibration conductor. This effect correlates to a number of existing investigations such as [
33,
34]. Corresponding to
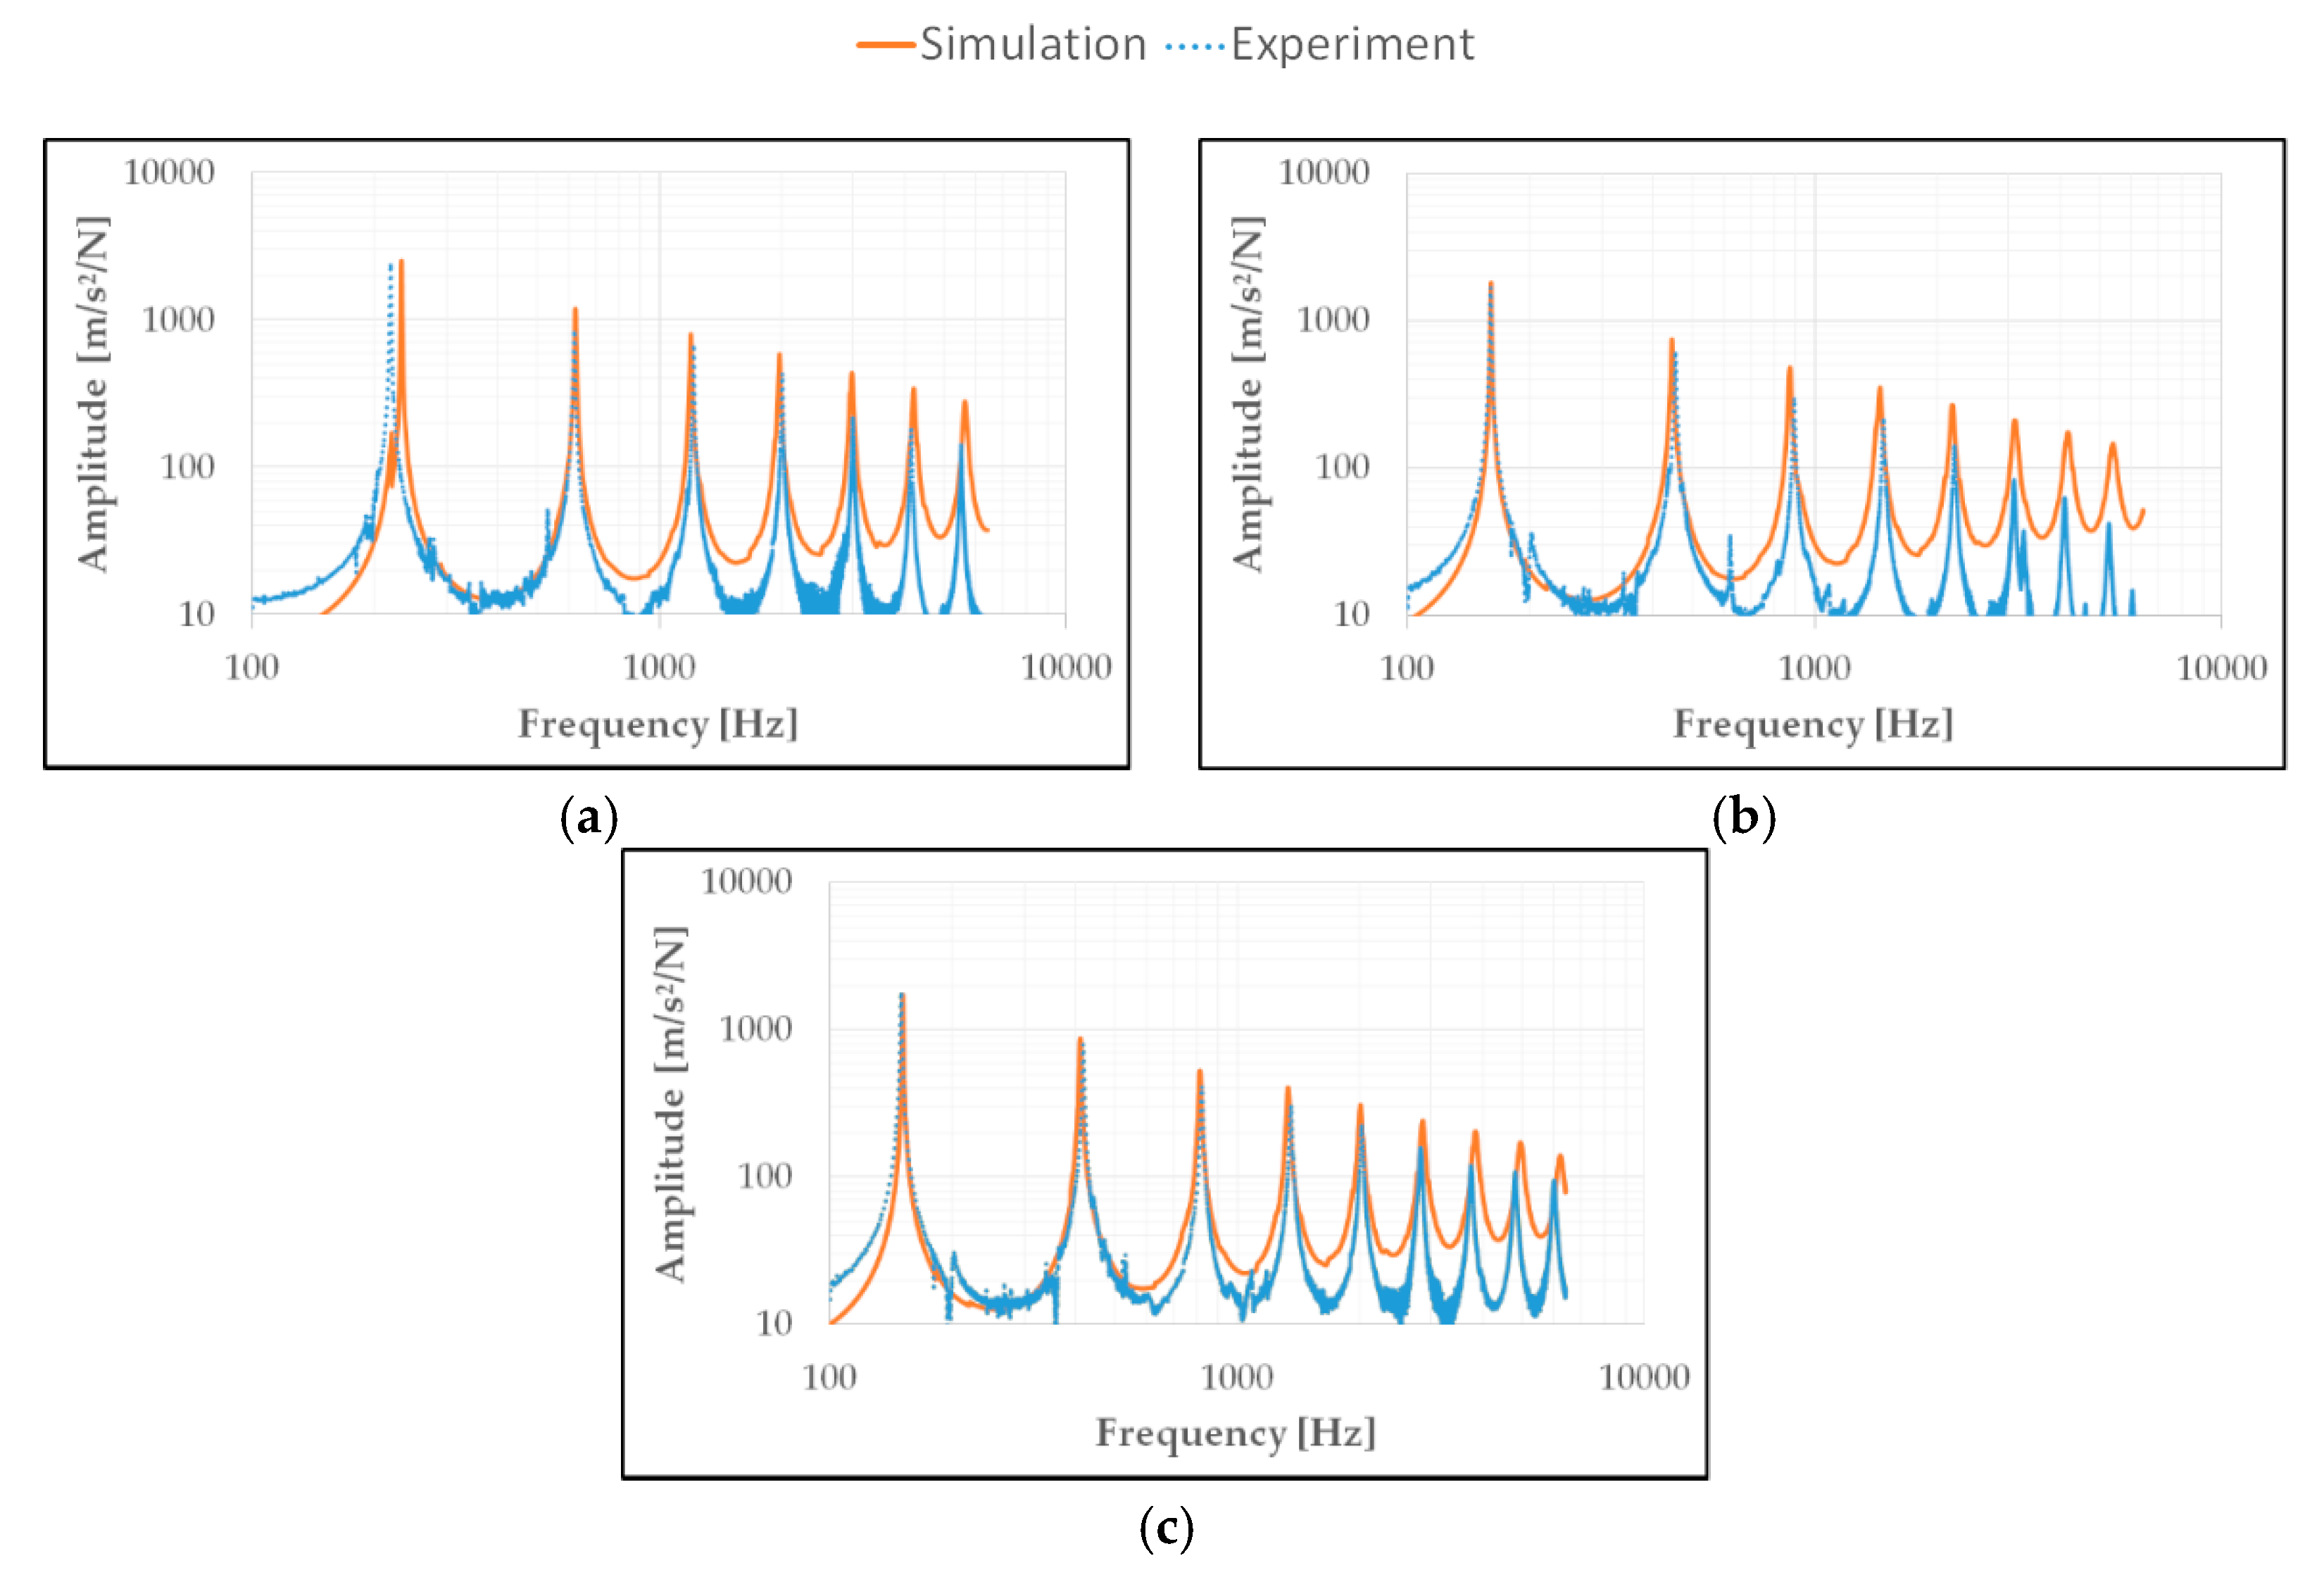
Figure 17, the damping of the PA66-GF30 increases (reduced amplitudes) with increasing deviation to the IF direction. The FRF of the PPA-GF50 according to
Figure 18 shows a similar behavior.
The MF orientation of the PPA-GF50 according to
Figure 18b shows a significant deviation of the amplitude towards higher frequencies and can be traced back to an error during the execution of the bending vibration tests.
Furthermore, all FRFs of
Figure 17 and
Figure 18 show that the oscillation grounds in the simulation are shifted towards higher amplitudes with increasing frequency. This is mainly due to the defined modelling of the damping using the ARDI model with inter- and extrapolation via Prony-series formulation. The evaluation of the damping behavior of the glass fiber-reinforced PA66-GF30, as well as the PPA-GF50, generally tends to a non-linear course of the damping, especially in the direction of higher frequencies.
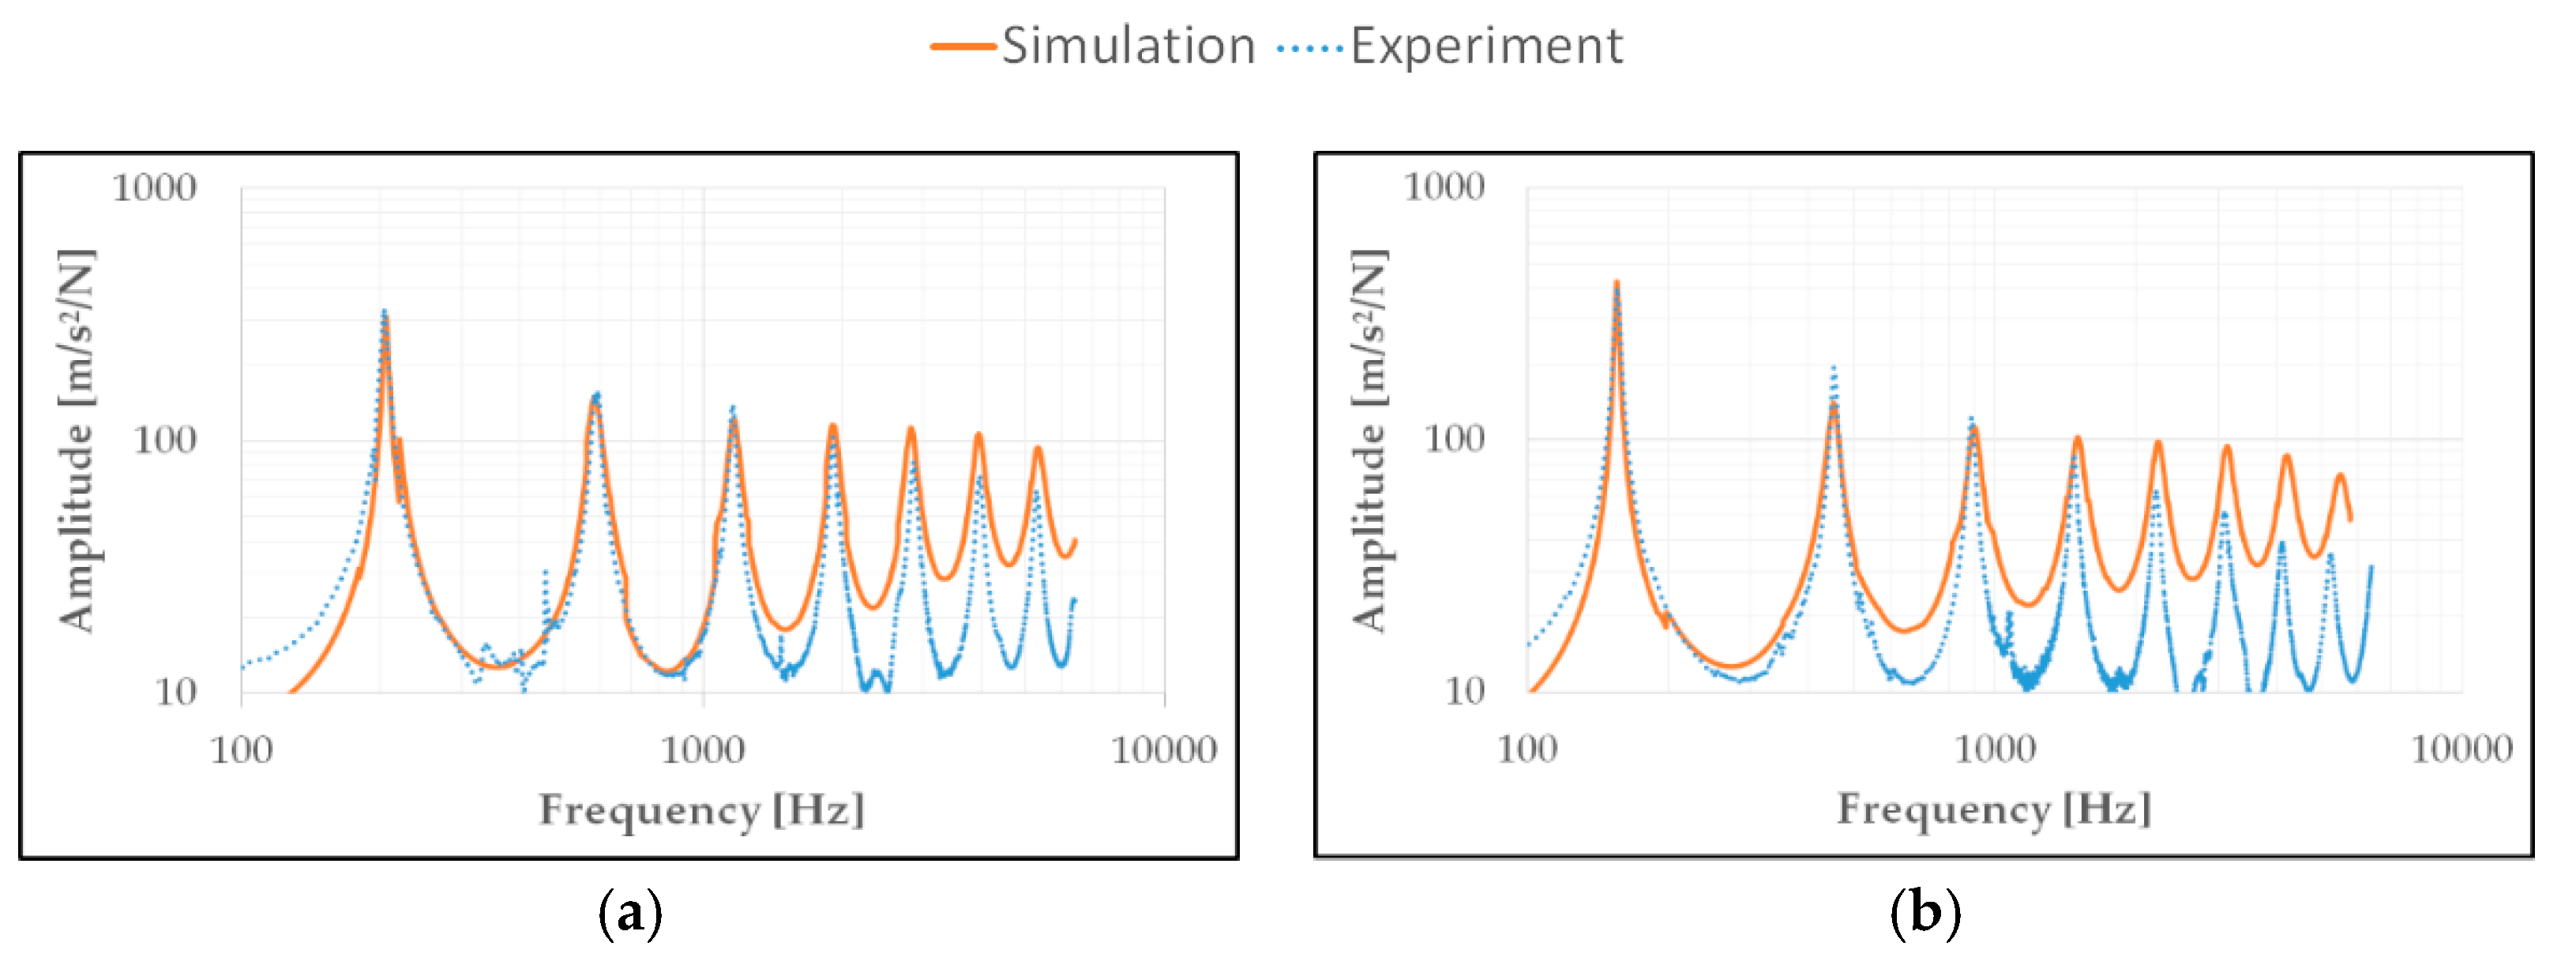
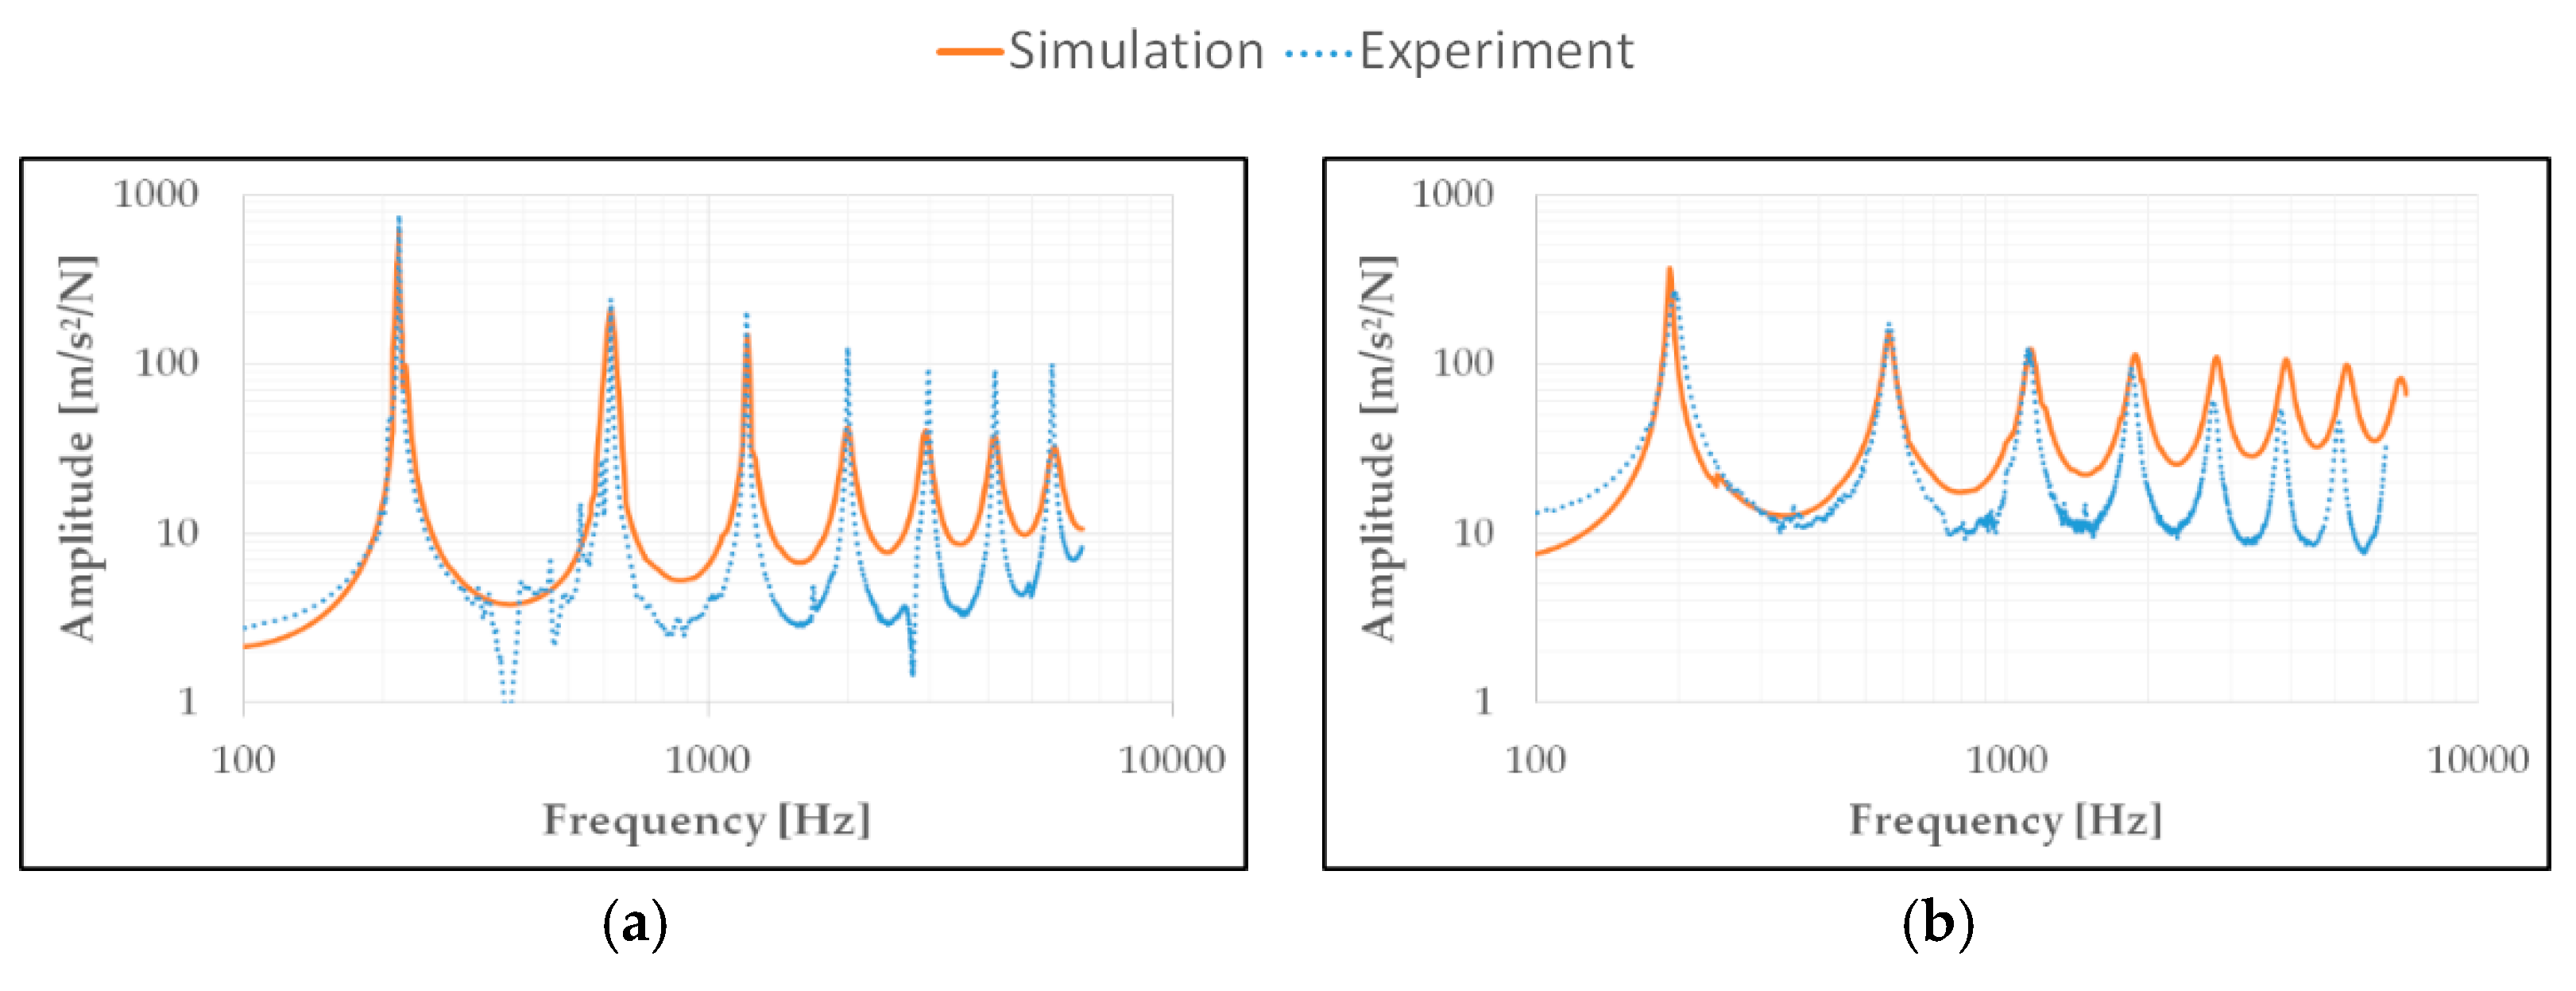
Figure 19 shows the IF-FRF of the PA66-GF30 bending specimens at 23 °C, 50% rh and 130 °C, 0% rh. It shows that an increase in temperature and/or humidity leads to a strong reduction in stiffness (decrease of natural frequencies) and a strong increase in damping (decrease of amplitude). This corresponds to the results of chapter 6.1. In the present case with selected test conditions, the influence of the temperature increase on stiffness and damping is more pronounced than the increase in humidity. The PPA-GF50 shows a similar behavior with an increase in temperature and humidity, according to
Figure 20.
The comparison between the FRFs of the simulation with the ARDI model and the experiments generally shows a good correlation of the natural frequencies up to 6 kHz and a good correlation of the amplitude up to 1 kHz.
The ARDI model is not sufficient above 1 kHz to describe the damping behavior. This applies in particular to an increase in temperature or humidity. This is shown by a strong shift of the oscillation grounds in the simulation with increasing frequency in the direction of higher amplitudes and tends to the assumption, that the damping behavior is nonlinear.
On the other hand, this effect is enhanced by the used calibration method. The ARDI model have been calibrated with the stiffness and damping of the pure matrix material. However, due to the increased humidity and temperature, only a small number of natural frequencies can be evaluated with the usage of the resonance-curve method and the 3 dB method below 1 kHz. Higher frequency ranges are too noisy and do not provide acceptable values for the stiffness and damping. Consequently, the linear extrapolated stiffness and damping tensors are not sufficient to describe the structural dynamics behavior on the use of the ARDI model.
7. Conclusions
In the present work, the novel ARDI model for the description of the anisotropic, viscoelastic stiffness and damping of short glass fiber-reinforced thermoplastics has been presented.
The comparison between simulation and experiment of the FRF of an IF-, MF- and CF-bending specimen of the PA66-GF30 and PPA-GF50 shows in general a sufficient correlation of the natural frequencies and the amplitudes. Thus, the ARDI model is in general able to predict the frequency-, temperature- and humidity-depending stiffness and damping of short glass fiber-reinforced thermoplastics.
At higher frequencies, the linear inter- and extrapolation of the experimentally determined damping results in a shift of the oscillation grounds to higher amplitudes and thus in a significant deviation from the experiments. This effect is more pronounced with an increase in humidity and temperature and tends to the assumption, that the damping behavior is nonlinear. Due to the small number of investigated conditioning states, a nonlinear course of the damping can only be assumed as possible reason for the deviation of the structural dynamics behavior.
Taking into account that the properties of the composite are homogenized from the properties of the matrix, the fibers and the interphase and the resulting composite properties are linearly inter- and extrapolated, the ARDI model provides a good prognosis for the structural dynamics of short glass fiber-reinforced thermoplastics.
Further investigations concentrate on the execution and evaluation of bending vibration tests with a larger variation of humidity and temperature gradients. These tests form the basis for reconsidering the formulation of the stiffness and damping tensors of the ARDI model.


