Article

A Study of the Interlaminar Fracture Toughness of Unidirectional Flax/Epoxy Composites

1
Mechanical Engineering Department, École de technologie supérieure, 1100 Notre-Dame West, Montreal, QC H3C 1K3, Canada
2
Mechanical Engineering Department, Université du Québec à Trois-Rivières (UQTR), 3351 Boul. des Forges, Trois-Rivières, QC G9A 5H7, Canada
3
McGill University, 845 Sherbrooke Street West, Montreal, QC H3A 0G4, Canada
*
Author to whom correspondence should be addressed.
Submission received: 14 May 2020 / Revised: 2 June 2020 / Accepted: 2 June 2020 / Published: 5 June 2020
(This article belongs to the Special Issue Characterization and Modelling of Composites)

Abstract

:
Having environmental and economic advantages, flax fibers have been recognized as a potential replacement for glass fibers as reinforcement in epoxy composites for various applications. Its widening applications require employing failure criteria and analysis methods for engineering design, analysis, and optimization of this material. Among different failure modes, delamination is known as one of the earliest ones in laminated composites and needs to be studied in detail. However, the delamination characteristics of unidirectional (UD) flax/epoxy composites in pure Mode I has rarely been addressed, while Mode II and Mixed-mode I/II have never been addressed before. This work studies and evaluates the interlaminar fracture toughness and delamination behavior of UD flax/epoxy composite under Mode I, Mode II, and Mixed-mode I/II loading. The composites were tested following corresponding ASTM standards and fulfilled all the requirements. The interlaminar fracture toughness of the composite were determined and validated based on the specific characteristics of natural fibers. Considering the variation in the composite structure configuration and its effects, the results of interlaminar fracture toughness fit in the range of those reported for similar composites in the literature and provide a basis for the material properties of this composite.

1. Introduction

In the recent past decades since the 1990s, the increasing public environmental awareness and commencement of new legislation are demanding more sustainable and ecologically efficient products [1,2,3,4,5,6,7]. Synthetic glass and carbon fiber-reinforced polymer composites (FRPCs) have high performance and are extensively applied in different industrial sectors, but they are not environment-friendly [7,8,9]; thus, environmentally sustainable replacements are required. Numerous research efforts have been dedicated to finding a sustainable substitute for synthetic FRPCs, and have confirmed that plant-based natural fiber-reinforced polymer composites (NFRPCs) are the most promising alternatives (to petroleum-based FRPCs) for many applications [2,3,5,10,11,12,13,14,15,16,17]. Having many advantages over man-made FRPCs such as improved sustainability and competitive properties at a lower cost, NFRPCs have attracted much attention worldwide and have penetrated the composites world with a rapidly extending industrial applications from packaging to structural construction components [1,6,13,16,18,19,20,21]. Replacing the engineered FRPCs with fully biodegradable composites is not yet an economically and mechanically desirable solution in many applications; nevertheless, the synthetic polymers reinforced with natural fibers to produce economic and partially biodegradable composites can cover the requirements of a wide variety of applications and have been a viable alternative for petroleum-based FRPCs [5,7,22]. For example, flax, hemp, and ramie fibers, placed within the category of plant-based bast fibers, are the most widely used reinforcement in NFRPCs, offering comparable mechanical properties to glass fiber-reinforced polymer composites (GFRPCs) [10,19,23,24,25]. Among them, flax fibers have excellent performance, and many manufacturers are interested in using them in NFRPCs for various applications [8,12,17,26,27,28,29,30,31,32,33,34,35,36]. Also, epoxy resin, a thermoset polymer matrix, offers high mechanical performance and durability and is the most commonly used matrix to produce flax fiber-reinforced polymer composites (FFRPCs) [29]. Furthermore, the application of a unidirectional (UD) or optimally woven reinforcement structure is a primary factor in maximizing the structural performance of FFRPCs [37,38]; therefore, UD flax fiber-reinforced epoxy composites (FFRECs) are of outstanding importance and are used ubiquitously in the industry.
There are, however, some downsides to extending their application field, for instance, workpiece defects in the machining process, required for complex components, and in-service degradation when exposed to a humid (harsh) environment [6,28]. Accordingly, FFRECs have been the subject of several pieces of research, trying to explore their properties and enhance their performance and durability to resolve these drawbacks, aiming at facilitating their applications [2,29,32,39,40,41,42].
One of the commonly observed and major damage phenomena in laminated composites is the separation of two adjacent laminae (plies), which is known as interlaminar failure or delamination damage. This failure mode is the primary challenge for the laminated FRPCs that generally affects the in-service functionality of the component by reducing its overall stiffness and load-bearing capacity and subsequently leading to the failure of the entire component [43,44,45]. It might form through the production process and exist as a defect in the composite, occur under different loadings and environmental conditions, or incur during machining operations, particularly drilling [46,47,48]. In fracture mechanics, the interlaminar failure, according to the relative displacement of crack surfaces, has been classified into three fracture modes: opening or tensile mode (Mode I), in-plane shear or sliding mode (Mode II), and out-of-plane shear or tearing mode (Mode III) [43,49]. Figure 1 [49] illustrates the crack propagation caused by different modes of failure and the corresponding loadings acting on the cracks. Delamination can initiate and propagate due to any of these fracture modes or any combinations of them (mixed modes).
The resistance of the material to crack propagation, or to delamination damages in composite laminates, is known as interlaminar fracture toughness (IFT) [49]. The Linear Elastic Fracture Mechanics (LEFM) approach, initially developed for isotropic materials, has been successfully adopted and applied as a practice to characterize the IFT of the laminated FRPCs [50,51]. For fracture analysis, LEFM assumes an elastic material behavior for the whole body, except for a contained damage zone around the crack tip (which is a provision for the validity of the results). The IFT is a fundamental material property and can be determined based on either the Stress Intensity Factor (KC) or the Critical Strain Energy Release Rate (GC) of the material; the latter is commonly named Interlaminar Fracture Energy (IFE). They are, respectively, a measure of the stress intensity level and energy required for an increment of the crack growth [49]. For the isotropic, homogeneous, and relatively brittle metallic materials, IFT depends on the energy dissipation at the crack tip and can be characterized by KC. However, for FRPCs, the stress field in the vicinity of the crack tip is more complicated, and IFT is affected by the result of energy losses of different failure mechanisms such as matrix cracking, fiber fracture, fiber pullout, and fiber-matrix debonding [50,52]. Therefore, GC is commonly used for the determination of IFT and the study of delamination in FRPC laminates for different failure modes [44,52,53,54,55]. By comparing the energy release rate (G) for a loading case to the GC of the material, the capability of the body to resist crack extension can be assessed.
Ever-growing applications of laminated NFRPCs and their penetration into structural applications, as well as the vital role of delamination in these composites, necessitate the investigation of the interlaminar fracture behavior and determination of IFE of these materials. IFT, as a primary property of a material, is required for engineering design purposes as well as numerical analysis methods such as the Finite Element Method (FEM). The interlaminar fracture of the synthetic FRPCs under different modes of failure has been extensively investigated, and its state of the art has been comprehensively reviewed by many authors [43,44,50,52,56]. However, in the literature, limited work has been documented addressing the interlaminar fracture behavior of the laminated NFRPCs, particularly FFRECs that show better toughness [57]. Wong et al. [58] studied the influence of polymer modification on IFT of a randomly oriented-flax/poly(L-lactic acid) composite and noted that by adding hyperbranched polymers (HBPs) to the matrix, GIC of the composite significantly increased: from 38.9 J/m2 for the original composite to 115 J/m2 for the composite with the highest volume of HBP. Investigating the properties of a hybrid flax/glass UD-fabric (twisted flax yarns) reinforced phenolic resin composite, Zhang et al. [59] measured GIC = 550 J/m2 for flax composite that increased by hybridization to 560 J/m2 for [(flax/ glass)n]s composite. Their study shows that adding off-center plies of different fibers to the laminate will change the IFT, although the delamination is happening between the same type of composite plies. Li et al. [60] investigated the effect of fiber surface treatment on the fracture properties of sisal-fabric/vinyl-ester composites with a fiber volume fraction (Vf) of around 32% (Vf ≈ 0.32) and observed significant improvements in fracture energies of Mode I (GIC) and small increases in that of Mode II (GIIC) in comparison to the untreated system. While GIC of the permanganate-treated fiber experienced the most significant improvement. The authors followed ASTM D5528 and measured the GIC values of 320.5/1158.7 [888.0/1682.2] J/m2, and GIIC values of 2141.0 [2384.7] J/m2 for the crack initiation/propagation of untreated and [permanganate-treated] sisal composites. In an experimental study, Chen et al. [45] investigated the potential of carbon nanotube buckypaper interleaf for improving the IFT of flax-fabric/phenolic resin composites with Vf ≈ 0.73. They followed ASTM D5528 and tested some partially and fully interleaved laminates at the mid-plane as well as laminates without interleaf for IFT. They observed a 26% [22%] and 29% [51%] increase in initiation GIC, and [propagation GIC], respectively, for partially and fully interleaved composite in comparison to those of the original one (≈4.4 and [≈5.6] kJ/m2) and related them to the extensive favorable fibrillations observed in the interleaved laminates. Trying to enhance the IFT of flax-fabric/epoxy composite of Vf = 0.60, Li et al. [61] interleaved them at the mid-plane with chopped flax yarns of different lengths and content and followed ASTM D5528 to evaluate their GIC. The authors observed a 4% to 31% improvement in the propagation GIC, with the maximum increase for the moderate length and content of the chopped yarns, compared to that of the original composite, GIC =1.40 kJ/m2. It should be noted that they have used Modified Compliance Calibration method but have stated that used Modified Beam Theory (MBT). Ravandi et al. [62,63,64] conducted experimental investigations, according to ASTM D5528, and numerical analysis, using FEM, to study and predict the effects of through-the-thickness stitching and reinforcement architecture on the GIC of the UD (Vf ≈ 0.31) and woven fabric (Vf ≈ 0.40) FFRECs. The authors tested double cantilever beams (DCBs), according to ASTM D5528, to determine the GIC of the FFRECs as well as UD-glass/epoxy (Vf = 0.60) composites, and observed that average GIC of the UD-glass/epoxy was less than half of that of unstitched UD-FFRECs (GIC ≈ 1.3 kJ/m2). Also, their findings showed that the average GIC value of the UD-FFREC was three times lower than that of woven-FFRECs (GIC ≈ 3.2 kJ/m2), and generally, stitching with flax yarns induced continuous improvement in IFT of the laminates, increasing with stitch areal fraction to a maximum of 21% for the highest investigated level (of aerial fraction). Besides, they reported that their FEM results agreed with the experimental ones giving the GIC values of 0.771 and 1.25 kJ/m2, respectively, for the crack initiation and propagation of UD-FFRECs as well as 0.671 kJ/m2 for the GIC value of glass/epoxy composite. Bensadoun et al. [57] tested some FFRECs reinforced with seven different fiber configurations; i.e., one plain weave, two twill weaves (low/high twist), a twisted-yarn-fabric cross-ply and an untwisted-fiber cross-ply architecture (cross-ply laminates were tested in both 0°/90° directions), to investigate the effect of the reinforcement architectures on the GIC and GIIC of the composites with Vf = 0.40. In terms of delamination fracture, their composites with untwisted-fiber cross-ply reinforcement denoted as UD [90,0], has a 0°/0° ply interface at the mid-plane of the laminate and is the closest one to the UD-FFRECs assessed in the current study. They reported initiation GIC values between 457 J/m2 for plain woven and 777 J/m2 for twisted-yarn-fabric cross-ply composite when tested in [90,0] direction, as well as GIC = 496 J/m2 for UD [90,0] tests. While the propagation values of GIC vary from 663 J/m2 for UD [90,0] to 1597 J/m2 for the low-twist twill-woven composites. Besides, they obtained GIIC values between 728 J/m2 for UD [90,0] and 1872 J/m2 for plain weave laminates. The authors named the cross-plied twisted-yarn-fabric (with 90% of yarns in longitudinal direction and 10% along the transverse direction) and the UD-untwisted-fiber architecture respectively “quasi-UD” and “UD” architecture, whereas, their interlaminar fracture behavior could be different with those of UD laminates, where all plies lay in one direction. Therefore, the results may not coincide exactly with the results of UD laminates. In two different works, Almansour et al. reported their findings of the effect of water absorption on the GIC [47] and GIIC [48] of the woven flax (Vf = 0.31) and woven flax/basalt (basalt plies in the skin of the laminates and overall Vf = 0.33) reinforced vinyl-ester composites in [±45°] arrangement. Their DCB test results showed that upon immersion in water, the initiation and propagation GIC of the flax/vinyl-ester, as well as the initiation GIC of flax/basalt hybrid composites, decreased by 27%, 10%, and 23%, respectively. In contrast, the propagation GIC of flax/basalt hybrid composites increased by 15%. They have documented the average initiation/propagation GIC values of 3870/12093 J/m2, and 4431/9738 J/m2, respectively, for flax and flax-basalt hybrid composites in dry condition. The concerning issue in this study is that the crack did not propagate in the mid-plane of the laminate and deviated from that by crossing the layers; it thus cannot be considered a pure interlaminar failure. Along with the high GIC value of vinyl-ester (410 J/m2 compared with 69–150 J/m2 for epoxy [57]), this might be another reason for higher measured values of IFT. Also, in spite of the increase in initiation GIC, it seems that for the flax/basalt hybrid composites, the shorter final deviated-crack growth combined with the ever-increasing R-curve resulted in a smaller propagation GIC. Whereas, comparing the propagation GIC associated with the last crack length exhibited by the hybrid composites with that of flax composite, an increase in propagation GIC can be observed. In terms of GIIC values, testing end-notched-flexure (ENF) specimens, the authors observed that hybridization by basalt fibers (adding basalt composite plies to the skin of the flax laminates) improved the initiation GIIC value of flax composite by 58%; also, moisture absorption improved the initiation GIIC of flax composite by 29% and that of hybrid composite by 20%, due to improved matrix ductility. Their published average initiation GIIC values for the dry flax and flax/basalt hybrid composites are 253 J/m2, and 400 J/m2, respectively. Nevertheless, considering that the basalt plies are located at the surface of the laminate, while the IFT is being evaluated between flax plies at the mid-plane, the basalt layers have the same function that the stiffeners (bonded as tabs to the skin of DCB and ENF test specimens to avoid large deformations and specimens arm failure) used by some researchers measuring the IFT of flax composites have [57,62,63,64,65]. Accordingly, the findings of these studies show that the stiffeners affect the values of both Mode I and Mode II IFT, which contradicts the assumption of these researchers. As a result, stiffening the arms of the DCB and ENF specimens will affect the IFT values and is not a proper solution, instead, increasing the thickness or changing the initial crack length to improve the specimen stiffness seems desirable, as recommended by the corresponding ASTM standards [53,54]. Trying to improve the IFT of UD-flax/gliadin composites, Vo Hong et al. [65] investigated the influences of some processing conditions, fiber surface treatment, and matrix plasticization on IFT by fabricating and testing flax/gliadin composite laminates with Vf = 0.40. Testing the original composite DCB specimens according to ISO 15024 standard, the authors reported GIC = 50 to 100 J/m2 and GIC = 450 to 550 J/m2, respectively, for crack initiation and propagation measurements. Their findings show that the optimum value of IFT, GIC ≈ 1000 J/m2, was obtained with a combination of all of the investigated processing and materials parameters, i.e., fiber treatment, adding glycerol to the matrix, and medium cooling rate. Rajendran et al. [66] investigated the behavior of twill-weave flax/epoxy composites in Mode I and Mode II delamination (no Vf reported). The authors tested DCB and ENF specimens and, following the experimental calibration method (ECM), calculated a GIC = 485 J/m2 and GIIC = 962 J/m2 for the composite. In another report [67], they published their findings of the Mode I, Mode II, and Mixed-mode I/II interlaminar fracture toughness of the same composite with Vf ≈ 0.44. In this work, they followed ASTM D5528 and D7905 standards and tested standardized DCB and ENF specimens to determine the IFT in Mode I and Mode II, respectively, while, they tested single-leg-bending (SLB) specimens, which is not standardized, to measure the Mixed-mode I/II fracture toughness (G(I/II)C). Their obtained values in this recent report are GIC = 363 J/m2, GIIC = 962 J/m2 and G(I/II)C = 649 J/m2 (for a G I I / ( G I + G I I ) = 0.43), which shows a discrepancy in GIC value for the same material from two different reports. In a recent study, Saidane et al. [68] used the acoustic emission (AE) method to investigate the Mode I fracture toughness of flax, glass, and hybrid flax/glass woven-fiber/epoxy composites, flax laminates had a Vf = 0.40. They conducted DCB tests according to ASTM D5528 standard but used AE to detect the onset of delamination and the corresponding critical load to calculate GIC. The initiation GIC values of 1079 J/m2, 945 J/m2 and 923 J/m2 were determined respectively for flax, hybrid flax/glass and glass composites. Nevertheless, the method used in this work to detect the delamination initiation and the corresponding critical load used in calculation of GIC influences the obtained values, thus, this fact should be considered when using the results for comparison purposes. The interesting point in this study is that the propagation GIC value of flax composites (R-curve) continuously increased with delamination length which contradicts the findings of previously cited studies, including those of Zhang et al. [59] for the similar materials which show a stabilized plateau value after a certain crack length. Also, their findings for hybrid flax/glass composites regarding the behavior of R-curves and the decrease in GIC is in contrast with those of Zhang et al. [59] for the similar materials.
As summarized above, the literature review shows that the previous works addressing the IFT of flax composites have mostly studied flax-fabric reinforced composites, while few researchers investigated UD-FFRECs and only in Mode I [62]. Also, to the knowledge of the authors, no study has, in particular, investigated their delamination behavior in Mode II and Mixed-mode I/II. Therefore, the damage tolerance and behavior knowledge of UD-FFRECs, as the basic building block of the FFRECs, particularly in Mode II and Mixed-mode I/II are missing. This is of paramount importance in using flax/epoxy composites in recently demanded structural applications as well as employing widely-used and reliability-proven FEM numerical analysis method to study this environmentally and economically-advantageous and ubiquitously used material. Consequently, an in-depth understanding of their delamination behavior in different modes is essential both for improving their material properties and for generating demanded knowledge and mechanical properties in the engineering design field and for future studies employing analytic and numerical resolutions. Because of the variations in the fabrication processes, origins and properties of raw materials, and the mechanical properties evaluation methods of these composites, the use of well-defined and precisely controlled uniform composites as well as standard test methods is a pre-requisite to achieve reliable results.
The aim here is to investigate the interlaminar fracture behavior of the UD-FFRECs in three different modes of failure, namely, Mode I, Mode II, and Mixed-mode I/II and determine the corresponding interlaminar fracture toughness. For this purpose, UD-FFRECs are fabricated using identical raw materials and processing techniques with a precisely controlled fiber volume fraction. The commonly used ASTM standard test procedures are followed to evaluate the composites under different modes of loading to determine their IFT and produce valid and reliable data by respecting the defined validity criteria.

2. Materials and Methods

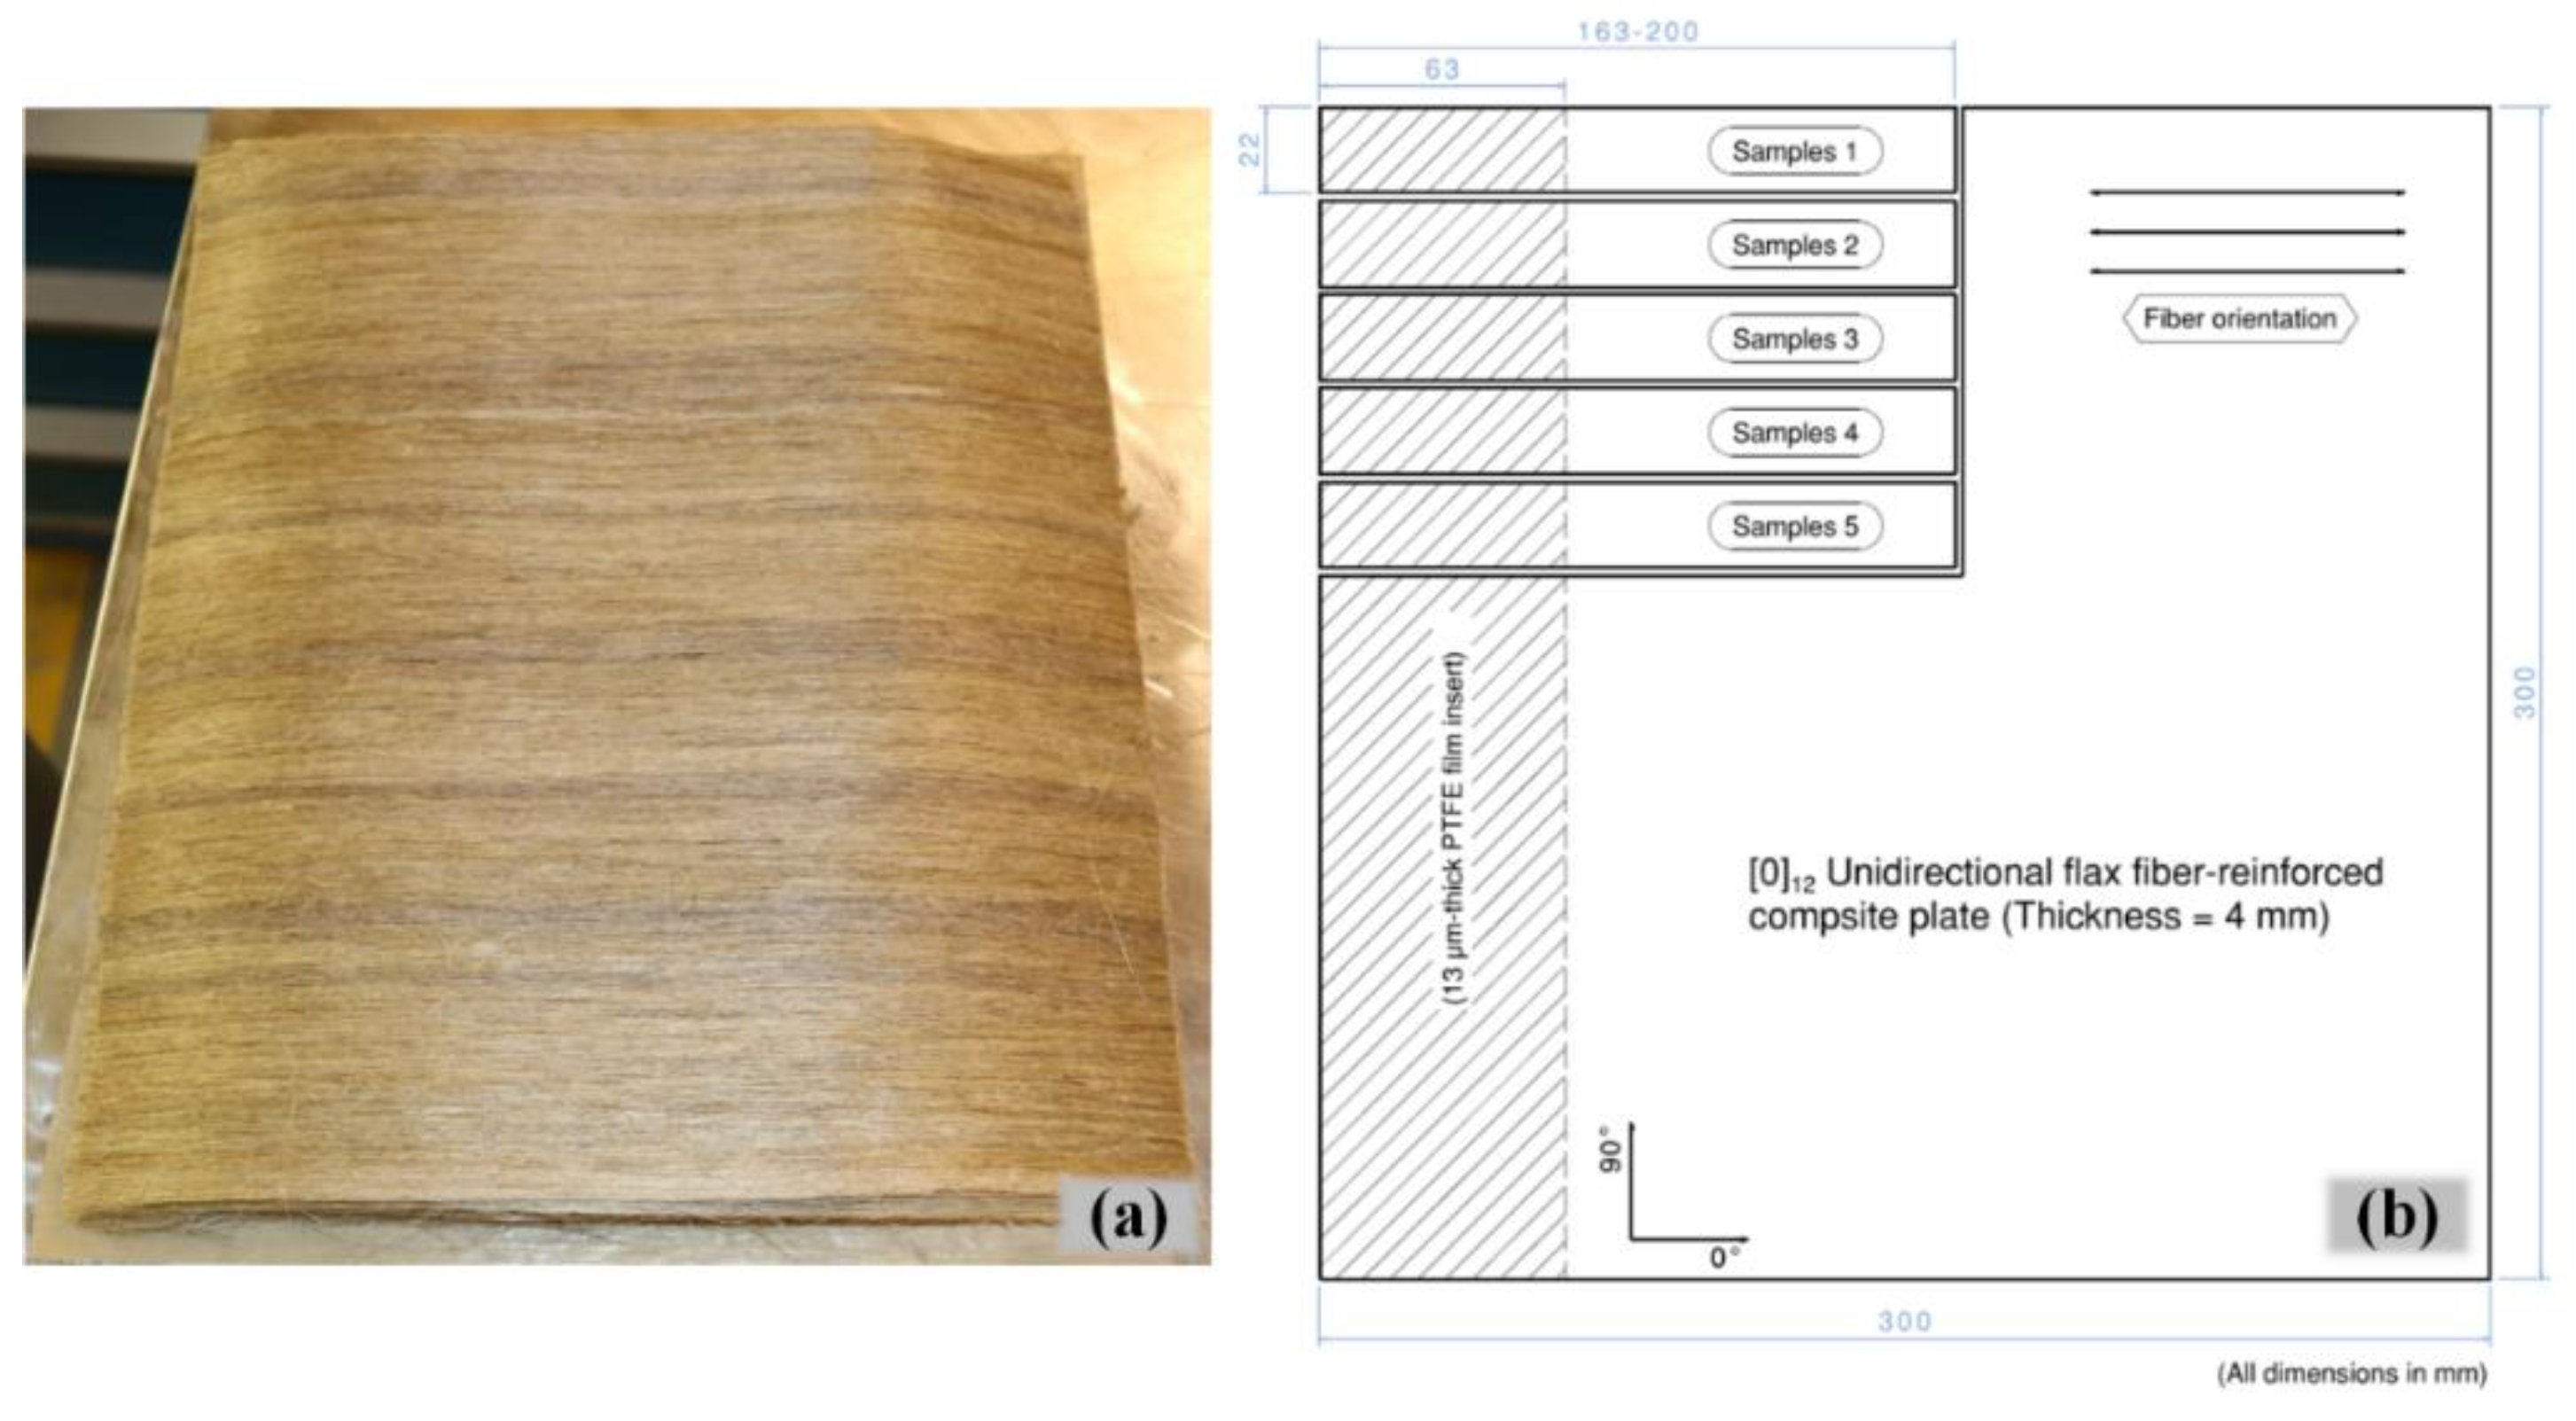
2.1. Material System and Test Specimen Preparation

Unidirectional tapes of flax fibers, FLAXTAPE 200 (from LINEO, Valliquerville, France, https://eco-technilin.com), with an areal density of 200 gr/m2, were cut in 300 mm × 300 mm dimensions and stacked up to form the UD reinforcement preform, Figure 2a. The thermosetting Marine 820 Epoxy System, mixed with 18 Wt.% Marine 824 hardener (from ADTECH® Plastic Systems, Madison Heights, MI, USA, www.axson-technologies.com), was used to impregnate the fibers employing the resin transfer molding (RTM) process. The number of layers in [0]n layup and the thickness of laminates were accurately computed according to the ASTM D3171 procedure and controlled to result in a unique Vf of 41% for all composite plates and meet the requirements of the employed ASTM test procedures regarding the thickness of test specimens. In order to induce a pre-crack as the initiation site for delamination, a 13 µm-thick polytetrafluoroethylene (PTFE) film, was accommodated on the mid-plane of the laminate during layup of the preform; the schematic view of the plate including the insert film is shown in Figure 2b.
After fabrication and post-curing of the composite laminate, the PTFE film was located via X-ray imaging, and the laminate was trimmed to reach the dimension of the insert that is recommended by the ASTM standards, as shown in Figure 1b. Next, the rectangular UD-laminated composite specimens with uniform thickness and containing a PTFE non-adhesive insert at one end on the mid-plane were cut to their desired dimensions by a 10-inch/90-tooth, DIABLO’s cutting saw blade with high-density carbide tooltips, as illustrated in Figure 2b.

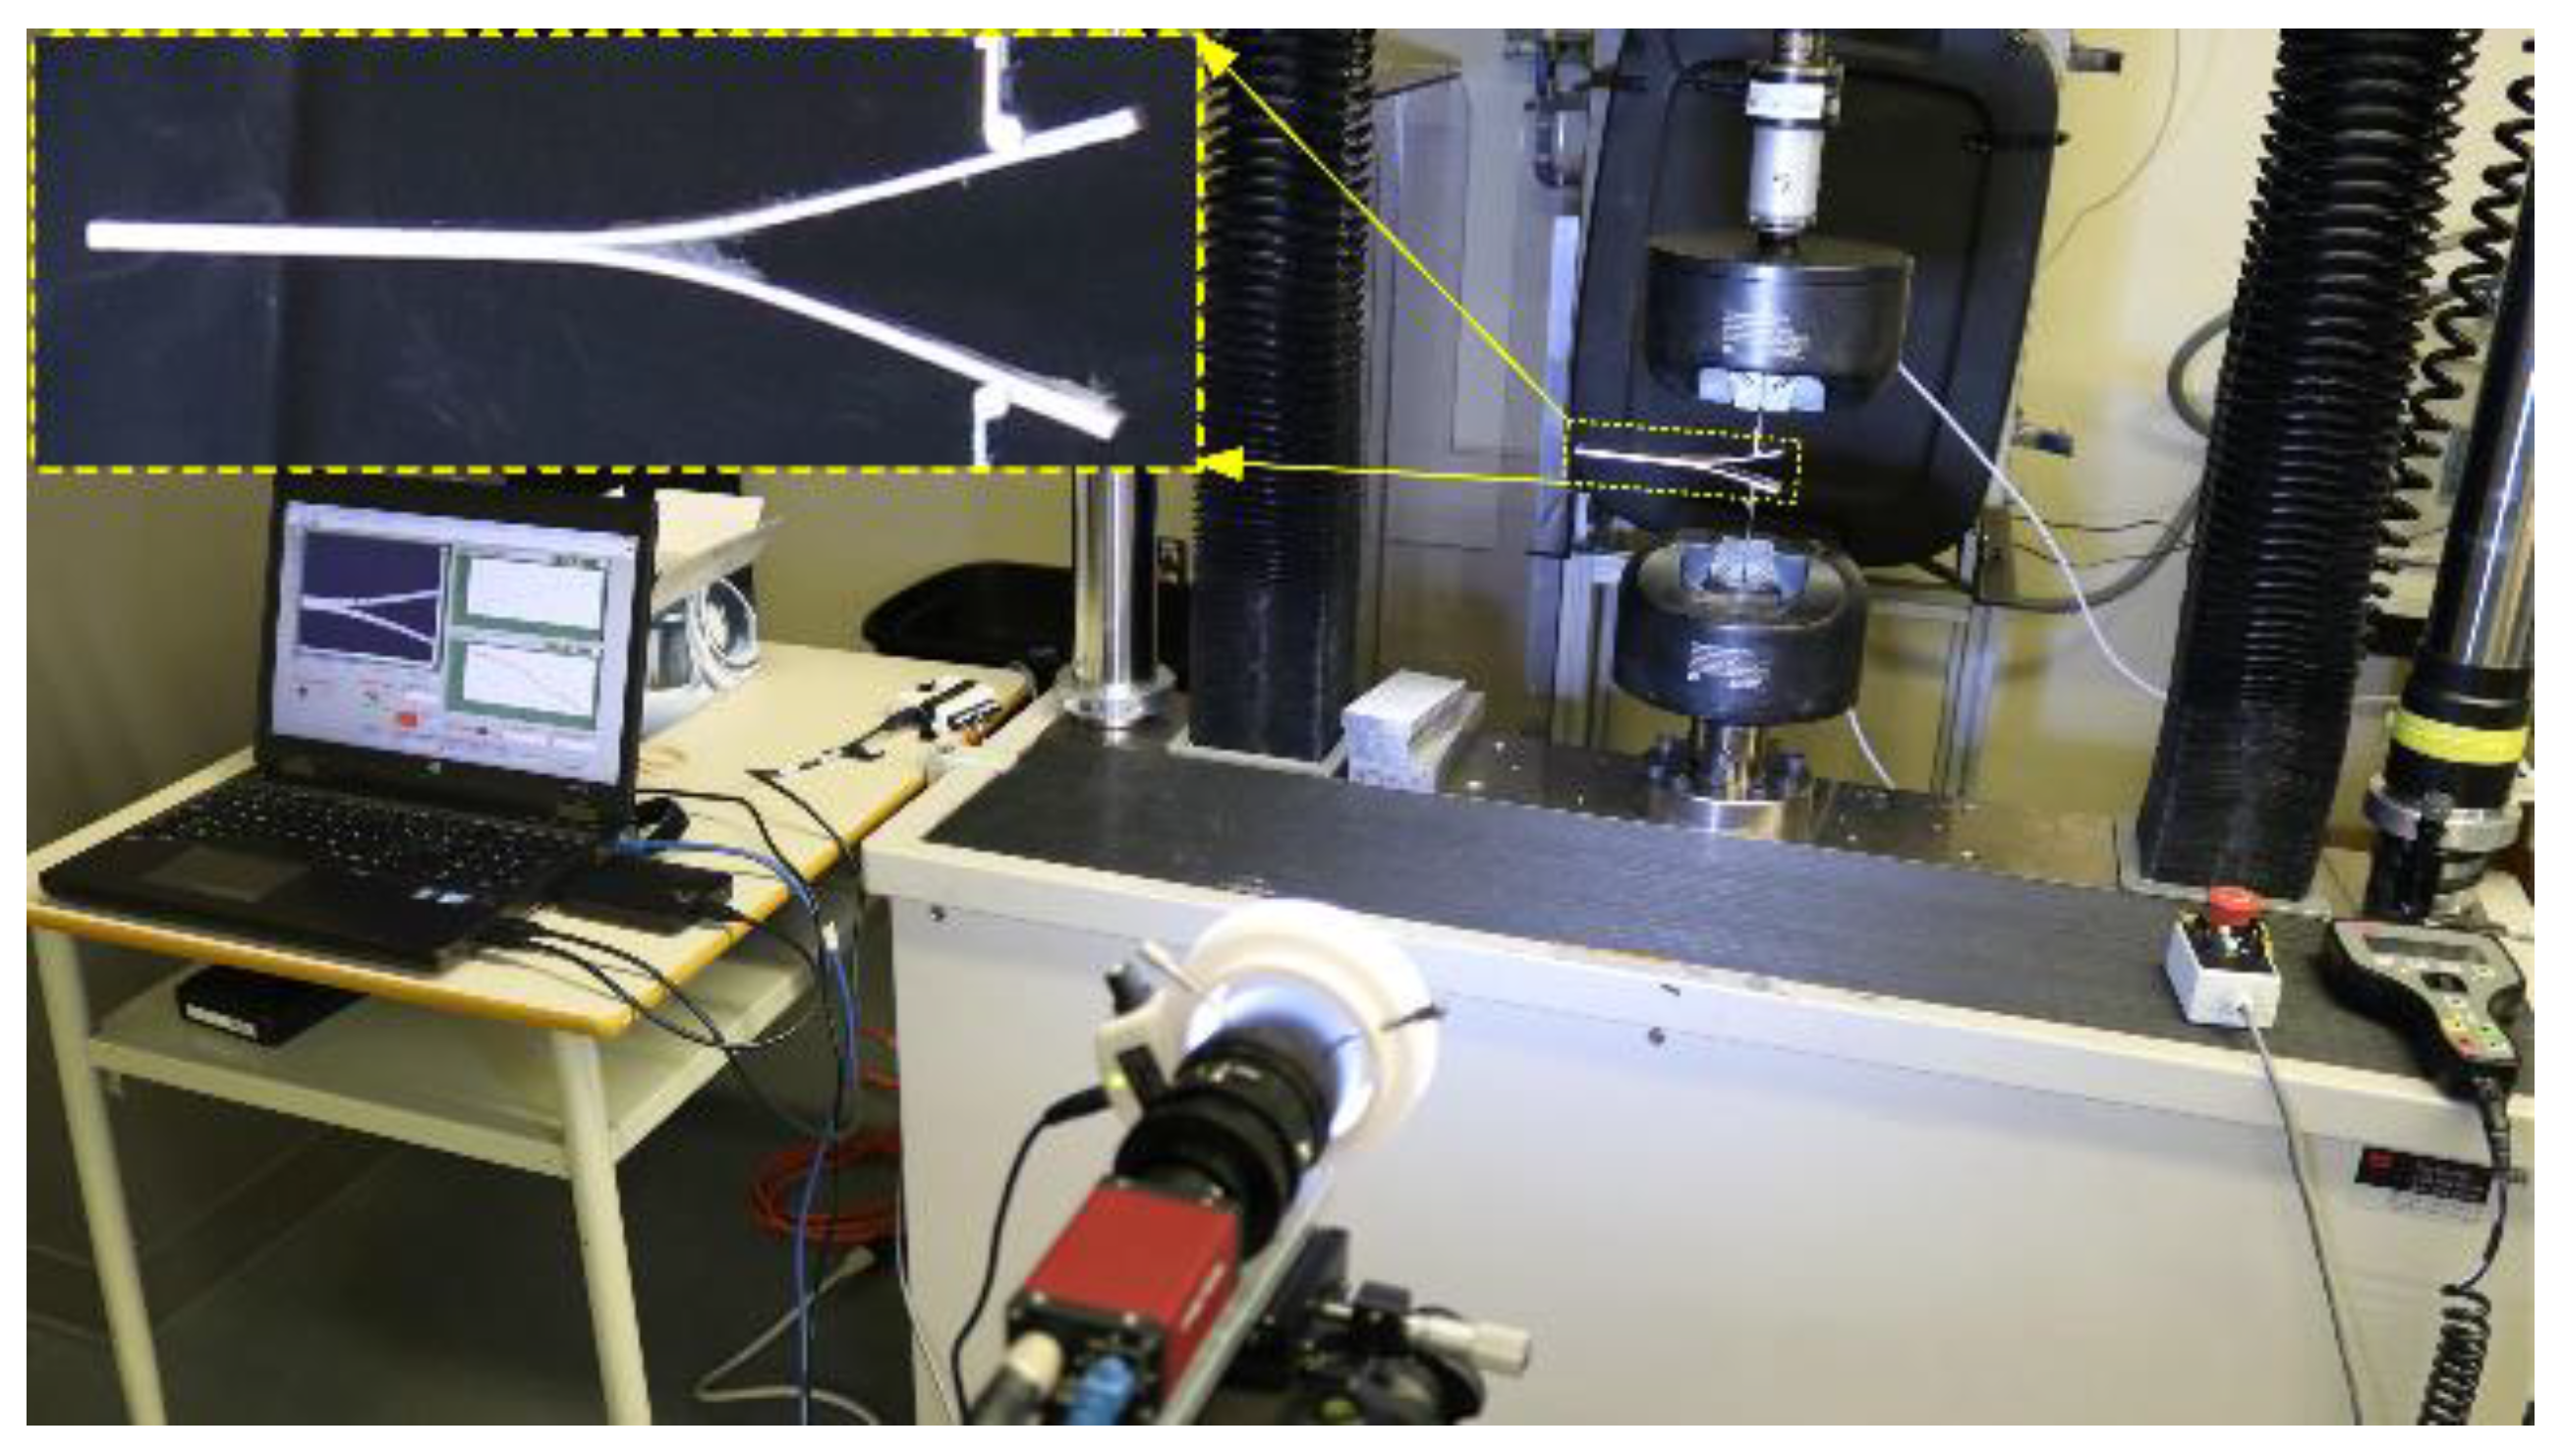
2.2. Mechanical Testing

Three different types of fracture tests were conducted to evaluate the interlaminar fracture toughness of the composite in pure Mode I and Mode II as well as in Mixed-mode I/II loading conditions. Numerous test methods and specimen configurations have been developed over the years to evaluate the IFT of the laminated FRPCs; however, only some of them have been standardized [43,69]. In this study, the most commonly used standardized test methods by ASTM will be employed. All of the tests were carried out at ambient conditions, and the specimens were exposed to the test conditions at least 48 hours before the experiments. The details of the corresponding specimens, test procedures, and data reduction methods are described as follows.

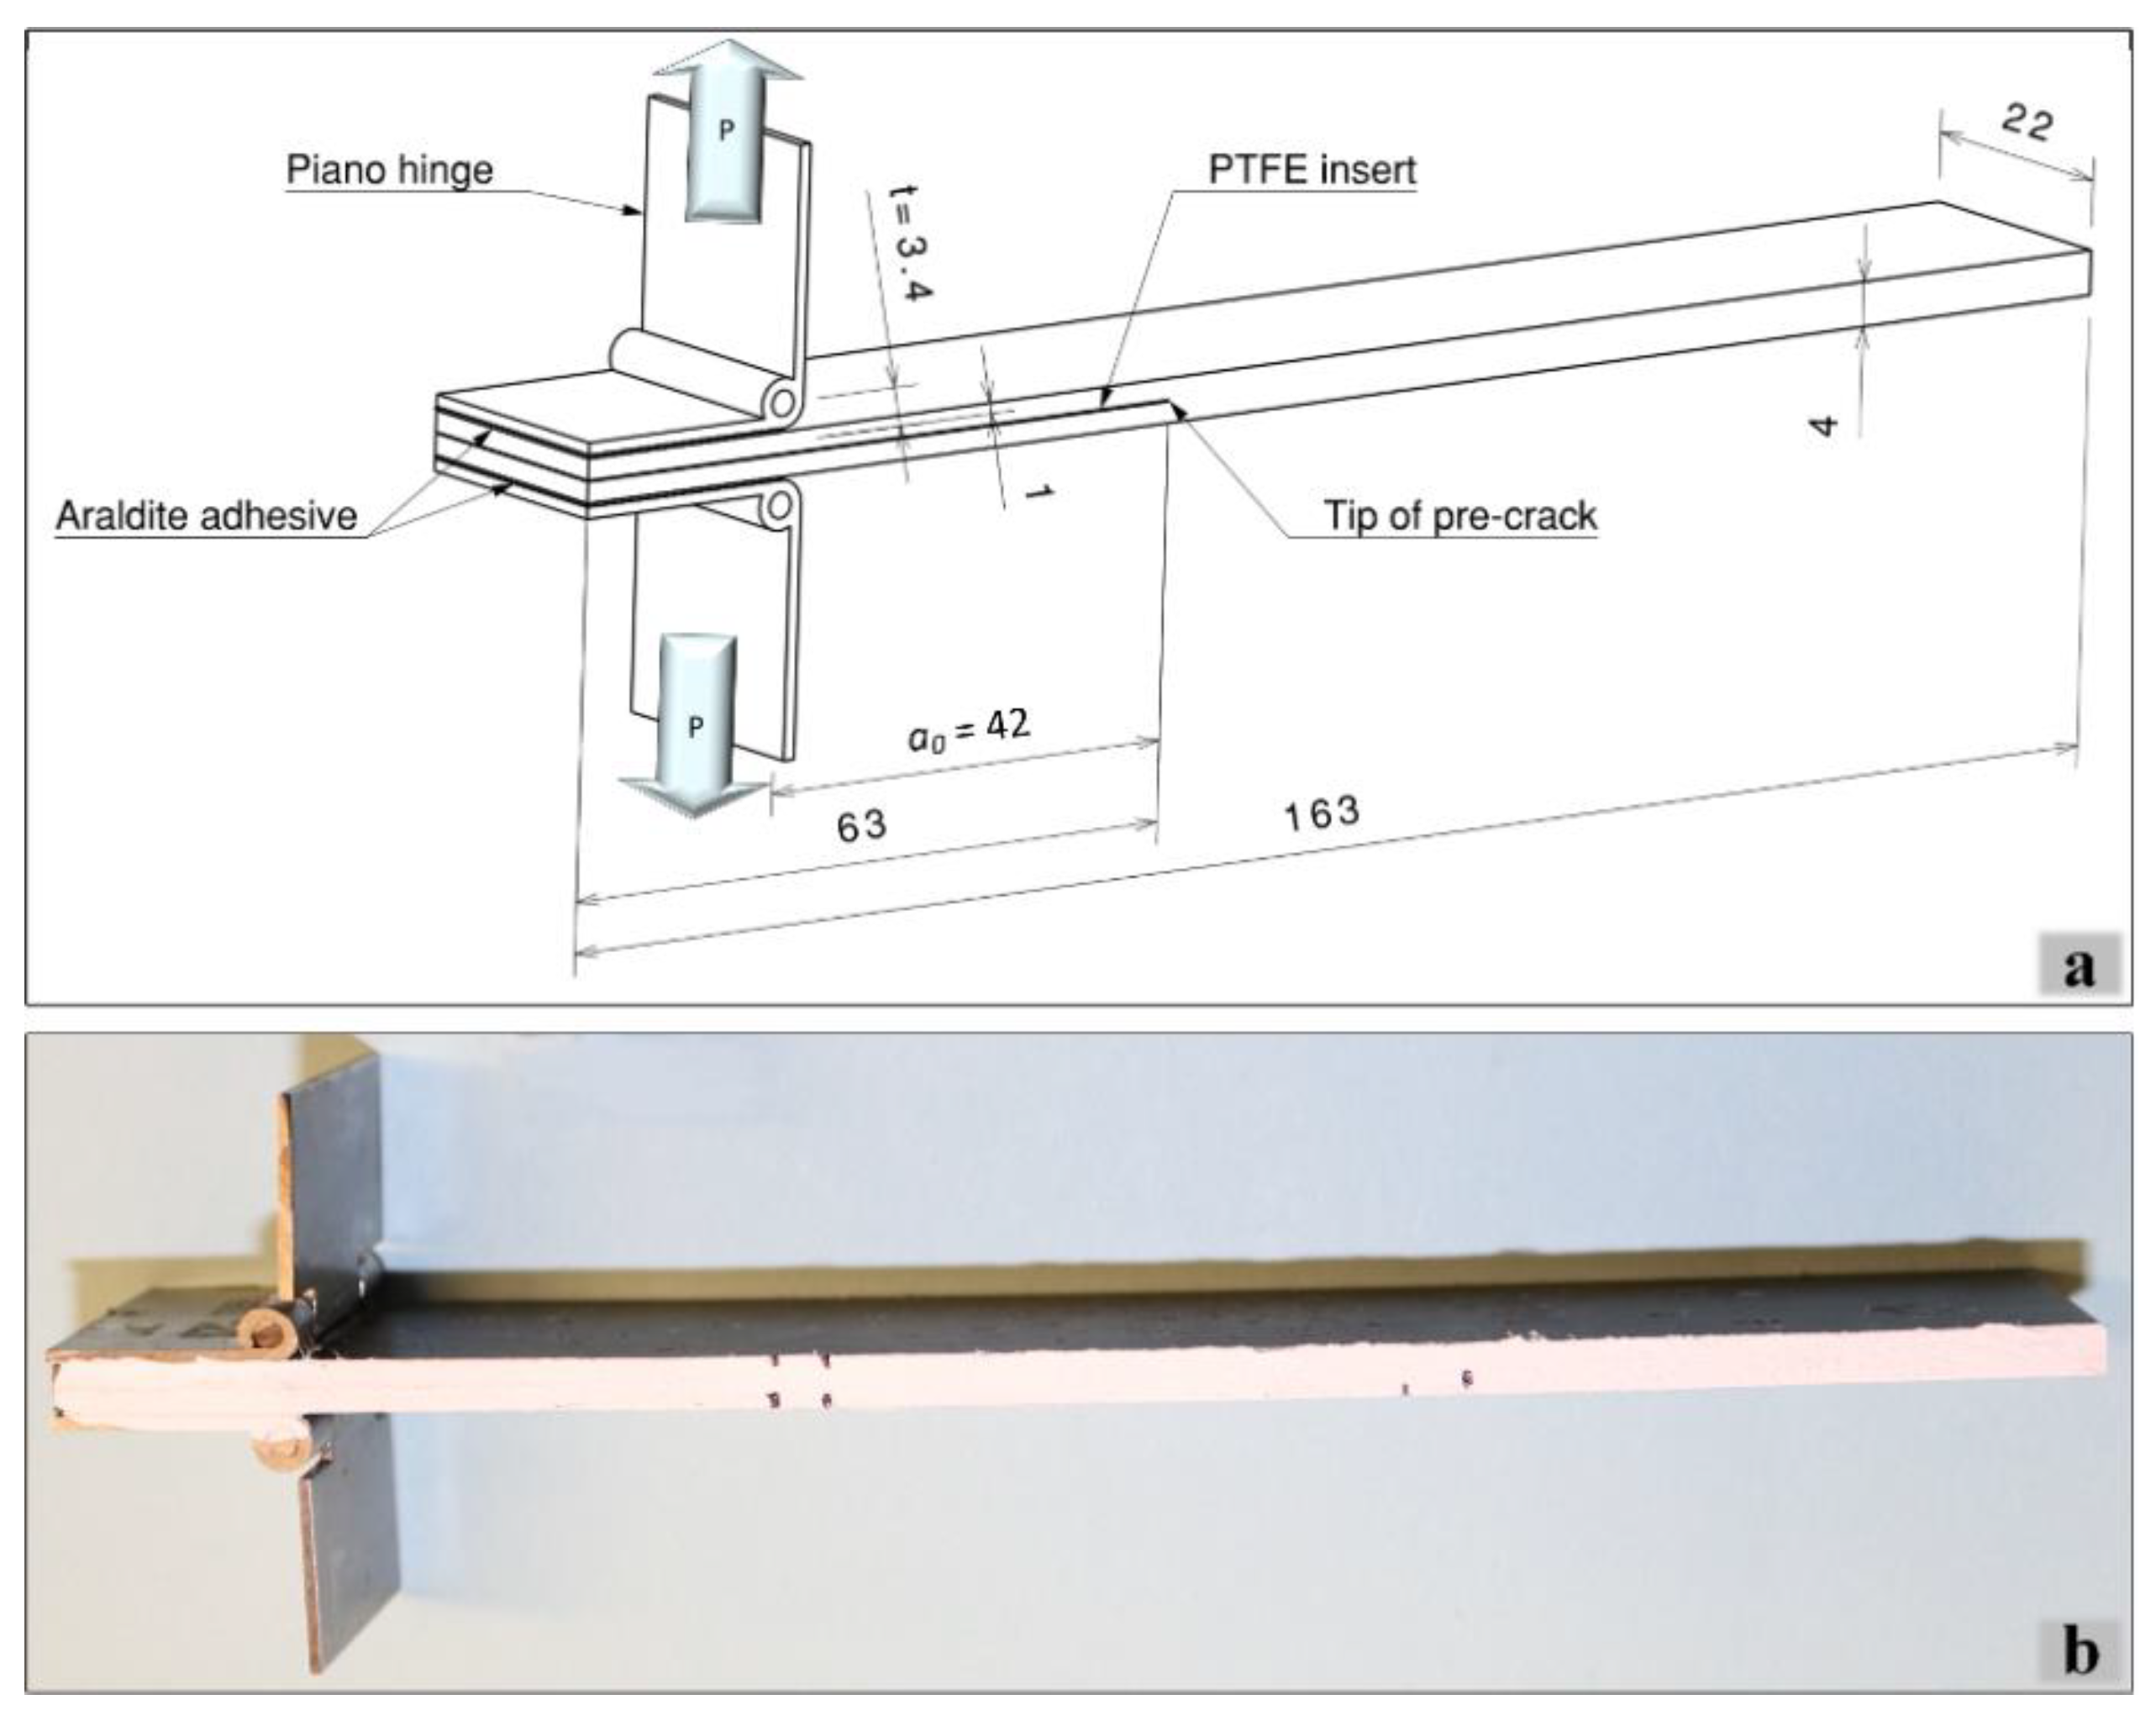
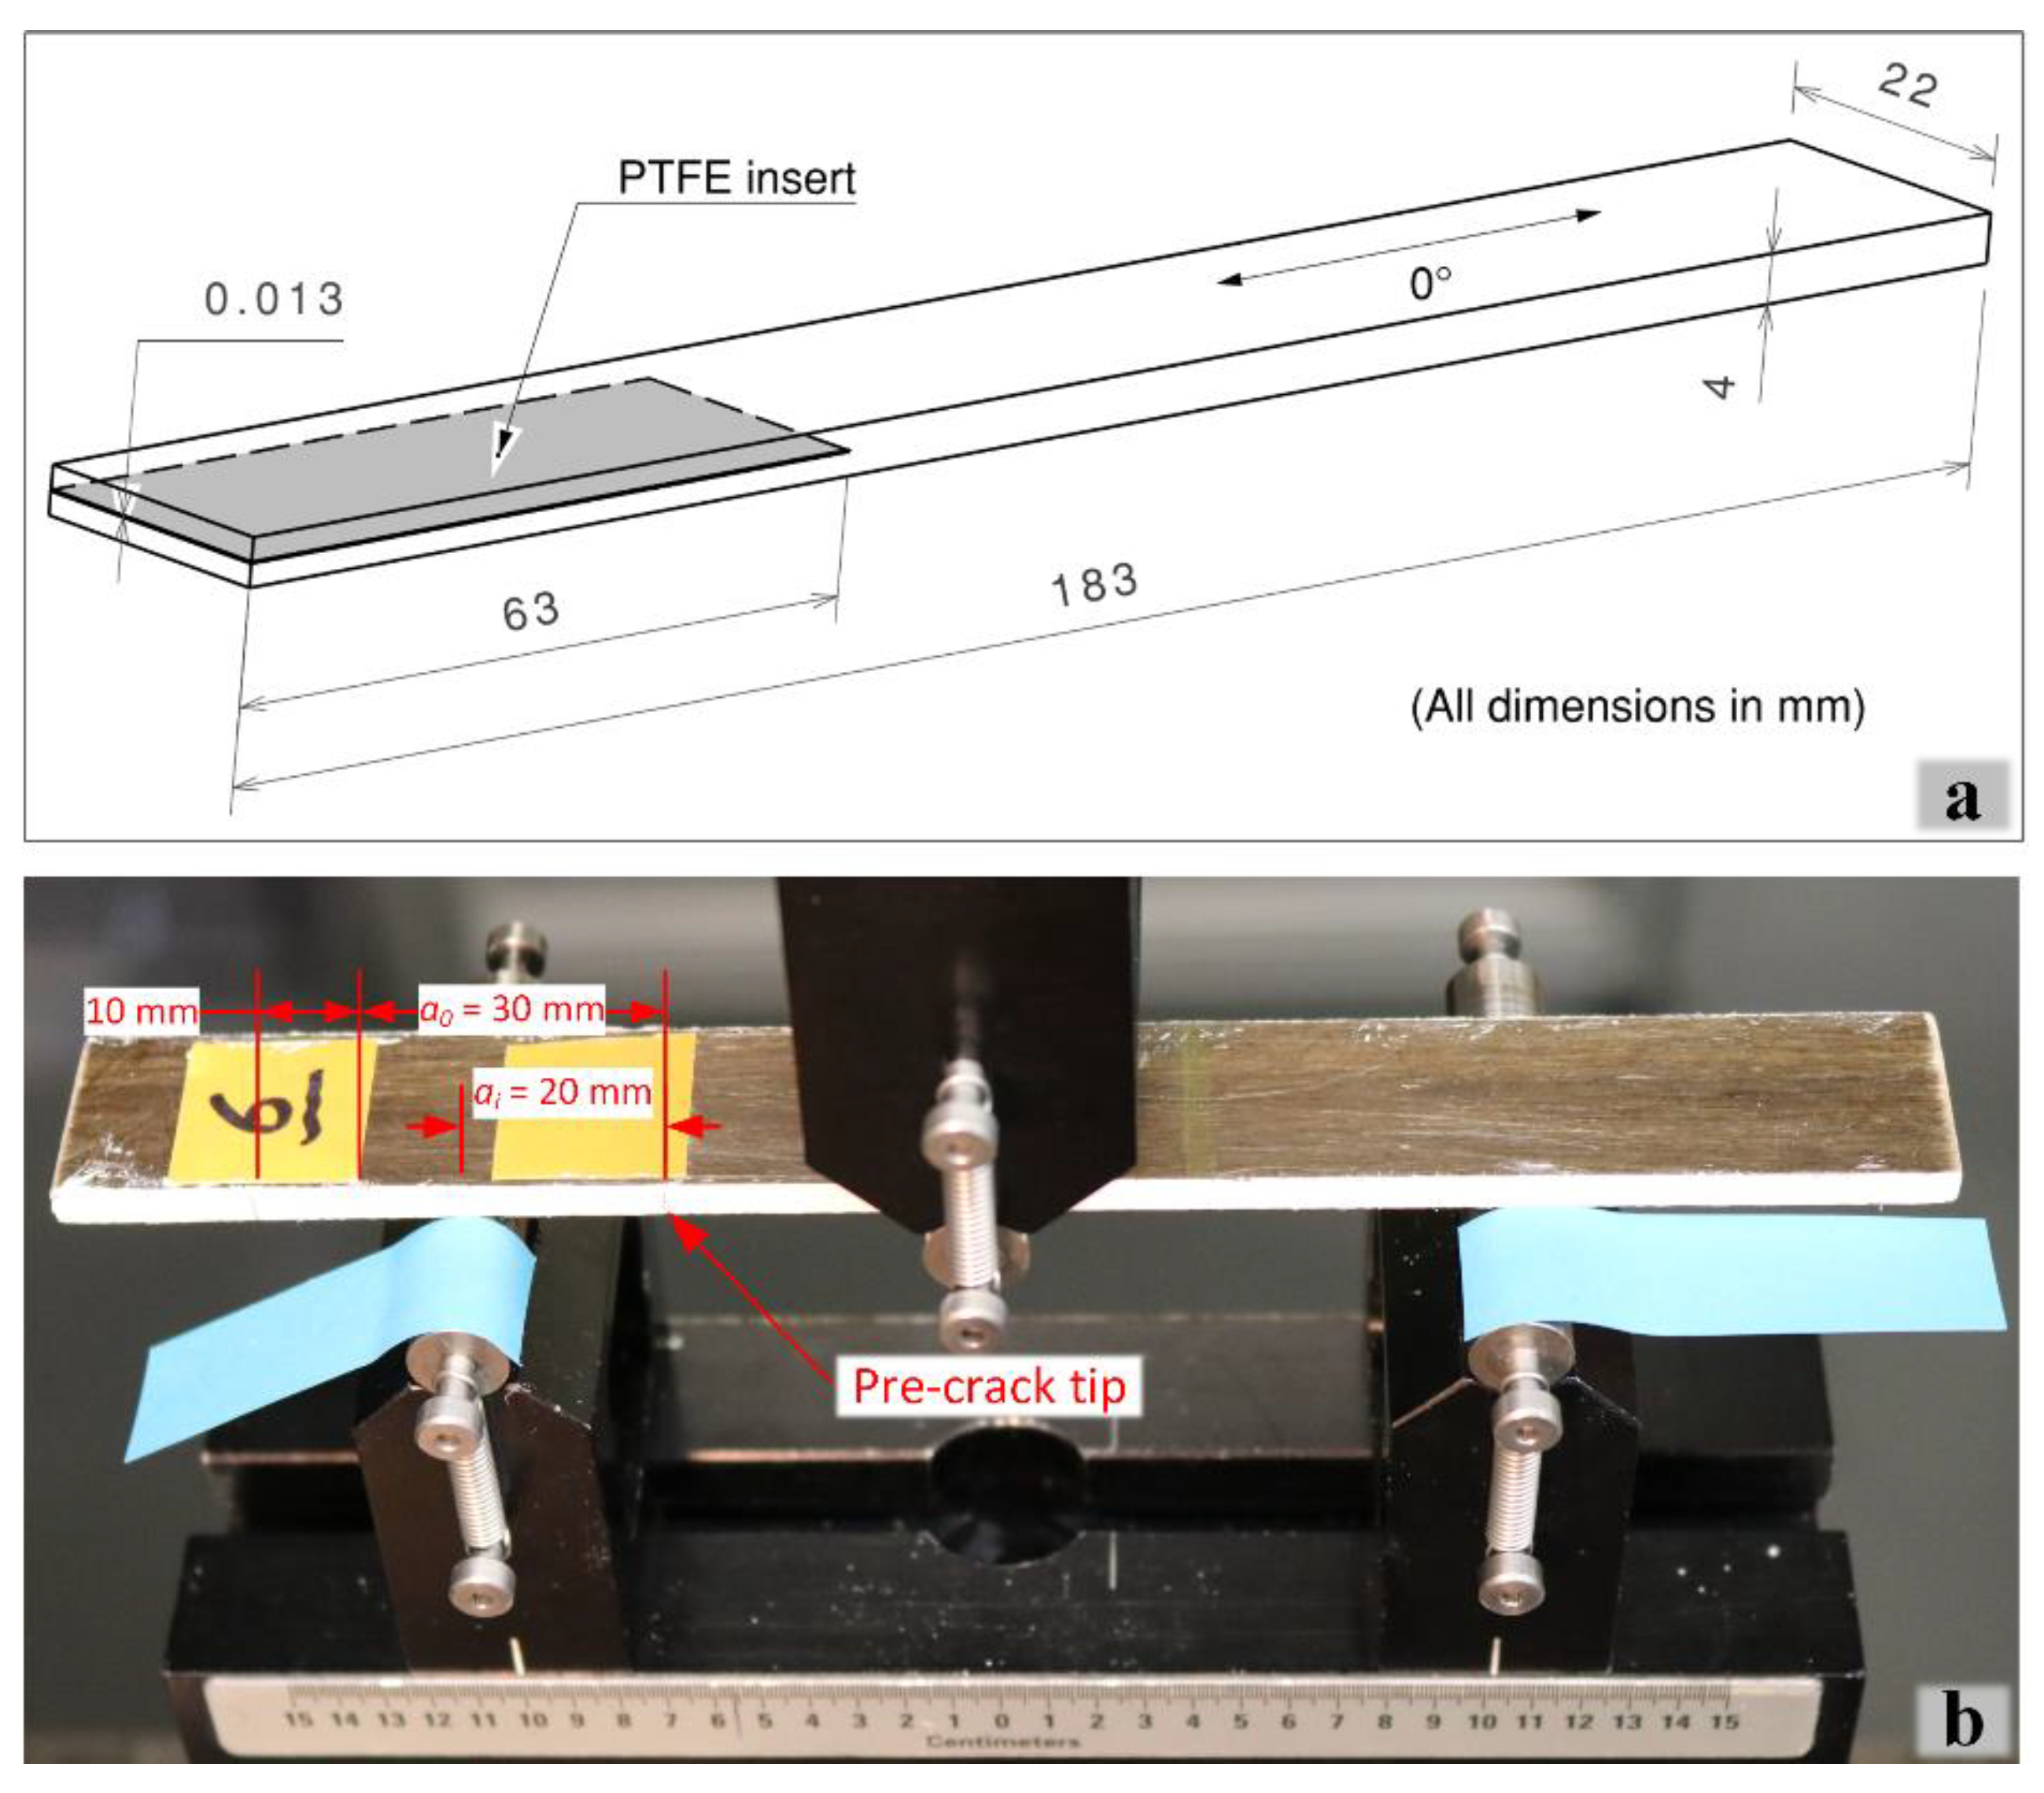
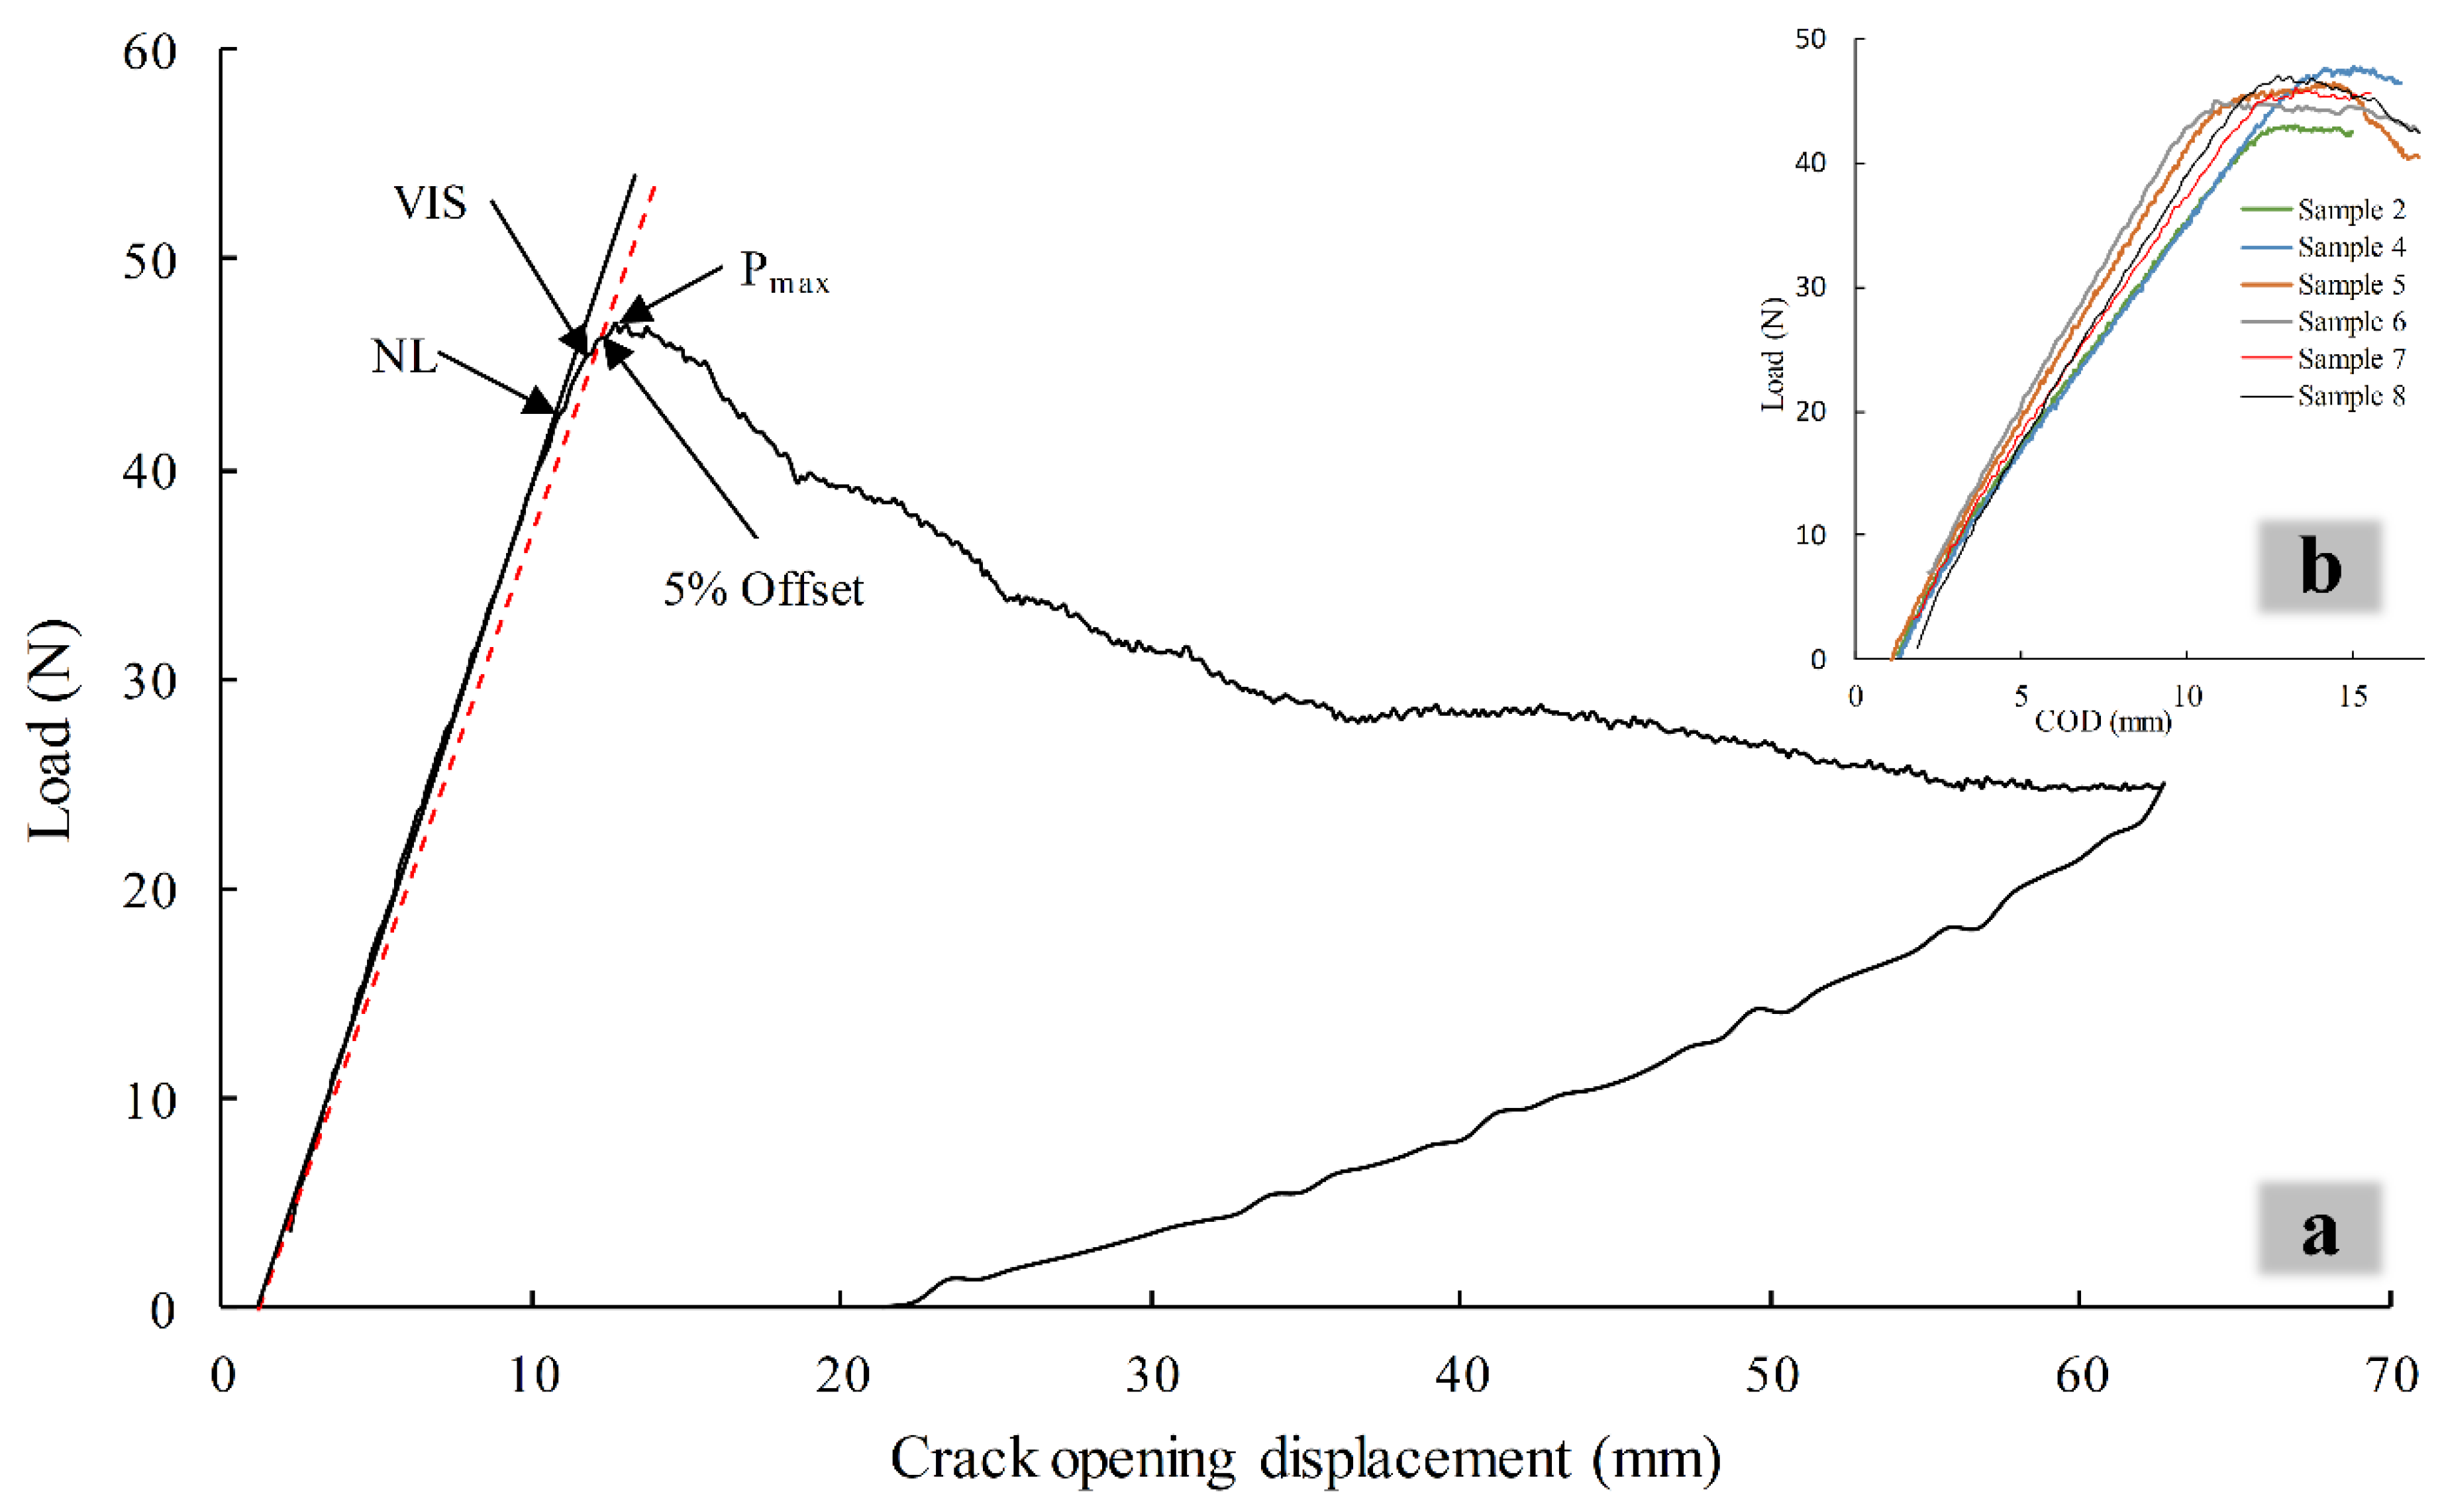
2.2.1. Mode I Interlaminar Fracture Toughness

Following the ASTM D5528 standard test method, DCB specimens were prepared and tested to determine the Mode I interlaminar fracture toughness of the composite. The thickness, h, and initial delamination length, a0, of the composite laminate were designed to fulfill the requirements of the standard. After cutting the test coupons to their desired dimensions, two piano hinges were bonded to the delaminated arms of the DCB specimen to introduce the tensile opening load and induce a Mode I delamination fracture; the configuration and nominal dimensions of the DCB specimen are illustrated in Figure 3a. To facilitate the detection of the onset and propagation of the crack, the side edge of the specimens was coated with white correction fluid, and the approximate location of the pre-crack tip and required final crack length were marked, as shown in Figure 3b. The DCB tests were conducted on an MTS Landmark 370 hydraulic machine equipped with a 1 kN-capacity load cell, and MTS 647/10 hydraulic grips. The specimens were loaded and unloaded, respectively, at a constant crosshead speed of 3 and 25 mm/min in two loading/unloading cycles. The initial loading was stopped after a crack growth of 3 to 5 mm, and the specimens were unloaded; this was a procedure to create a natural Mode I pre-crack in the DCB specimens. They were then reloaded until the delamination crack (a) propagated past 50 mm from the tip of pre-crack, and then they were unloaded.
A Digital Image Correlation (DIC) system was employed to observe and track the delamination front; the test setup is shown in Figure 4. DIC is an optical non-contact deformation measurement technique [70,71] with adequate performance, low cost, and handy experimental setup that has been used in many research fields for strain analysis studies, including crack initiation [72,73]. The principle of DIC and theoretical basis for the calculation of stains using consecutive images has been reported by many researchers and is available in the literature [74,75,76]. The recorded images were synchronized with the load and displacement signals of the MTS machine, the crack opening displacement (COD) was estimated as the crosshead displacement, and the data was recorded for the entire loading/unloading cycles. Then, the registered information was processed to associate the load and displacement values at the intervals of delamination growth defined by the standard. These values were used to calculate GIC for different delamination lengths and to form the delamination resistance curves (R-curves). Eight DCB specimens were tested to obtain at least five valid tests to determine GIC of the composite. The piano hinges were extended with a bracket to avoid the interference that occurred between the arms of the specimen with regular piano hinges and the jaws of the grip. In order to more precisely locate the end of the insert film, the first failed sample was completely opened, and the end of the film was marked to measure a0 and used for marking the other samples.
There are various data reduction methods for calculating GIC values, three of which are presented in the ASTM D5528 standard; however, the MBT method, yielding to the most conservative values, has been recommended. In this study, MBT was implemented to calculate GIC values based on the processed data and using Equation (1):
G I = 3 P δ 2 b ( a + | Δ | )
where P is the applied load, δ is the COD on the load line, b is the width of the specimen, a represents the delamination crack length, and Δ is the crack length correction factor. Δ can be determined experimentally as the x-intercept of linear least squares plot of C1/3 versus delamination length, where C is the compliance of the specimen (C = δ/P). GIC is the IFT of the composite, associated with critical load (PC) determined as follows.
The crack initiation value of GIC ( G I C i n i ) was determined using three definitions presented in the standard, namely, at the deviation from linearity point in the load-displacement curve (NL), when delamination is visually observed (VIS) and at 5%-increased-compliance point or the maximum load, as illustrated in Section 3.1. The NL G I C i n i is the lowest and recommended for damage tolerance analysis, and the first propagation value of GIC is known as Mode I pre-crack GIC [53]. Concerning deflections of the specimen arms due to relatively low flexural modulus of the FFREC, the values of h and a0 were calculated according to the recommendations outlined in the ASTM standard and based on the elastic properties of the composite, leading to a shorter a0 = 42 mm compared to a0 = 50 mm, recommended for synthetic FRPCs. Nevertheless, for some delamination lengths, the ratio of the load-line displacement to delamination length was higher than 0.4 ( δ a 0 > 0.4 ). Consequently, according to the standard, a large-displacement correction factor (F) was calculated using Equation (2) and incorporated in the data reduction method by multiplying F by GIC values calculated using Equation (1):
F = 1 3 10 ( δ a ) 2 3 2 ( δ t a 2 )
where t was measured as defined in the standard and is shown in Figure 3.

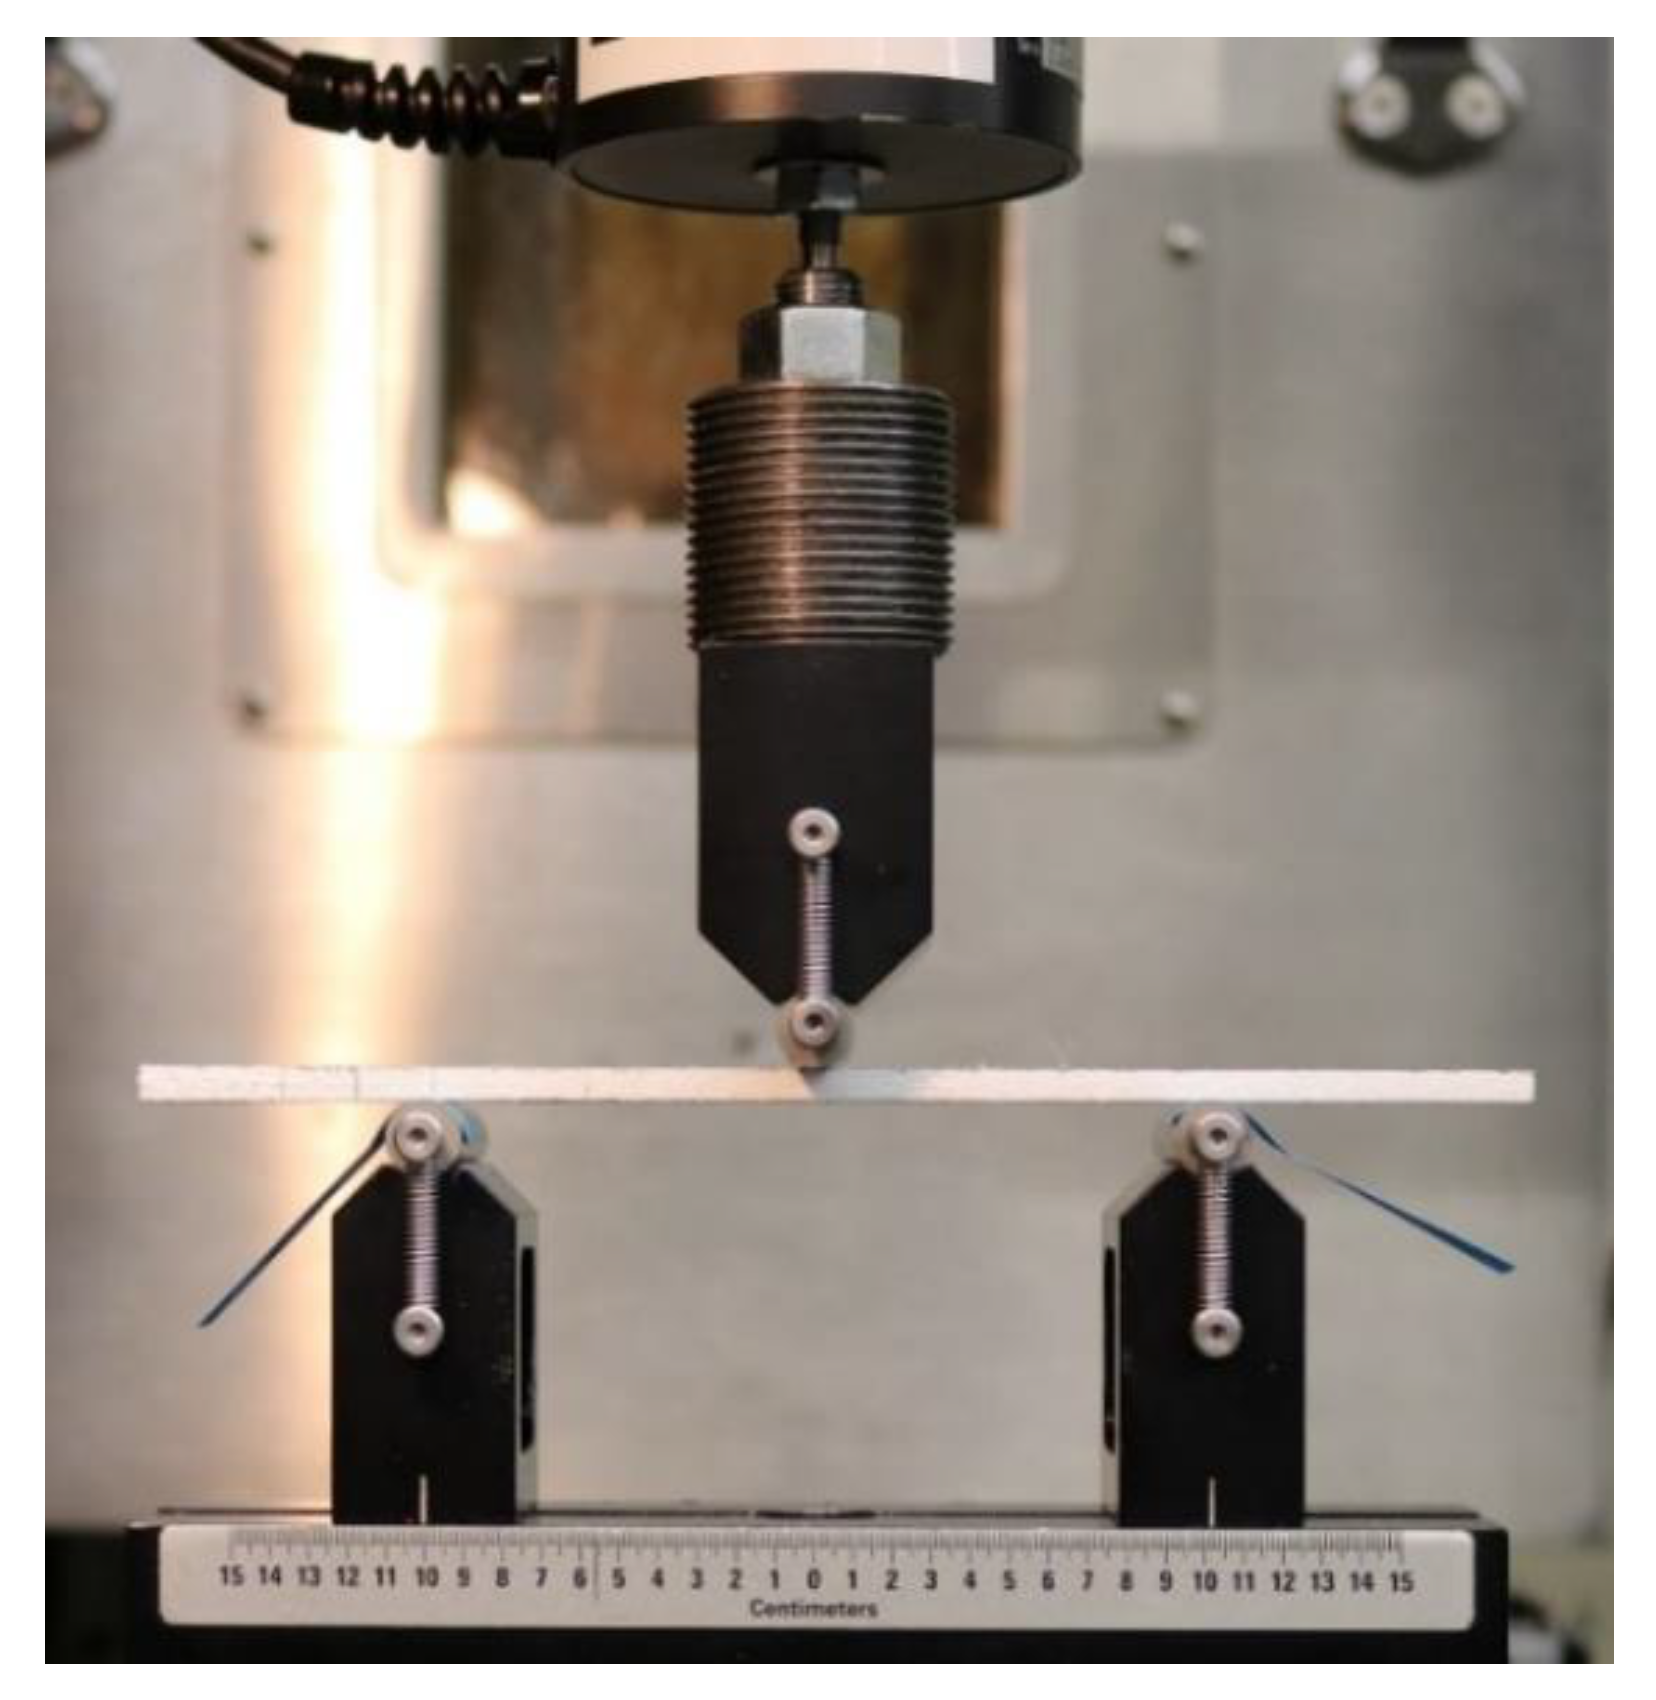
2.2.2. Mode II Interlaminar Fracture Toughness

End-notched flexure (ENF) tests were conducted following the procedure outlined in ASTM D7905 to determine the Mode II interlaminar fracture toughness, GIIC, of the UD-FFRECs using the compliance calibration (CC) method, which is presented as the only acceptable data reduction method for this test [54]. The specimens were cut from the same laminates used for DCB specimens mentioned above (Figure 1) and with the same tool to the dimensions that fall within the range of allowable lengths and widths specified in the standard. Both sides of the specimens were painted with a correction liquid to help the detection of crack initiation, and the end of pre-crack, as well as the required loading points, was marked. Figure 5a illustrates the configuration and dimensions, and Figure 5b shows a picture of the ENF specimen with markings. The ENF specimens were mounted in a three-point-bending (TPB) fixture with a 100-mm-span and loaded on the same machine fitted with the 1kN-loadcell that was used for DCB specimens, as shown in Figure 6. The coupons were loaded and unloaded at 0.5 mm/min crosshead speed, and the data acquisition was performed for the entire fracture tests and the loading phase of the CC tests.
According to the standard, the non-pre-cracked (NPC) and pre-cracked (PC) CC tests, at ai = 20 and 40 mm, and fracture tests, at a0 = 30 mm, were carried out on the same specimen to obtain the compliance plots as well as the maximum loads (PMax), to be used for determination of GIIC. The initial CC forces (Pi) were approximated using the flexural modulus (Ef) of the same material [77] and GIIC of a similar material [66], then, the result of ENF tests with accepted GIIC was used to update the PC and Pi. The calculated crack length after NPC tests (acalc) was calculated using unloading data of the NPC fracture test, as mentioned in the test procedure.
At each crack length, for NPC and PC tests, the compliance (C) was specified as the slope of the load-point displacement versus load curve by linear least-squares regression analysis (LLSRA). Then, C values were plotted versus cubed crack length (a3), and the CC coefficients, A and m in Equation (3), were determined using LLSRA:
C = A + m a 3
GIIC values were calculated using Equation (4) and validated based on the criteria of the ASTM standard:
G I I C = 3 m P M a x 2 a 0 2 2 B
where m is the CC coefficient, a0 and PMax are respectively the crack length used and the maximum force measured in the fracture test, and B is the specimen width. Six ENF specimens were tested to obtain adequate results for the calculation of GIIC. The value of GIIC is considered as IFT, only if it satisfies the criteria defined in the standard.

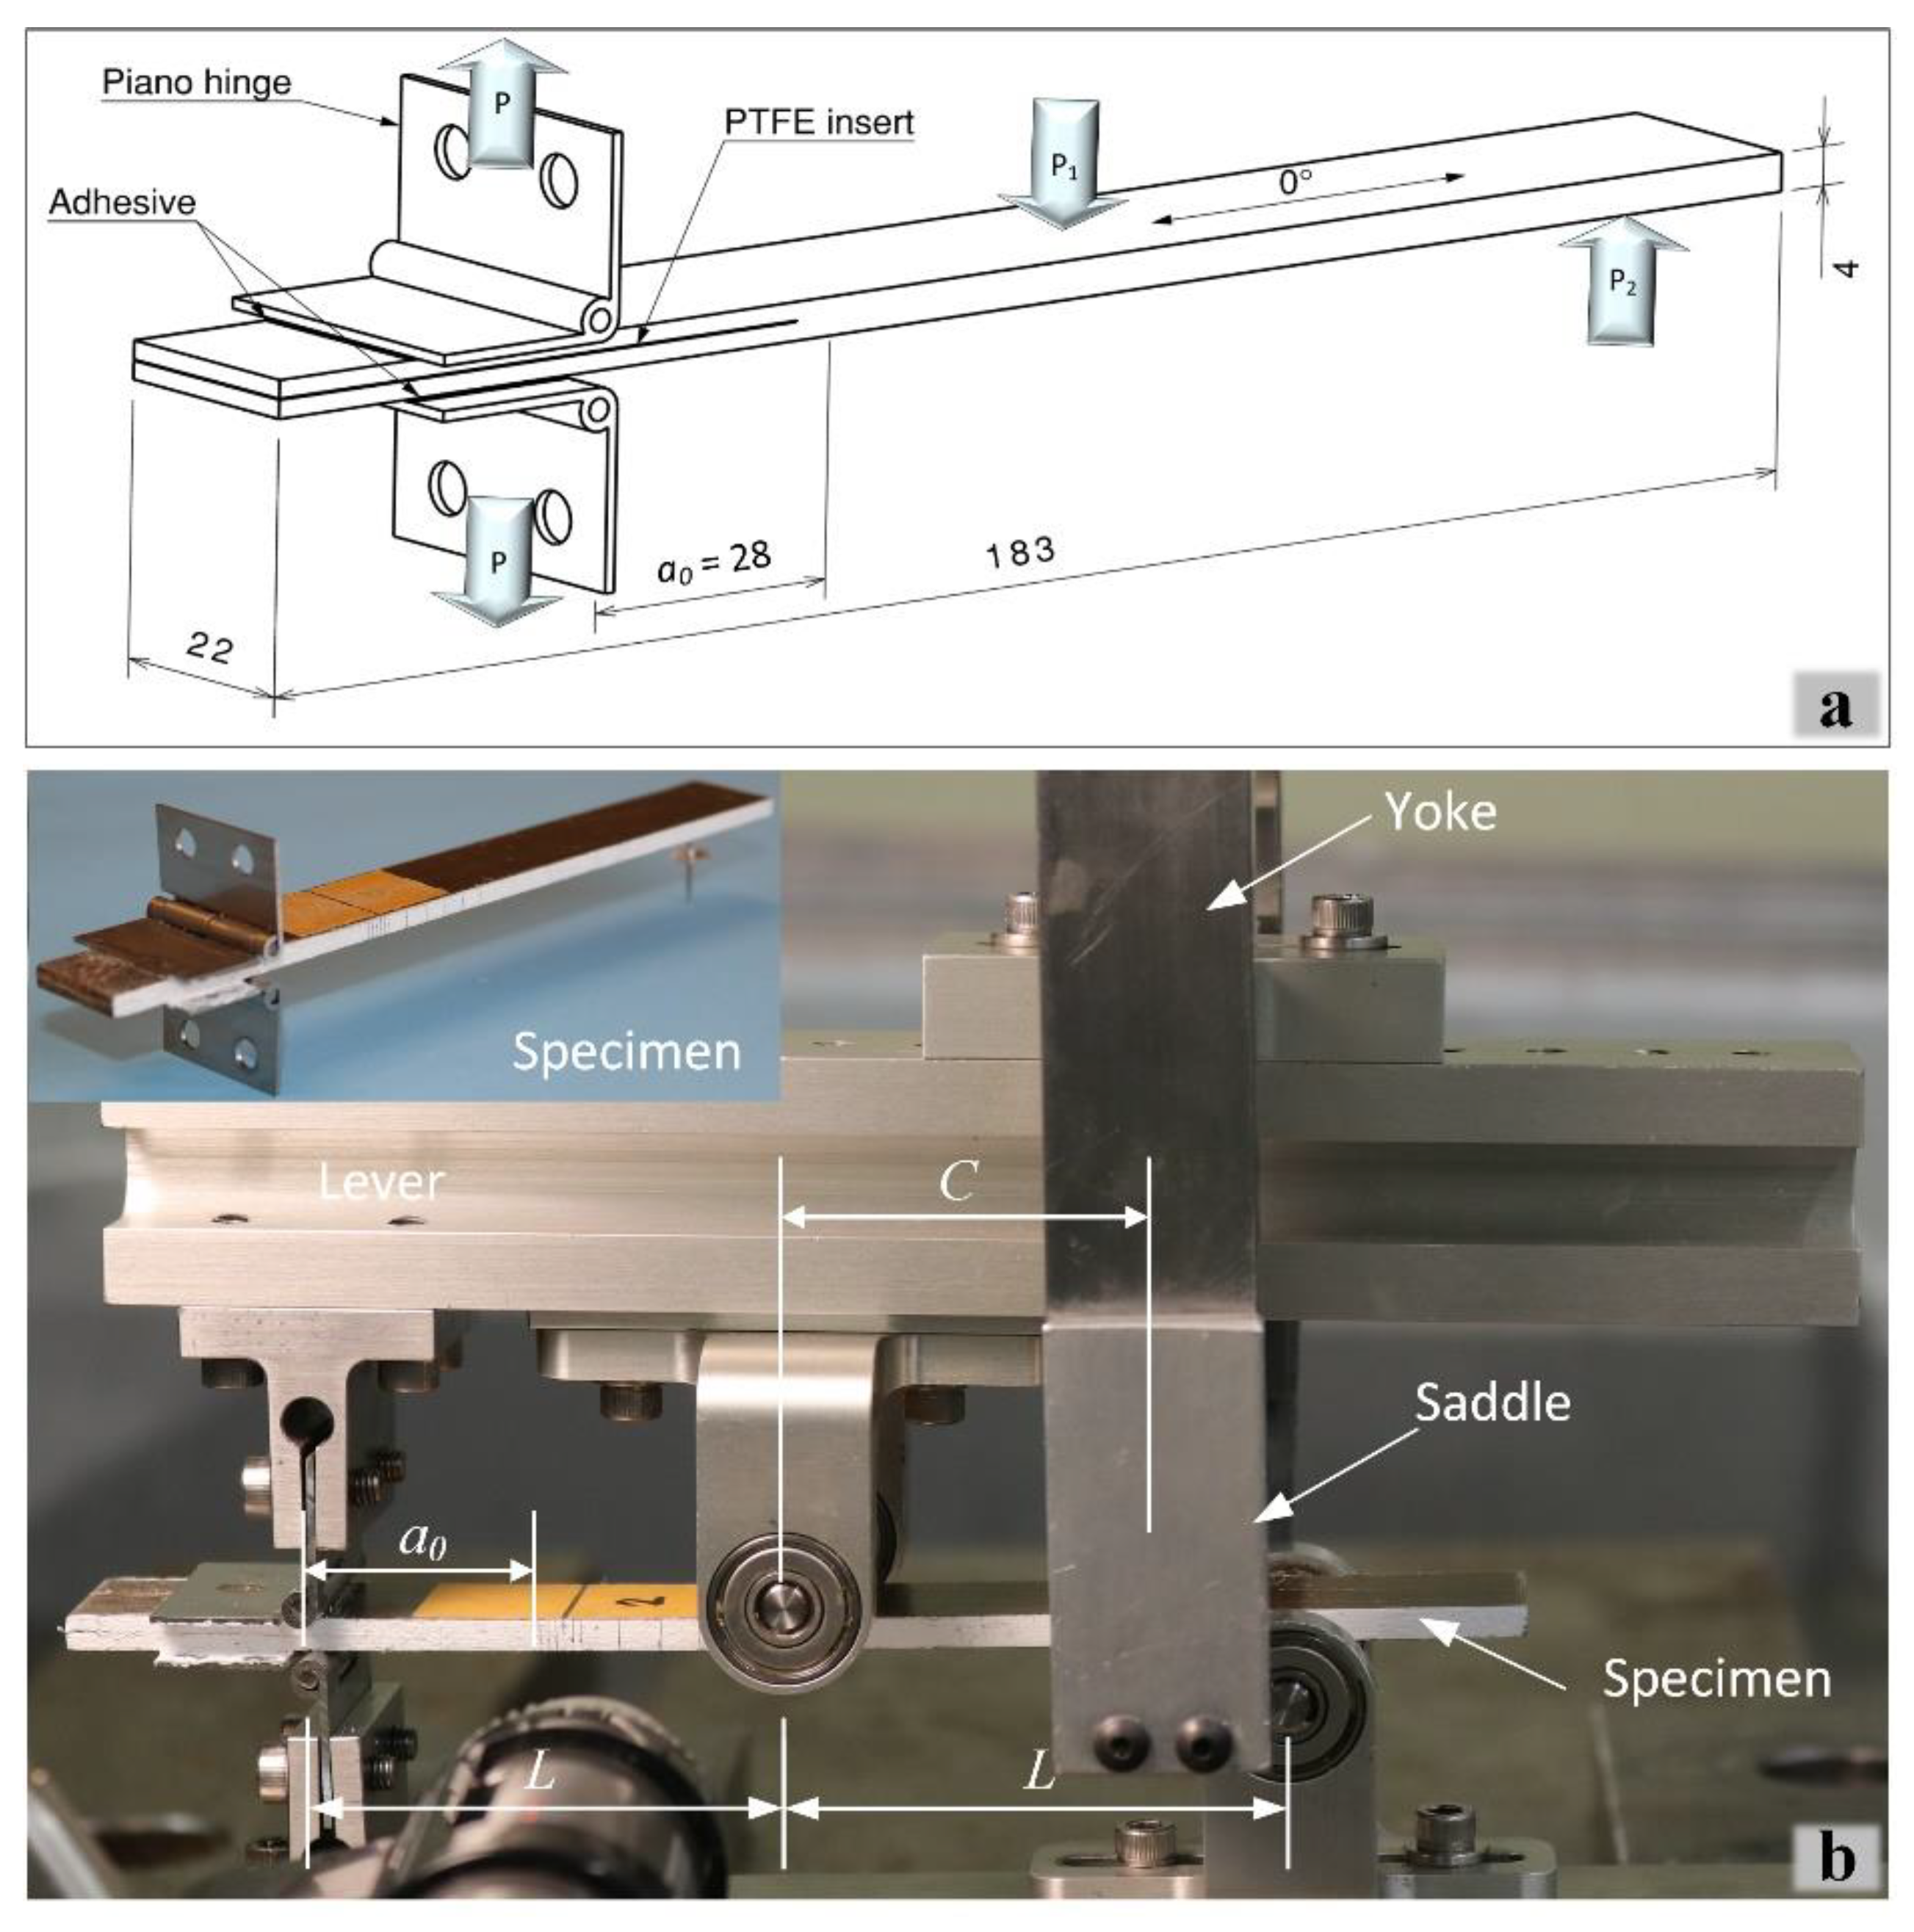
2.2.3. Mixed-Mode I/II Interlaminar Fracture Toughness

The Mixed-Mode Bending (MMB) tests were carried out according to ASTM D6671 standard test method [55] to obtain the Mixed-mode I/II fracture toughness (G(I/II)C) of the composite. Following the guidelines of the standard, piano hinges, with drilled holes matching to the hinge clamp of the MMB test fixture, were adhesively bonded to the pre-cracked specimens cut from the same plate as for DCB and ENF specimens, to form an initial crack length of a0 = 28 mm. The length of the initial crack was calculated based on the criteria defined in the standard and using the thickness, mechanical properties, and an estimated value of fracture energy, G ( I / I I ) C e s t , to result in an ultimate allowable deflection. Also, the side edges of the specimens were painted white and marked. Figure 7a presents the configuration, dimensions, and load application points of the MMB specimen. Figure 7b shows the MMB apparatus with a mounted specimen and the finalized MMB specimen. Mixed-mode delamination under a mode mixture ratio of G I I / ( G I + G I I ) = 0.55 was applied by setting the length of the lever as c = 47.4 mm (Figure 7b). The tests were performed at a constant crosshead speed of 0.5 mm/min on an MTS-322.31 machine equipped with a 5 kN loadcell, and the force versus displacement data was recorded. A moveable microscope was synchronized with the load-displacement data and used to observe the crack tip to detect the onset and follow the propagation of the delamination; the test setup is shown in Figure 8. The loading of the specimen was continued until the delamination extended past 25 mm. The required elastic and shear properties were used from our previous work [77], and the out-of-plane shear modulus G13 was assumed to be equal to G12. Also, for the calculations of the estimated force and deflection, the estimated Mixed-mode IFT, G ( I / I I ) C e s t , was considered as the average values of the GIC and GIIC of the composite measured in this present study. Six MMB tests were carried out to achieve a minimum of five valid tests by controlling the failure mode and maximum allowable deflection of the specimens according to the criteria of the standard.
G(I/II)C values were calculated using the Equations (5)–(7), as mentioned in the ASTM D6671:
G I C = 12 P C 2 ( 3 c L ) 2 16 b 2 h 3 L 2 E 1 f ( a 0 + χ h ) 2
G I I C = 9 P C 2 ( c + L ) 2 16 b 2 h 3 L 2 E 1 f ( a 0 + 0.42 χ h ) 2
G ( I / I I ) C = G I C + G I I C
where GIC and GIIC are the Mode I and Mode II components of the Mixed-mode IFT, respectively, PC is the critical load, in this study, it is the load associated with the VIS point, c is the lever length, b and h are respectively the specimen width and half-thickness, a0 is the delamination length, L is the half-span length, and χ is the crack correction parameter defined in the standard.

3. Results and Discussion

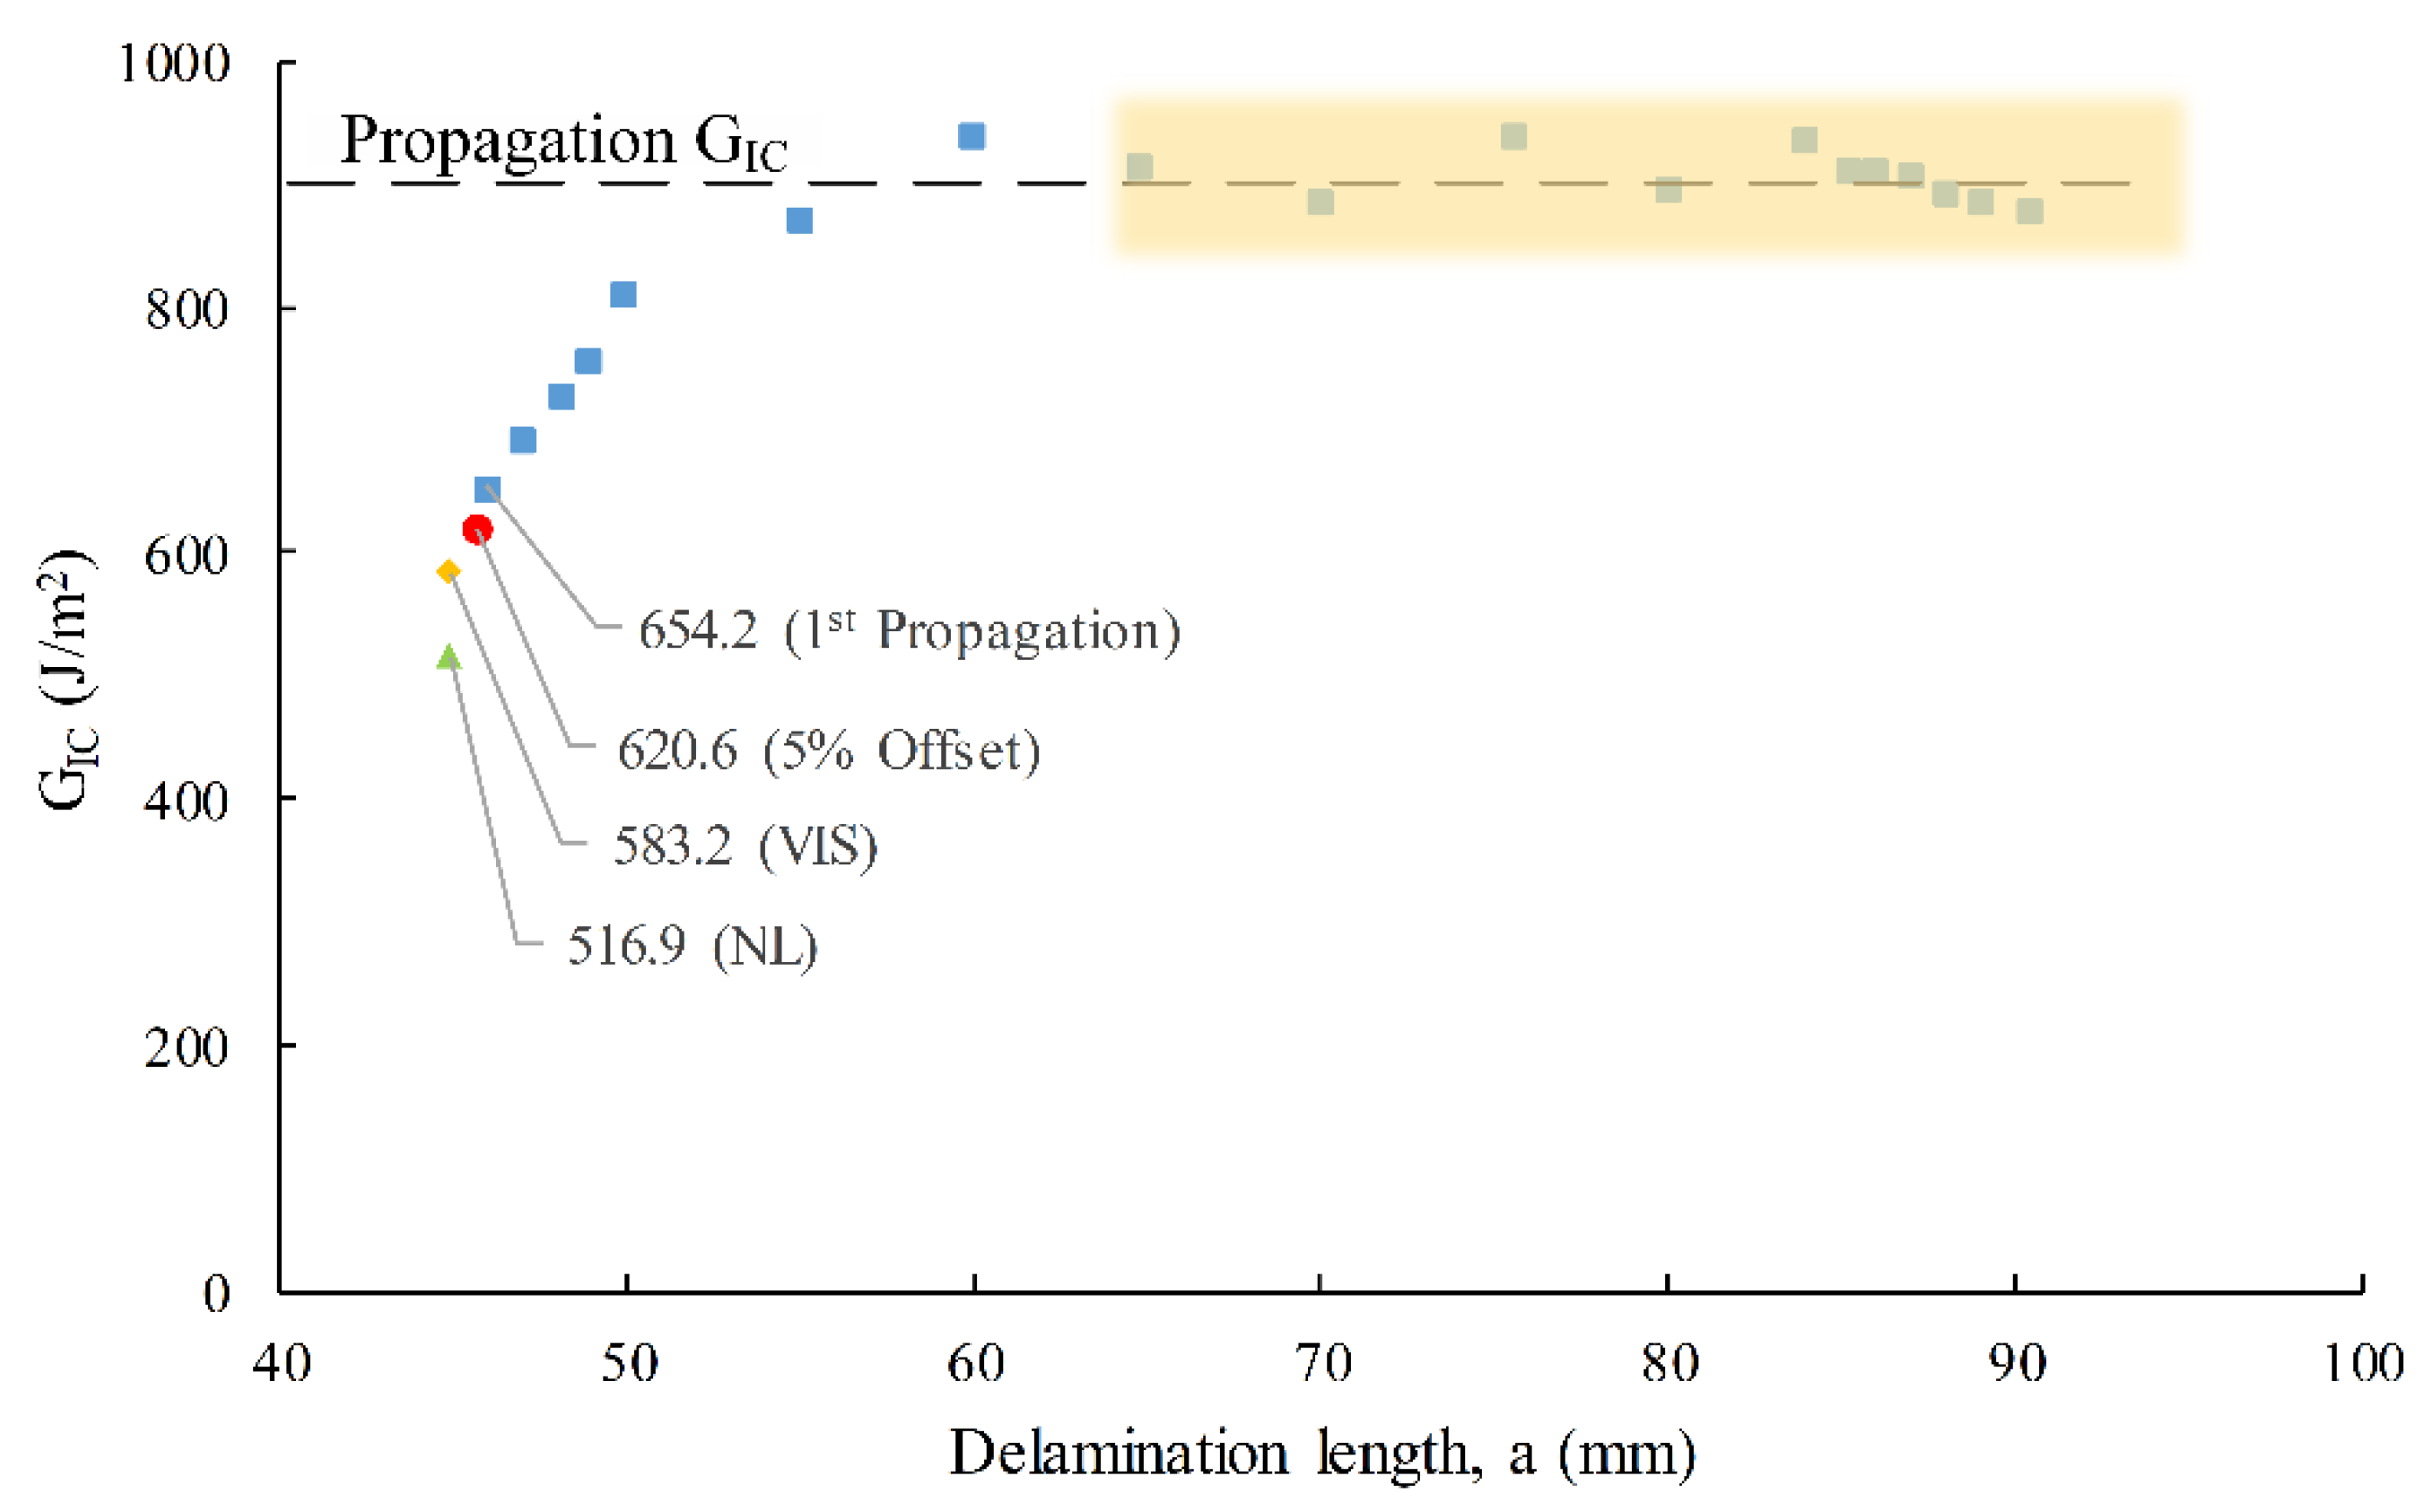
3.1. Mode I Interlaminar Fracture Toughness

The load-COD curve presented in Figure 9a shows the response of a typical DCB specimen to the crack opening load during the second loading cycle (after inducing the natural pre-crack in the first cycle). This curve shows that the UD-FFREC DCB specimen has a perfect linear behavior up to 95% of the Pmax, followed by a short nonlinear curve up to the Pmax point. Upon reaching the peak point, which differs from the point at which the delamination initiates, the load drops slowly and continuously with crack propagation, indicating that stable crack propagation is happening. Figure 9b confirms unique behavior for all of the DCB specimens and shows good repeatability of the tests for a NFRPC. This behavior of the DCBs perfectly agrees with the observations of Ravanid et al. [62,63,64] for woven and UD-FFREC DCBs, which were stiffened by GFRP/CFRP tabs on both sides, as well as with those of Bensadoun et al. [57] for cross-ply (UD [0 90]4s) FFRECs laminate stiffened likewise and those of Saidaine et al. [68] for woven flax/epoxy composite. Investigating woven/vinyl-ester DCB specimens, Almansour et al. [47] also observed an initial linear response followed by a nonlinear curve up to the peak load. However, this is in marked contrast to the observations of Rajendran et al. [66,67] for the flax fabric/epoxy DCBs., who reported a high nonlinear response up to the maximum load. Ravandi et al. [62] and Rajendran et al. [67] tested epoxy composite DCBs made of relatively similar flax fabrics supplied by the same supplier with the specifications as described in the Introduction part. However, they reported an entirely different load-displacement response and IFT values; the average GIC value reported by the former (≈2000 J/m2) is much higher than that of the latter (363 J/m2).
The calculated GIC values for a typical DCB specimen are drawn as a function of delamination length (Figure 10) to generate the delamination resistance curve, known as R-curve, and to determine the initiation and propagation values of GIC. As can be seen in Figure 10, the GIC value determined at NL is the minimum followed by those at VIS and 5% Offset points, which happened before the Pmax point for all DCB tests on the load-COD curve (Figure 9a). Figure 10 shows that GIC increases by delamination growth to a maximum value and then drops to stabilize at a plateau value. Several authors observed similar R-curves, and this is a commonly occurred phenomenon for UD-FRPC DCB specimens when the delamination grows parallel to the fibers between two UD plies that is attributed to the development of fiber bridging across the crack [45,53,57,62,64,78]. This resistance-type fracture behavior of UD DCB composites is an incidence of properly implantation of the delamination insert and validates the tests. The scale of the fiber bridging is much more extensive for UD-NFRPCs compared to their synthetic fiber counterparts [59,62,63,64,68]. The authors related this phenomenon to the high strength of the longer synthetic fibers which tend to remain unbroken and less mobile, whereas, UD natural fibers are composed of shorter technical fibers with irregular geometry and alignment that helps them bridge two opening plies. They also believe that the higher GIC value determined for UD-FFECs compared to those for UD glass/epoxy composites is associated with the larger scale of fiber bridging.
The GIC values, determined based on different definitions of onset of delamination, are presented in Table 1. However, combining some damage detection techniques, such as Radiography, strain gauge, and AE, with DCB tests, reveal that the delamination starts in the interior of the specimen width very close to NL point on the load-COD curve [53,68,79], and as can be seen in Figure 10, this point is far from propagation values, thus is considered as initiation GIC value, as recommended by ASTM D5528. The plateau value of GIC in the R-curve, the average value within the highlighted zone in Figure 10, is considered as the propagation GIC value and summarized in Table 1.
The relevant DCB tests conducted for FFRPCs and their corresponding GIC values available in the literature are summarized in Table 2. As can be seen in Table 2, the most similar tests have been performed by Ravandi et al. [64] for an analogous UD-FFECs ([0]16) laminate containing a similar UD reinforcement with a lower surface density (110 g/m2) compared to 200 g/m2 used in the under-study [0]12 laminate. However, the obtained initiation GIC value at VIS point (641 J/m2), as well as the propagation GIC value (903 J/m2) in the present study, are about 20% lower than those reported by these authors. Considering that they stiffened their DCB specimens with GFRP, this difference may be explained by referring to the work of Almansour et al. [47], where replacing the out-most layers of flax fabric composites by the 4-fold stiffer basalt fiber plies, equivalent to stiffening flax composite DCBs, augmented the GIC values by around 19%. Therefore, the obtained results in the current study are in excellent agreement with their results. The experiments of Bensadoun et al. [57] for the cross-ply DCB ([90,0] specimens), where the delamination occurs at 0°//0° interface, also have similar failure conditions to the present DCB tests; however, it has been shown that GIC value measured for delamination at 0°//0° interface within a UD laminate is different with that within a multidirectional laminate and replacing some off-center 0° plies with 90° layers reduce the GIC value [80,81]. Therefore, in view of this fact, the lower GIC values reported by these authors, presented in Table 2, are also in good agreement with those of the present work. In general, from the studies summarized in Table 2, it can be deduced that the composites reinforced with women fibers have higher GIC values compared to those with UD reinforcements. As explained before, the huge difference observed for the results of Almansour et al. [47] can be due to the very high toughness of matrix (that is the dominant factor in this failure mode) used in their study in comparison to that used in the current study (410 J/m2 of vinyl-ester against 69–150 J/m2 of epoxy [57]) as well as the woven reinforcement structure used in their composite that exhibits higher GIC compared to UD laminate as shown in Table 2 and [57,82]. However, for propagation values, clearly, the deviation of crack from the mid-plane of the laminates is a significant reason. Despite the similarity of the material, the value reported by Rajendran et al. [67] seems relatively low. In addition to other differences listed in Table 2, and as discussed earlier, their load-COD curve is entirely in contrast with the findings of this study and all other authors. Moreover, they reported a 34% higher value for GIC of the same material in another work [66].
Overall, considering the differences in reinforcements architecture/source, matrix type, processing, testing, and data reduction method, the obtained results in the present study are generally consistent with the literature data given in Table 2. Therefore, the determined and validated values for the initiation and propagation GIC for UD-FFRECs can be considered as the material properties of these composites and be confidently applied in future research and engineering fields.

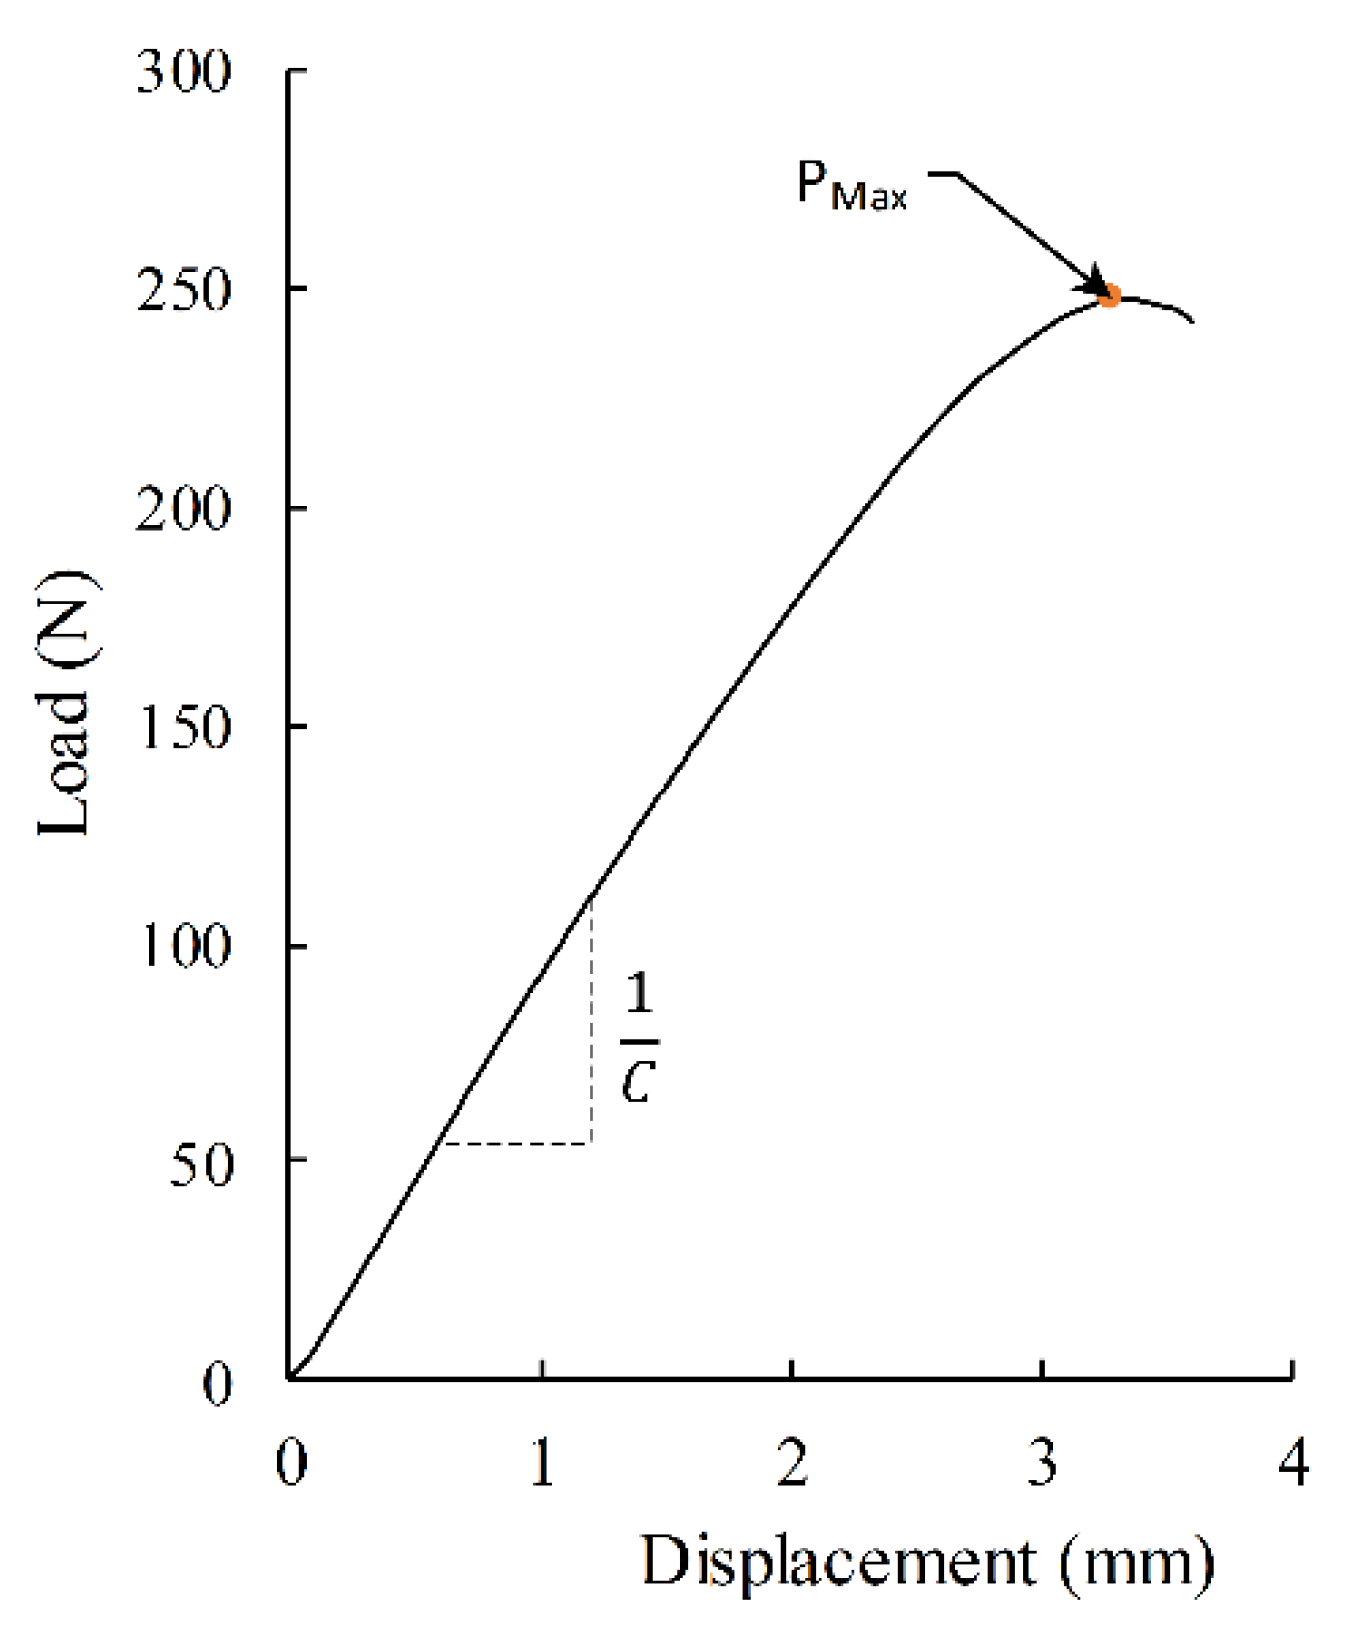
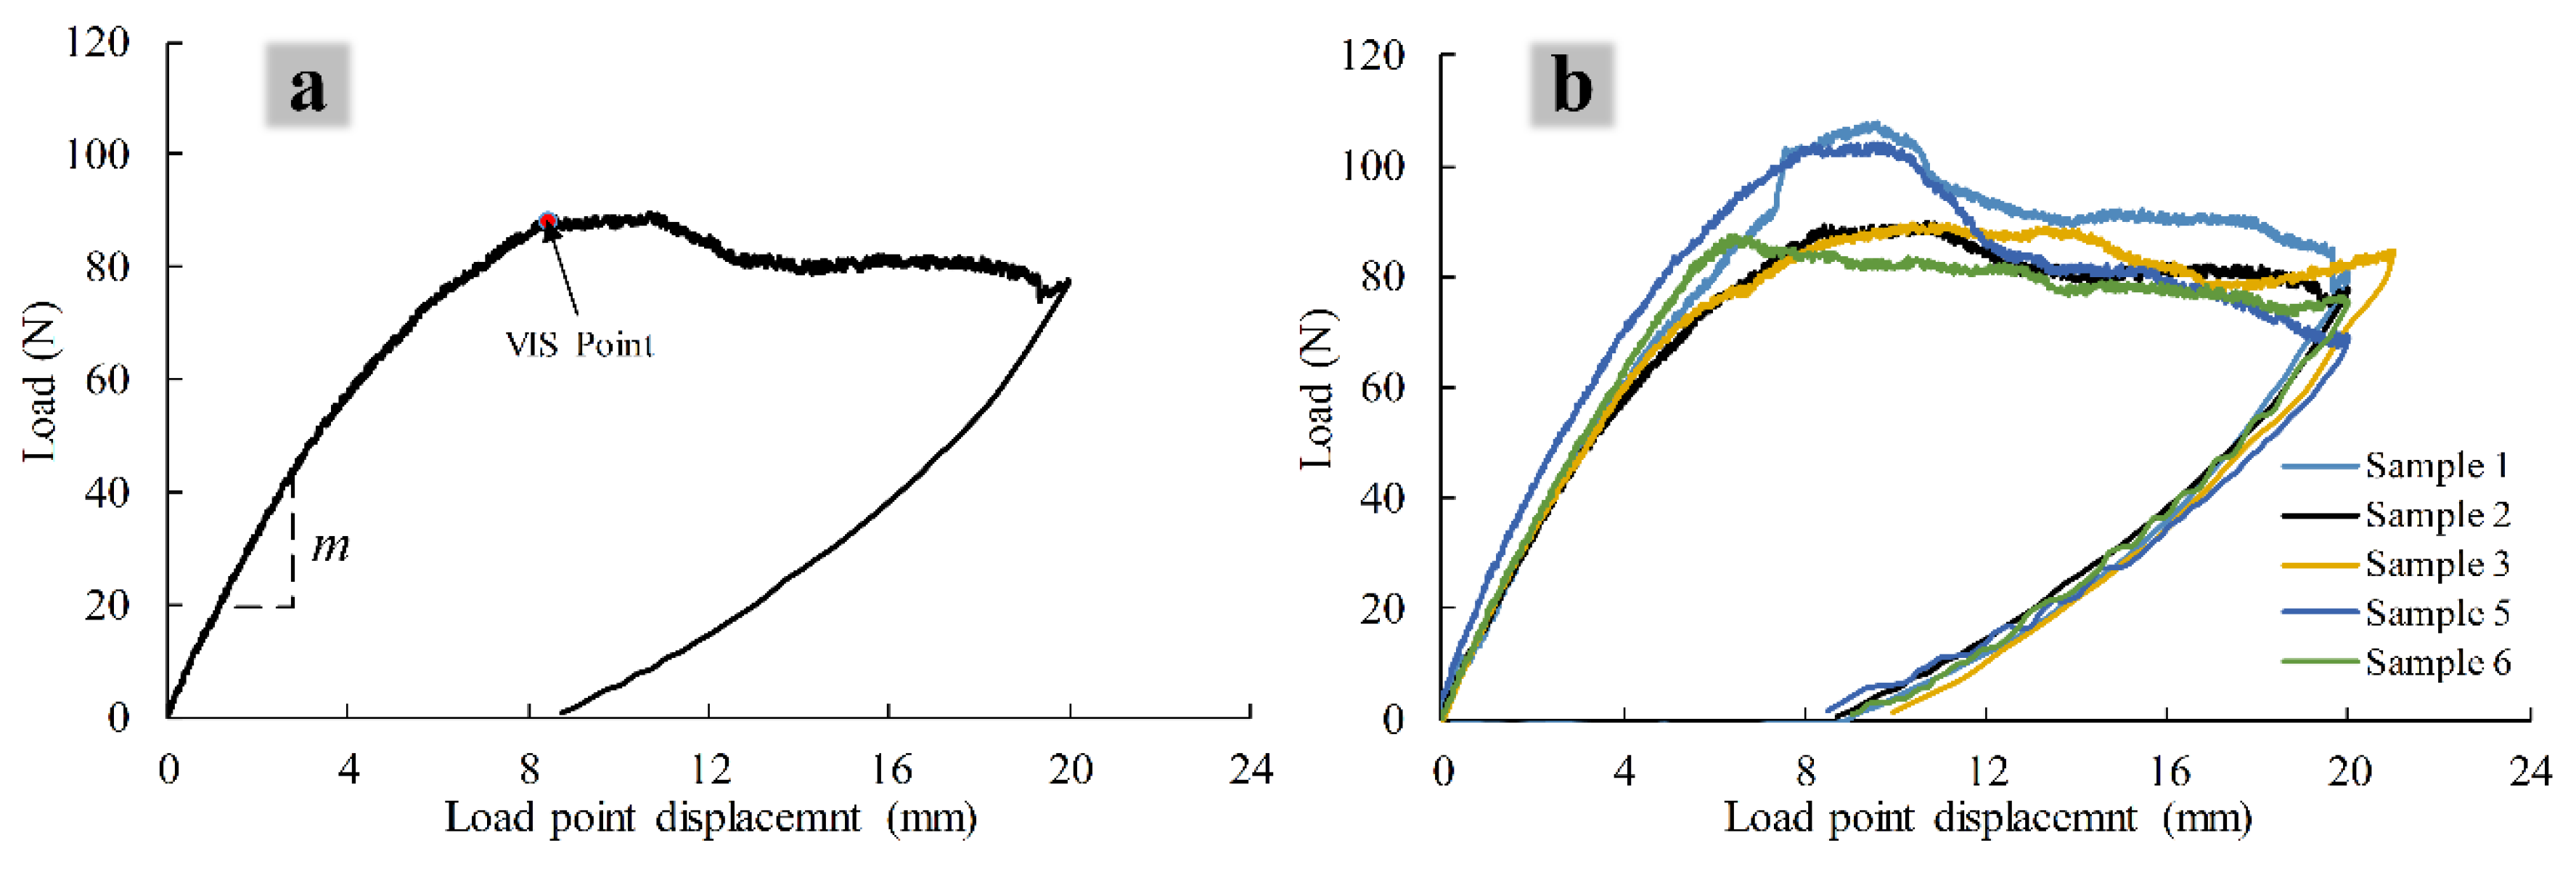
3.2. Mode II Interlaminar Fracture Toughness

Figure 11 presents the load-displacement curve of a typical ENF fracture test. As can be seen, the composite shows an overall linear response with a clear and sudden load drop, from which, respectively, the compliance of the specimen and the peak load can be determined. This is a normal and known behavior exhibited by ENF where, under an in-plane shear loading, the surfaces of the mid-plane plies slide over each other and lead to unstable crack growth and sudden load drop [54]. This failure allows only the measurement of crack initiation IFT. Almansour et al. observed an analogous behavior for woven flax/vinyl-ester [48] and non-woven flax mat/vinyl-ester [83], whereas Rajendran et al. [66,67] reported a complete nonlinear load-displacement curve for woven flax/epoxy composites. The experience of the latter, likewise to their DCB tests, is in stark contrast with the observations of previously cited authors (Almansour et al.) and many other authors [84,85,86].
The Mode II interlaminar fracture energy, GIIC, was calculated using the data reduction method explained in the previous section, and the averaged results of five valid NPC and PC tests are presented in Table 3. As can be noticed, considering the variations, the averaged results are in the same range and overlapping, however, NPC results have a larger variation.
There are very limited similar ENF test data available in the literature for comparison and validation purposes. In fact, there is no available ENF test being conducted and treated exactly in the same way for UD FFRECs; nevertheless, the closest ones are summarized in Table 4.
In Table 4, the obtained GIIC value for the under-study UD-FFREC laminate is placed within the range of those reported for similar tests. However, it is clearly lower than that of the closest material, i.e., [90,0]2s laminate with 0°//0° UD-flax/epoxy plies in the midplane [57]. This difference can not only be associated with the variation existing within the properties of natural fibers, it can also be due to the difference in the reinforcement configuration of the laminates, the GFRP tabs used for stiffening [90,0]2s laminate and the different data reduction method employed for calculation of GIIC. The results of Almansour et al. [48,83] show that replacing the out-most plies of the flax composite with high-stiffness basalt plies, which is equivalent to tabbing ENF specimens, augmented the GIIC value of the flax composites up to 62%. Therefore, tabbing can be one of the reasons for obtaining higher value for the compared composite. In addition, for DCB tests, it is proven that alterations in the off-center plies (orientation and material) of the UD laminates with the same delamination interface layers affect GIIC values [68,80,81]. There is no research result for ENF tests; however, this might be true for Mode II delamination, as well. Furthermore, the ASTM D7905 standard is followed in the current study; however, Bensadoun et al. used the classical simple beam theory method (SBT). While using different data reduction methods yields variations in the obtained GIIC values, for instance, applying the classical SBT used in their study to the test data of the current study, a higher value (612 J/m2) is obtained, Table 4. The findings of some authors [57,87] revealed that woven reinforcements result in higher GIIC values compared to UD ones; thus, the difference between the GIIC values of UD laminates and those of woven-fabric reinforced composites given in Table 4 is reasonable. Some authors believe that normally GIIC values are higher than GIC [57,88], whereas some observed the opposite [47,48,67], and some believe that both can be true for laminated composites [89]. As listed in Table 3 and Table 4, depending on the applied data reduction method, both cases can happen for the UD-FFREC. For the most similar instance ([90,0]2s laminate) discussed above, using ASTM D7905 standard for GIC, and SBT for GIIC results in the same trend.

3.3. Mode II Interlaminar Fracture Toughness

The mixed-mode loading behavior of the composite is plotted in Figure 12. For clarity, a single curve specimen is presented in Figure 12a and shows that in general, MMB specimens of FFREC exhibit an initial linear behavior followed by a nonlinear curve up to the peak load, after which, a plateau type curve with gradual load drop can be seen till the end of the test. Having plotted the curves of all 5 MMB specimens in Figure 12b, it can be seen that they exhibit a similar and consistent response with acceptable repeatability for the natural fiber composites.
The slope of the load-displacement curve (m) and the critical load (PC) need to be determined for the calculation of mixed-mode I/II fracture energy of the composite. m was directly calculated from the linear part on the curve, as shown in Figure 12a. However, there are some definitions for the PC in the standard; NL, VIS, and 5%/max points, as define for the calculations of GIC, and the most suitable one should be used. Due to the large nonlinearity part in the load-displacement curves, NL and the calculated 5% offset points reach too early for most of the tests on this curve, so that do they not seem to be the failure point and using the corresponding load would result in an underestimated fracture energy. On the other hand, comparing the VIS and the maximum force points, it was observed that the former happened earlier and right before peak load. This was also observed by Rajendran et al. [67], who used strain gauge to detect the onset of failure in similar tests. Accordingly, the VIS point was considered as the onset of delamination, and G(I/II)C was calculated based on the associated load at this point. For all the tests, the maximum deflection was smaller than the allowable deflection that was determined based on the criterion of the standard, and they were validated.
The obtained average mixed-mode I/II fracture energy value was G(I/II)C = 414 J/m2 with a 15% coefficient of variation. The variation of results seems relatively high; however, considering the nature of the natural fiber composites, the complexity of this test, and the subjective visual solution used for detecting the initiation of failure, it is reasonable. To the knowledge of the authors, MMB tests reported by Rajendran et al. [67] are the only literature data available for flax/epoxy composites. These authors tested three single-leg-bending specimens (GIIC/G(I/II)C = 0.43) of woven-flax/epoxy composite with Vf = 0.44, and using compliance calibration method, obtained G(I/II)C = 649.1 J/m2. Comparison is limited to the result of this work that is obviously higher than the value obtained in the present study; nevertheless, it should be noted that the reinforcement, manufacturing method, mode mixture (mixed-mode ratio), GII/G(I/II)C, and test method in their study was different with the current one. Furthermore, in the previous section, it was seen that woven reinforcement configurations produced higher IFT, and for the same material, in another work, the authors reported a much higher GIIC; therefore, this difference is reasonable. Considering that there is no other pertinent data for comparison, and compared to the obtained Mode I and Mode II fracture toughness, which were determined and validated earlier, this value of the mixed-mode fracture energy is the only value obtained for UD-FFRECs and reasonably acceptable. Therefore, it can be considered as the representative of the material property of this composite and used in engineering design and numerical simulation studies.
The B-K delamination criterion was used and fitted to the obtained data to determine the B-K fitting parameter, η, and to predict the interlaminar toughness for various mixed-mode ratios [90]:
G ( I / I I ) C = G I C + ( G I I C G I C ) ( G I I G ( I / I I ) C ) η
where GII/GI(I/II)C is the mixed-mode ratio, and η is the B-K fitting parameter. Using Equation (8), η = 0.35 is computed for the prediction of the GI(I/II)C with other mixed-mode ratios.

4. Conclusions

The present study investigated the interlaminar fracture energy of unidirectional flax epoxy composites in Mode I, Mode II, and Mixed-mode I/II delamination failure. The composite laminates were manufactured via RTM method and were tailored to have a constant Vf = 0.44, and a 13 µm-thick PTFE was placed in the midplane to induce pre-crack, it was then located by X-ray in the laminate. All the DCB, ENF, and MMB tests were conducted and validated according to corresponding ASTM standards to evaluate the fracture energies in Mode I, Mode I, and Mixed-mode I/II, respectively. For Mode I, GIC = 574 and GIC = 903 J/m2 were obtained respectively for crack initiation and propagation values. The obtained value based on the standard method for Mode II delamination is GIIC = 378 J/m2, which in contrast to the results of previous authors, calculated via the SBT data reduction method, is lower than GIC. However, when following the SBT method, GIIC =612 J/m2 is obtained, which is consistent with their results. MMB tests resulted in G(I/II)C = 414.4 J/m2 for Mixed-mode I/II fracture energy. Despite the limited, and in some cases lack of data available in the literature for comparison, the results are compared to the existing similar data and confirmed. In view of the fact that there is limited or no interlaminar fracture energy for these composites, the obtained values are valuable material properties to be further used in the design engineering field and numerical simulation methods.

Author Contributions

Conceptualization, Y.S., J.-F.C., G.L. and Y.B.; methodology, Y.S., J.-F.C., G.L.,Y.B., P.B. and N.V.; experiments, Y.S and N.V. resources, G.L., J.-F.C., Y.B., P.B.; data curation, Y.S, N.V.; writing—original draft preparation, Y.S.; writing—review and editing, J.-F.C., G.L., Y.B., P.B., N.V.; supervision, J.-F.C., G.L., Y.B.; project administration, Y.S.; funding acquisition, J.-F.C., G.L., Y.B. All authors have read and agreed to the published version of the manuscript.

Funding

This research was funded by the Natural Sciences and Engineering Research Council of Canada (NSERC), grant number RGPIN-2017-04305.

Acknowledgments

We sincerely thank Ahmed Maslouhi and Charly Batigne (Université de Sherbrooke), who provided access to their testing equipment as well as Bradley View from SAINT-GOBAIN PERFORMANCE CORPORATION, for supplying the PTFE films, that greatly assisted us in this research.

Conflicts of Interest

The authors declare no conflict of interest. The funders had no role in the design of the study; in the collection, analyses, or interpretation of data; in the writing of the manuscript, or in the decision to publish the results.

References

  1. Sanjay, M.R.; Siengchin, S.; Parameswaranpillai, J.; Jawaid, M.; Pruncu, C.I.; Khan, A. A comprehensive review of techniques for natural fibers as reinforcement in composites: Preparation, processing and characterization. Carbohydr. Polym. 2019, 207, 108–121. [Google Scholar] [CrossRef]
  2. Pil, L.; Bensadoun, F.; Pariset, J.; Verpoest, I. Why are designers fascinated by flax and hemp fibre composites? Compos. Part A Appl. Sci. Manuf. 2016, 83, 193–205. [Google Scholar] [CrossRef]
  3. Gurunathan, T.; Mohanty, S.; Nayak, S.K. A review of the recent developments in biocomposites based on natural fibres and their application perspectives. Compos. Part A Appl. Sci. Manuf. 2015, 77, 1–25. [Google Scholar] [CrossRef]
  4. Mohanty, A.; Misra, M.; Hinrichsen, G. Biofibres, biodegradable polymers and biocomposites: An overview. Macromol. Mater. Eng. 2000, 276, 1–24. [Google Scholar] [CrossRef]
  5. Ramesh, M.; Palanikumar, K.; Reddy, K. Plant fibre based bio-composites: Sustainable and renewable green materials. Renew. Sustain. Energy Rev. 2017, 79, 558–584. [Google Scholar] [CrossRef]
  6. Lotfi, A.; Li, H.; Dao, D.V.; Prusty, G. Natural fiber–reinforced composites: A review on material, manufacturing, and machinability. J. Thermoplast. Compos. Mater. 2019, 1–47. [Google Scholar] [CrossRef]
  7. Netravali, A.N.; Chabba, S. Composites get greener. Mater. Today 2003, 6, 22–29. [Google Scholar] [CrossRef]
  8. Rajak, D.K.; Pagar, D.D.; Menezes, P.L.; Linul, E. Fiber-Reinforced Polymer composites: Manufacturing, properties, and applications. Polymers 2019, 11, 1667. [Google Scholar] [CrossRef] [PubMed] [Green Version]
  9. Shekar, H.S.S.; Ramachandra, M. Green Composites: A Review. Mater. Today Proc. 2018, 5, 2518–2526. [Google Scholar] [CrossRef]
  10. Pickering, K.L.; Efendy, M.G.A.; Le, T.M. A review of recent developments in natural fibre composites and their mechanical performance. Compos. Part A Appl. Sci. Manuf. 2016, 83, 98–112. [Google Scholar] [CrossRef] [Green Version]
  11. Chandrasekar, M.; Ishak, M.; Sapuan, S.; Leman, Z.; Jawaid, M. A review on the characterisation of natural fibres and their composites after alkali treatment and water absorption. Plast. Rubber Compos. 2017, 46, 119–136. [Google Scholar] [CrossRef]
  12. Chandrasekar, M.; Shahroze, R.M.; Ishak, M.R.; Saba, N.; Jawaid, M.; Senthilkumar, K.; Kumar, T.S.M.; Siengchin, S. Flax and sugar palm reinforced epoxy composites: Effect of hybridization on physical, mechanical, morphological and dynamic mechanical properties. Mater. Res. Express 2019, 6, 105331. [Google Scholar] [CrossRef]
  13. Dicker, M.P.M.; Duckworth, P.F.; Baker, A.B.; Francois, G.; Hazzard, M.K.; Weaver, P.M. Green composites: A review of material attributes and complementary applications. Compos. Part A Appl. Sci. Manuf. 2014, 56, 280–289. [Google Scholar] [CrossRef]
  14. Bodros, E.; Pillin, I.; Montrelay, N.; Baley, C. Could biopolymers reinforced by randomly scattered flax fibre be used in structural applications? Compos. Sci. Technol. 2007, 67, 462–470. [Google Scholar] [CrossRef]
  15. Joshi, S.V.; Drzal, L.; Mohanty, A.; Arora, S. Are natural fiber composites environmentally superior to glass fiber reinforced composites? Compos. Part A Appl. Sci. Manuf. 2004, 35, 371–376. [Google Scholar] [CrossRef]
  16. Cristaldi, G.; Latteri, A.; Recca, G.; Cicala, G. Composites based on natural fibre fabrics. Woven Fabr. Eng. 2010, 17, 317–342. [Google Scholar]
  17. Yan, L.; Wang, B.; Kasal, B. Can plant-based natural flax replace basalt and e-glass for fiber-reinforced polymer tubular energy absorbers? A comparative study on quasi-static axial crushing. Front. Mater. 2017, 4, 42. [Google Scholar] [CrossRef]
  18. Yashas Gowda, T.G.; Sanjay, M.R.; Subrahmanya Bhat, K.; Madhu, P.; Senthamaraikannan, P.; Yogesha, B. Polymer matrix-natural fiber composites: An overview. Cogent Eng. 2018, 5, 1446667. [Google Scholar] [CrossRef]
  19. Fuqua, M.; Huo, S.; Ulven, C. Natural Fiber Reinforced Composites. Polym. Rev. 2012, 52, 259–320. [Google Scholar] [CrossRef]
  20. Shah, D.U. Developing plant fibre composites for structural applications by optimising composite parameters: A critical review. J. Mater. Sci. 2013, 48, 6083–6107. [Google Scholar] [CrossRef]
  21. Habibi, M.; Laperrière, L.; Lebrun, G.; Toubal, L. Combining short flax fiber mats and unidirectional flax yarns for composite applications: Effect of short flax fibers on biaxial mechanical properties and damage behaviour. Compos. Part B Eng. 2017, 123, 165–178. [Google Scholar] [CrossRef]
  22. John, M.J.; Thomas, S. Biofibres and biocomposites. Carbohydr. Polym. 2008, 71, 343–364. [Google Scholar] [CrossRef]
  23. Ahmad, F.; Choi, H.S.; Park, M.K. A review: Natural fiber composites selection in view of mechanical, light weight, and economic properties. Macromol. Mater. Eng. 2015, 300, 10–24. [Google Scholar] [CrossRef]
  24. Ramamoorthy, S.K.; Skrifvars, M.; Persson, A. A review of natural fibers used in biocomposites: Plant, animal and regenerated cellulose fibers. Polym. Rev. 2015, 55, 107–162. [Google Scholar] [CrossRef]
  25. Ramesh, M. Flax (Linum usitatissimum L.) fibre reinforced polymer composite materials: A review on preparation, properties and prospects. Prog. Mater. Sci. 2019, 102, 109–166. [Google Scholar] [CrossRef]
  26. Shah, D.U.; Schubel, P.J.; Clifford, M.J. Can flax replace E-glass in structural composites? A small wind turbine blade case study. Compos. Part B Eng. 2013, 52, 172–181. [Google Scholar] [CrossRef] [Green Version]
  27. Moudood, A.; Rahman, A.; Öchsner, A.; Islam, M.; Francucci, G. Flax fiber and its composites: An overview of water and moisture absorption impact on their performance. J. Reinf. Plast. Compos. 2018, 38, 323–339. [Google Scholar] [CrossRef] [Green Version]
  28. Moudood, A.; Rahman, A.; Khanlou, H.M.; Hall, W.; Öchsner, A.; Francucci, G. Environmental effects on the durability and the mechanical performance of flax fiber/bio-epoxy composites. Compos. Part B Eng. 2019, 171, 284–293. [Google Scholar] [CrossRef]
  29. Yan, L.; Chouw, N.; Jayaraman, K. Flax fibre and its composites–A review. Compos. Part B Eng. 2014, 56, 296–317. [Google Scholar] [CrossRef]
  30. Mohammad Khanlou, H.; Hall, W.; Woodfield, P.; Summerscales, J.; Francucci, G. The mechanical properties of flax fibre reinforced poly(lactic acid) bio-composites exposed to wet, freezing and humid environments. J. Compos. Mater. 2018, 52, 835–850. [Google Scholar] [CrossRef]
  31. Khanlou, H.M.; Woodfield, P.; Summerscales, J.; Francucci, G.; King, B.; Talebian, S.; Foroughi, J.; Hall, W. Estimation of mechanical property degradation of poly(lactic acid) and flax fibre reinforced poly(lactic acid) bio-composites during thermal processing. Measurement 2018, 116, 367–372. [Google Scholar] [CrossRef] [Green Version]
  32. Khanlou, H.M.; Woodfield, P.; Summerscales, J.; Hall, W. Consolidation process boundaries of the degradation of mechanical properties in compression moulding of natural-fibre bio-polymer composites. Polym. Degrad. Stab. 2017, 138, 115–125. [Google Scholar] [CrossRef]
  33. Moudood, A.; Hall, W.; Öchsner, A.; Li, H.; Rahman, A.; Francucci, G. Effect of moisture in flax fibres on the quality of their composites. J. Nat. Fibers 2019, 16, 209–224. [Google Scholar] [CrossRef] [Green Version]
  34. Goudenhooft, C.; Bourmaud, A.; Baley, C. Flax (Linum usitatissimum L.) fibers for composite reinforcement: Exploring the link between plant growth, cell walls development, and fiber properties. Front. Plant Sci. 2019, 10, 411. [Google Scholar] [CrossRef] [PubMed] [Green Version]
  35. Habibi, M.; Lebrun, G.; Laperrière, L. Experimental characterization of short flax fiber mat composites: Tensile and flexural properties and damage analysis using acoustic emission. J. Mater. Sci. 2017, 52, 6567–6580. [Google Scholar] [CrossRef]
  36. Habibi, M.; Laperrière, L.; Lebrun, G.; Chabot, B. Experimental investigation of the effect of short flax fibers on the permeability behavior of a new unidirectional flax/paper composite. Fibers 2016, 4, 22. [Google Scholar] [CrossRef] [Green Version]
  37. Goutianos, S.; Peijs, T. The Optimisation of Flax Fibre Yarns for the Development of High-Performance Natural Fibre Composites. Adv. Compos. Lett. 2003, 12, 096369350301200602. [Google Scholar] [CrossRef] [Green Version]
  38. Goutianos, S.; Peijs, T.; Nystrom, B.; Skrifvars, M. Development of flax fibre based textile reinforcements for composite applications. Appl. Compos. Mater. 2006, 13, 199–215. [Google Scholar] [CrossRef] [Green Version]
  39. Zhu, J.; Zhu, H.; Njuguna, J.; Abhyankar, H. Recent development of flax fibres and their reinforced composites based on different polymeric matrices. Materials 2013, 6, 5171–5198. [Google Scholar] [CrossRef] [PubMed]
  40. Yan, L.; Chouw, N.; Yuan, X. Improving the mechanical properties of natural fibre fabric reinforced epoxy composites by alkali treatment. J. Reinf. Plast. Compos. 2012, 31, 425–437. [Google Scholar] [CrossRef]
  41. Lefeuvre, A.; Bourmaud, A.; Baley, C. Optimization of the mechanical performance of UD flax/epoxy composites by selection of fibres along the stem. Compos. Part A Appl. Sci. Manuf. 2015, 77, 204–208. [Google Scholar] [CrossRef]
  42. El Sawi, I.; Bougherara, H.; Zitoune, R.; Fawaz, Z. Influence of the Manufacturing Process on the Mechanical Properties of Flax/Epoxy Composites. J. Biobased Mater. Bioenergy 2014, 8, 69–76. [Google Scholar] [CrossRef]
  43. Tay, T. Characterization and analysis of delamination fracture in composites: An overview of developments from 1990 to 2001. Appl. Mech. Rev. ASME 2003, 56, 1–32. [Google Scholar] [CrossRef]
  44. Nasuha, N.; Azmi, A.; Lih, T. A review on mode-I interlaminar fracture toughness of fibre reinforced composites. J. Phys. Conf. Ser. 2017, 908, 012024. [Google Scholar] [CrossRef] [Green Version]
  45. Chen, C.; Li, Y.; Yu, T. Interlaminar toughening in flax fiber-reinforced composites interleaved with carbon nanotube buckypaper. J. Reinf. Plast. Compos. 2014, 33, 1859–1868. [Google Scholar] [CrossRef]
  46. Nassar, M.; Nassar, M.M.A.; Arunachalam, R.; Alzebdeh, K. Machinability of natural fiber reinforced composites: A review. Int. J. Adv. Manuf. Technol. 2017, 88, 2985–3004. [Google Scholar] [CrossRef]
  47. Almansour, F.; Dhakal, H.; Zhang, Z.Y. Effect of water absorption on Mode I interlaminar fracture toughness of flax/basalt reinforced vinyl ester hybrid composites. Compos. Struct. 2017, 168, 813–825. [Google Scholar] [CrossRef] [Green Version]
  48. Almansour, F.; Dhakal, H.; Zhang, Z.Y. Investigation into Mode II interlaminar fracture toughness characteristics of flax/basalt reinforced vinyl ester hybrid composites. Compos. Sci. Technol. 2018, 154, 117–127. [Google Scholar] [CrossRef] [Green Version]
  49. Anderson, T.L. Fracture Mechanics: Fundamentals and Applications, 4th ed.; CRC Press: Boca Raton, FL, USA, 2017. [Google Scholar]
  50. Zhu, Y. Characterization of Interlaminar Fracture Toughness of a Carbon/epoxy Composite Material. Master′s Thesis, Pennsylvania State University, University Park, PA, USA, 2009. [Google Scholar]
  51. Walker, C.A.; Jamasri. Mixed-mode stress intensity factors in finite, edge-cracked orthotropic plates. J. Strain Anal. Eng. Des. 1995, 30, 83–90. [Google Scholar] [CrossRef]
  52. Prasad, M.S.; Venkatesha, C.; Jayaraju, T. Experimental methods of determining fracture toughness of fiber reinforced polymer composites under various loading conditions. J. Miner. Mater. Charact. Eng. 2011, 10, 1263. [Google Scholar] [CrossRef]
  53. ASTM D5528. Standard Test Method for Mode I Interlaminar Fracture Toughness of Unidirectional Fiber-Reinforced Polymer Matrix Composites; ASTM International: West Conshohocken, PA, USA, 2013. [Google Scholar] [CrossRef]
  54. ASTM D7905. Standard Test Method for Determination of the Mode II Interlaminar Fracture Toughness of Unidirectional Fiber-Reinforced Polymer Matrix Composites; ASTM International: West Conshohocken, PA, USA, 2019. [Google Scholar] [CrossRef]
  55. ASTM D6671. Standard Test Method for Mixed Mode I-Mode II Interlaminar Fracture Toughness of Unidirectional Fiber Reinforced Polymer Matrix Composites; ASTM International: West Conshohocken, PA, USA, 2019. [Google Scholar] [CrossRef]
  56. Ooi, C.; Tan, C.; Azmi, A. Experimental study towards inter-laminar fracture toughness of different fibre reinforced polymer composites. J. Phys.: Conf. Ser. 2019, 1150, 012029. [Google Scholar] [CrossRef] [Green Version]
  57. Bensadoun, F.; Verpoest, I.; Van Vuure, A.W. Interlaminar fracture toughness of flax-epoxy composites. J. Reinf. Plast. Compos. 2017, 36, 121–136. [Google Scholar] [CrossRef]
  58. Wong, S.; Shanks, R.A.; Hodzic, A. Mechanical behavior and fracture toughness of poly(L-lactic acid)-Natural fiber composites modified with hyperbranched polymers. Macromol. Mater. Eng. 2004, 289, 447–456. [Google Scholar] [CrossRef]
  59. Zhang, Y.; Li, Y.; Ma, H.; Yu, T. Tensile and interfacial properties of unidirectional flax/glass fiber reinforced hybrid composites. Compos. Sci. Technol. 2013, 88, 172–177. [Google Scholar] [CrossRef]
  60. Li, Y.; Mai, Y.-W.; Ye, L. Effects of fibre surface treatment on fracture-mechanical properties of sisal-fibre composites. Compos. Interfaces 2005, 12, 141–163. [Google Scholar] [CrossRef]
  61. Li, Y.; Wang, D.; Ma, H. Improving interlaminar fracture toughness of flax fiber/epoxy composites with chopped flax yarn interleaving. Sci. China Technol. Sci. 2015, 58, 1745–1752. [Google Scholar] [CrossRef]
  62. Ravandi, M.; Teo, W.; Tran, L.; Yong, M.; Tay, T. The effects of through-the-thickness stitching on the Mode I interlaminar fracture toughness of flax/epoxy composite laminates. Mater. Des. 2016, 109, 659–669. [Google Scholar] [CrossRef]
  63. Ravandi, M.; Teo, W.; Tran, L.; Yong, M.; Tay, T. Mode I Interlaminar Fracture Toughness of Natural Fiber Stitched Flax/Epoxy Composite Laminates–Experimental and Numerical Analysis. In Proceedings of the American Society for Composites: Thirty-First Technical Conference, Williamsburg, VA, USA, 19–22 September 2016. [Google Scholar]
  64. Ravandi, M.; Teo, W.S.; Yong, M.S.; Tay, T.E. Prediction of Mode I interlaminar fracture toughness of stitched flax fiber composites. J. Mater. Sci. 2018, 53, 4173–4188. [Google Scholar] [CrossRef]
  65. Vo Hong, N.; Beckers, K.; Goderis, B.; Van Puyvelde, P.; Verpoest, I.; Willem Van Vuure, A. Fracture toughness of unidirectional flax fiber composites with rigid gliadin matrix. J. Reinf. Plast. Compos. 2018, 37, 1163–1174. [Google Scholar] [CrossRef]
  66. Rajendran, T.S.; Johar, M.; Hassan, S.; Wong, K.J. Mode I and Mode II Delamination of Flax/Epoxy Composite Laminate. In MATEC Web of Conferences (AAME 2018); EDP Sciences: Les Ulis, France, 2018; p. 01002. [Google Scholar] [CrossRef]
  67. Rajendran, T.S.; Johar, M.; Low, K.O.; Abu Hassan, S.; Wong, K.J. Interlaminar fracture toughness of a plain weave flax/epoxy composite. Plast. Rubber Compos. 2019, 48, 74–81. [Google Scholar] [CrossRef]
  68. Saidane, E.H.; Scida, D.; Pac, M.-J.; Ayad, R. Mode-I interlaminar fracture toughness of flax, glass and hybrid flax-glass fibre woven composites: Failure mechanism evaluation using acoustic emission analysis. Polym. Test. 2019, 75, 246–253. [Google Scholar] [CrossRef]
  69. Davies, P.; Blackman, B.R.K.; Brunner, A.J. Standard test methods for delamination resistance of composite materials: Current status. Appl. Compos. Mater. 1998, 5, 345–364. [Google Scholar] [CrossRef]
  70. Fathi, A.; Keller, J.-H.; Altstaedt, V. Full-field shear analyses of sandwich core materials using Digital Image Correlation (DIC). Compos. Part B Eng. 2015, 70, 156–166. [Google Scholar] [CrossRef]
  71. Wang, H. Marker identification technique for deformation measurement. Adv. Mech. Eng. 2013, 5, 246318. [Google Scholar] [CrossRef]
  72. Xu, D.; Cerbu, C.; Wang, H.; Rosca, I.C. Analysis of the hybrid composite materials reinforced with natural fibers considering digital image correlation (DIC) measurements. Mech. Mater. 2019, 135, 46–56. [Google Scholar] [CrossRef]
  73. Tekieli, M.; De Santis, S.; de Felice, G.; Kwiecień, A.; Roscini, F. Application of Digital Image Correlation to composite reinforcements testing. Compos. Struct. 2017, 160, 670–688. [Google Scholar] [CrossRef]
  74. Anzelotti, G.; Nicoletto, G.; Riva, E. Mesomechanic strain analysis of twill-weave composite lamina under unidirectional in-plane tension. Compos. Part A Appl. Sci. Manuf. 2008, 39, 1294–1301. [Google Scholar] [CrossRef]
  75. Takano, N.; Zako, M.; Fujitsu, R.; Nishiyabu, K. Study on large deformation characteristics of knitted fabric reinforced thermoplastic composites at forming temperature by digital image-based strain measurement technique. Compos. Sci. Technol. 2004, 64, 2153–2163. [Google Scholar] [CrossRef]
  76. Wang, H.; Hou, Z. Application of Genetic Algorithms in a surface deformation measurement technique. In Proceedings of the 2010 Sixth International Conference on Natural Computation, Yantai, China, 10–12 August 2010; Volume 2010, pp. 2291–2295. [Google Scholar] [CrossRef]
  77. Saadati, Y.; Lebrun, G.; Chatelain, J.-F.; Beauchamp, Y. Experimental investigation of failure mechanisms and evaluation of physical/mechanical properties of unidirectional flax–epoxy composites. J. Compos. Mater. 2020, 0021998320902243. [Google Scholar] [CrossRef]
  78. Airoldi, A.; Dávila, C.G. Identification of material parameters for modelling delamination in the presence of fibre bridging. Compos. Struct. 2012, 94, 3240–3249. [Google Scholar] [CrossRef]
  79. De Kalbermatten, T.; Jäggi, R.; Flüeler, P.; Kausch, H.H.; Davies, P. Microfocus radiography studies during mode I interlaminar fracture tests on composites. J. Mater. Sci. Lett. 1992, 11, 543–546. [Google Scholar] [CrossRef]
  80. Robinson, P. The effects of starter film thickness, residual stresses and layup on GIc of a 0°/0° interface. Adv. Compos. Lett. 1996, 5, 159–163. [Google Scholar] [CrossRef] [Green Version]
  81. Shokrieh, M.M.; Heidari-Rarani, M. Effect of stacking sequence on R-curve behavior of glass/epoxy DCB laminates with 0°//0° crack interface. Mater. Sci. Eng. A 2011, 529, 265–269. [Google Scholar] [CrossRef]
  82. Pinto, M.; Chalivendra, V.B.; Kim, Y.K.; Lewis, A.F. Improving the strength and service life of jute/epoxy laminar composites for structural applications. Compos. Struct. 2016, 156, 333–337. [Google Scholar] [CrossRef]
  83. Almansour, F.A.; Dhakal, H.N.; Zhang, Z.Y.; Ghasemnejad, H. Effect of hybridization on the mode II fracture toughness properties of flax/vinyl ester composites. Polym. Compos. 2015, 38, 1732–1740. [Google Scholar] [CrossRef]
  84. Al-Khudairi, O.; Hadavinia, H.; Waggott, A.; Lewis, E.; Little, C. Characterising mode I/mode II fatigue delamination growth in unidirectional fibre reinforced polymer laminates. Mater. Des. 2015, 66, 93–102. [Google Scholar] [CrossRef] [Green Version]
  85. Johar, M.; Israr, H.A.; Low, K.O.; Wong, K.J. Numerical simulation methodology for mode II delamination of quasi-isotropic quasi-homogeneous composite laminates. J. Compos. Mater. 2017, 51, 3955–3968. [Google Scholar] [CrossRef]
  86. Wang, W.-X.; Nakata, M.; Takao, Y.; Matsubara, T. Experimental investigation on test methods for mode II interlaminar fracture testing of carbon fiber reinforced composites. Compos. Part A Appl. Sci. Manuf. 2009, 40, 1447–1455. [Google Scholar] [CrossRef]
  87. Compston, P.; Jar, P.Y.B. Comparison of interlaminar fracture toughness in unidirectional and woven roving marine composites. Appl. Compos. Mater. 1998, 5, 189–206. [Google Scholar] [CrossRef]
  88. Lens, L.N.; Bittencourt, E.; d’Avila, V.M.R. Constitutive models for cohesive zones in mixed-mode fracture of plain concrete. Eng. Fract. Mech. 2009, 76, 2281–2297. [Google Scholar] [CrossRef]
  89. Dillard, D.A.; Singh, H.K.; Pohlit, D.J.; Starbuck, J.M. Observations of Decreased Fracture Toughness for Mixed Mode Fracture Testing of Adhesively Bonded Joints. J. Adhes. Sci. Technol. 2009, 23, 1515–1530. [Google Scholar] [CrossRef] [Green Version]
  90. Benzeggagh, M.L.; Kenane, M. Measurement of mixed-mode delamination fracture toughness of unidirectional glass/epoxy composites with mixed-mode bending apparatus. Compos. Sci. Technol. 1996, 56, 439–449. [Google Scholar] [CrossRef]
Figure 1. Fracture modes and applied loadings [49].
Jcs 04 00066 g001
Figure 2. (a) Unidirectional flax fiber preform and (b) configuration of flax/epoxy pre-cracked laminate.
Jcs 04 00066 g002
Figure 3. Double Cantilever Beam (DCB) specimen: (a) configuration and dimensions, (b) final test specimen.
Jcs 04 00066 g003
Figure 4. Mode I delamination test setup with a DIC system to follow crack propagation.
Jcs 04 00066 g004
Figure 5. ENF specimen for Mode II delamination: (a) configuration and dimensions, (b) specimen and loading fixture.
Jcs 04 00066 g005
Figure 6. Mode II delamination test setup.
Jcs 04 00066 g006
Figure 7. Mixed-Mode Bending (MMB) test specimen for Mixed-mode I/II delamination: (a) configuration and dimensions, (b) test fixture and final test specimen.
Jcs 04 00066 g007
Figure 8. Mixed-mode I/II delamination test setup.
Jcs 04 00066 g008
Figure 9. Load vs. crack opening displacement (COD) of the DCB specimen: (a) Typical loading/unloading cycle and initial GIC value measurement points, and (b) overall initial behavior.
Jcs 04 00066 g009
Figure 10. Crack Resistance Curve (R-Curve) of a typical UD-FFREC DCB, the plateau region is highlighted.
Jcs 04 00066 g010
Figure 11. Load-displacement curve of ENF test and illustration of compliance (C) and PMax determination.
Jcs 04 00066 g011
Figure 12. Load-displacement curves of MMB tests: (a) determination of m and PC, and (b) all curves of the tests.
Jcs 04 00066 g012
Table 1. Mode I fracture toughness values for UD FFREC.
Mode I GICGIC
(NL Point)
GIC
(VIS Point)
GIC (5%/Max)GIC (Propagation)
Average (J/m2)574641644903
Standard deviation38312655
Coefficient of variation (%)6.64.84.06.1
Table 2. Mode I interlaminar fracture toughness tests and values for FFRPCs.
Current StudyRavandi
et al. [62]
Ravandi
et al. [64]
Bensadoun
et al. [57]
Bensadoun
et al. [57]
Almansour
et al. [47]
Rajendran
et al. [66,67]
Li et al. [61]Chen et al. [45]Saidane
et al. [68]
Zhang
et al. [59]
Vo Hong
et al. [65]
ReinforcementUD-flax
(200 g/m2)
[0]12
4 × 4 W-flax fabric
(500 g/m2)
UD-flax
(110 g/m2)
[0]16
0°/0° flax-plies
[90,0]2s
W-flax fabrics(±45°) W-flax fabric2 × 2 W-flax fabric
(200 g/m2)
UD-T-flax fabric
(200 g/m2)
UD-T-flax fabric2 × 2 W-flax fabricUD-T-flax fabricUD-flax
MatrixEpoxyEpoxyEpoxyEpoxyEpoxyVinyl esterEpoxyEpoxyPhenolic resinEpoxyPhenolic resinGliadin powder
Stiffener-CFRPGFRPGFRPGFRP------GFRP
Composite fabricationRTM VARI VARI RTM RTM VI ±Hand layupCM +VARI CM +CM +Hand layup
Vf (%)413140404031446073406740
Test /Data reduction methodASTM D5528/MBTASTM D5528/MBTASTM D5528/MBTASTM D5528/MBTASTM D5528/MBTASTM D5528/MBTCCASTM D5528/CC *ASTM D5528/CCASTM D5528/MBTASTM D5528/-ISO 15024/MBT
Damage initiation pointNL-VISNLNLVISSG detected/Pmax-VISAE detected-NL
GIC (J/m2) Initiation574≈2000771496457–7543579363/485-≈440107928050–60
GIC (J/m2) Propagation903≈320012506631151–159711789-1400≈580≈2400550450–550
Vacuum-assisted resin infusion, Resin transfer molding, ± Vacuum infusion, + Compression molding, * In the paper mentioned MTB (by mistake), AE: Acoustic Emission, W: Woven, UD: Unidirectional, T: Twisted, SG: Strain gauge, CC: Compliance Calibration, MBT: Modified Beam Theory.
Table 3. Mode II fracture toughness values for UD FFREC.
GIIC (NPC)GIIC (PC)GIIC (Average)
Mean (J/m2)401378390
Standard deviation18718
Coefficient of variation (%)4.51.94.6
Table 4. Mode II interlaminar fracture toughness tests and values for FFRPCs.
Current StudyBensadoun et al. [57]Almansour et al. [48]Almansour et al. [83]Rajendran et al. [67]
ReinforcementUD-flax (200 g/m2)0°//0° UD-flax plies in [90,0]2sW-flax fabrics(±45°) W-flax fabricNon-woven flax matW-flax fabric (200 g/m2)
MatrixEpoxyEpoxyEpoxyvinyl estervinyl esterEpoxy
Stiffener-GFRPGFRP−/basalt−/basalt-
Composite fabricationRTMRTMRTMVARTMHand layup + CMHand layup
Fiber contentVf = 0.41Vf = 0.40Vf = 0.40100 Wt.%Vf = 0.23Vf = 0.44
Test /Data reduction methodASTM D7905/ CC/SBTSBTSBTSBTSBTCC
GIIC (J/m2)378/6127281315-1872266/4301940/2173962
UD: Unidirectional, W: Woven, RTM: Resin transfer molding, VARTM: Vacuum-assisted resin transfer molding, CM: Compression molding, SBT: Classical Simple Beam Theory, CC: Compliance Calibration.

