Fast and Facile Synthesis of Pt Nanoparticles Supported on Ketjen Black by Solution Plasma Sputtering as Bifunctional HER/ORR Catalysts


Abstract
:1. Introduction
2. Materials and Methods
2.1. Materials
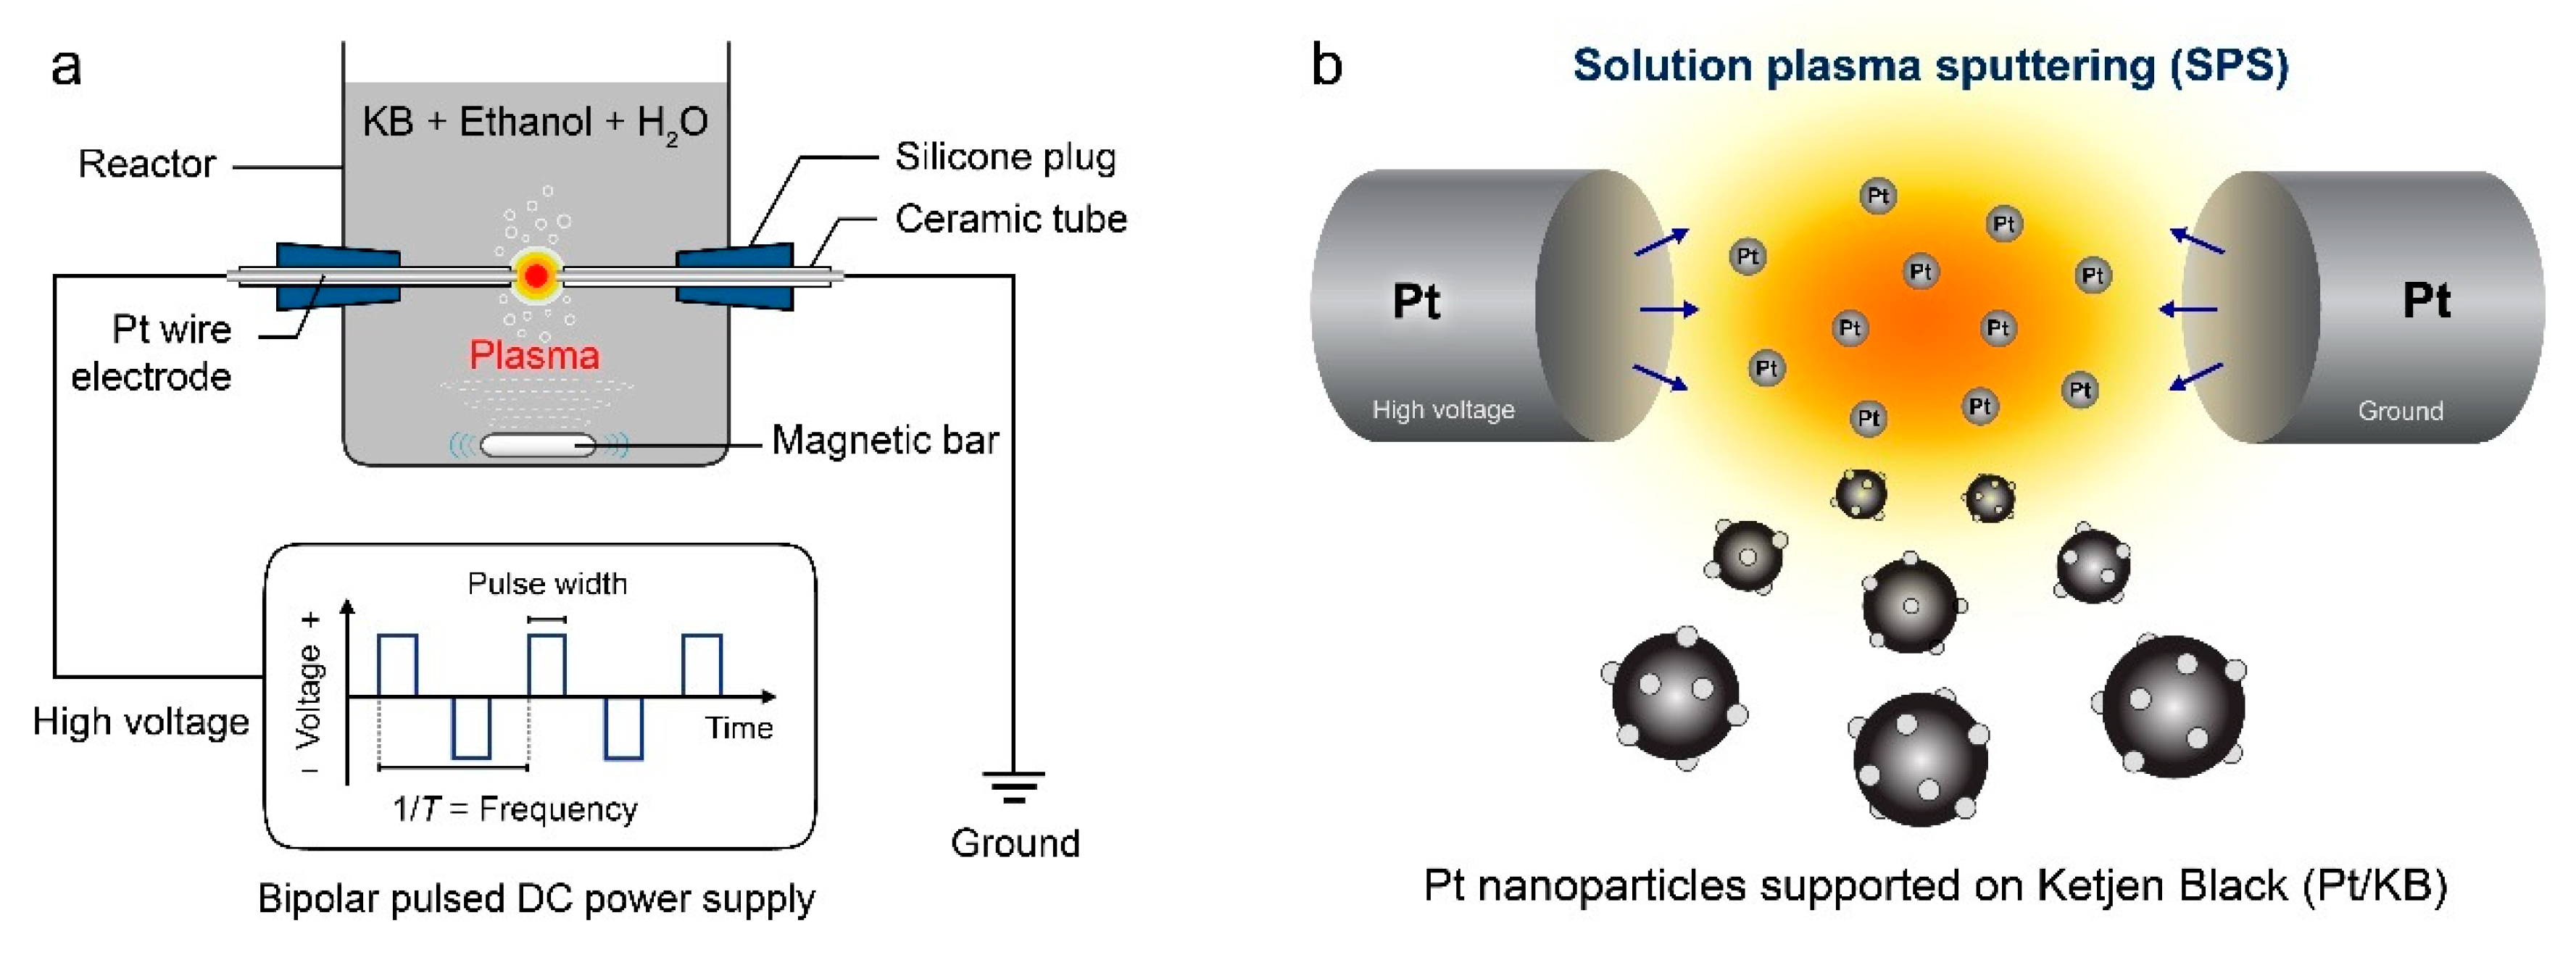
2.2. Preparation of Pt/KB Catalysts by SPS
2.3. Characterization
2.4. Electrode Preparation
2.5. HER and ORR Activity Measurements
3. Results and Discussion
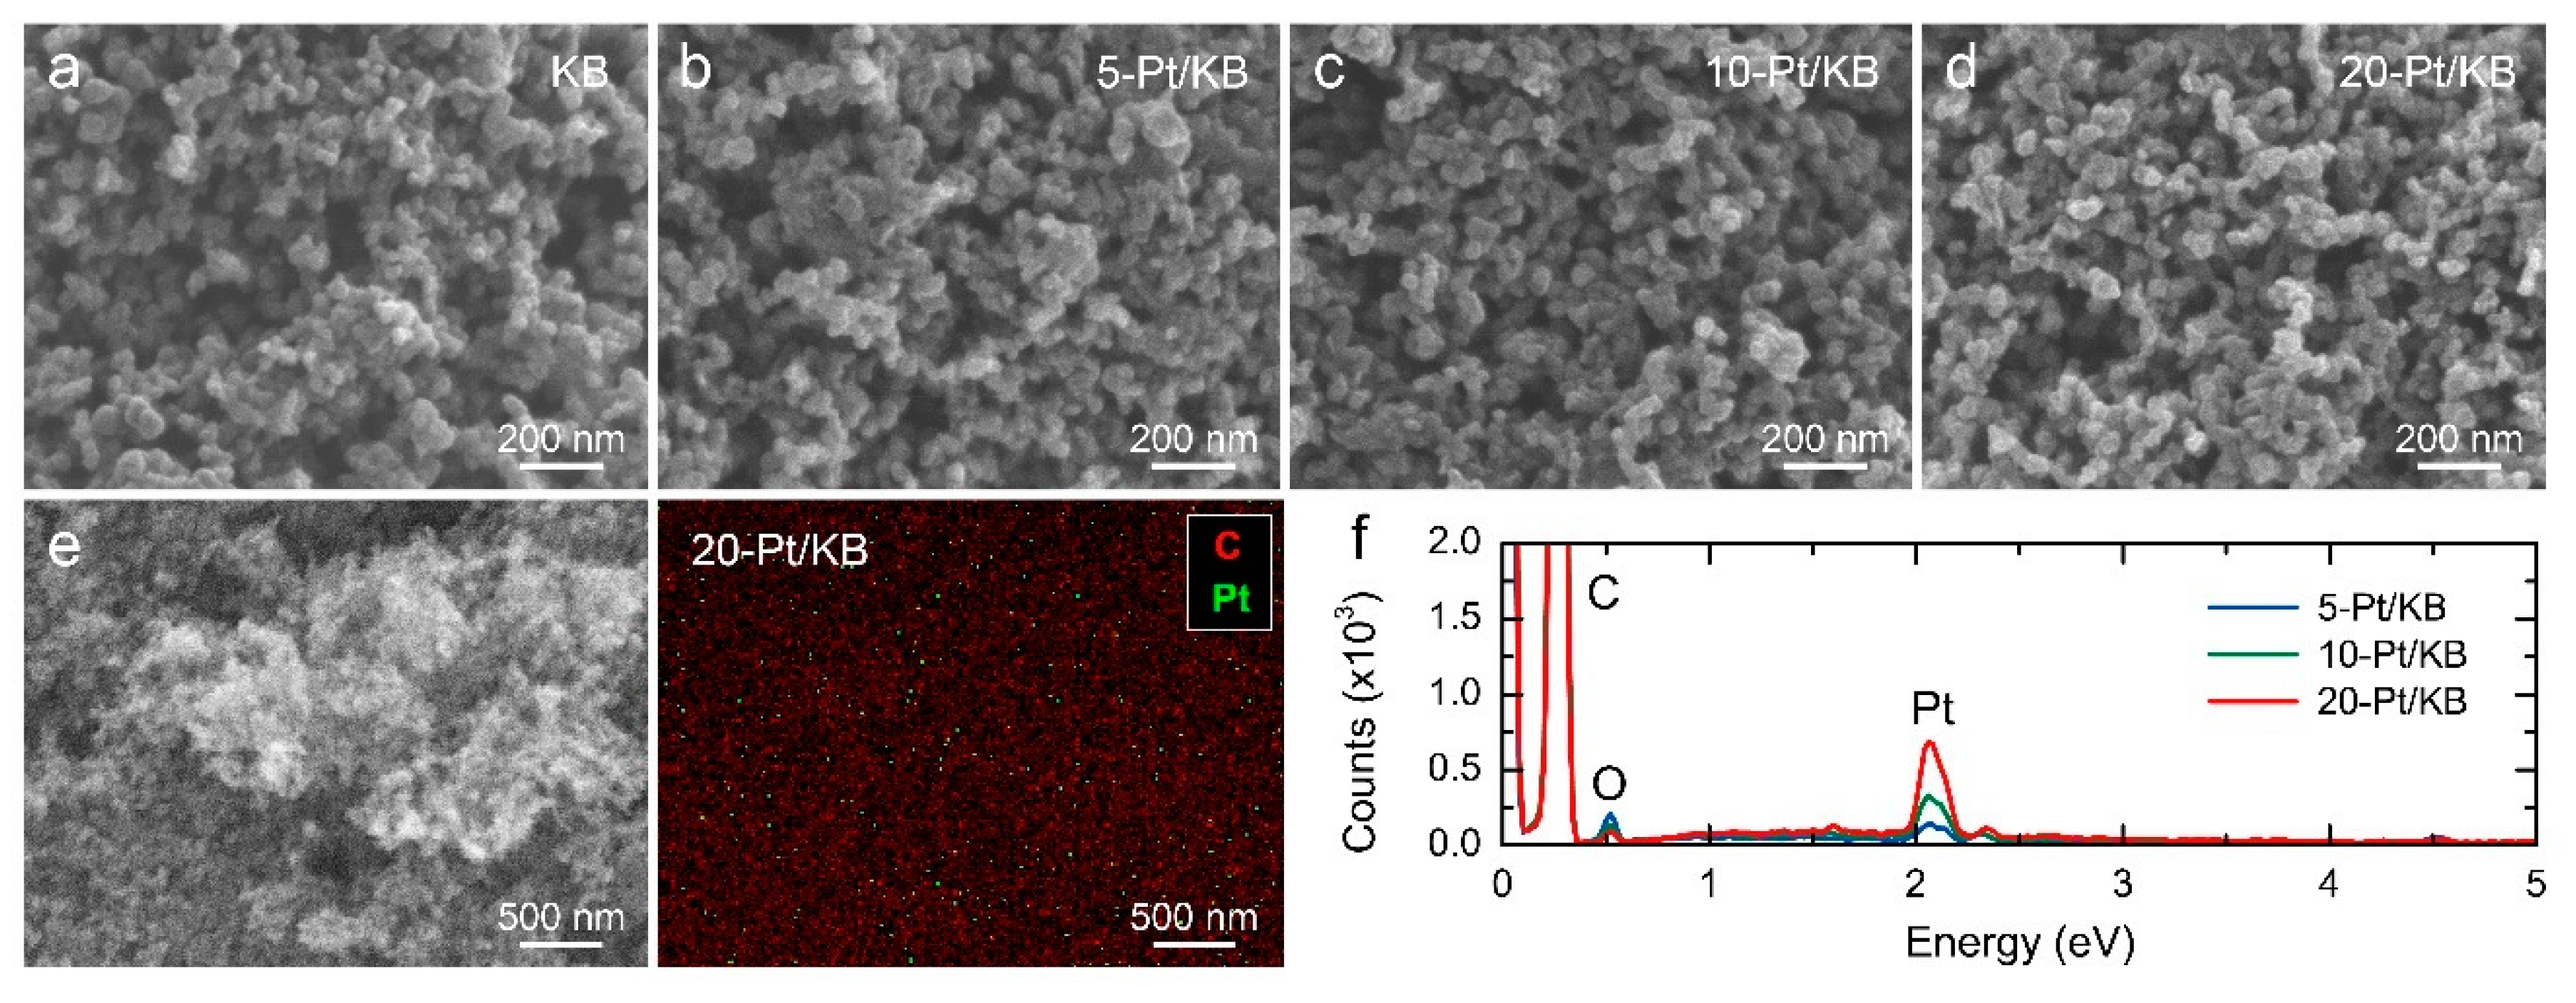
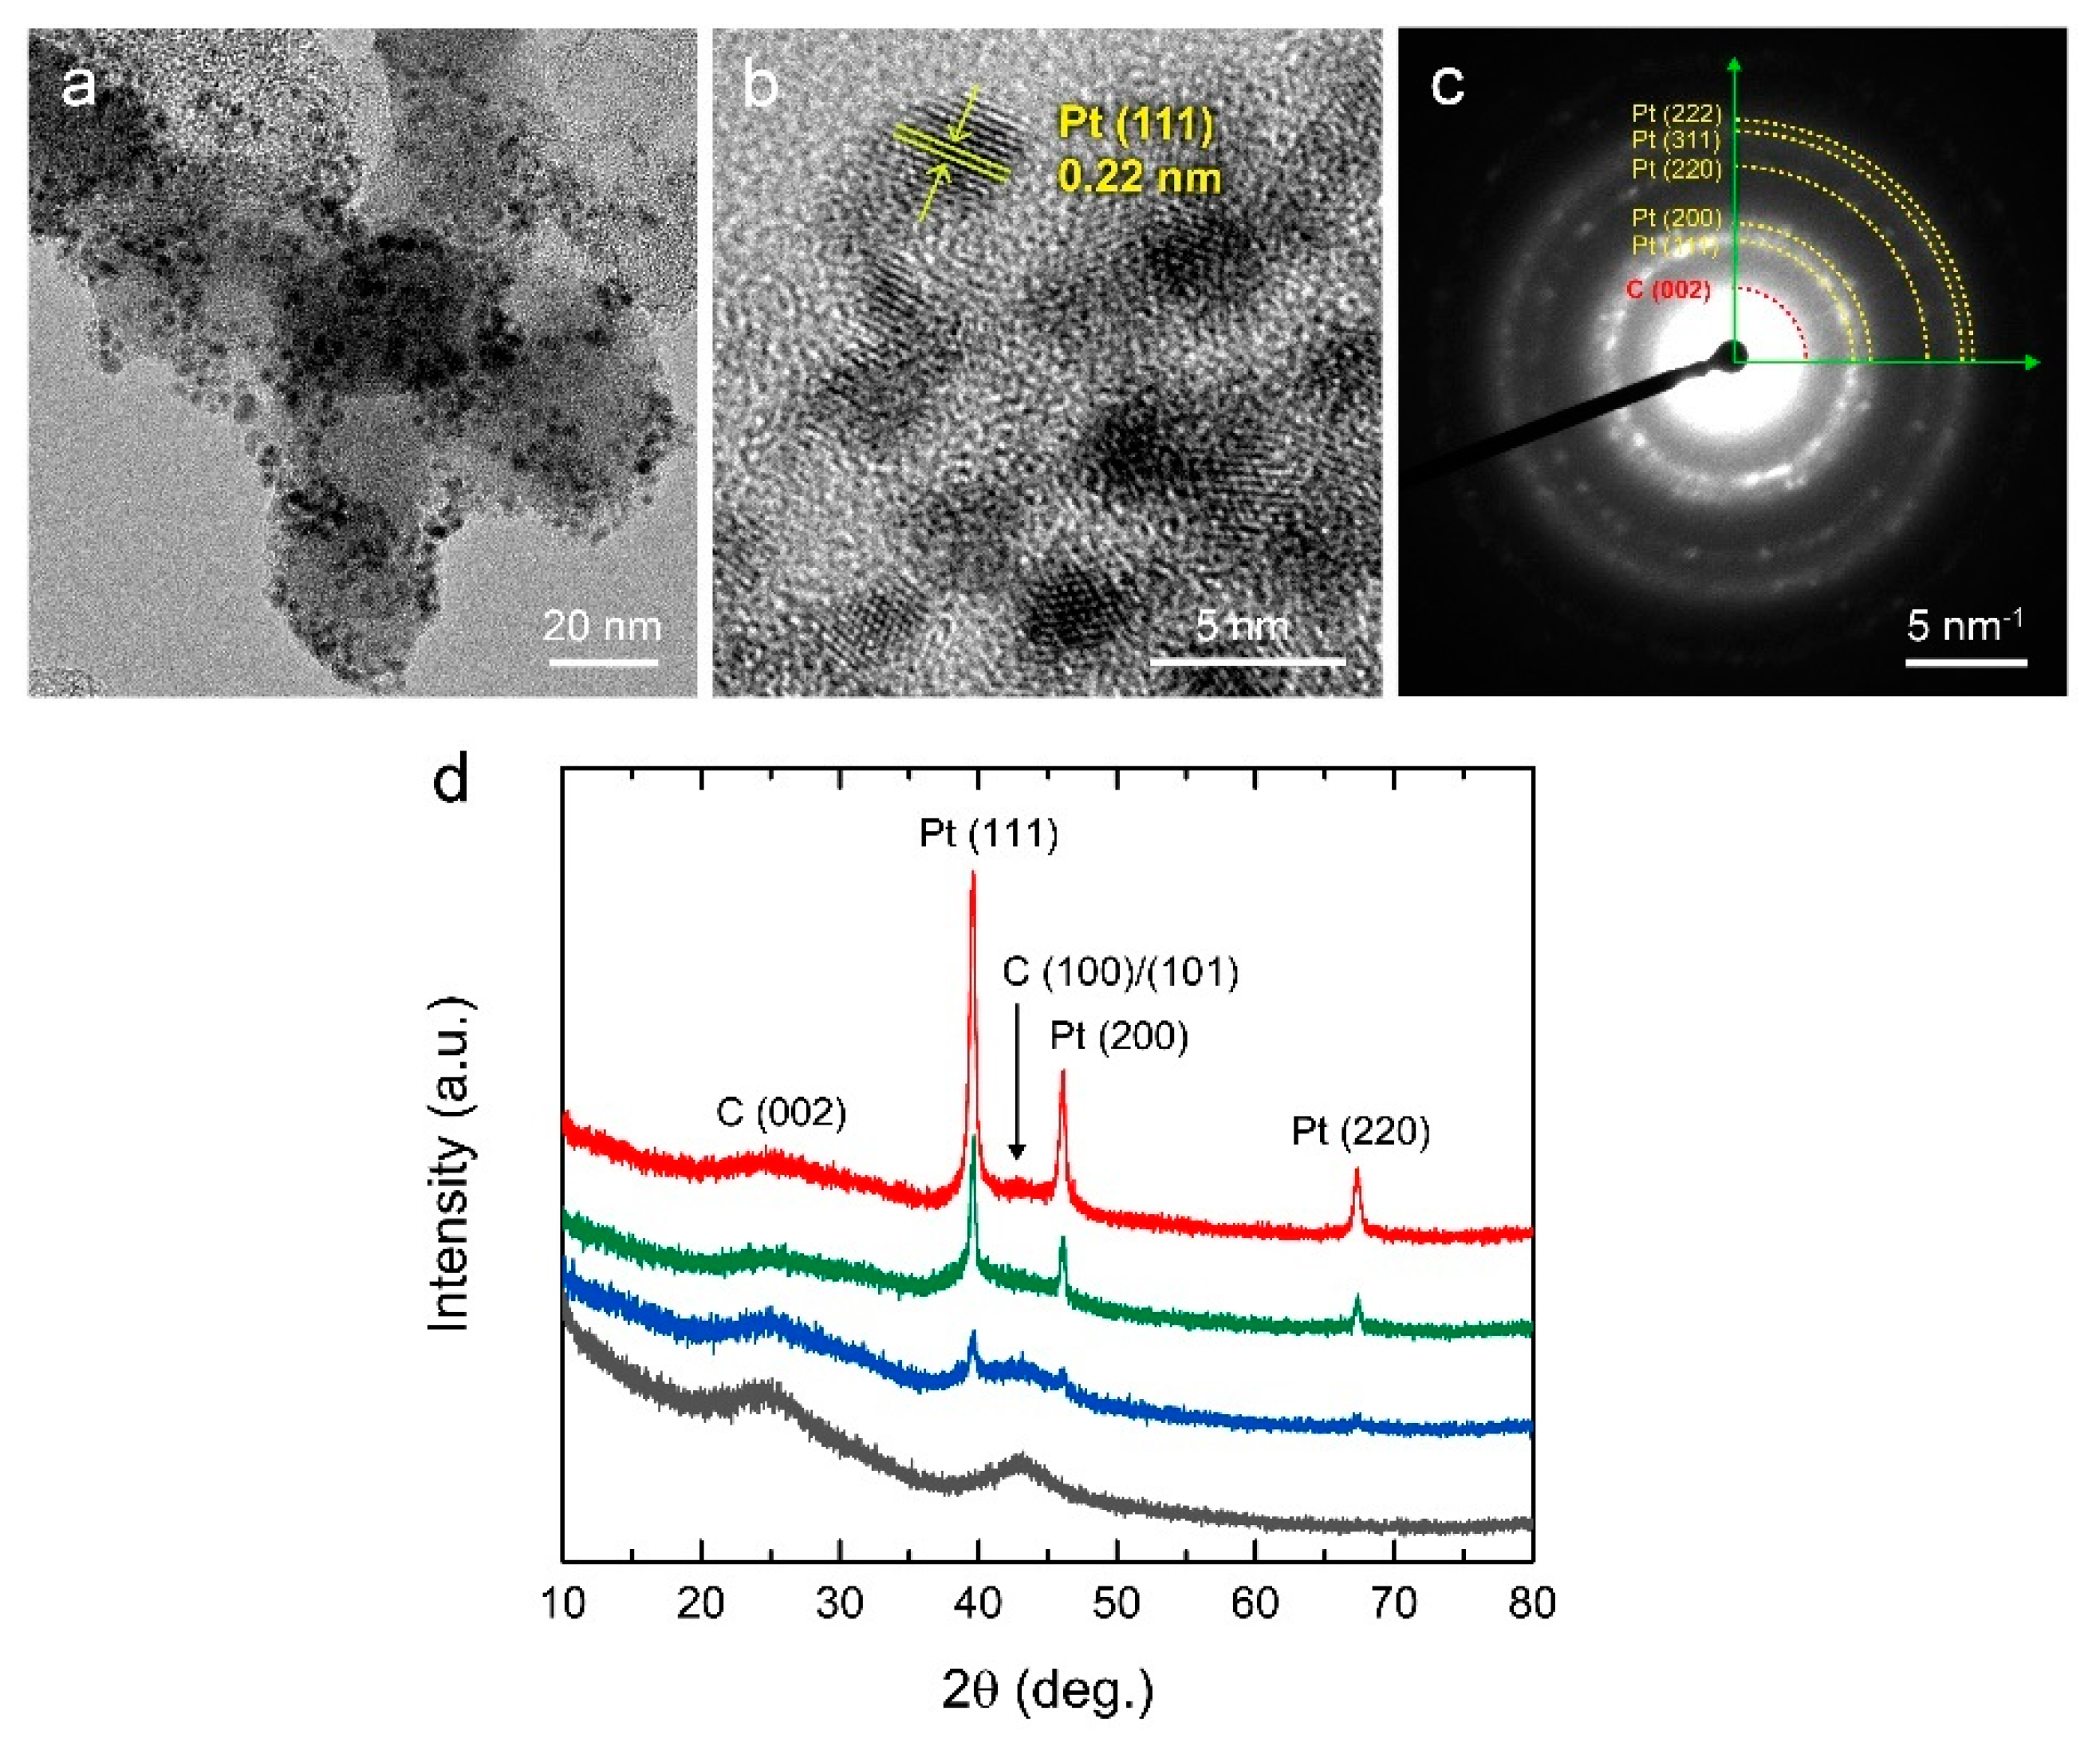
3.1. FE-SEM and TEM Investigations
3.2. XRD Analysis
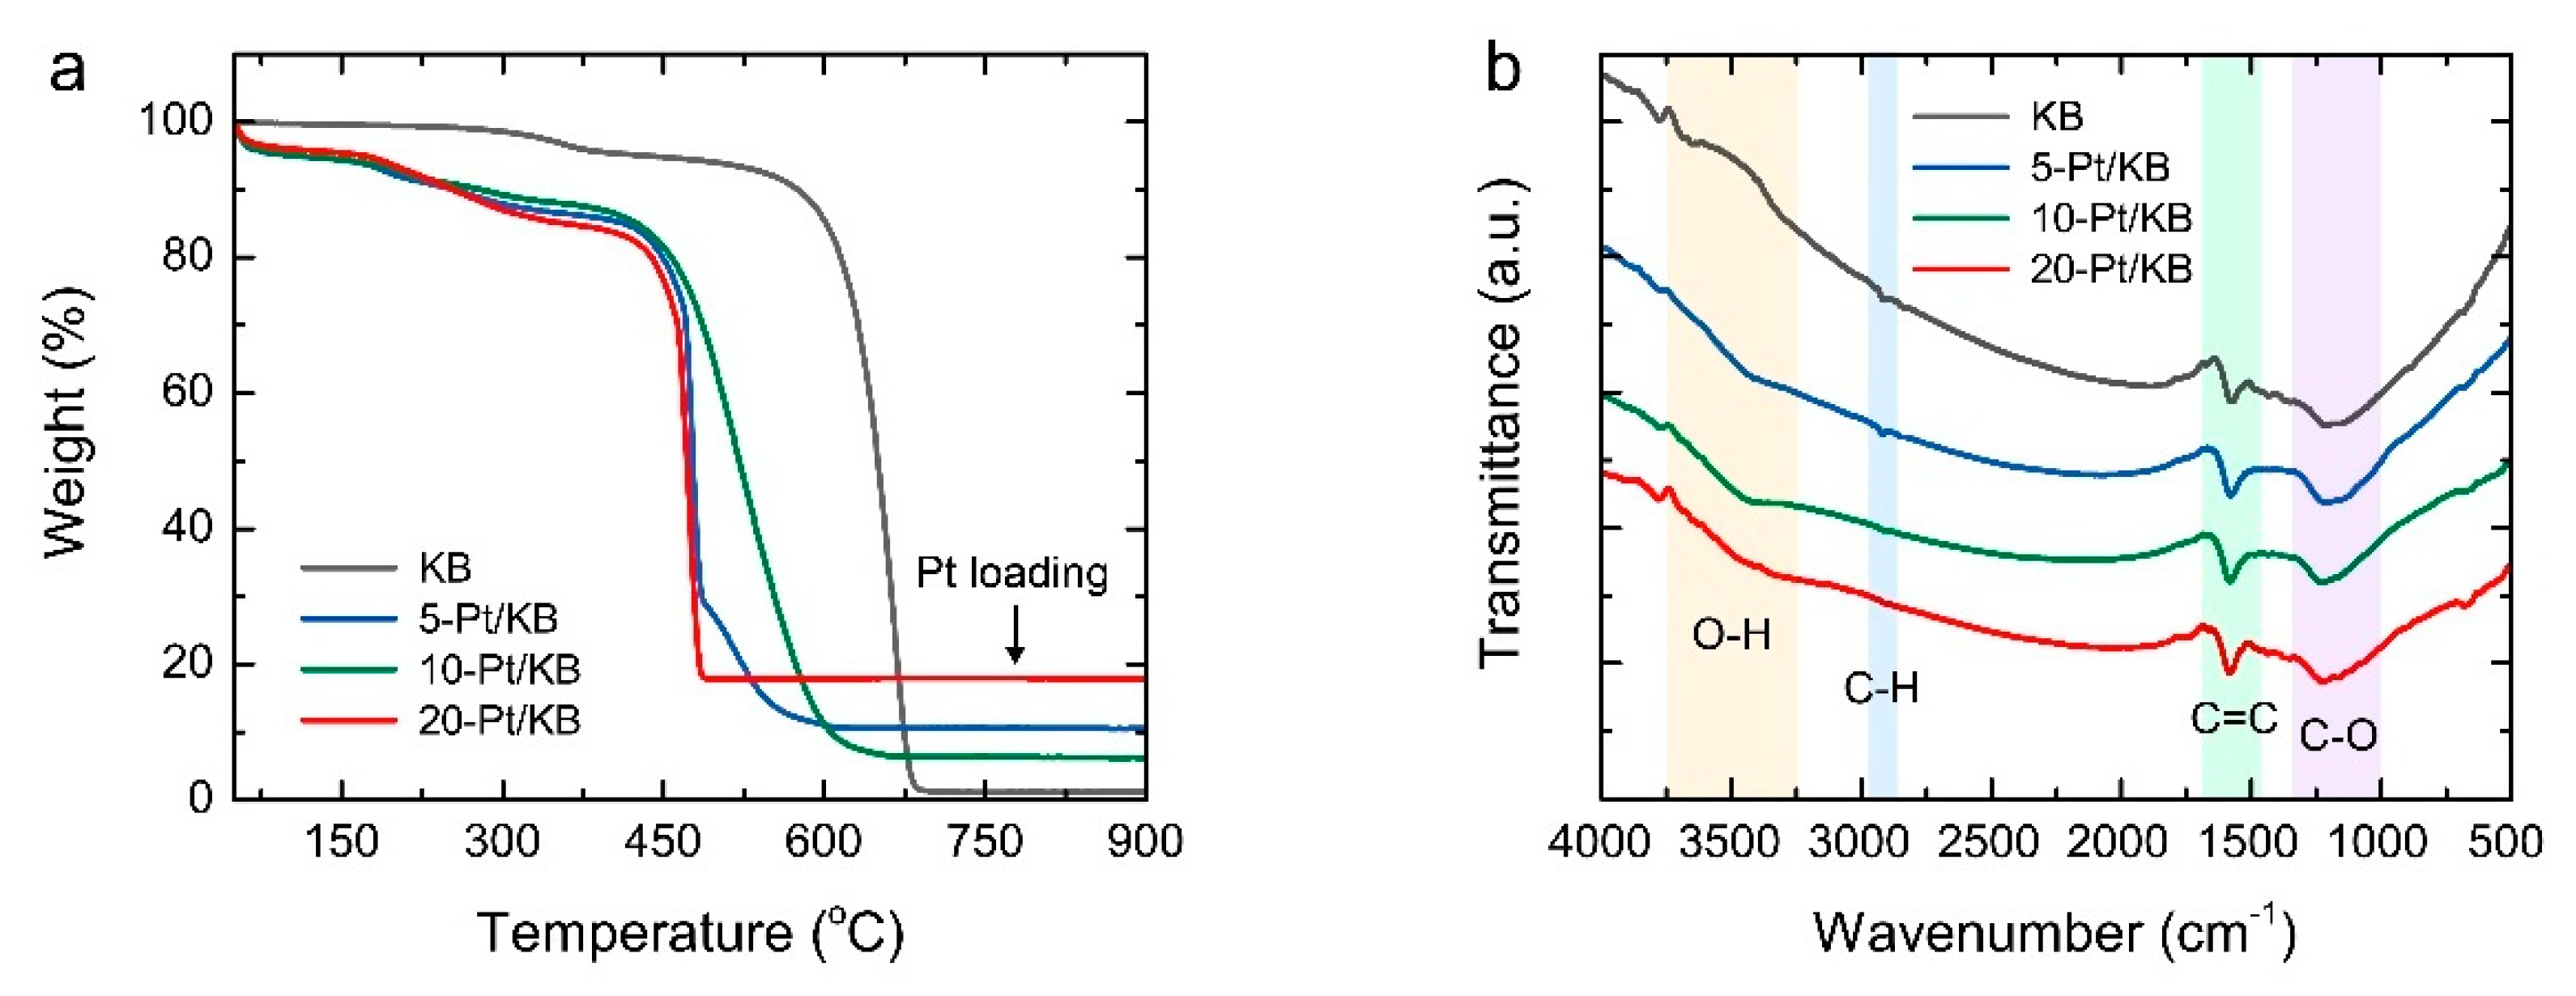
3.3. TG Analysis
3.4. FTIR Analysis
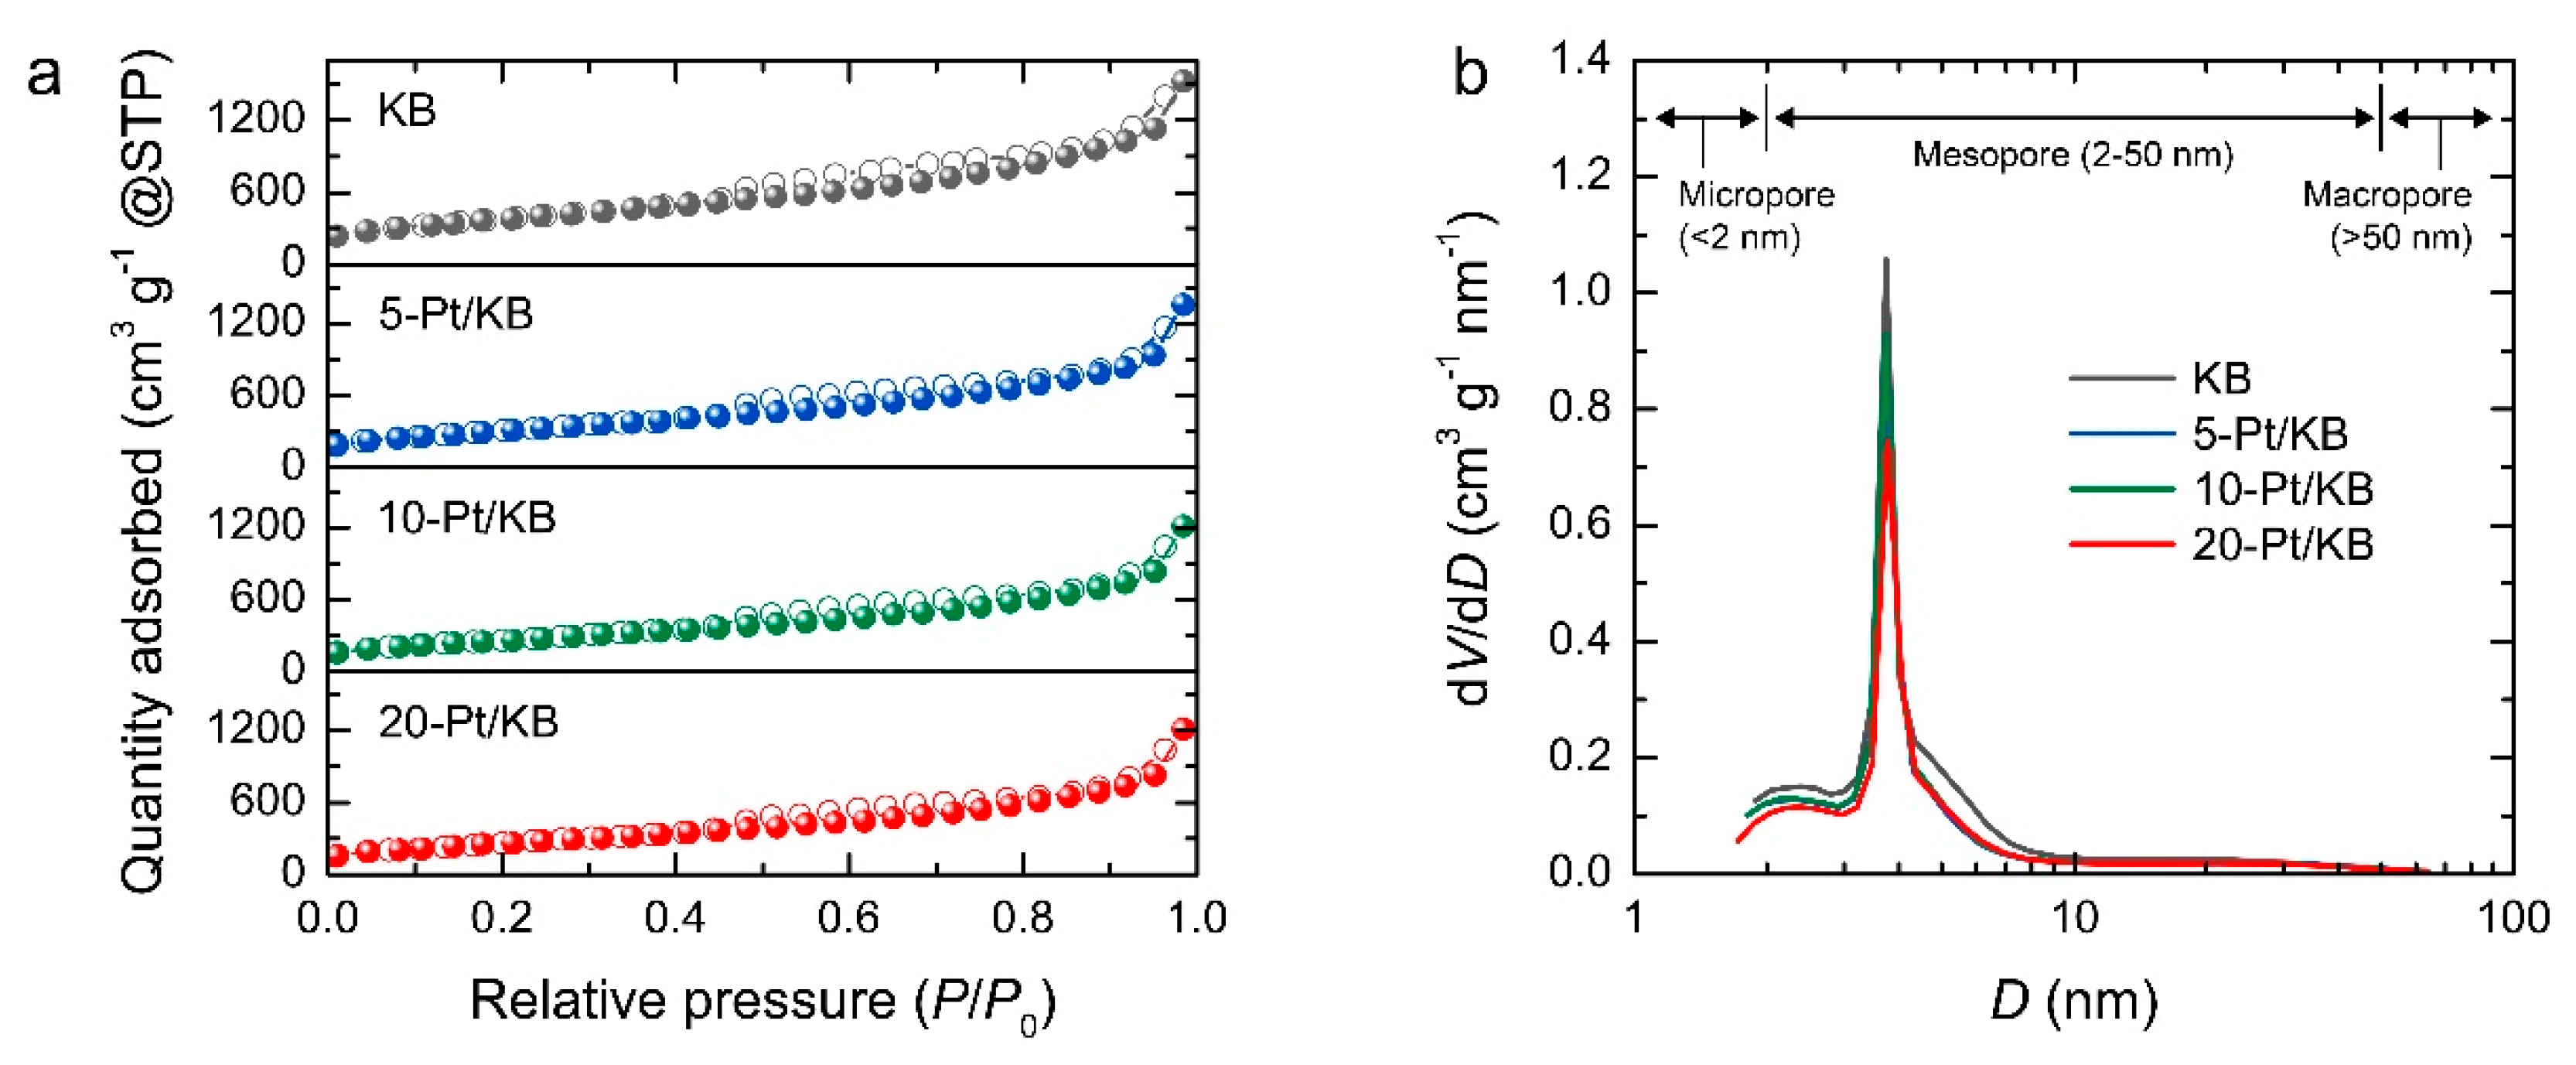
3.5. Surface Area and Pore Structure Analyses
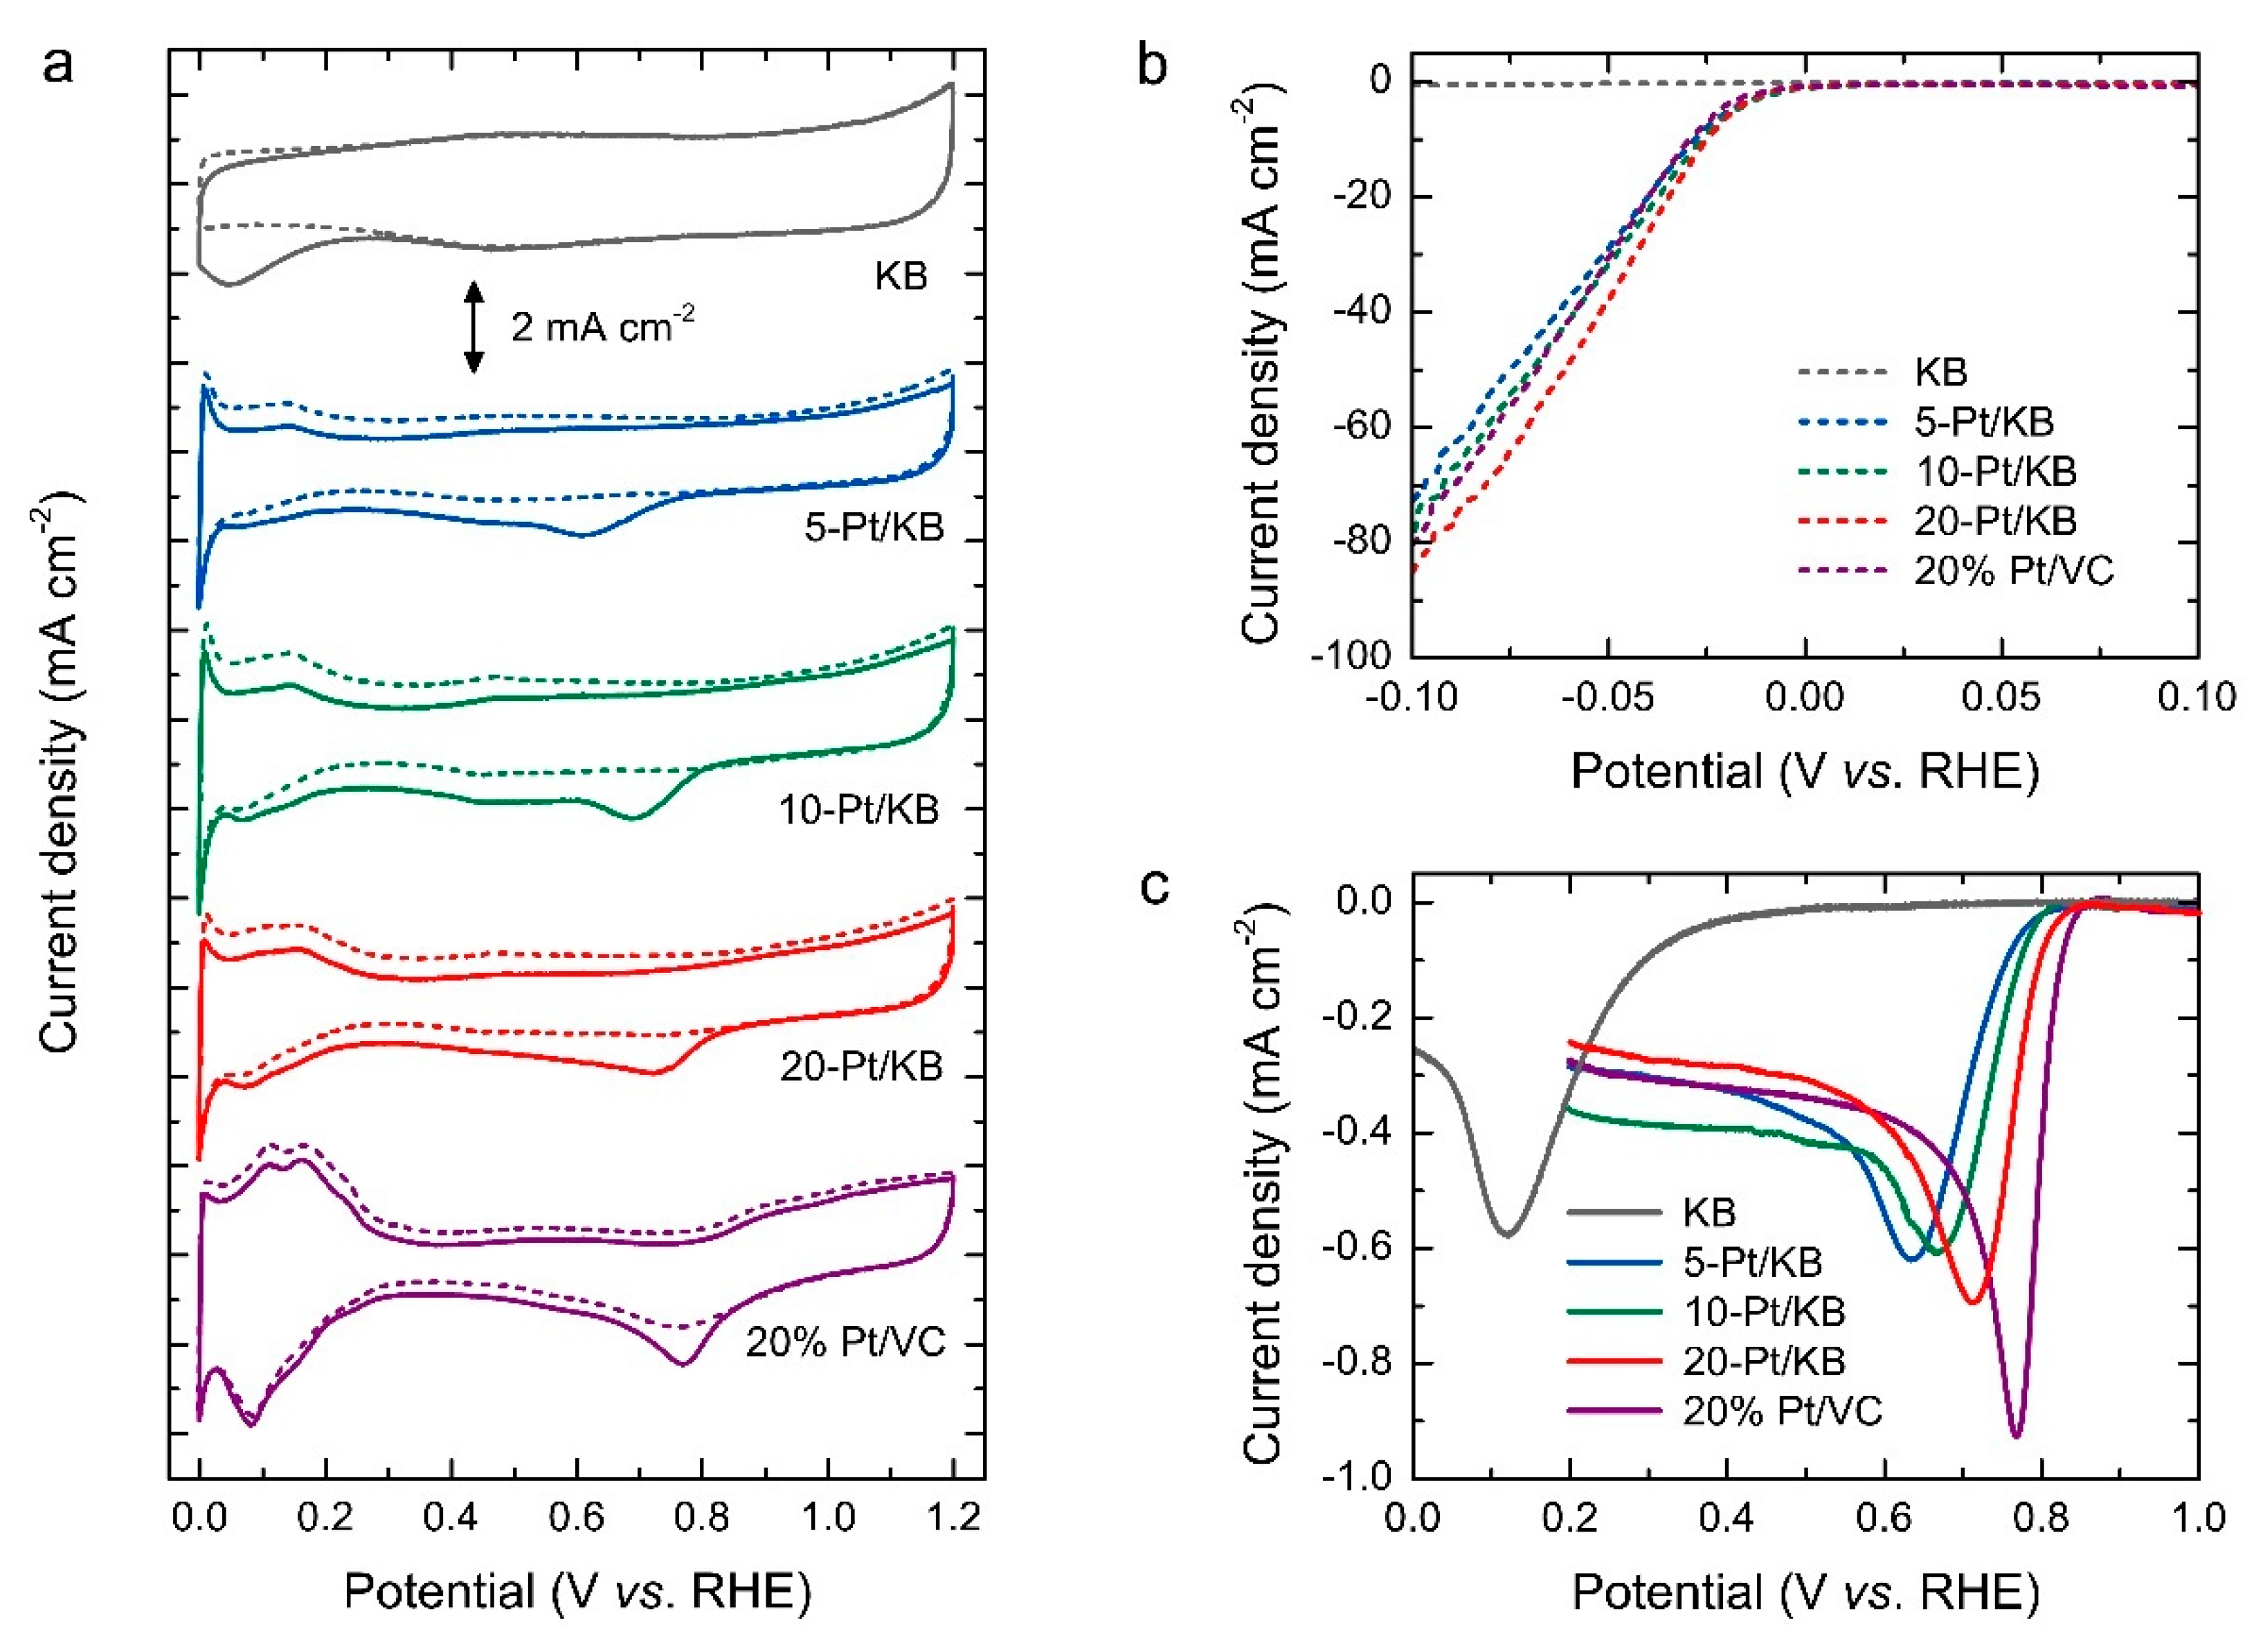
3.6. Electrochemical Measurements
3.6.1. HER Activity
3.6.2. ORR Activity
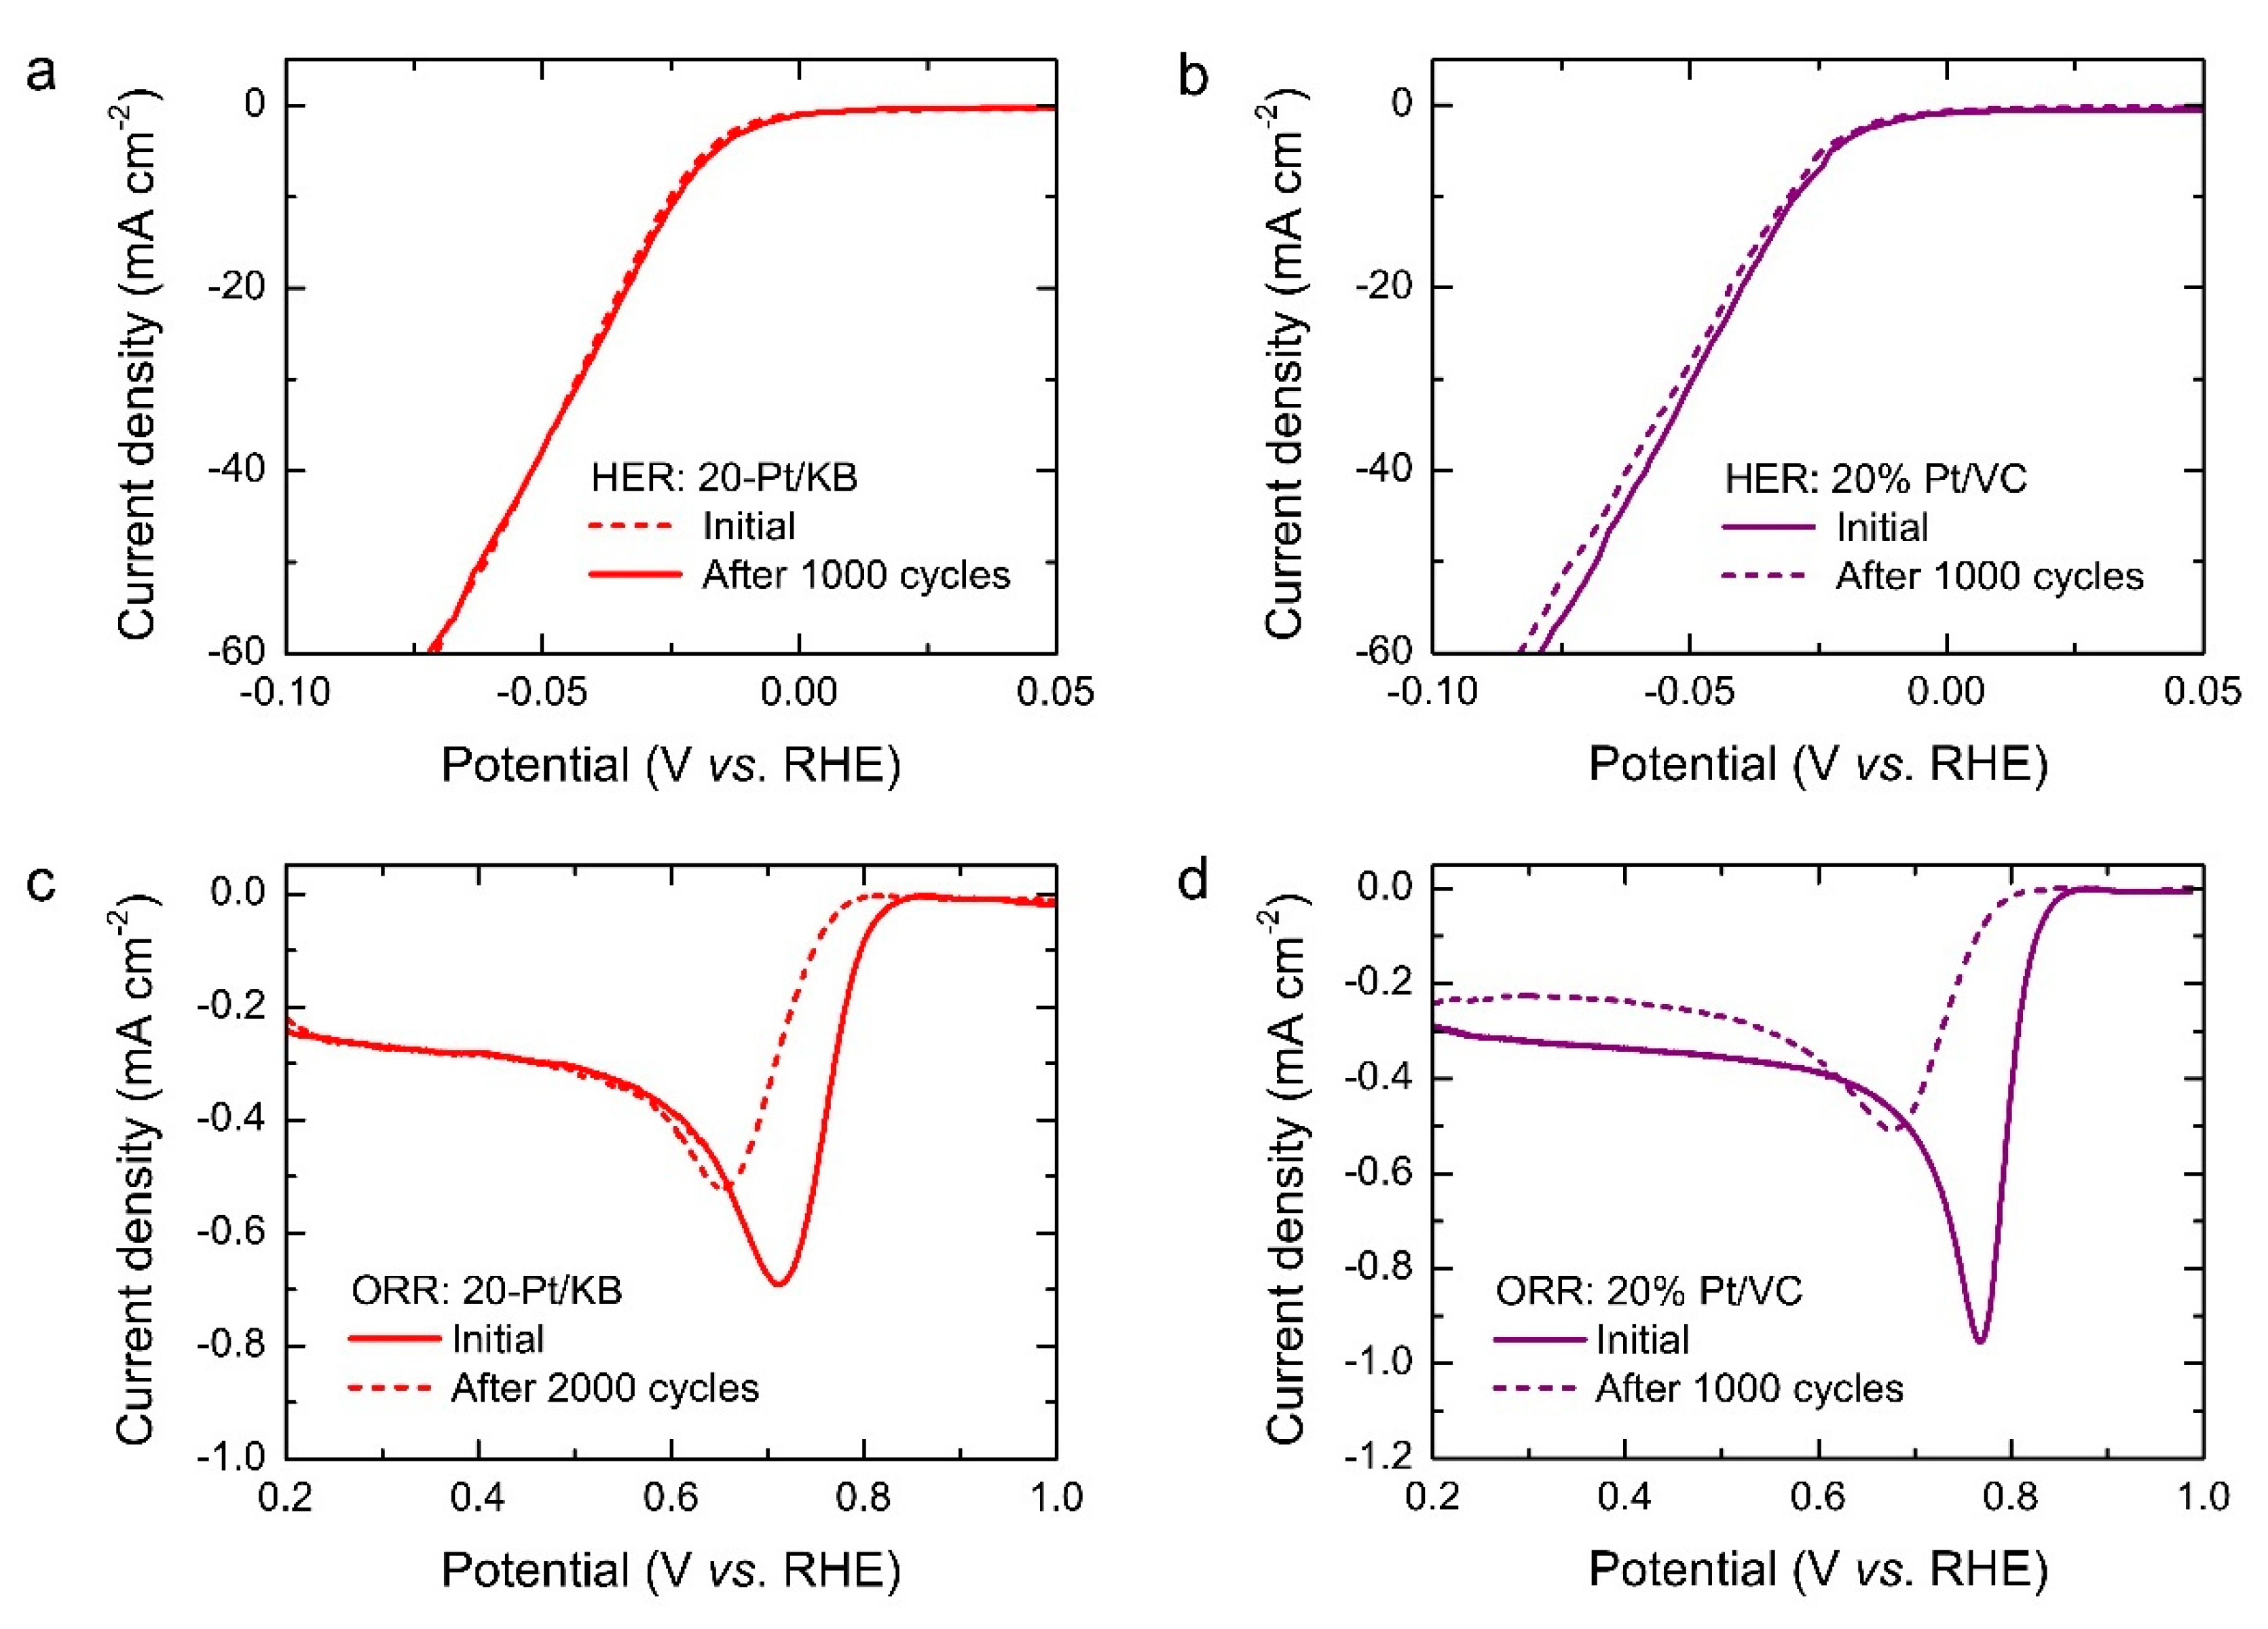
3.6.3. HER and ORR Stability
4. Conclusions
Supplementary Materials
Author Contributions
Funding
Acknowledgments
Conflicts of Interest
References
- Kannan, N.; Vakeesan, D. Solar energy for future world: A review. Renew. Sustain. Energy Rev. 2016, 62, 1092–1105. [Google Scholar] [CrossRef]
- Joselin Herbert, G.M.; Iniyan, S.; Sreevalsan, E.; Rajapandan, S. A review of wind energy technologies. Renew. Sustain. Energy Rev. 2007, 11, 1117–1145. [Google Scholar] [CrossRef]
- Khan, I.U.; Othman, M.H.D.; Hashim, H.; Matsuura, T.; Ismail, A.F.; Rezaei-DashtArzhandi, M.; Wan Azelee, I. Biogas as a renewable energy fuel–A review of biogas upgrading, utilisation and storage. Energy Convers. Manag. 2017, 150, 277–294. [Google Scholar] [CrossRef]
- Andrews, J.; Shabani, B. The role of hydrogen in a global sustainable energy strategy. Wiley Interdiscip. Rev. Energy Environ. 2014, 3, 474–489. [Google Scholar] [CrossRef]
- Staffell, I.; Scamman, D.; Abad, A.V.; Balcombe, P.; Dodds, P.E.; Ekins, P.; Shah, N.; Ward, K.R. The role of hydrogen and fuel cells in the global energy system. Energy Environ. Sci. 2019, 12, 463–491. [Google Scholar] [CrossRef] [Green Version]
- Fernández-Moreno, J.; Guelbenzu, G.; Martín, A.J.; Folgado, M.A.; Ferreira-Aparicio, P.; Chaparro, A.M. A portable system powered with hydrogen and one single air-breathing PEM fuel cell. Appl. Energy 2013, 109, 60–66. [Google Scholar] [CrossRef]
- Pollet, B.G.; Kocha, S.S.; Staffell, I. Current status of automotive fuel cells for sustainable transport. Curr. Opin. Electrochem. 2019, 16, 90–95. [Google Scholar] [CrossRef]
- Van de Kaa, G.; Scholten, D.; Rezaei, J.; Milchram, C. The battle between battery and fuel cell powered electric vehicles: A BWM approach. Energies 2017, 10, 1707. [Google Scholar] [CrossRef] [Green Version]
- Felseghi, R.-A.; Carcadea, E.; Raboaca, M.S.; Trufin, C.N.; Filote, C. Hydrogen fuel cell technology for the sustainable future and stationary applications. Energies 2019, 12, 4593. [Google Scholar] [CrossRef] [Green Version]
- Zhang, C.; Shen, X.; Pan, Y.; Peng, Z. A review of Pt-based electrocatalysts for oxygen reduction reaction. Front. Energy 2017, 11, 268–285. [Google Scholar] [CrossRef]
- Li, Y.; Li, Q.; Wang, H.; Zhang, L.; Wilkinson, D.P.; Zhang, J. Recent progresses in oxygen reduction reaction electrocatalysts for electrochemical energy applications. Electrochem. Energy Rev. 2019, 2, 518–538. [Google Scholar] [CrossRef] [Green Version]
- Shao, Y.; Dodelet, J.-P.; Zelenay, P. PGM-free cathode catalysts for PEM fuel cells: A mini-review on stability challenges. Adv. Mater. 2019, 31, 1807615. [Google Scholar] [CrossRef] [PubMed]
- Haryanto, A.; Fernando, S.; Murali, N.; Adhikari, S. Current status of hydrogen production techniques by steam reforming of ethanol: A review. Energy Fuels 2005, 19, 2098–2106. [Google Scholar] [CrossRef]
- Kalamaras, C.M.; Efstathiou, A.M. Hydrogen production technologies: Current state and future developments. Conf. Pap. Energy 2013, 2013, 690627. [Google Scholar] [CrossRef] [Green Version]
- Hu, C.; Zhang, L.; Gong, J. Recent progress made in the mechanism comprehension and design of electrocatalysts for alkaline water splitting. Energy Environ. Sci. 2019, 12, 2620–2645. [Google Scholar] [CrossRef]
- Zou, X.; Zhang, Y. Noble metal-free hydrogen evolution catalysts for water splitting. Chem. Soc. Rev. 2015, 44, 5148–5180. [Google Scholar] [CrossRef]
- Felderhoff, M.; Weidenthaler, C.; Von Helmolt, R.; Eberle, U. Hydrogen storage: The remaining scientific and technological challenges. Phys. Chem. Chem. Phys. 2007, 9, 2643–2653. [Google Scholar] [CrossRef]
- Alswad, A.; Baroutaji, A.; Achour, H.; Carton, J.; Al Makky, A.; Olabi, A.G. Developments in fuel cell technologies in the transport sector. Int. J. Hydrogen Energy 2016, 41, 16499–16508. [Google Scholar] [CrossRef]
- Eftekhari, A. Electrocatalysts for hydrogen evolution reaction. Int. J. Hydrogen Energy 2017, 42, 11053–11077. [Google Scholar] [CrossRef]
- Dubouis, N.; Grimaud, A. The hydrogen evolution reaction: From material to interfacial descriptors. Chem. Sci. 2019, 10, 9166–9181. [Google Scholar] [CrossRef] [Green Version]
- Sui, S.; Wang, X.; Zhou, X.; Su, Y.; Riffat, S.; Liu, C.-J. A comprehensive review of Pt electrocatalysts for the oxygen reduction reaction: Nanostructure, activity, mechanism and carbon support in PEM fuel cells. J. Mater. Chem. A 2017, 5, 1808–1825. [Google Scholar] [CrossRef]
- Ren, X.; Lv, Q.; Liu, B.; Wang, Y.; Liu, A.; Wu, G. Current progress of Pt and Pt-based electrocatalysts used for fuel cells. Sustain. Energy Fuels 2020, 4, 15–30. [Google Scholar] [CrossRef]
- Nguyen, H.D.; Nguyen, T.T.L.; Nguyen, K.M.; Ha, T.H.; Nguyen, Q.H. Preparation of the Vulcan XC-72R-supported Pt nanoparticles for the hydrogen evolution reaction in PEM water electrolysers. Adv. Nat. Sci. Nanosci. Nanotechnol. 2015, 6, 025012. [Google Scholar] [CrossRef] [Green Version]
- Lee, K.; Zhang, J.; Wang, H.; Wilkinson, P. Progress in the synthesis of carbon nanotube- and nanofiber-supported Pt electrocatalysts for PEM fuel cell catalysis. J. Appl. Electrochem. 2006, 36, 507–522. [Google Scholar] [CrossRef]
- Begum, H.; Kim, Y.-B. Improvement of catalytic activity of platinum nanoparticles decorated carbon graphene composite on oxygen electroreduction for fuel cells. Processes 2019, 7, 586. [Google Scholar] [CrossRef] [Green Version]
- Hsieh, B.-J.; Tsai, M.-C.; Pan, C.-J.; Su, W.-N.; Ricj, J.; Lee, J.F.; Yang, Y.-W.; Hwang, B.-J. Platinum loaded on dual-doped TiO2 as an active and durable oxygen reduction reaction catalyst. NPG Asia Mater. 2017, 9, e403. [Google Scholar] [CrossRef] [Green Version]
- Stepanov, A.L.; Golubev, A.N.; Nikitin, S.I.; Osin, Y.N. A review on the fabrication and properties of platinum nanoparticles. Rev. Adv. Mater. Sci. 2014, 38, 160–175. [Google Scholar]
- Jeyaraj, M.; Gurunathan, S.; Qasim, M.; Kim, J.-H. A Comprehensive review on the synthesis, characterization, and biomedical application of platinum nanoparticles. Nanomaterials 2019, 9, 1719. [Google Scholar] [CrossRef] [PubMed] [Green Version]
- Park, J.Y.; Aliaga, C.; Renzas, J.R.; Lee, H.; Somorjai, G.A. The role of organic capping layers of platinum nanoparticles in catalytic activity of CO oxidation. Catal. Lett. 2009, 129, 1–6. [Google Scholar] [CrossRef] [Green Version]
- Niu, Z.; Li, Y. Removal and utilization of capping agents in nanocatalysis. Chem. Mater. 2014, 26, 72–83. [Google Scholar] [CrossRef]
- Safo, I.A.; Dosche, C.; Özaslan, M. Effects of capping agents on the oxygen reduction reaction activity and shape stability of Pt nanocubes. ChemPhysChem 2019, 19, 3010–3023. [Google Scholar] [CrossRef] [PubMed] [Green Version]
- Hu, X.; Cho, S.-P.; Takai, O.; Saito, N. Rapid synthesis and structural characterization of well-defined gold clusters by solution plasma sputtering. Cryst. Growth Des. 2012, 12, 119–123. [Google Scholar] [CrossRef]
- Hu, X.; Takai, O.; Saito, N. Simple synthesis of platinum nanoparticles by plasma sputtering in water. Jpn. J. Appl. Phys. 2013, 52, 01AN05. [Google Scholar] [CrossRef]
- Panomsuwan, G.; Chataramethakul, J.; Chokradjaroen, C.; Ishizaki, T. In situ solution plasma synthesis of silver nanoparticles supported on nitrogen-doped carbons with enhanced oxygen reduction activity. Mater. Lett. 2019, 251, 135–139. [Google Scholar] [CrossRef]
- Shi, J.; Hu, X.; Zhang, J.; Tang, W.; Li, H.; Shen, X.; Saito, N. One-step facile synthesis of Pd nanoclusters supported on carbon and their electrochemical property. Prog. Nat. Sci. Mater. Int. 2014, 24, 593–598. [Google Scholar] [CrossRef]
- Kang, J.; Saito, N. In situ solution plasma synthesis of mesoporous nanocarbon-supported bimetallic nanoparticles. RSC Adv. 2015, 5, 29131–29134. [Google Scholar] [CrossRef]
- Panomsuwan, G.; Ueno, T.; Yui, H.; Nakamura, J.; Saito, N. Chapter 7: Solution plasma reactions and materials synthesis. In Molecular Technology, Volume 3: Materials Innovation, 1st ed.; Yamamoto, H., Kato, T., Eds.; Wiley-VCH: Weinheim, Germany, 2019; pp. 137–172. [Google Scholar]
- Holade, Y.; Morais, C.; Servat, K.; Napporn, T.K.; Kkokoh, K.B. Enhancing the available specific surface area of carbon supports to boost the electroactivity of nanostructured Pt catalysts. Phys. Chem. Chem. Phys. 2014, 16, 25609–25620. [Google Scholar] [CrossRef]
- Baturina, O.A.; Aubuchon, S.R.; Wynne, K.J. Thermal stability in air of Pt/C catalysts and PEM fuel cell catalyst layers. Chem. Mater. 2006, 18, 1498–1504. [Google Scholar] [CrossRef]
- Chen, X.; Wang, H.; Wang, Y.; Bai, Q.; Gao, Y.; Zhang, Z. Synthesis and electrocatalytic performance of multi-component nanoporous structure alloy for direct methanol fuel cells. Catalysts 2015, 5, 1003–1015. [Google Scholar] [CrossRef] [Green Version]
- Hood, Z.D.; Yang, X.; Li, Y.; Naskar, A.K.; Chi, M.; Paranthaman, M. Conversion of waste tire rubber into high-value-added carbon support for electrocatalysis. J. Electrochem. Soc. 2018, 165, H881–H888. [Google Scholar] [CrossRef]
- Tucureanu, V.; Matei, A.; Avram, A.M. FTIR spectroscopy for carbon family study. Crit. Rev. Anal. Chem. 2006, 46, 502–520. [Google Scholar] [CrossRef] [PubMed]
- Sing, K.S.W.; Everett, D.H.; Haul, E.A.W.; Moscou, L.; Pierotti, R.A.; Rouquérol, J.; Siemieniewska, T. Reporting physisorption data for gas/solid systems with special reference to the determination of surface area and porosity. Pure Appl. Chem. 1985, 57, 603–619. [Google Scholar] [CrossRef]
- Sing, K.S.W.; Williams, R.T. Physisorption hysteresis loops and the characterization of nanoporous materials. Adsorp. Sci. Technol. 2004, 22, 733–782. [Google Scholar] [CrossRef]
- Soboleva, T.; Zhao, X.; Malek, K.; Xie, Z.; Navessin, T.; Holdcroft, S. On the micro-, meso-, and macroporous structures of polymer electrolyte membrane fuel cell catalyst layers. ACS Appl. Mater. Interfaces 2010, 2, 375–384. [Google Scholar] [CrossRef] [PubMed] [Green Version]
- Stevens, D.A.; Dhan, J.R. Electrochemical characterization of the active surface in carbon-supported platinum electrocatalysts for pemfuel cells. J. Electrochem. Soc. 2003, 150, A770–A775. [Google Scholar] [CrossRef]
- Taylor, S.; Fabbri, E.; Levecque, P.; Schmidt, T.J.; Conrad, O. The effect of platinum loading and surface morphology on oxygen reduction activity. Electrocatalysis 2016, 7, 287–296. [Google Scholar] [CrossRef] [Green Version]
- Jukk, K.; Kongi, N.; Tammeveski, K.; Arán-Ais, R.M.; Solla-Gullón, J.; Feliu, J.M. Loading effect of carbon-supported platinum nanocubes on oxygen electroreduction. Electrochim. Acta 2017, 251, 155–166. [Google Scholar] [CrossRef] [Green Version]
- Ghanim, A.H.; Koonce, J.G.; Hasa, B.; Rassoolkhani, J.M.; Cheng, W.; Peate, D.W.; Lee, J.; Mubeen, S. Low-loading of Pt nanoparticles on 3D carbon foam support for highly active and stable hydrogen production. Front. Chem. 2018, 6, 523. [Google Scholar] [CrossRef] [Green Version]
- Tiwari, J.N.; Pan, F.-M.; Chen, T.-M.; Tiwari, R.N.; Lin, K.-L. Electrocatalytic activity of Pt nanoparticles electrodeposited on amorphous carbon-coated silicon nanocones. J. Power Sources 2010, 195, 729–735. [Google Scholar] [CrossRef]
- Karthikeyan, N.; Vunayan, B.P.; Rajesh, M.; Balaji, K.; Subramani, A.K.; Ramaprabhu, S. Highly durable platinum based cathode electrocatalysts for PEMFC application using oxygen and nitrogen functional groups attached nanocarbon supports. Fuel Cells 2015, 15, 278–287. [Google Scholar] [CrossRef]
- Bao, X.; Gong, Y.; Chen, Y.; Zhang, H.; Wang, Z.; Mao, S.; Xie, L.; Jiang, Z.; Wang, Y. Carbon vacancy defect-activated Pt cluster for hydrogen generation. J. Mater. Chem. A 2019, 7, 15364–15370. [Google Scholar] [CrossRef]


| Sample | SBET (m2 g−1) | Vtotal (cm3 g−1) | Davg (nm) |
|---|---|---|---|
| KB | 1362 | 1.74 | 6.72 |
| 5-Pt/KB | 1117 | 1.46 | 6.98 |
| 10-Pt/KB | 1113 | 1.45 | 7.18 |
| 20-Pt/KB | 951 | 1.27 | 7.20 |
© 2020 by the authors. Licensee MDPI, Basel, Switzerland. This article is an open access article distributed under the terms and conditions of the Creative Commons Attribution (CC BY) license (http://creativecommons.org/licenses/by/4.0/).
Share and Cite
Mani-Lata, C.; Hussakan, C.; Panomsuwan, G. Fast and Facile Synthesis of Pt Nanoparticles Supported on Ketjen Black by Solution Plasma Sputtering as Bifunctional HER/ORR Catalysts. J. Compos. Sci. 2020, 4, 121. https://0-doi-org.brum.beds.ac.uk/10.3390/jcs4030121
Mani-Lata C, Hussakan C, Panomsuwan G. Fast and Facile Synthesis of Pt Nanoparticles Supported on Ketjen Black by Solution Plasma Sputtering as Bifunctional HER/ORR Catalysts. Journal of Composites Science. 2020; 4(3):121. https://0-doi-org.brum.beds.ac.uk/10.3390/jcs4030121
Chicago/Turabian StyleMani-Lata, Chitlada, Chadapat Hussakan, and Gasidit Panomsuwan. 2020. "Fast and Facile Synthesis of Pt Nanoparticles Supported on Ketjen Black by Solution Plasma Sputtering as Bifunctional HER/ORR Catalysts" Journal of Composites Science 4, no. 3: 121. https://0-doi-org.brum.beds.ac.uk/10.3390/jcs4030121