Article

Metamodelling of the Correlations of Preform and Part Performance for Preform Optimisation in Sheet Moulding Compound Processing

by
Christian Hopmann
,
Jonas Neuhaus
*,
Kai Fischer
,
Daniel Schneider
and
René Laschak Pinto Gonçalves
Institute for Plastics Processing (IKV), Seffenter Weg 201, 52074 Aachen, Germany
*
Author to whom correspondence should be addressed.
J. Compos. Sci. 2020, 4(3), 122; https://0-doi-org.brum.beds.ac.uk/10.3390/jcs4030122
Submission received: 29 June 2020 / Revised: 18 August 2020 / Accepted: 19 August 2020 / Published: 21 August 2020
(This article belongs to the Special Issue Discontinuous Fiber Composites, Volume II)

Abstract

:
In the design of parts consisting of long-fibre-reinforced Sheet Moulding Compounds (SMC), the potential for the optimisation of processing parameters and geometrical design is limited due to the high number of interdependent variables. One of the influences on fibre orientations and therefore mechanical part performance is the initial filling state of the compression moulding tool, which is defined by the geometry and positioning of the SMC preform. In the past, response surface methodology and linear regression analysis were successfully used for a simulation-based optimisation of rectangular preform size and position in regard to a part performance parameter. However, the computational demand of these increase exponentially with an increase in the number of design variables, such as in the case of more complex preform geometries. In this paper, these restrictions are addressed with a novel approach for metamodelling the correlation of preform and the resulting mechanical part performance. The approach is applied to predicting the maximum absolute deflection of a plate geometry under bending load. For metamodelling, multiple neural networks (NN) are trained on a dataset obtained by process and structural simulation. Based on the discretisation of the plate geometry used in these simulation procedures, the binary initial filling states (completely filled/empty) of each element are used as inputs of the NNs. Outputs of the NNs are combined by ensemble modelling to form the metamodel. The metamodel allows an accurate prediction of maximum deflection; subsequent validation of the metamodel shows differences in predicted and simulated maximum deflection ranging from 0.26% to 2.67%. Subsequently, the metamodel is evaluated using a mutation algorithm for finding a preform that reduces the maximum deflection.

1. Introduction

Sheet Moulding Compounds (SMC) compression moulding is the largest market segment in the processing of Glass Fibre-Reinforced Plastics (GFRP) in terms of production volume [1]. The benefits of compression moulding include the economical production of near-net-shape components, minimising the need for subsequent assembly steps. The deformation of the SMC preform during compression moulding causes the formation of inhomogeneous and transient flow fields, which in turn cause a change in the orientation of the contained fibres [2,3,4,5,6,7,8]. Mechanical properties of the resulting SMC part are dominated by these fibre orientations, which therefore play an important role in the design of SMC parts and setup of the compression moulding process such as definition preform position and size [4,9,10,11].
Martulli et al. reported a property difference between specimens cut from carbon fibre-reinforced (53 wt %) vinylester-based SMC with a preferential orientation of 0° and 90° of 150% for tensile stiffness, 260% for tensile strength, 120% for compressive stiffness, and 32% for compressive strength, respectively [11]. For a polyester-based SMC with 30 wt % glass fibre content, Oldenbo et al. determined a difference in tensile stiffness for preferential orientation of 0° and 90° upwards of 25% [10].
Fibre orientation can be predicted by the application of process simulation procedures, on which extensive work has been conducted since the early 1980s [12,13,14,15,16]. Initially, these were based on 2D and 2.5D modelling approaches (the latter considering through-thickness variations in flow and material properties). Lee, Folgar, and Tucker applied the generalised Hele–Shaw model for calculation of the filling of thin-walled structures during the SMC compression moulding process; however, they did initially not consider the influence of temperature on the SMC viscosity [15,17,18]. Barone and Caulk performed experimental analysis on SMC flow and reported boundary effects such as slippage of the SMC on the mould surface due to temperature influences, for which a model was subsequently proposed [19,20].
In recent years, these methods were expanded by the development of simulation procedures capable of 3D calculation, of which certain functionalities have been implemented in programs such as Moldex3D and Moldflow [21,22]. Hohberg employed the Coupled Eulerian Lagrangian framework within Abaqus for the calculation of SMC flow and flow-induced deformation of local reinforcements [23]. A research group led by Osswald developed a direct fibre simulation procedure, with which fibre bending and fibre–matrix separation can be calculated in long fibre-reinforced polymers [21]. This was expanded on by Meyer et al. with a direct bundle simulation approach [24].
However, process simulation has remained computationally demanding and time-consuming [4,9,25]. This limits the potential in part or process optimisation, since finding the “optimal” solution usually necessitates simulating a high number of variable variations, which is especially prevalent when varying only one at a time [25,26,27,28,29,30]. In the field of SMC compression moulding, advanced optimisation procedures have been presented, which are based on alternative approaches making use of approximations of the complex interactions of influencing parameters (also called metamodels or surrogate models) [25,30,31]. Metamodels provide a “Model of the Model”, which may be used to replace computationally expensive simulation models in a wide number of engineering disciplines and have also been used in SMC modelling and process optimisation [25,30,32,33,34]. Huang et al. used a mesoscale metamodelling approach to accurately predict the stiffness matrices of chopped carbon fibre SMC from the fibre orientation tensor using individual Kriging models for each element of the stiffness matrix [34]. Sabiston et al. presented a neural networks (NN)-based procedure for the prediction of preform position and geometry-dependent fibre orientations in a SMC seat back component. With this approach, near instantaneous prediction of fibre orientation is achieved, the caveat being that a high number of data points (3000) is required for training the NN [8].
For determination of the optimal SMC peform placement for a hood scoop part, Ankenman, Bisgaard, and Osswald proposed an iterative optimisation approach based on evaluating simulation results with the response surface methodology [25]. The optimisation had two goals, being to minimise the “fill time tolerance” (standard deviation of the time necessary for filling all nodes of the discretised part geometry, thus describing the filling uniformity) and the uniformness of fibre orientation. However, this procedure necessitated significant human interaction in iteratively defining and evaluating different experimental setups. This was later expanded on by Twu and Lee, who automated the procedure by applying linear regression analysis. However, they noted that this methodology (as well as statistical regression methods or various mathematical approximation theories in general) had major drawbacks, as the number of necessary simulations would increase exponentially with the number of design variables [35]. Alternatively, they proposed employing neural networks (NN), which they subsequently applied in increasing the curing homogeneity of an SMC part with varying thickness by optimising the heating channel location inside the mould [30]. Initially, a start-up search is employed (necessitating 19 curing simulations). The parameter variations and simulation results are used for initial training of a feed-forward NN (FF-NN). Subsequently, the FF-NN is iteratively evaluated and retrained by supplementary curing simulation, finding the optimal design in less than 60 simulations (in comparison with the statistical approach necessitating 729 simulations when using a 3-level quadratic model without domain search) [30].
Alternatively, Kim, Lee, Han, and Vautrin used a genetic algorithm for optimising the preform size and placement. The goal of the optimisation was to minimise the maximum deflection of a symmetric car hood and an arbitrary non-symmetric geometry that resembles a fender [31].
Most of the optimisation procedures mentioned apply initial evaluations of the significance of design factors, excluding non-significant factors, to make the design cases more manageable [25,30]. Additionally, problem-dependent constraint handling techniques are used to rule out non-feasible solutions (e.g., limiting the ranges of the design factors to physical limits such as the mould dimensions). For curing homogeneity optimisation, Twu and Lee applied metamodelling to four design factors [30]. Ankenman, Bisgaard, and Osswald limited the number of design factors to three (charge size, length-to-width ratio, and position relative to one mould edge), while Kim, Lee, Han, and Vautrin employed the penalty function method and a repair algorithm in the handling of four design variables (size and position of the preform in x and y direction) [25,31].
Thus, promising approaches have been shown addressing the presented challenges, in which a wide range of metamodelling procedures are successfully used. However, to the best of the authors’ knowledge, no metamodelling procedures that expand on the geometrical freedom of the preform (e.g., non-rectangular preforms) have been presented in the field of SMC processing.
Therefore, the focus of the presented study is the implementation of a metamodelling approach without inherent geometry restrictions, for which an ensemble metamodel comprising multiple FF-NN is proposed. The procedure directly makes use of the spatial geometry discretisation used in 2D and 2.5D process simulation for the description of the part and preform geometry and approximation of the correlation of the preform and resulting mechanical properties. The metamodel is subsequently used in a procedure for the optimisation of the SMC preform. As the design goal, minimisation of the maximum absolute deflection of a plate geometry under bending load is pursued.
Sampling for FF-NN training is conducted by evaluating rectangular preform geometries (which in sum span the totality of the part surface) and the resulting maximum absolute deflection using a coupled process and structural simulation. In the following subsection, methods used for the metamodelling of preform and part behaviour and subsequent metamodel-based preform optimisation are presented.
The presented procedures were implemented in MATLAB R2020a, Mathworks, Natick, MA, USA, when not stated otherwise.

2. Materials and Methods

The procedures were applied to a plate geometry exhibiting a cantilever load case, which is shown in Figure 1a. The goal of the optimisation of the preform was the minimisation of plate deflection. As this paper concentrates on procedure development, this fairly simple geometry is chosen.
Discretisation of the geometry into a structured shell mesh was conducted in Abaqus 2020, Dassault Systèmes, Vélizy-Villacoublay, France, using 1200 S3 elements (Figure 1b). This shell element type was chosen based on compatibility with the process simulation procedure, and subsequently, it was also used in structural simulation and metamodelling.

2.1. Explicit Modelling

Calculation of the fibre orientation probability distribution function (FOD) ψ ( p ) resulting from SMC flow during compression moulding was conducted using Express 6.0, M-Base Engineering + Software GmbH, Aachen, Germany. This software was developed in close collaboration with the Institute for Plastics Processing (IKV) (Aachen, Germany) and it has been used for a 2.5D process simulation of thermoplastic and thermoset compression moulding alike [36,37,38]. It is based on the control volume approach as described by Osswald, which has been shown to accurately predict the filling pattern in compression moulding of thin geometries under the assumption of planar flow [12]. The governing equations implemented in the software and used in this paper are described briefly. The material data used are shown in Section 2.2.
To predict the static pressure distribution p within the mould cavity during the compression moulding of SMC, Folgar and Tuckers’ application of the generalised Hele–Shaw model is used [12,15,17]:
x ( S p x ) + y ( S p y ) h ˙ = 0
The flow conductivity S is derived from the flow gap height h ˙ and the shear and temperature-dependent viscosity η:
S = h 3 12 η
From the pressure distribution, gap-wise average velocities U ¯ and V ¯ are derived, from which the fibre orientation probability distribution function (FOD) is subsequently calculated [12,15]:
U ¯ = S h p x
V ¯ = S h p y
Anisotropy of temperature (and therefore viscosity) is taken into account by simultaneously simulating the filling of the geometry with five shell geometries (assumed as each having one-fifth of the thickness of the plate geometry and being stacked on top of each other), for which the momentary temperature change due to conductive heat transfer is considered individually.
From the layer-wise average velocities, fibre orientations are determined for each layer. Jeffery developed a procedure that enables the prediction of change in orientation of a single ellipsoidal particle due to the flow of a surrounding fluid [39]. For the calculation of the FOD of fibre-reinforced materials, Folgar and Tucker supplemented this model with a phenomenological diffusion term, with which fibre–fibre interactions are taken into account by the fibre interaction coefficient CI [13]:
ψ t = C I 2 ψ Φ 2 Φ ( ψ ( sin Φ cos Φ v x x sin 2 Φ v x y + cos 2 Φ v x x + sin Φ cos Φ v y y ) )
In the past, extensive work has been conducted in enhancing this orientation model (e.g., by including fibre–matrix interaction), which has resulted in the development of new models such as Anisotropic Rotary Diffusion (ARD), Reduced Strain Closure (RSC), ARD-RSC, and an improved ARD model combined with the Retarding Principal Rate model (iARD-RPR) [40,41,42,43,44,45].
In this work, the Folgar–Tucker model is used as recent investigations conducted by Li, Chen et al. continue to show good agreement with the experimentally determined material properties of SMC and the model having been used in prior work on SMC part thickness optimisation by Kim et al. [22,46].
FOD were transferred to MATLAB for calculation of the mechanical properties of each element in each layer. The mechanical properties are calculated by methods described by Advani and Tucker, which are suitable for use in thin-walled compression moulding (thus assuming planar fibre orientation) and subsequently implemented and validated by Oldembo et al. for SMC materials [5,10]. The calculation of mechanical properties is divided into three successive steps. Initially, the fourth-order stiffness tensor C i i (Voigt notation) is calculated under an assumption of unidirectional fibre orientation in the SMC using the governing equations of Halpin and Tsai [47]. Fibre orientation tensors of second order a i j and fourth order a i j k l are subsequently derived from the FODs [5,48]:
a i j = p i p j ψ ( p ) d p
a i j k l = p i p j p k p l ψ ( p ) d p .
Then, the FOD-dependent stiffness tensors T of each element are calculated by orientation tensor averaging [5]. Scalars Bi are derived from the unidirectional stiffness tensor (governing equations in Appendix A), where δ is the Kronecker-delta [5]:
T i j k l = B 1 ( a i j k l ) + B 2 ( a i j δ k l + a k l δ i j ) + B 3 ( a i k δ j l + a i l δ j k + a j l δ i k + a j k δ i l ) + B 4 ( δ i j δ k l ) + B 5 ( δ i k δ j l + δ i l δ j k )
For final simulation of part deformation behaviour, the resulting stiffness tensor components were exported to an Abaqus 2020 input-file (.inp) as individually defined materials for each element (thus creating 6000 individual materials) using an automated script. The 5 layers were treated as plies of a composite shell section, which was also created using the script. As fibre orientations are provided in local coordinate systems in the control volume approach, these were also supplied to the .inp file for each element [12].

2.2. Metamodelling

As has been shown in the introduction, a range of different metamodelling procedures such as kriging and NN have been implemented in the field of SMC processing and SMC material description, each exhibiting individual problem-dependent benefits and drawbacks [8,34]. Jin et al. and Simpson et al. evaluated a range of metamodelling procedures, with Simpson et al. recommending the use of NN when dealing with highly nonlinear or large problems containing many parameters, which (as will be shown) is the case in the proposed procedure [30,32,49]. Furthermore, the use of FF-NN has been shown by Twu and Lee et al. to be beneficial in comparison to alternative approaches for metamodelling in the field of SMC optimisation; thus, this approach is used [30]. The cited work is greatly recommended for a more in-depth description of general procedures in setting up and training FF-NN.
Contrary to prior papers presented in the introduction, which use a small number of non-binary input variables, the initial filling state of each element (which may be completely filled or unfilled, thus, binary) is proposed for defining the geometry and position of the preform and for use as input variables (thus, 1200 binary input variables are used in total). However, this results in a high number of network connections, even without considering the further setup of the FF-NN. Training an FF-NN with a high number of connections may lead to a loss in accuracy for out-of-sample data commonly known as overfitting [50]. This is especially prone when using a limited sample size as is the case in simulation-based optimisation of the SMC process [51].
Using a large number of binary input variables is a known procedure in the field of Optical Character Recognition (OCR), in which neural networks are used to detect printed or handwritten letters in black and white images [49,52,53]. Cybenko and Hornik et al. have shown that an FF-NN with a single hidden layer can, when using sigmoid transfer functions, describe a continuous function to an arbitrary degree of accuracy [30,54,55]. However, the necessary number of nodes in the hidden layer and sample sizes have been part of an intensive debate. While general procedures for finding the most optimal parameters (commonly known as hyperparameters) for an FF-NN, such as the robust design methodology proposed by Taguchi, have been used, these parameters are usually set based on experience and trial and error procedures [56,57].
Furthermore, larger sample sizes are preferred, and in the field of OCR of handwriting, extensive databases have been formed [53]. However, sample size is limited in the discussed application on compression moulding due to the calculation effort and general practicability. Therefore, overfitting is assumed as given and may occur regardless of the chosen number of neurons in the hidden layer. However, there are metamodelling approaches that mitigate the effects of overfitting, which will be shown to be successful. Hastie et al. propose the use of ensemble modelling approaches, in which the outputs of multiple FF-NN with identical architecture (but which may each exhibit a different form of overfitting e.g., due to differences in training procedures) are combined to increase the accuracy of the model as a whole [51,58]. In this paper, bootstrap aggregation (“bagging”) is implemented, and the mean of the outputs of 100 FF-NN trained with random starting weights is used to predict the maximum absolute deflection of the plate. Thus, only a limited number of neurons are used, and the focus is set on showing the general applicability of this procedure and its accuracy in prediction.
In total, 36 samples consisting of a unique rectangular preform geometry and position and affiliated maximum absolute deflection were created by simulation procedures shown in Section 2.1 for training of the FF-NN (see Figure 2 for a representation of the preform samples). Definition of the samples was based on the following principles:
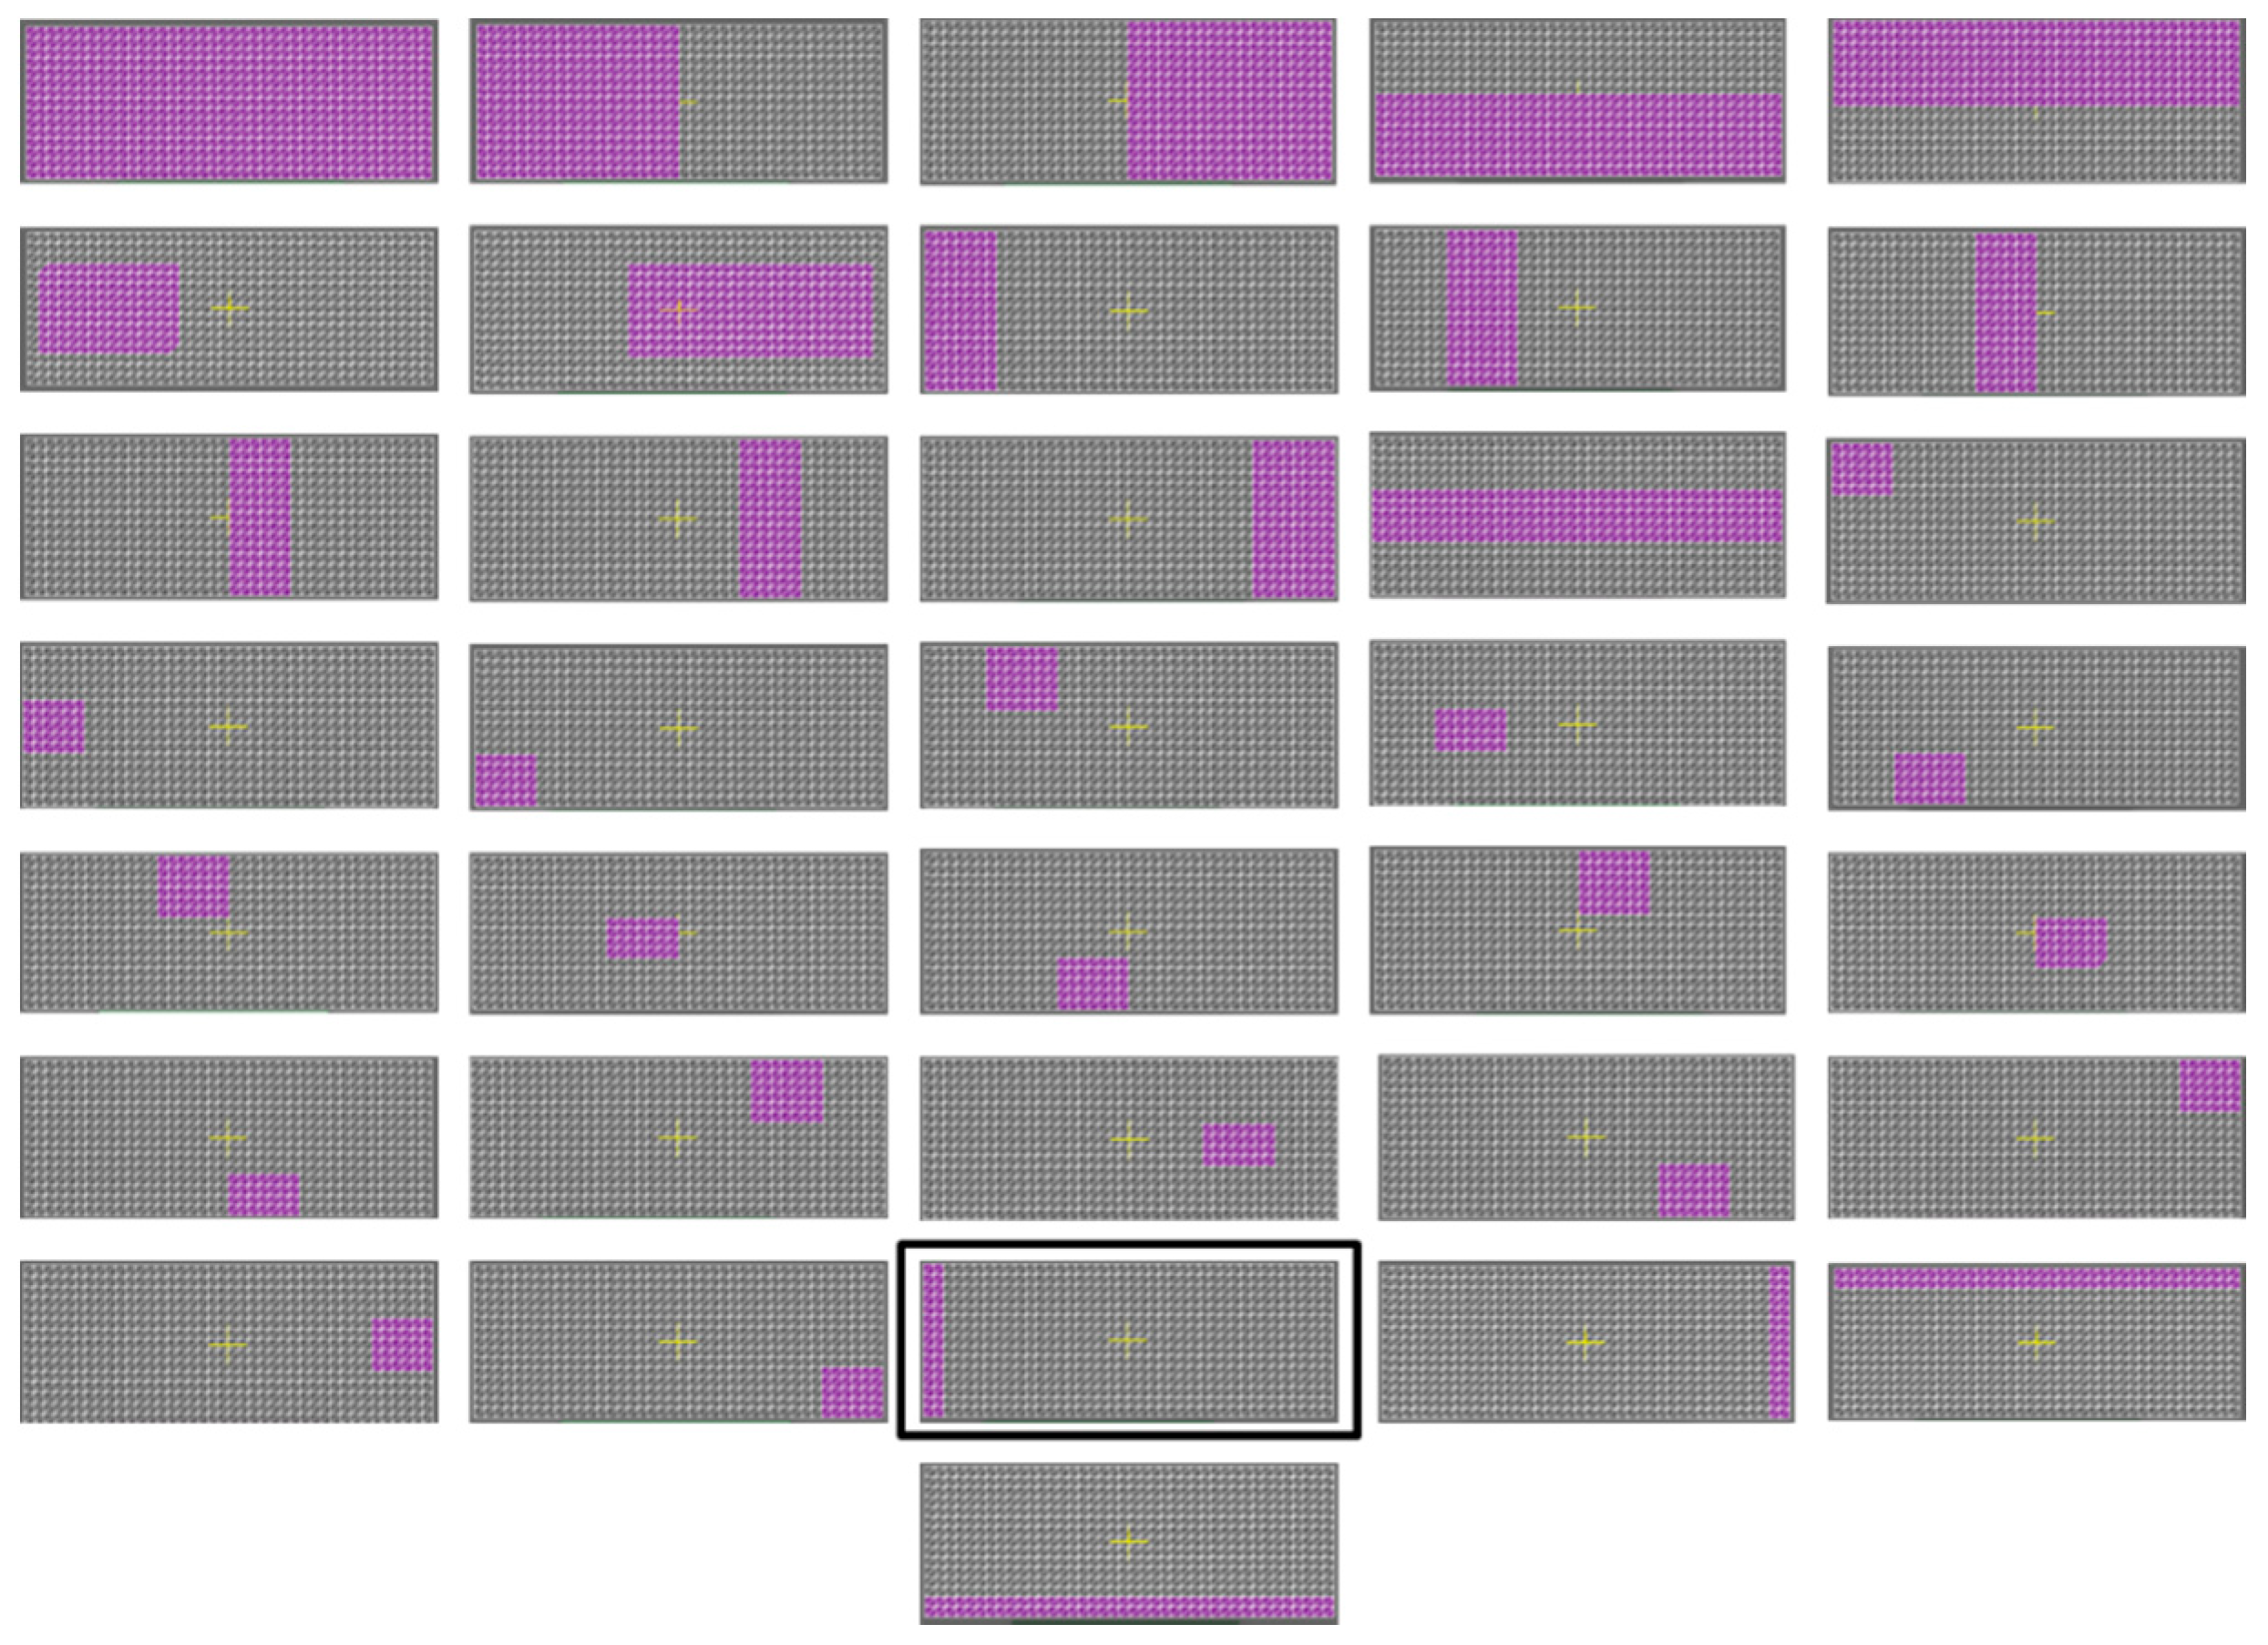
  • Each element should be included in a similar number of samples
  • Preform geometries and positions typically used in processing are included
  • Preforms have to cover at least 5% of the mould surface
  • Preforms maximising flow lengths in the x and y-direction are included
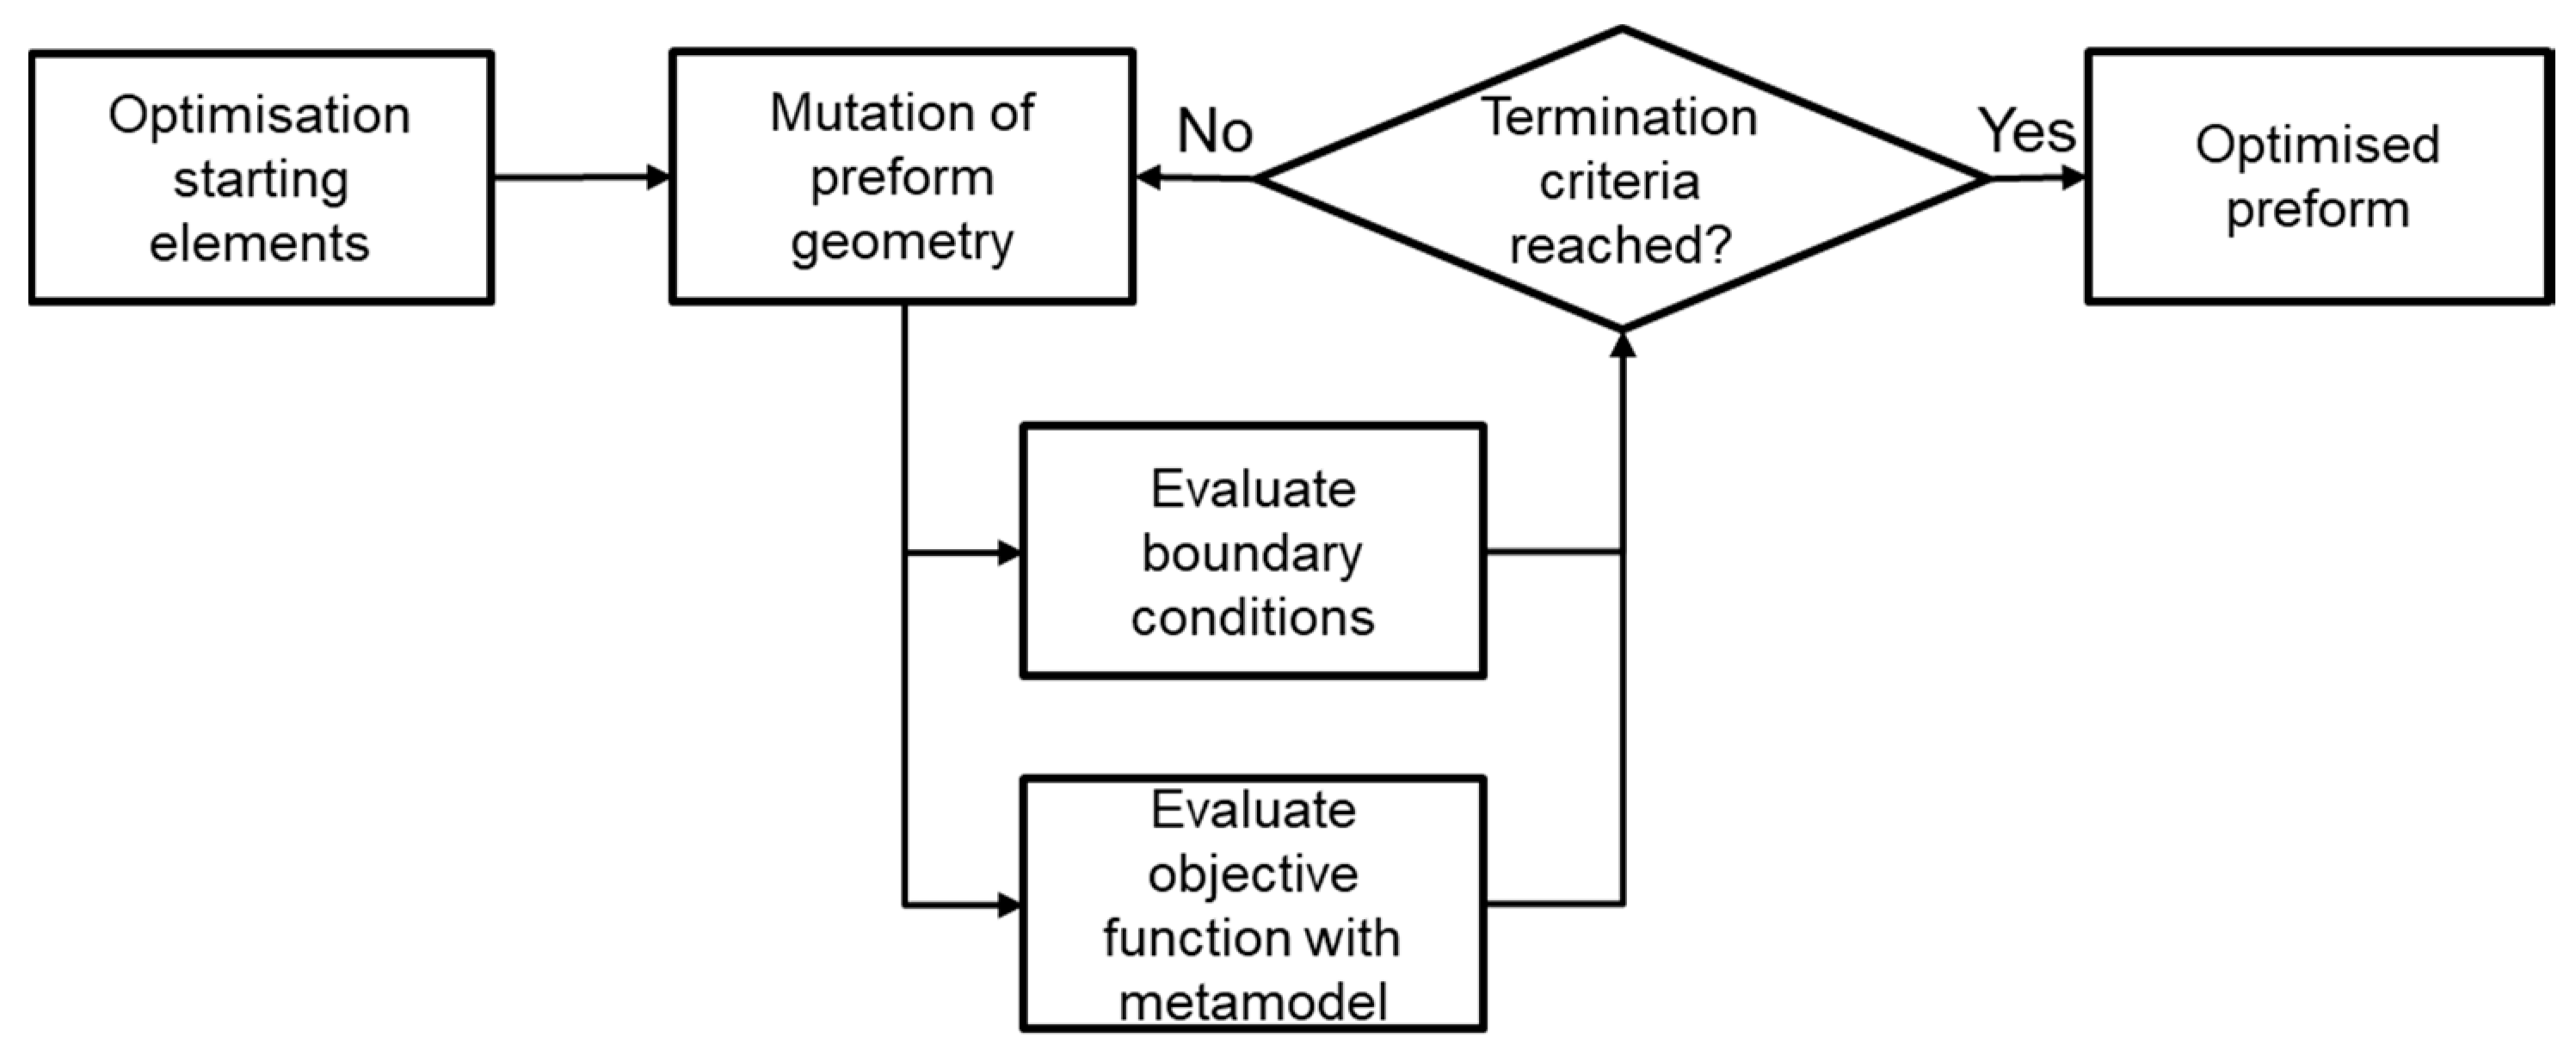
Thus, limiting the samples to only a single geometry was chosen for reasons of consistency. Including alternative geometries based on these principles may be beneficial for increasing the accuracy of the trained FF-NN. However, this would necessarily increase the number of samples, and including all elements in the sample set may not be always possible (e.g., inclusion of corner elements when using round preform geometries).
The material and processing parameters applied are shown in Table 1 and Table 2 and Figure 3. Material data correspond with SMC0400 of Menzolit Srl., Turate, Italy [59].
Training of the FF-NN is conducted using the “fitnet” function implemented in the MATLAB Deep Learning Toolbox by Levenberg–Marquardt backpropagation, as this has been shown to be the fastest method in training the FF-NN [60,61,62]. FF-NN architecture and training parameters are summarised in Table 3. For a complete description of Levenberg–Marquardt backpropagation, refer to the cited paper by Hagan and Menhaj [60].
For initial validation of the metamodel, a comparison of the maximum deflection predicted by the metamodel and calculation by FEM for three preforms not used in FF-NN training (Figure 4) are compared. Further validation is conducted on preform geometries obtained using the optimisation procedure.

2.3. Optimisation

The optimisation of a performance metric of an SMC-based component can be defined as a multivariable optimisation problem (MVO). The mathematical description of an MVO is [63,64,65]:
m i n ( f ( x ) ) , x S
where f : R n R is the objective function and x = ( x 1 ,   x 2 ,   , x n ) T is the decision vector belonging to the nonempty feasible region S R n [63]. In this case, maximum deflection of the plate in z-direction Dz is treated as the objective function, which is defined by the maximum absolute deflection of all nodes N observed in this direction (compare Figure 5; notation derived from Islam et al.) [66]:
f ( x ) = max | ( D z ) i | ,   i = 1 ,   2 ,   3 , N .
The components of the decision vector shown in Table 4 correspond with the input variables of the metamodel described previously (initial filling state of each element, which can only be completely filled or empty).
A challenge in solving MVO is detecting the global minimum of f , for which evolutionary algorithms (EA) such as genetic algorithms (GA) have been used successfully [67,68,69]. These algorithms may include multiple different operators such as crossover and mutation. Here, a non-standard mutation procedure is implemented, which is based on evaluation of the metamodel (Section 2.2).
The setup of the developed optimisation routine is shown in Figure 6. Using an iterative method presented in the following, a preform geometry and position that minimises the objective function is sought.
(1)
Mutation of preform and evaluation of objective function:
Starting elements (which can be a single element or a group of adjacent elements) are mutated iteratively by applying the eight subsequent procedures summarised in Table 5. During these procedures, the preform geometry is increased (or decreased) by the R adjacent, randomly chosen elements (R initially being one) in the specified direction. Decrease procedures are initialised after the minimum preform size (5% of the part surface area coverage) is reached.
After each procedure, the resulting plate deformation of the new preform geometry is evaluated using the metamodel. Mutation is retained if a decrease of the objective function is predicted. To decrease the likelihood in reaching a local minimum (thus not being the most optimal, global solution for the optimisation), R is increased to three if no decrease in deflection is reached during 10 iterations. The mutation is terminated after a total of 125 iterations.
(2)
Evaluation of boundary conditions:
In prior conducted studies, problem-dependent constraints and constraint handling techniques had to be implemented [25,31]. As the description of the preform in the presented approach is based on the discretisation of the geometry also used in process and structural simulation, typical constraints such as limiting the preform to the inside of the mould are not necessary.
Two problem-independent constraints (e.g., independent of the part geometry) are implemented, with which the typical processing defects and limitations of the compression moulding process are addressed:
(a)
After each iteration, the mutated preform is automatically checked for the absence of enclosed, empty elements, which can lead to part defects such as air pockets [70]. If this was detected during preform optimisation, mutation was limited to the first four procedures until the enclosed elements were eliminated.
(b)
Preform size needs to exceed at least 5% of the part surface area, thus limiting the height of the preform.
As starting elements, five evenly spaced elements contained inside the FF-NN training sample preform resulting in the smallest maximum deflection are used, as an optimal solution is presumed in this area (see Figure 2 and Figure 9). One of the following two results are expected after successfully running the optimisation procedure:
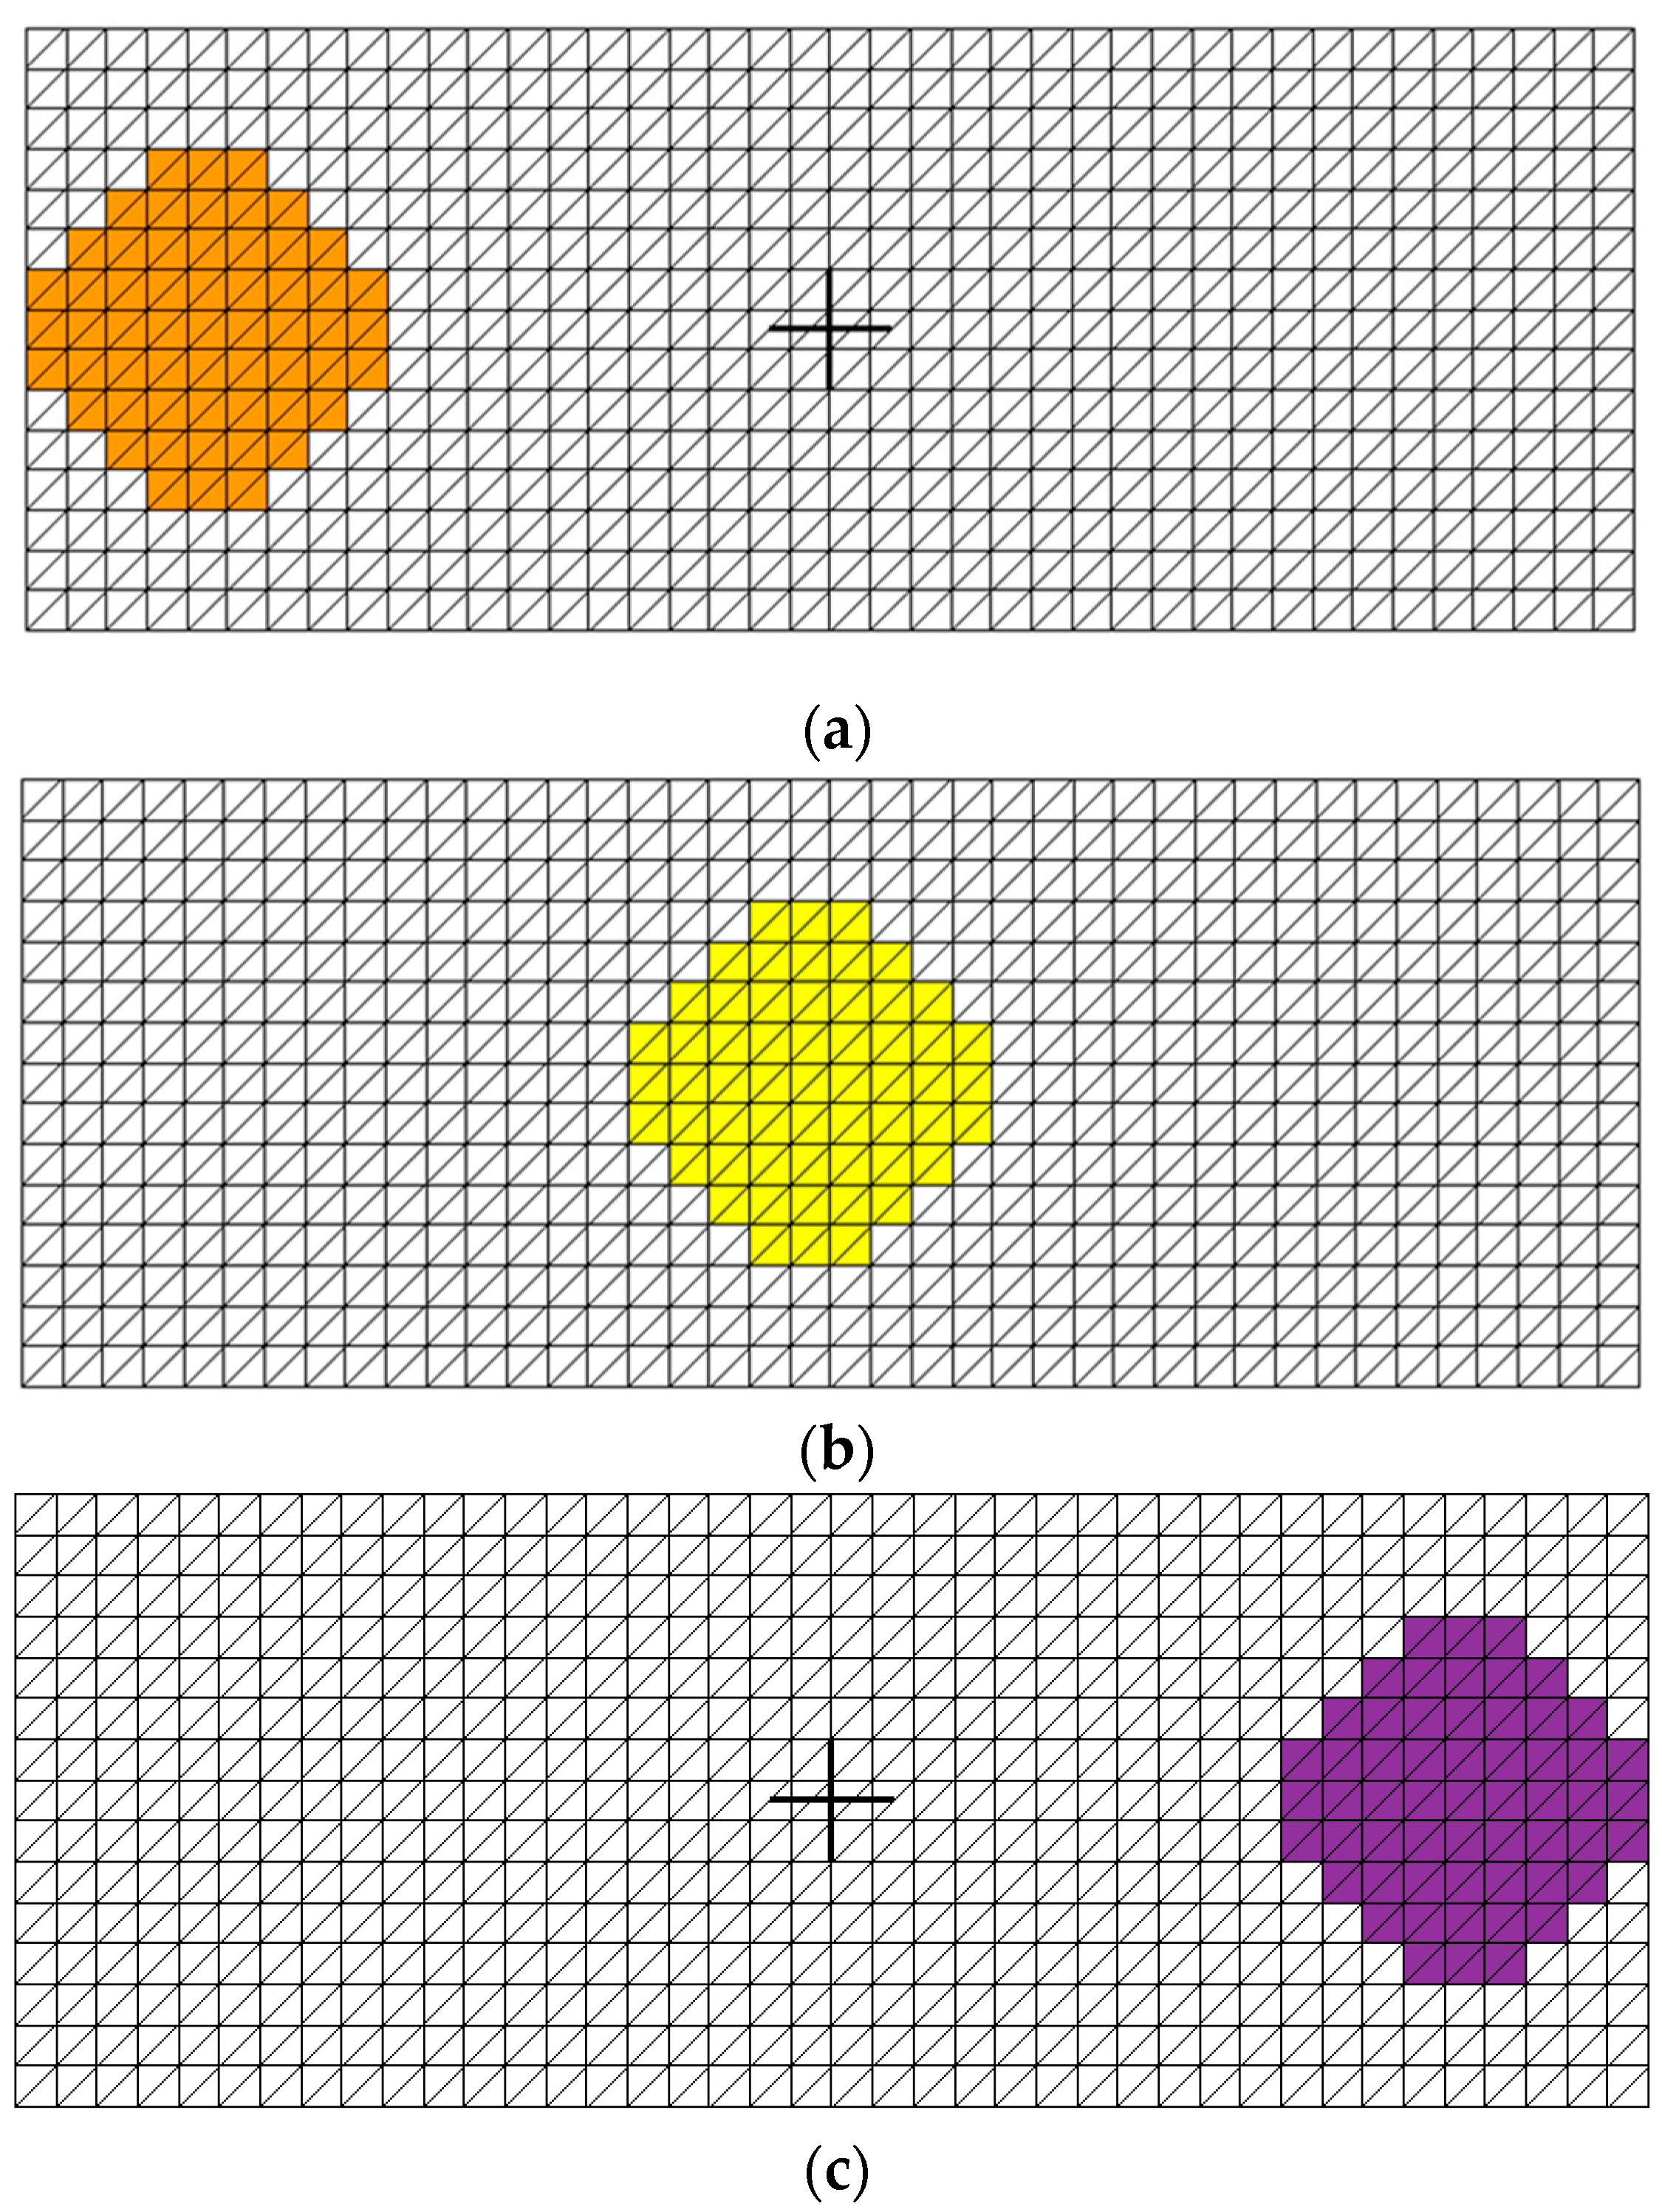
  • Training sample preform is global optima: Training sample is reached regardless of starting element
  • Training sample is local optima: Alternative preform is determined, which results in lower maximum plate deflection. This may vary depending on the starting element.

3. Results and Discussion

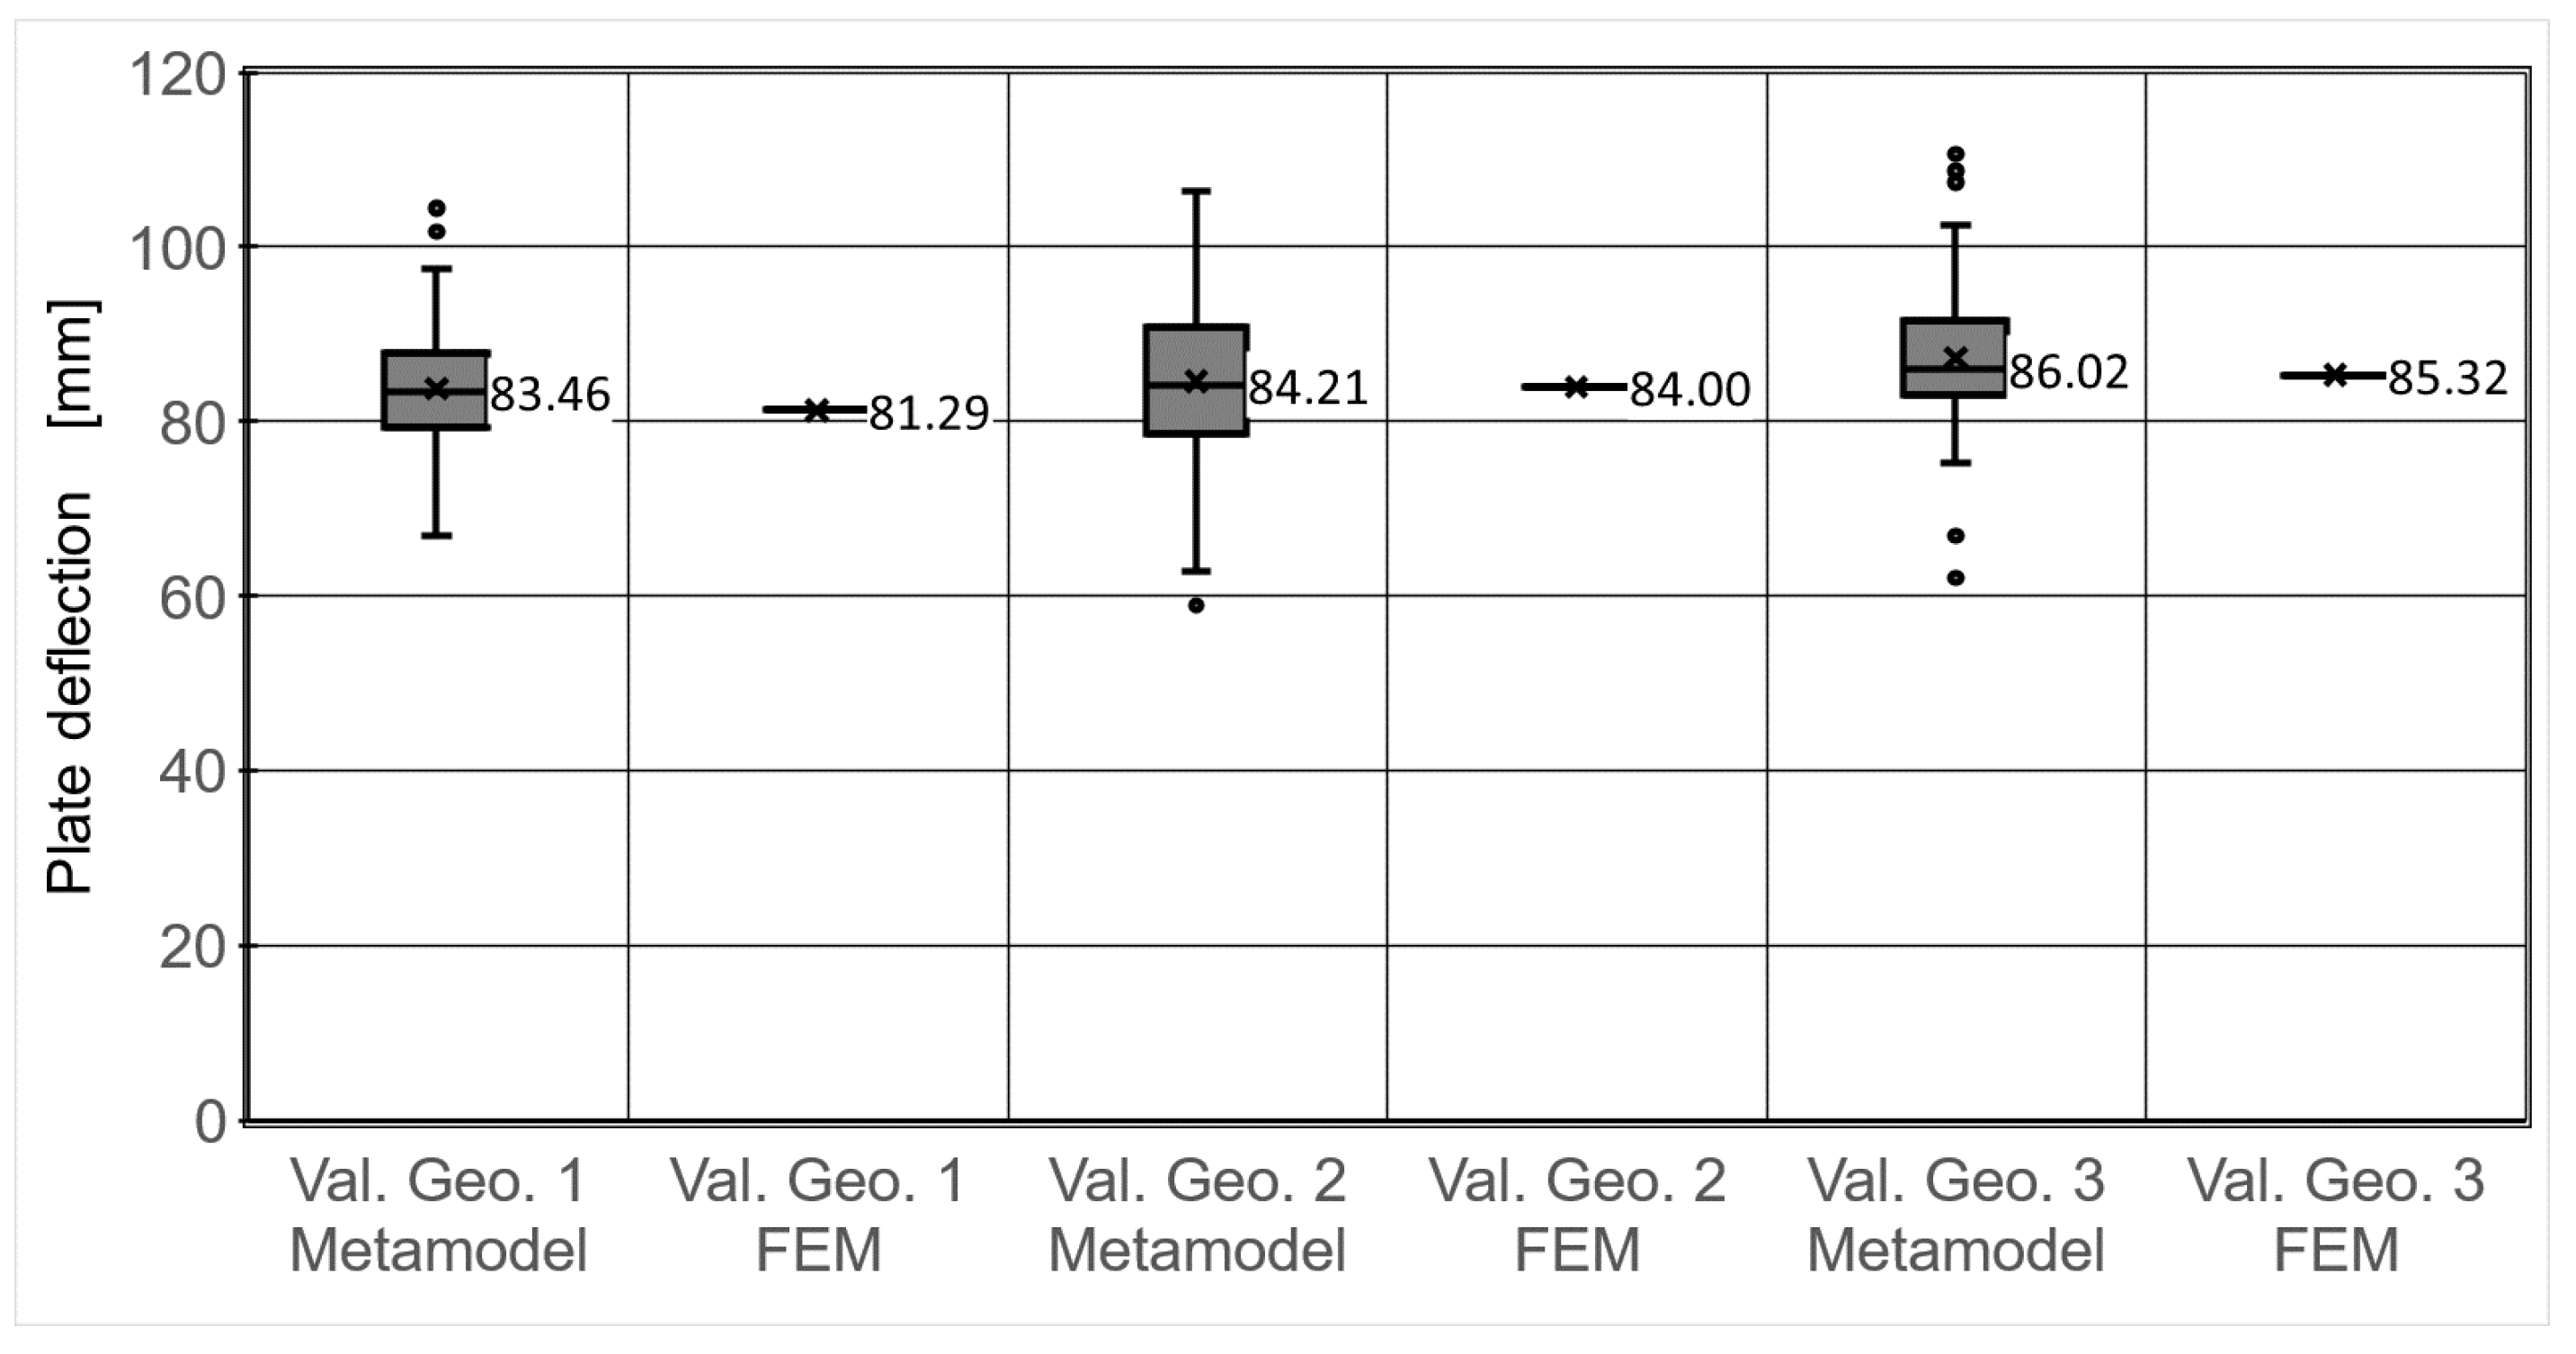
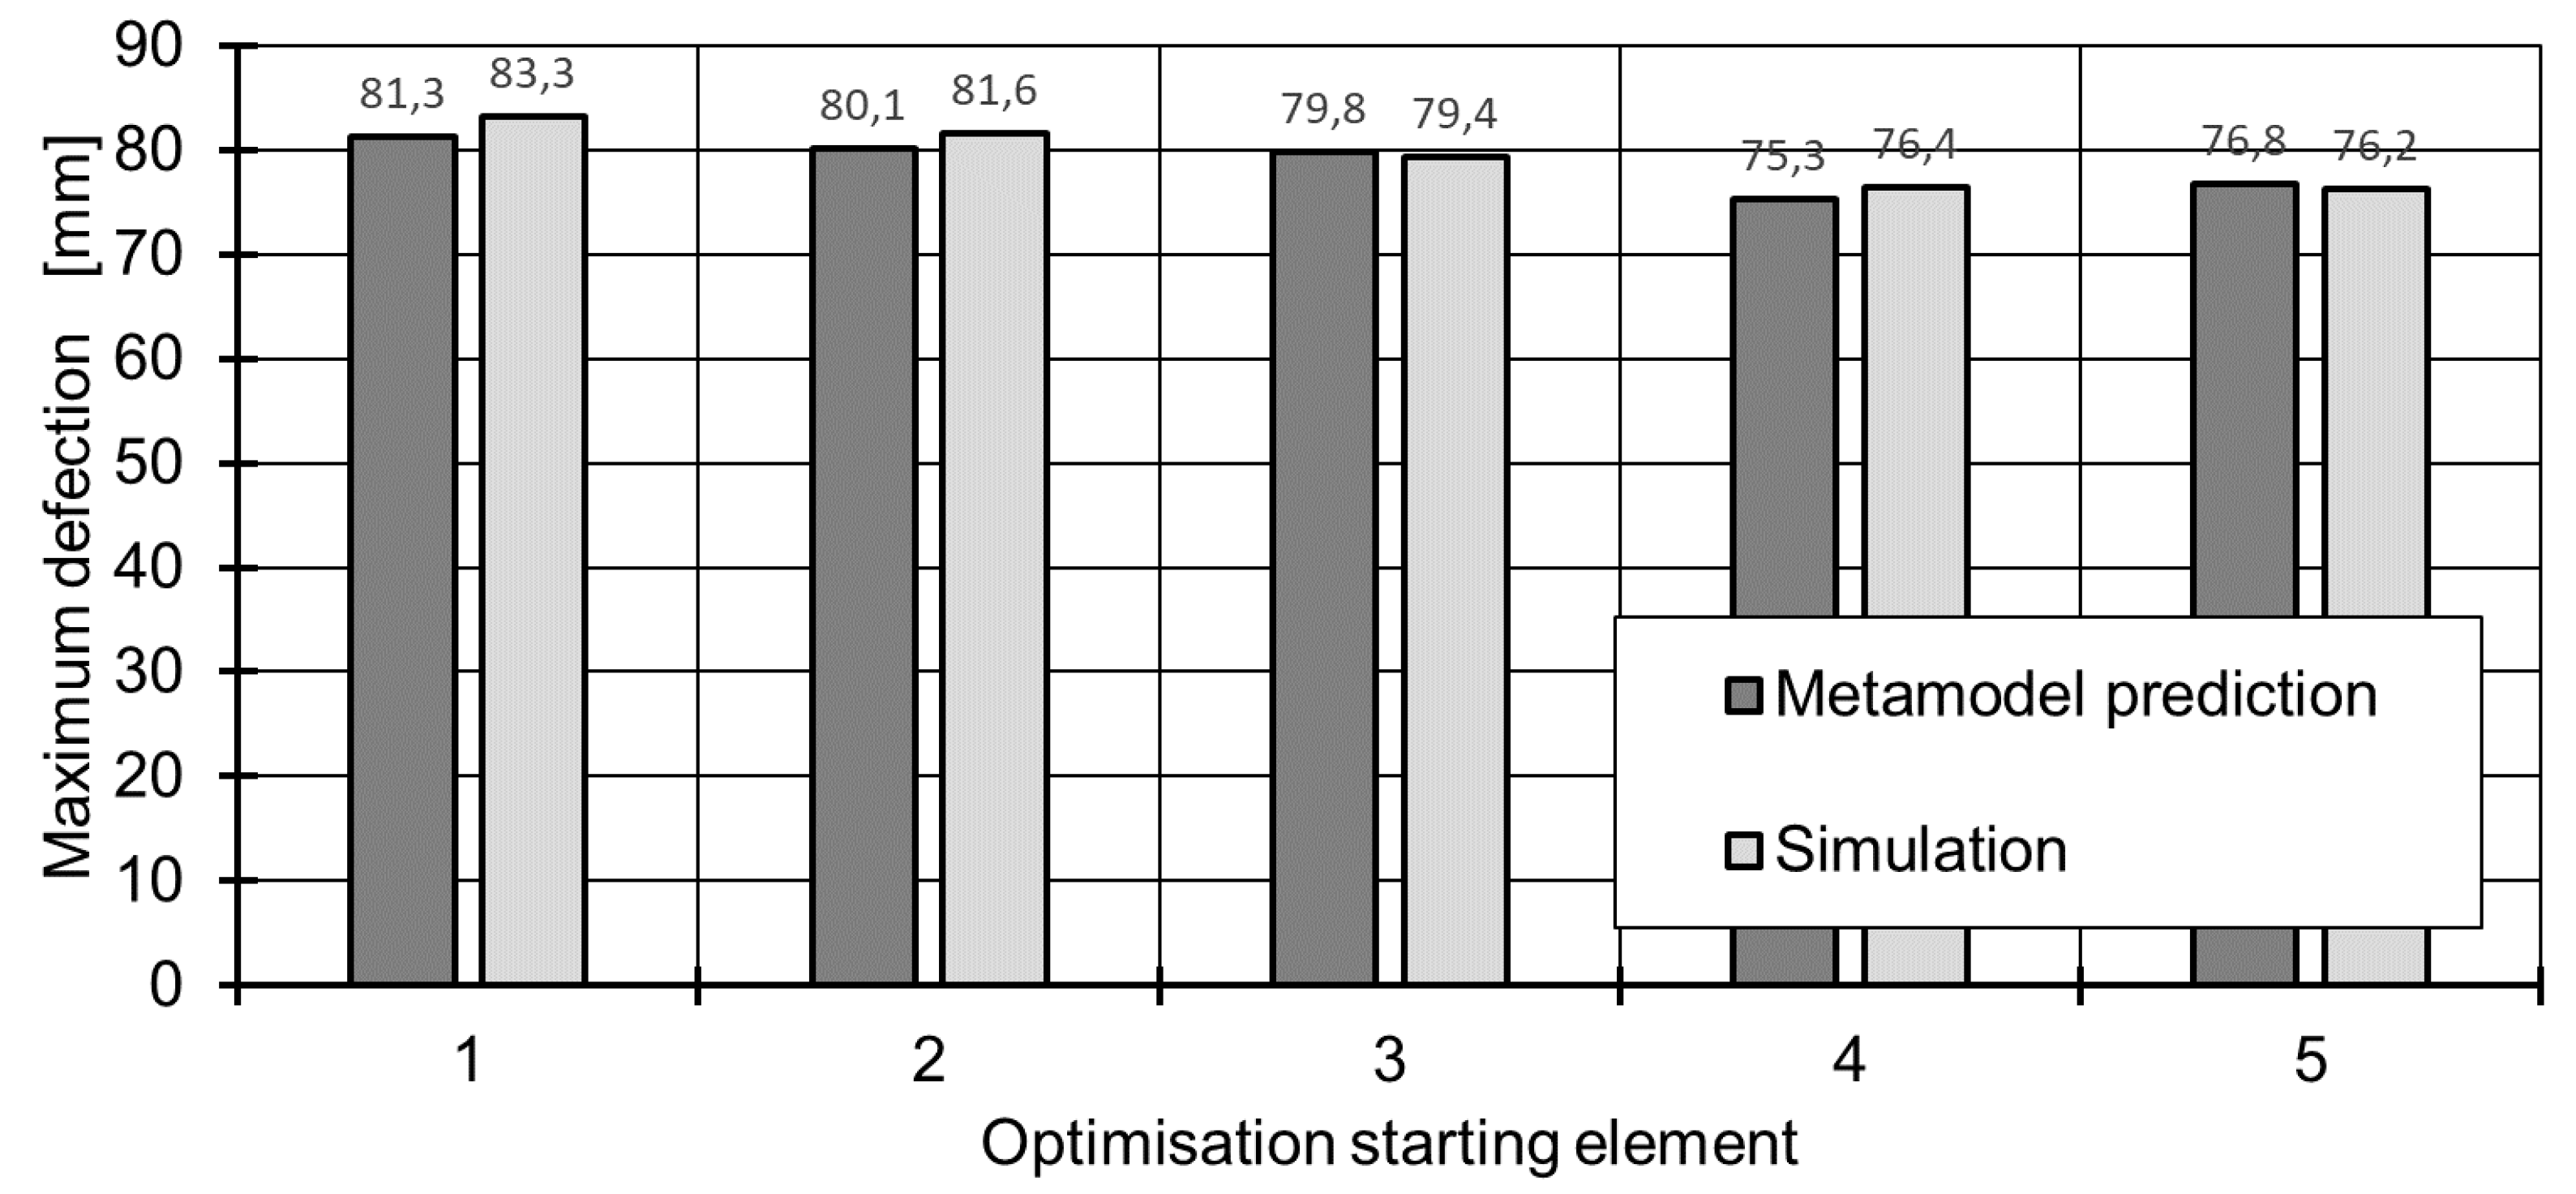
3.1. Metamodel Validation

In Figure 7, maximum absolute deflections attained by the metamodel and FEM for the validation geometries are compared. Standard deviations and outliers of the 100 individual FF-NN outputs of which the metamodel is composed are also shown. Maximum plate deflections predicted by the metamodel differ by 2.67% (validation geometry 1), 0.26% (validation geometry 2), and 0.82% (validation geometry 3) from values obtained by FEM, respectively. Therefore, plate deflections are predicted accurately by the metamodel.
As expected, the individual FF-NN included in the metamodel exhibit a high spread in outputs, exceeding 50% of the metamodel output value (e.g., total spread in predicted deflections for validation geometry 3: 48.47 mm), which is attributed to overfitting during the training process (see Section 2.2). No significant influence of the preform position on the spread of the individual FF-NN outputs can be detected. Potentials for decrease in spread include increasing the sample set size and implementing NN validation procedures; however, these would significantly increase the computational effort.
To further evaluate the decrease in plate deflection from 85.32 mm to 81.29 mm which results from decreasing the charge distance from the clamping location, fibre orientations are compared. Fibre orientation tensor component axx, which is visualised in Figure 8, describes the probability of fibre orientation in the x-axis direction [5]. For a decrease in the charge distance from clamping location results, a decrease of this tensor component in the left half of the plate is observed, which reduces the local flexural modulus and therefore the overall bending stiffness of the plate [71]. Although validation geometries used are symmetric relative to the principal axis of the plate, fibre orientations calculated by FEM are not symmetric relative to this axis, which may result from the non-symmetry and coarseness of the mesh used [72].

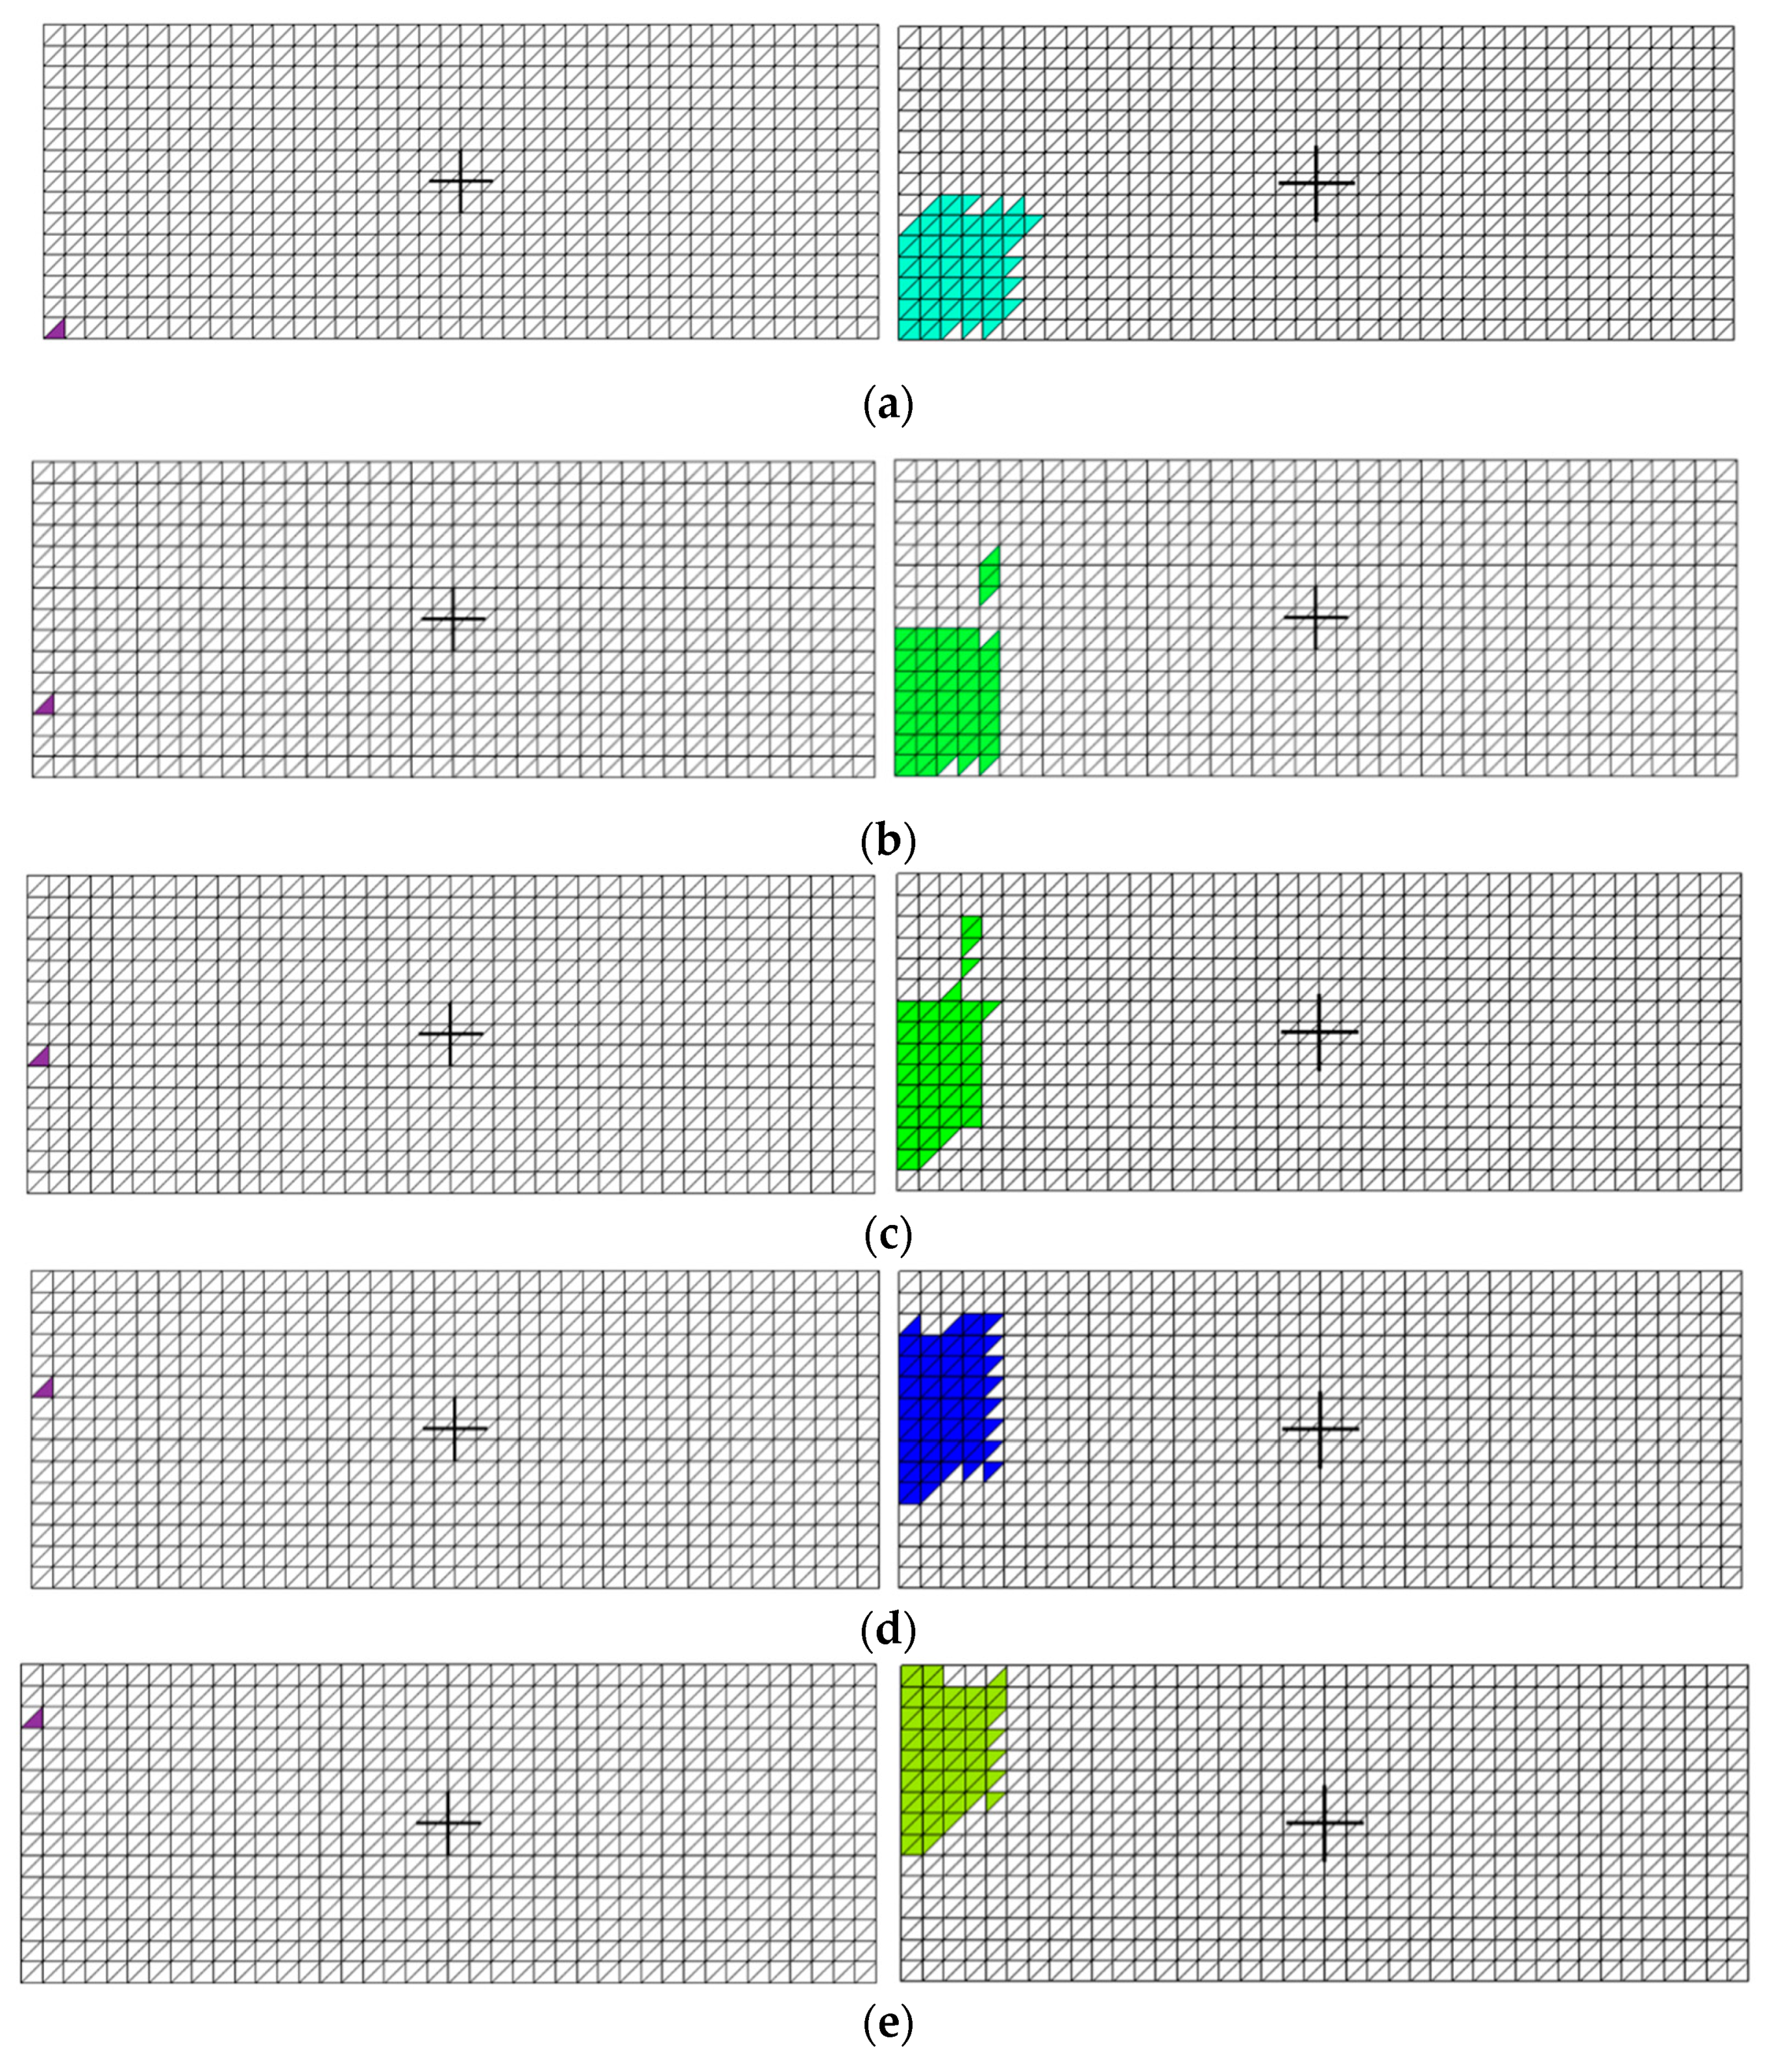
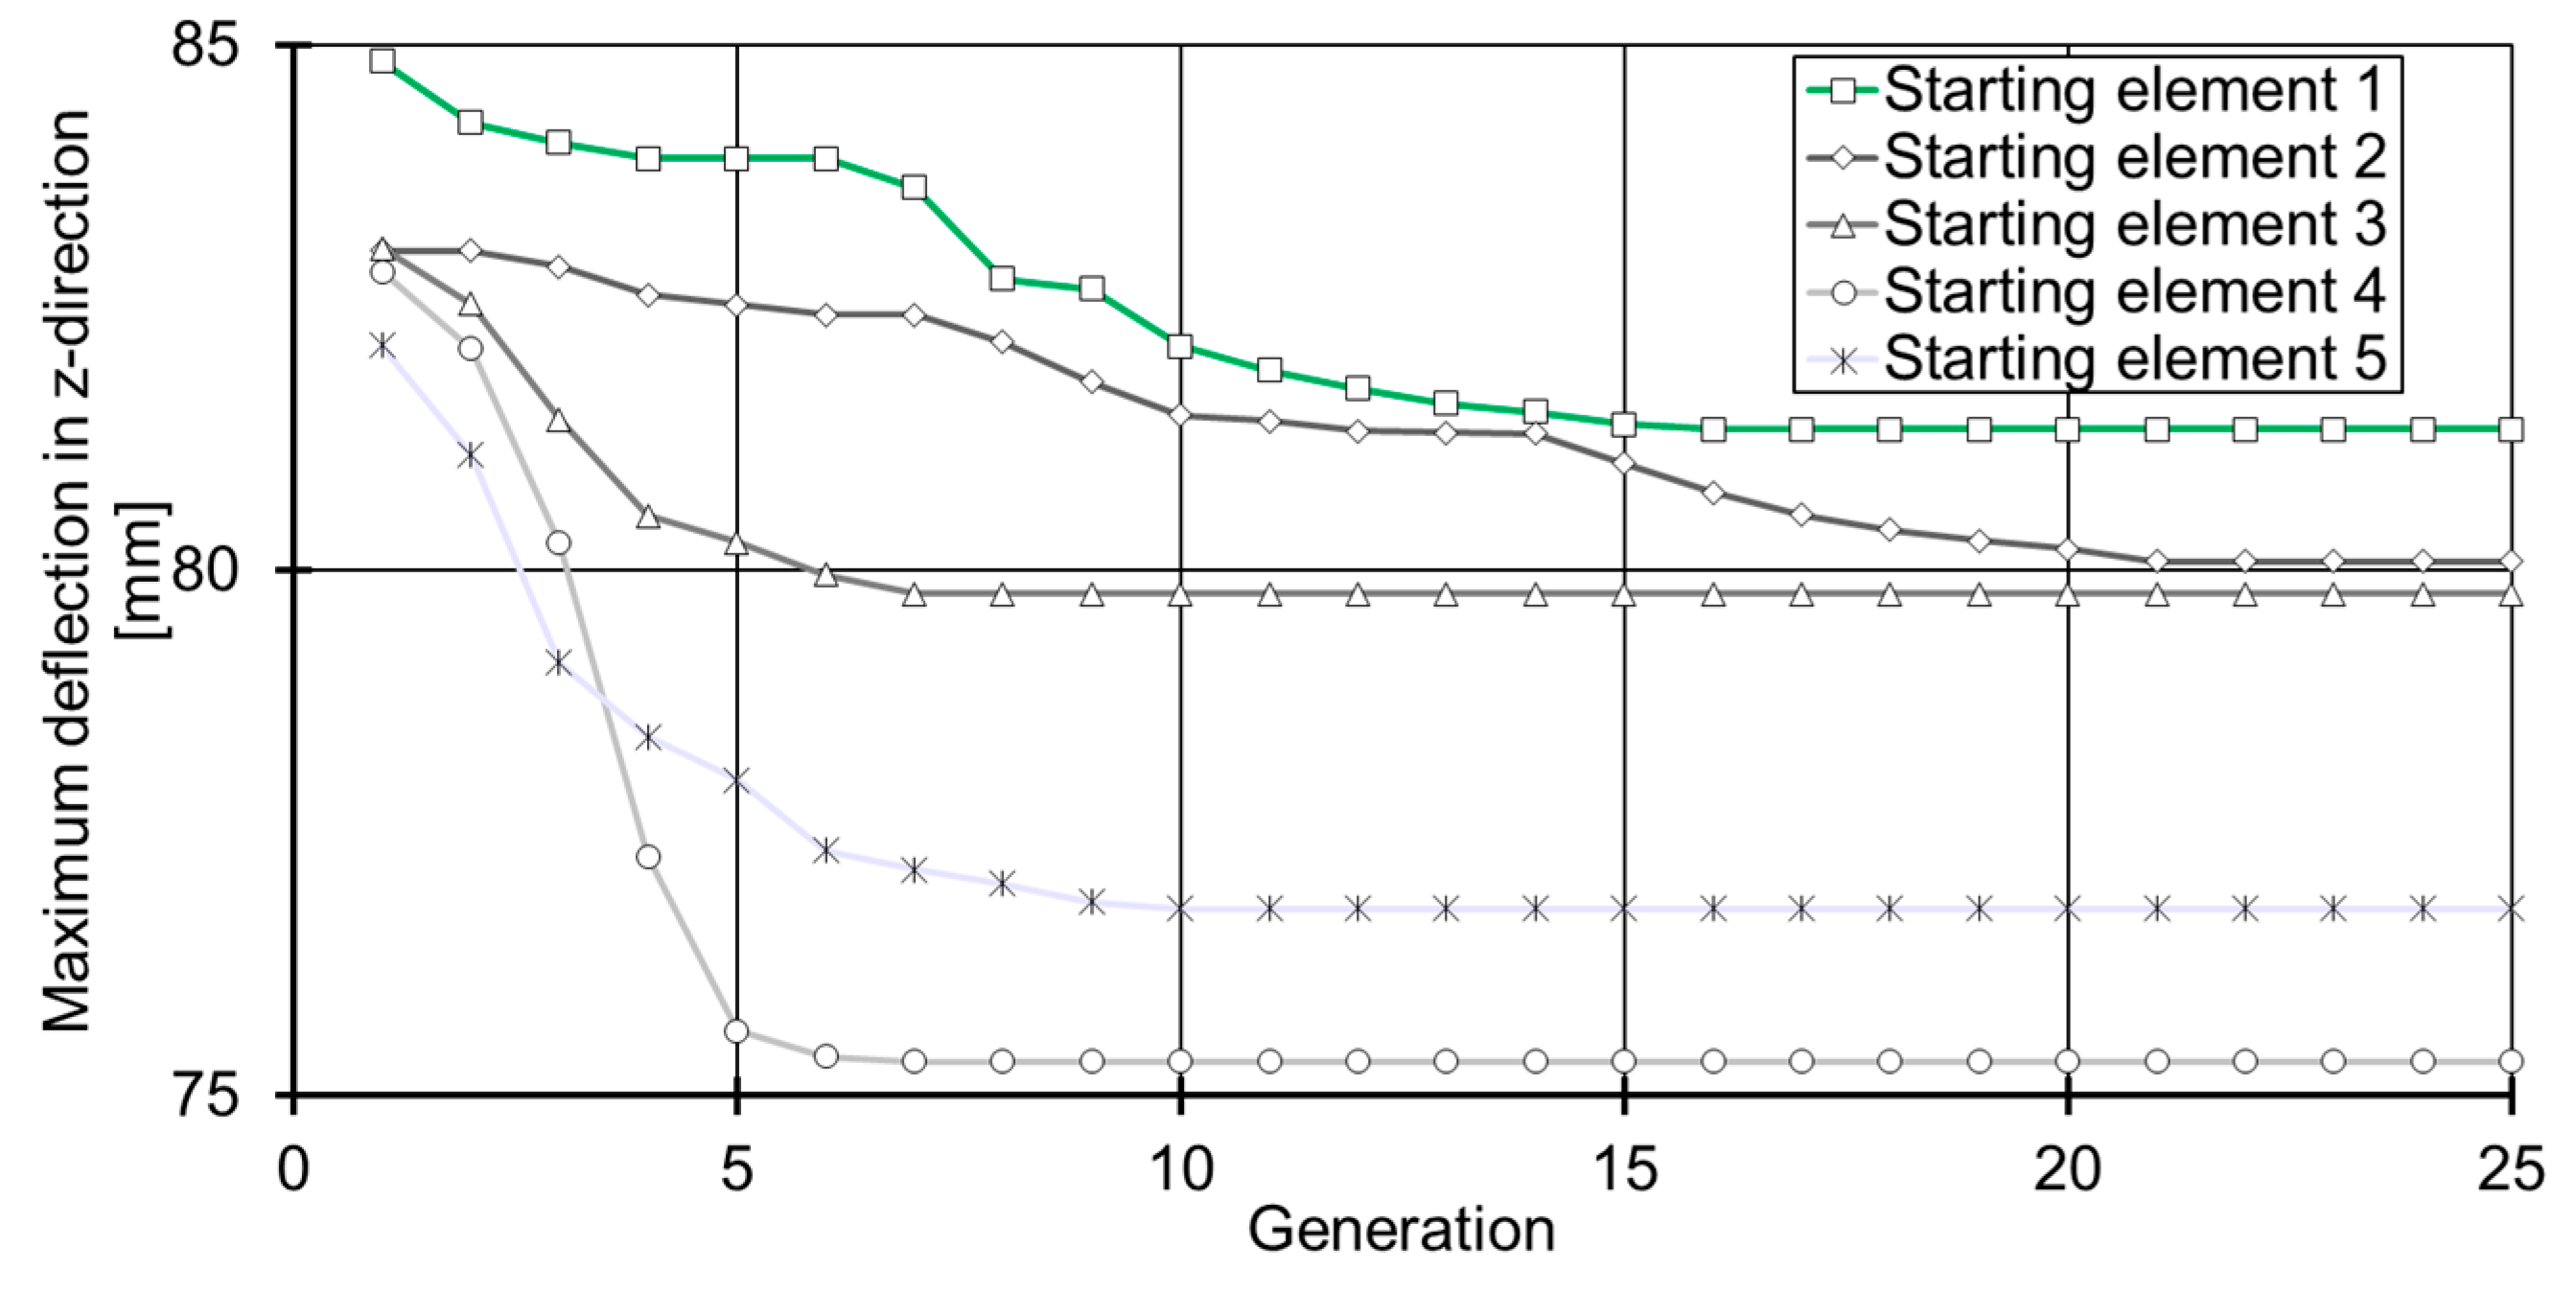
3.2. Preform Optimisation

The starting elements of the performed preform optimisations and resulting preform geometries are shown in Figure 9. Preform geometries resulting from adjacent starting points show a similarity in size and geometry; however, these are not identical in any case. Convergence of the objective function is presented in Figure 10. However, it has to be clear that the early generations do not represent valid solutions, as the minimum preform size (Section 2.3, constraint 2b) is only reached during the final generations.
Although 125 iterations were conducted in each case, no decrease in the objective function value or further change in preform geometry is detected for any starting element from 25 generations onwards. The run time was under five minutes respectively. One can see a high decrease in maximum deflection during the initial iterations, with the tapering off of the attained decrease going further. The minima of the objective function range from 75.3 (Starting element 4) to 81.3 mm (Starting element 1) (Figure 9). Similar to the validation geometries, comparison of the metamodel output with FEM results again confirm accurate prediction by the metamodel, with deviations ranging from 0.46% (Starting element 4) to 2.14% (Starting element 1) (Figure 11).
As different preforms are achieved depending on the starting element and only one global minima is presumed to exist, optimised preforms represent the local minima of the MVO. Further comparison of the obtained values for the objective function (Starting element 5) with maximum deflection of the sample from which the starting elements were initially taken (Figure 2) show that the algorithm was not capable in reaching this more optimal solution (in comparison, the highest deflection of all the samples was 114.9 mm). This sample is in contact with the full length of the left plate edge, representing the highest achievable flow length while fulfilling the minimum mould coverage defined in the optimisation. While reaching the geometry of the mentioned sample may be possible when strongly increasing the number of conducted iterations, the function of the optimisation algorithm is restricted while approaching it due to it having the minimum mould coverage (5%) for conducting a valid mutation step. The sharp edges of the optimised geometries are a result of the use of S3 elements, and these could be combatted by increasing the element count, adding additional constraints to the optimisation procedure, or using alternative process simulation approaches. Additionally, an additional constraint for avoiding two preforms from forming should be implemented (as is the case in preform (b)), as these may lead to weld lines and should be avoided.

4. Conclusions

The development and refinement of metamodelling (or surrogate modelling) approaches is a beneficial step in expanding the capabilities in simulation-based SMC compression moulding process optimisation and reducing computational demand.
In this paper, an ensemble metamodelling approach is proposed, in which the spatial discretisation necessary for process and structural simulation is exploited. Hereby, the initial filling states of each element are used as input variables for the metamodel. To mitigate the effects of overfitting, an ensemble modelling approach is used in which the mean outputs of 100 FF-NN is used as output of the metamodel. Training of the FF-NN is conducted on datasets obtained by process and structural simulation with random starting weights. Contrary to metamodelling approaches successfully implemented in the past, this approach enables defining the preform without inherent geometry restrictions, as viable geometries are only dependent on the discretisation itself.
The approach is used to predict the preform geometry and position-dependent maximum deflection of a plate geometry under cantilever bending load. Maximum absolute deflection can be accurately predicted by the metamodel, with deviations between metamodel prediction and FEM validation ranging from 0.26% to 2.67%.
The usability of the metamodel in a subsequently conducted preform optimisation routine can be shown, but it is believed to be limited by the closeness of local optima to each other and chosen boundary conditions for mould coverage. For purpose of procedure development, a fairly simple plate geometry was chosen, limiting the potential in finding non-obvious solutions.
Further work will focus on the evaluation of alternative optimisation routines, which make use of the prediction accuracy of this metamodelling approach more efficiently. These could be derived from methodologies found in topology optimisation. One method that could be applicable to the metamodel is Solid Isotropic Material with Penalisation (SIMP), which was initially proposed by Bendsoe and Kikuchi [73]. An additional focus will be the application to parts with higher geometric complexity and alternative load cases, for which the potential of deriving non-apparent preform geometries and positions and thus potential for industrial applicability is higher. Subsequently, comparison with experimentally obtained part behaviour will be conducted.

Author Contributions

J.N. and R.L.P.G. conceived and implemented the methodologies and procedures. J.N. prepared the original draft and visualisations. C.H., K.F. and D.S. reviewed and edited the original draft and provided project supervision. All authors have read and agreed to the published version of the manuscript.

Funding

The investigations set out in this report received financial support from the European Regional Development Fund (No.: EFRE-0801121), to whom we extend our thanks.

Conflicts of Interest

The authors declare no conflict of interest. The funders had no role in the design of the study; in the collection, analyses, or interpretation of data; in the writing of the manuscript, or in the decision to publish the results.

Appendix A

Calculation of scalars Bi for calculation of orientation tensor averaged stiffness tensor from unidirectional stiffness tensor Cii (written in compacted notion) [11]:
B 1 = C 11 + C 22 2 C 12 4 C 66
B 2 = C 12 C 23
B 3 = C 66 + 1 2 ( C 23 C 22 )
B 4 = C 23
B 5 = 1 2 ( C 22 C 23 )

References

  1. Witten, E.; Mathes, V.; Sauer, M. Composites—Marktbericht 2018 Marktentwicklungen, Trends, Ausblicke Und Herausforderungen; Industrievereinigung Verstärkte Kunststoffe (AVK): Frankfurt, Germany, 2018. [Google Scholar]
  2. Wang, C.W.; Tsai, W.C.; Sun, S.B.; Hsu, C.H.; Chang, R. Optimizing process condition of compression molding: From material properties characterization to numerical simulation. In Proceedings of the Annual Technical Conference (ANTEC), Indianapolis, IN, USA, 23–25 May 2016; Society of Plastics Engineers: Brookfield, CT, USA; pp. 463–468. [Google Scholar]
  3. Advani, S.G.; Sozer, E.M. Process Modeling in Composites Manufacturing; Informa UK Limited: London, UK, 2010. [Google Scholar]
  4. Marjavaara, B.D.; Ebermark, S.; Lundström, T.S. Compresson moulding simulations of SMC using a multiobjective surrogate-based inverse modeling approach. Mech. Compos. Mater. 2009, 45, 503–514. [Google Scholar] [CrossRef]
  5. Advani, S.G. The Use of Tensors to Describe and Predict Fiber Orientation in Short Fiber Composites. J. Rheol. 1987, 31, 751–784. [Google Scholar] [CrossRef]
  6. Sommer, D.E.; Favaloro, A.J.; Pipes, R.B. Coupling anisotropic viscosity and fiber orientation in applications to squeeze flow. J. Rheol. 2018, 62, 669–679. [Google Scholar] [CrossRef]
  7. Sommer, D.E.; Kravchenko, O.G.; Denos, B.; Favaloro, A.J.; Pipes, R.B. Integrative analysis for prediction of process-induced, orientation-dependent tensile properties in a stochastic prepreg platelet molded composite. Compos. Part A Appl. Sci. Manuf. 2020, 130, 105759. [Google Scholar] [CrossRef]
  8. Sabiston, T.; Inal, K.; Lee-Sullivan, P. Application of Artificial Neural Networks to predict fibre orientation in long fibre compression moulded composite materials. Compos. Sci. Technol. 2020, 190, 108034. [Google Scholar] [CrossRef]
  9. Kluge, N.J.; Lundström, T.S.; Westerberg, L.G.; Olofsson, K. Compression moulding of sheet moulding compound: Modelling with computational fluid dynamics and validation. J. Reinf. Plast. Compos. 2015, 34, 479–492. [Google Scholar] [CrossRef]
  10. Oldenbo, M.; Mattsson, D.; Varna, J.; Berglund, L.A. Global Stiffness of a SMC Panel Considering Process Induced Fiber Orientation. J. Reinf. Plast. Compos. 2004, 23, 37–49. [Google Scholar] [CrossRef]
  11. Martulli, L.M.; Muyshondt, L.; Kerschbaum, M.; Pimenta, S.; Lomov, S.V.; Swolfs, Y. Carbon fibre sheet moulding compounds with high in-mould flow: Linking morphology to tensile and compressive properties. Compos. Part A Appl. Sci. Manuf. 2019, 126. [Google Scholar] [CrossRef]
  12. Osswald, T.A. Numerical Methods for Compression Mold Filling Simulation. Ph.D. Thesis, University of Illinois, Champaign, IL, USA, 1987. [Google Scholar]
  13. Folgar, F.; Tucker, C.L. Orientation Behavior of Fibers in Concentrated Suspensions. J. Reinf. Plast. Compos. 1984, 3, 98–119. [Google Scholar] [CrossRef]
  14. Osswald, T.A.; Tucker, C.L. Compression Mold Filling Simulation for Non-Planar Parts. Int. Polym. Process. 1990, 5, 79–87. [Google Scholar] [CrossRef]
  15. Tucker, C.L.; Folgar, F. A model of compression mold filling. Polym. Eng. Sci. 1983, 23, 69–73. [Google Scholar] [CrossRef]
  16. Osswald, T.A.; Tucker, C.L. A boundary element simulation of compression mold filling. Polym. Eng. Sci. 1988, 28, 413–420. [Google Scholar] [CrossRef]
  17. Hele-Shaw, H.S. The Motion of a Perfect Fluid. In The Weekly Evening Meeting; Wentworth Press: Sydney, Australia, 1899. [Google Scholar]
  18. Lee, C.-C.; Folgar, F.; Tucker, C.L. Simulation of Compression Molding for Fiber-Reinforced Thermosetting Polymers. J. Eng. Ind. 1984, 106, 114–125. [Google Scholar] [CrossRef]
  19. Barone, M.R.; Caulk, D.A. A Model for the Flow of a Chopped Fiber Reinforced Polymer Compound in Compression Molding. J. Appl. Mech. 1986, 53, 361–371. [Google Scholar] [CrossRef]
  20. Barone, M.R.; Caulk, D.A. Kinematics of flow in sheet molding compounds. Polym. Compos. 1985, 6, 105–109. [Google Scholar] [CrossRef]
  21. Kühn, C.; Walter, I.; Täger, O.; Osswald, T. Simulative Prediction of Fiber-Matrix Separation in Rib Filling During Compression Molding Using a Direct Fiber Simulation. J. Compos. Sci. 2017, 2, 2. [Google Scholar] [CrossRef] [Green Version]
  22. Li, Y.; Chen, Z.; Xu, H.; Dahl, J.; Zeng, D.; Mirdamadi, M.; Su, X. Modeling and Simulation of Compression Molding Process for Sheet Molding Compound (SMC) of Chopped Carbon Fiber Composites. SAE Int. J. Mater. Manuf. 2017, 10, 130–137. [Google Scholar] [CrossRef]
  23. Hohberg, M. Experimental Investigation and Process Simulation of the Compression Molding Process of Sheet Molding Compound (SMC) with Local Reinforcements; Elsevier: Amsterdam, The Netherlands, 2018. [Google Scholar]
  24. Meyer, N.; Schöttl, L.; Bretz, L.; Hrymak, A.; Kärger, L. Direct Bundle Simulation approach for the compression molding process of Sheet Molding Compound. Compos. Part A Appl. Sci. Manuf. 2020, 132, 105809. [Google Scholar] [CrossRef]
  25. Ankenman, B.; Bisgaard, S.; Osswald, T.A. Experimental Optimization of Computer Models of Manufacturing Processes. Manuf. Rev. 1994, 7, 332–344. [Google Scholar]
  26. Guo, X.; Li, W.; Iorio, F. Convolutional Neural Networks for Steady Flow Approximation. In Proceedings of the 22nd ACM SIGKDD International Conference on Knowledge Discovery and Data Mining, San Francisco, CA, USA, 13–17 August 2016; Association for Computing Machinery: New York, NY, USA, 2016; pp. 481–490. [Google Scholar]
  27. Michaeli, W.; Johannaber, F. Handbuch Spritzgießen, 2nd ed.; Carl Hanser Verlag: Munich, Germany, 2004; Available online: https://www.hanser-fachbuch.de/buch/Handbuch+Spritzgiessen/9783446229662 (accessed on 29 June 2020).
  28. Tompson, J.; Schlachter, K.; Sprechmann, P.; Perlin, K. Accelerating Eulerian Fluid Simulation with Convolutional Networks. In Proceedings of the 34th International Conference on Machine Learning, Sunday, Australia, 10–11 August 2017; International Convention Centre: Sydney, Australia; PMLR: Sydney, Australia, 2017; Volume 70, pp. 3424–3433. [Google Scholar]
  29. Ladicky, L.; Jeong, S.; Solenthaler, B.; Pollefeys, M.; Gross, M. Data-driven fluid simulations using regression forests. ACM Trans. Graph. 2015, 34, 1–9. [Google Scholar] [CrossRef]
  30. Twu, J.-T.; Lee, L.J. Application of artificial neural networks for the optimal design of sheet molding compound (SMC) compression molding. Polym. Compos. 1995, 16, 400–408. [Google Scholar] [CrossRef]
  31. Kim, M.-S.; Lee, W.I.; Han, W.-S.; Vautrin, A. Optimisation of location and dimension of SMC precharge in compression moulding process. Comput. Struct. 2011, 89, 1523–1534. [Google Scholar] [CrossRef]
  32. Jin, R.; Chen, W.; Simpson, T. Comparative studies of metamodelling techniques under multiple modelling criteria. Struct. Multidiscip. Optim. 2001, 23, 1–13. [Google Scholar] [CrossRef]
  33. Tizzard, K.; Kleijnen, J.P.C. Statistical Tools for Simulation Practitioners. J. R. Stat. Soc. Ser. A (Stat. Soc.) 1988, 151, 374. [Google Scholar] [CrossRef]
  34. Chen, Z.; Huang, T.; Shao, Y.; Li, Y.; Xu, H.; Avery, K.; Zeng, D.; Chen, W.; Su, X. Multiscale finite element modeling of sheet molding compound (SMC) composite structure based on stochastic mesostructure reconstruction. Compos. Struct. 2018, 188, 25–38. [Google Scholar] [CrossRef]
  35. Twu, J.-T.; Lee, L.J.; Chen, S.-C. Simulation-based design of sheet molding compound (SMC) compression molding. Polym. Compos. 1994, 15, 313–326. [Google Scholar] [CrossRef]
  36. Michaeli, W.; Kremer, C. Predicting the surface waviness of sheet moulding compound parts by simulating process-induced thermal stresses. J. Polym. Eng. 2011, 31, 561–566. [Google Scholar] [CrossRef]
  37. Semmler, E. Simulation of the Mechanical and Thermomechanical Behavior of Thermoplastic Fiber-reinforced Compression Moulded Parts. Ph.D. Thesis, RWTH Aachen University, Aachen, Germany, 1998. [Google Scholar]
  38. Specker, O. Compression Moulding of SMC: Computer Simulations for Computer-Aided Lay-Out of the Process and for Determination of the Component Properties. Ph.D. Thesis, RWTH Aachen University, Aachen, Germany, 1991. [Google Scholar]
  39. Jeffery, G.B. The motion of ellipsoidal particles immersed in a viscous fluid. Proc. R. Soc. Lond. Ser. A Math. Phys. Sci. 1922, 102, 161–179. [Google Scholar] [CrossRef] [Green Version]
  40. Phelps, J.H.; Tucker, C.L. An anisotropic rotary diffusion model for fiber orientation in short- and long-fiber thermoplastics. J. Non Newton. Fluid Mech. 2009, 156, 165–176. [Google Scholar] [CrossRef]
  41. Wang, M.-L.; Chang, R.-Y.; Hsu, C.-H.D. Molding Simulation: Theory and Practice; Carl Hanser Verlag: Munich, Germany, 2018. [Google Scholar]
  42. Wang, J.; O’Gara, J.F.; Tucker, C.L.; Iii, C.L.T. An objective model for slow orientation kinetics in concentrated fiber suspensions: Theory and rheological evidence. J. Rheol. 2008, 52, 1179–1200. [Google Scholar] [CrossRef]
  43. Gandhi, U.N.; Goris, S.; Osswald, T.A.; Song, Y.Y. Discontinuous Fiber—Reinforced Composites—Fundamentals and Applications; Carl Hanser Verlag: Munich, Germany, 2020. [Google Scholar]
  44. Tseng, H.-C.; Chang, R.-Y.; Hsu, C.-H. Numerical prediction of fiber orientation and mechanical performance for short/long glass and carbon fiber-reinforced composites. Compos. Sci. Technol. 2017, 144, 51–56. [Google Scholar] [CrossRef]
  45. Tseng, H.-C.; Chang, R.-Y.; Hsu, C.-H. An objective tensor to predict anisotropic fiber orientation in concentrated suspensions. J. Rheol. 2016, 60, 215–224. [Google Scholar] [CrossRef]
  46. Kim, M.S.; Lee, W.I.; Han, W.-S.; Vautrin, A.; Park, C.H. Thickness optimization of composite plates by Box’s complex method considering the process and material parameters in compression molding of SMC. Compos. Part A Appl. Sci. Manuf. 2009, 40, 1192–1198. [Google Scholar] [CrossRef]
  47. Affdl, J.C.H.; Kardos, J.L. The Halpin-Tsai equations: A review. Polym. Eng. Sci. 1976, 16, 344–352. [Google Scholar] [CrossRef]
  48. Chen, Z.; Tang, H.; Shao, Y.; Sun, Q.; Zhou, G.; Li, Y.; Xu, H.; Zeng, D.; Su, X. Failure of chopped carbon fiber Sheet Molding Compound (SMC) composites under uniaxial tensile loading: Computational prediction and experimental analysis. Compos. Part A Appl. Sci. Manuf. 2019, 118, 117–130. [Google Scholar] [CrossRef]
  49. Simpson, T.; Poplinski, J.; Koch, P.N.; Allen, J. Metamodels for Computer-based Engineering Design: Survey and recommendations. Eng. Comput. 2001, 17, 129–150. [Google Scholar] [CrossRef] [Green Version]
  50. Webb, G.I. Overfitting. In Encyclopedia of Machine Learning; Sammut, C., Webb, G.I., Eds.; Springer: Boston, MA, USA, 2010; p. 744. [Google Scholar]
  51. Grant, P. Assessment and Selection; Springer Science and Business Media LLC: Berlin/Heidelberg, Germany, 2014. [Google Scholar]
  52. Mori, S.; Nishida, H.; Yamada, H. Optical Character Recognition, 1st ed.; John Wiley & Sons, Inc.: Hoboken, NJ, USA, 1999. [Google Scholar]
  53. Starzyk, J.A.; Ansari, N. Feedforward neural network for handwritten character recognition. In Proceedings of the 1992 IEEE International Symposium on Circuits and Systems, San Diego, CA, USA, 10–13 May 1992; Institute of Electrical and Electronics Engineers (IEEE): Miami, FL, USA, 2003; Volume 6, pp. 2884–2887. [Google Scholar]
  54. Hornik, K.; Stinchcombe, M.; White, H. Multilayer feedforward networks are universal approximators. Neural Netw. 1989, 2, 359–366. [Google Scholar] [CrossRef]
  55. Cybenko, G. Approximation by superpositions of a sigmoidal function. Math. Control. Signals Syst. 1989, 2, 303–314. [Google Scholar] [CrossRef]
  56. Peterson, G.E.; Clair, D.S.; Aylward, S.R.; Bond, W.E. Using Taguchi’s method of experimental design to control errors in layered perceptrons. IEEE Trans. Neural Netw. 1995, 6, 949–961. [Google Scholar] [CrossRef]
  57. Suzuki, K. Artificial Neural Networks—Architectures an Applications; Suzuki, K., Ed.; InTech: London, UK, 2017. [Google Scholar]
  58. Kotu, V.; Deshpande, B. Predictive Analytics and Data Mining; Morgan Kaufmann: Burlington, MA, USA, 2015. [Google Scholar]
  59. Kremer, C. Vorhersage der Oberflächenwelligkeit von Bauteilen aus Sheet Moulding Compound durch die Simulation der Prozessinduzierten Eigenspannung. Ph.D. Thesis, RWTH Aachen University, Aachen, Germany, 2011. [Google Scholar]
  60. Hagan, M.; Menhaj, M. Training feedforward networks with the Marquardt algorithm. IEEE Trans. Neural Netw. 1994, 5, 989–993. [Google Scholar] [CrossRef]
  61. Kipli, K.; Muhammad, M.S.; Masra, S.M.W.; Zamhari, N.; Lias, K.; Mat, D.A.A. Performance of Levenberg-Marquardt Backpropagation for Full Reference Hybrid Image Quality Metrics. In Proceedings of the International Multiconference of Engineers and Computer Scientists, Hong Kong, China, 14–16 March 2012; pp. 704–707. [Google Scholar]
  62. Kermani, B.G.; Schiffman, S.S.; Nagle, H.T. Performance of the Levenberg—Marquardt neural network training method in electronic nose applications. Sens. Actuators B Chem. 2005, 110, 13–22. [Google Scholar] [CrossRef]
  63. Branke, J.; Deb, K.; Miettinen, K.; Slowiński, R. Multiobjective Optimization—Interactive and Evolutionary Approaches, 1st ed.; Springer: Berlin/Heidelberg, Germany, 2008. [Google Scholar]
  64. Andradóttir, S. A review of simulation optimization techniques. In Proceedings of the 1998 Winter Simulation Conference (Cat. No. 98CH36274), Washington, DC, USA, 13–16 December 1998; Institute of Electrical and Electronics Engineers (IEEE): Piscataway, NJ, USA, 2002; Volume 1, pp. 151–158. [Google Scholar]
  65. Luenberger, D.G.; Ye, Y. Linear and Nonlinear Programming; Springer Science and Business Media LLC: Berlin/Heidelberg, Germany, 2008. [Google Scholar]
  66. Islam, M.; Buijk, A.; Rais-Rohani, M.; Motoyama, K. Simulation-based numerical optimization of arc welding process for reduced distortion in welded structures. Finite Elem. Anal. Des. 2014, 84, 54–64. [Google Scholar] [CrossRef]
  67. Zitzler, E.; Deb, K.; Thiele, L. Comparison of Multiobjective Evolutionary Algorithms: Empirical Results. Evol. Comput. 2000, 8, 173–195. [Google Scholar] [CrossRef] [PubMed] [Green Version]
  68. Fazilati, J.; Alisadeghi, M. Multiobjective crashworthiness optimization of multi-layer honeycomb energy absorber panels under axial impact. Thin Walled Struct. 2016, 107, 197–206. [Google Scholar] [CrossRef]
  69. Sakawa, M. Genetic Algorithms and Fuzzy Multiobjective Optimization; Springer Science and Business Media LLC: Berlin/Heidelberg, Germany, 2002. [Google Scholar]
  70. Rudd, C.D. Composites for Automotive Applications, 11th ed.; Rapra Technology Ltd.: Shawbury, UK, 2000. [Google Scholar]
  71. Trauth, A.; Pinter, P.; Weidenmann, K.A. Investigation of Quasi-Static and Dynamic Material Properties of a Structural Sheet Molding Compound Combined with Acoustic Emission Damage Analysis. J. Compos. Sci. 2017, 1, 18. [Google Scholar] [CrossRef] [Green Version]
  72. Katz, A.; Sankaran, V. Mesh quality effects on the accuracy of CFD solutions on unstructured meshes. J. Comput. Phys. 2011, 230, 7670–7686. [Google Scholar] [CrossRef]
  73. Bendsoe, M.P.; Kikuchi, N. Generating optimal topologies in structural design using a homogenization method. Comput. Methods Appl. Mech. Eng. 1988, 71, 197–224. [Google Scholar] [CrossRef]
Figure 1. Minimisation of the plate’s maximum absolute deflection: Plate geometry, boundary conditions, and applied load (a). Discretisation of plate geometry with 1200 S3 elements (b).
Jcs 04 00122 g001
Figure 2. Geometries of preform samples used in feed forward NN (FF-NN) training. Preform resulting in the lowest maximum absolute deflection of the sample set is outlined.
Jcs 04 00122 g002
Figure 3. Shear rate and temperature-dependent viscosity [59].
Jcs 04 00122 g003
Figure 4. Preform geometries used in initial metamodel validation: validation geometry 1 (a), validation geometry 2 (b), validation geometry 3 (c).
Jcs 04 00122 g004
Figure 5. Exemplary deflection result of structural simulation. In this case, the maximum absolute deflection Dz is 89.89 mm.
Jcs 04 00122 g005
Figure 6. Flow chart of the optimisation procedure.
Jcs 04 00122 g006
Figure 7. Comparison of plate deflections for the three preform validation geometries obtained by the metamodel and FEM.
Jcs 04 00122 g007
Figure 8. Comparison of fibre orientation in the x-direction for the three preform validation geometries obtained by process simulation. (a) = Validation geometry 1; (b) = Validation geometry 2; (c) = Validation geometry 3.
Jcs 04 00122 g008
Figure 9. Initial starting elements (left) and resulting optimised preform geometries (right) of the performed optimisations. (a) Starting element 1, (b) Starting element 2, (c) Starting element 3, (d) Starting element 4, and (e) Starting element 5.
Jcs 04 00122 g009
Figure 10. Convergence of objective function (maximum plate deflection in z-direction) during preform optimisation.
Jcs 04 00122 g010
Figure 11. Comparison of deflections obtained by metamodel and FEM for optimised preforms.
Jcs 04 00122 g011
Table 1. Material parameters of SMC0400 [59].
ParameterValues
Thermal conductivity0.555 W/(mK)
Heat transfer coefficient (Tool/SMC)2000 W/(m2K)
Fibre weight fraction30%
Fibre interaction coefficient CI0.070
Elastic modulus fibre73,000 N/mm2
Elastic modulus matrix6250 N/mm2
Poisson ratio fibre0.220
Poisson ratio matrix0.250
Fibre aspect ratio (length/diameter)3000
Initial fibre orientationisotropic
Table 2. Process settings [59]. SMC: Sheet Moulding Compounds.
ParameterValues
Initial SMC temperature30 °C
Temperature upper mould cavity150 °C
Temperature lower mould cavity145 °C
Delay time45 s
Initial compression speed10 mm/s
Max. compression force1000 kN
Table 3. Architecture of the neural networks (NN) and training parameters.
VariableValue
Inputs1200 (binary initial filling states of each element. 1: completely filled and 0: empty)
Outputs1 (maximum absolute deflection under static load in mm)
Hidden layers1
Neurons in hidden layer6
Connection typeFully connected
Training typeLevenberg–Marquardt
Transfer function input layer to hidden layerHyperbolic tangent sigmoid
Transfer function hidden layer to outputLinear
Loss functionMean squared error
Training epochs (maximum)1000
Drop-outnone
Table 4. Description of the design variables.
Design VariableDefinitionUnitLower BoundUpper Bound
x1Initial filling state of element 1-01
x2Initial filling state of element 2-01
x1,200Initial filling state of element 1200-01
Table 5. Mutation procedures conducted in each optimisation iteration.
Mutation ProcedureRelative Area ChangeChange Direction
1Increase by R ElementsPositive x-direction
2Increase by R ElementsNegative x-direction
3Increase by R ElementsPositive y-direction
4Increase by R ElementsNegative y-direction
5Decrease by R ElementsPositive x-direction
6Decrease by R ElementsNegative x-direction
7Decrease by R ElementsPositive y-direction
8Decrease by R ElementsNegative y-direction

