Effect of Graphene Additive on Flexural and Interlaminar Shear Strength Properties of Carbon Fiber-Reinforced Polymer Composite

 and
and
Abstract
:1. Introduction
2. Materials and Methods
2.1. Graphene-Epoxy Mixing Process
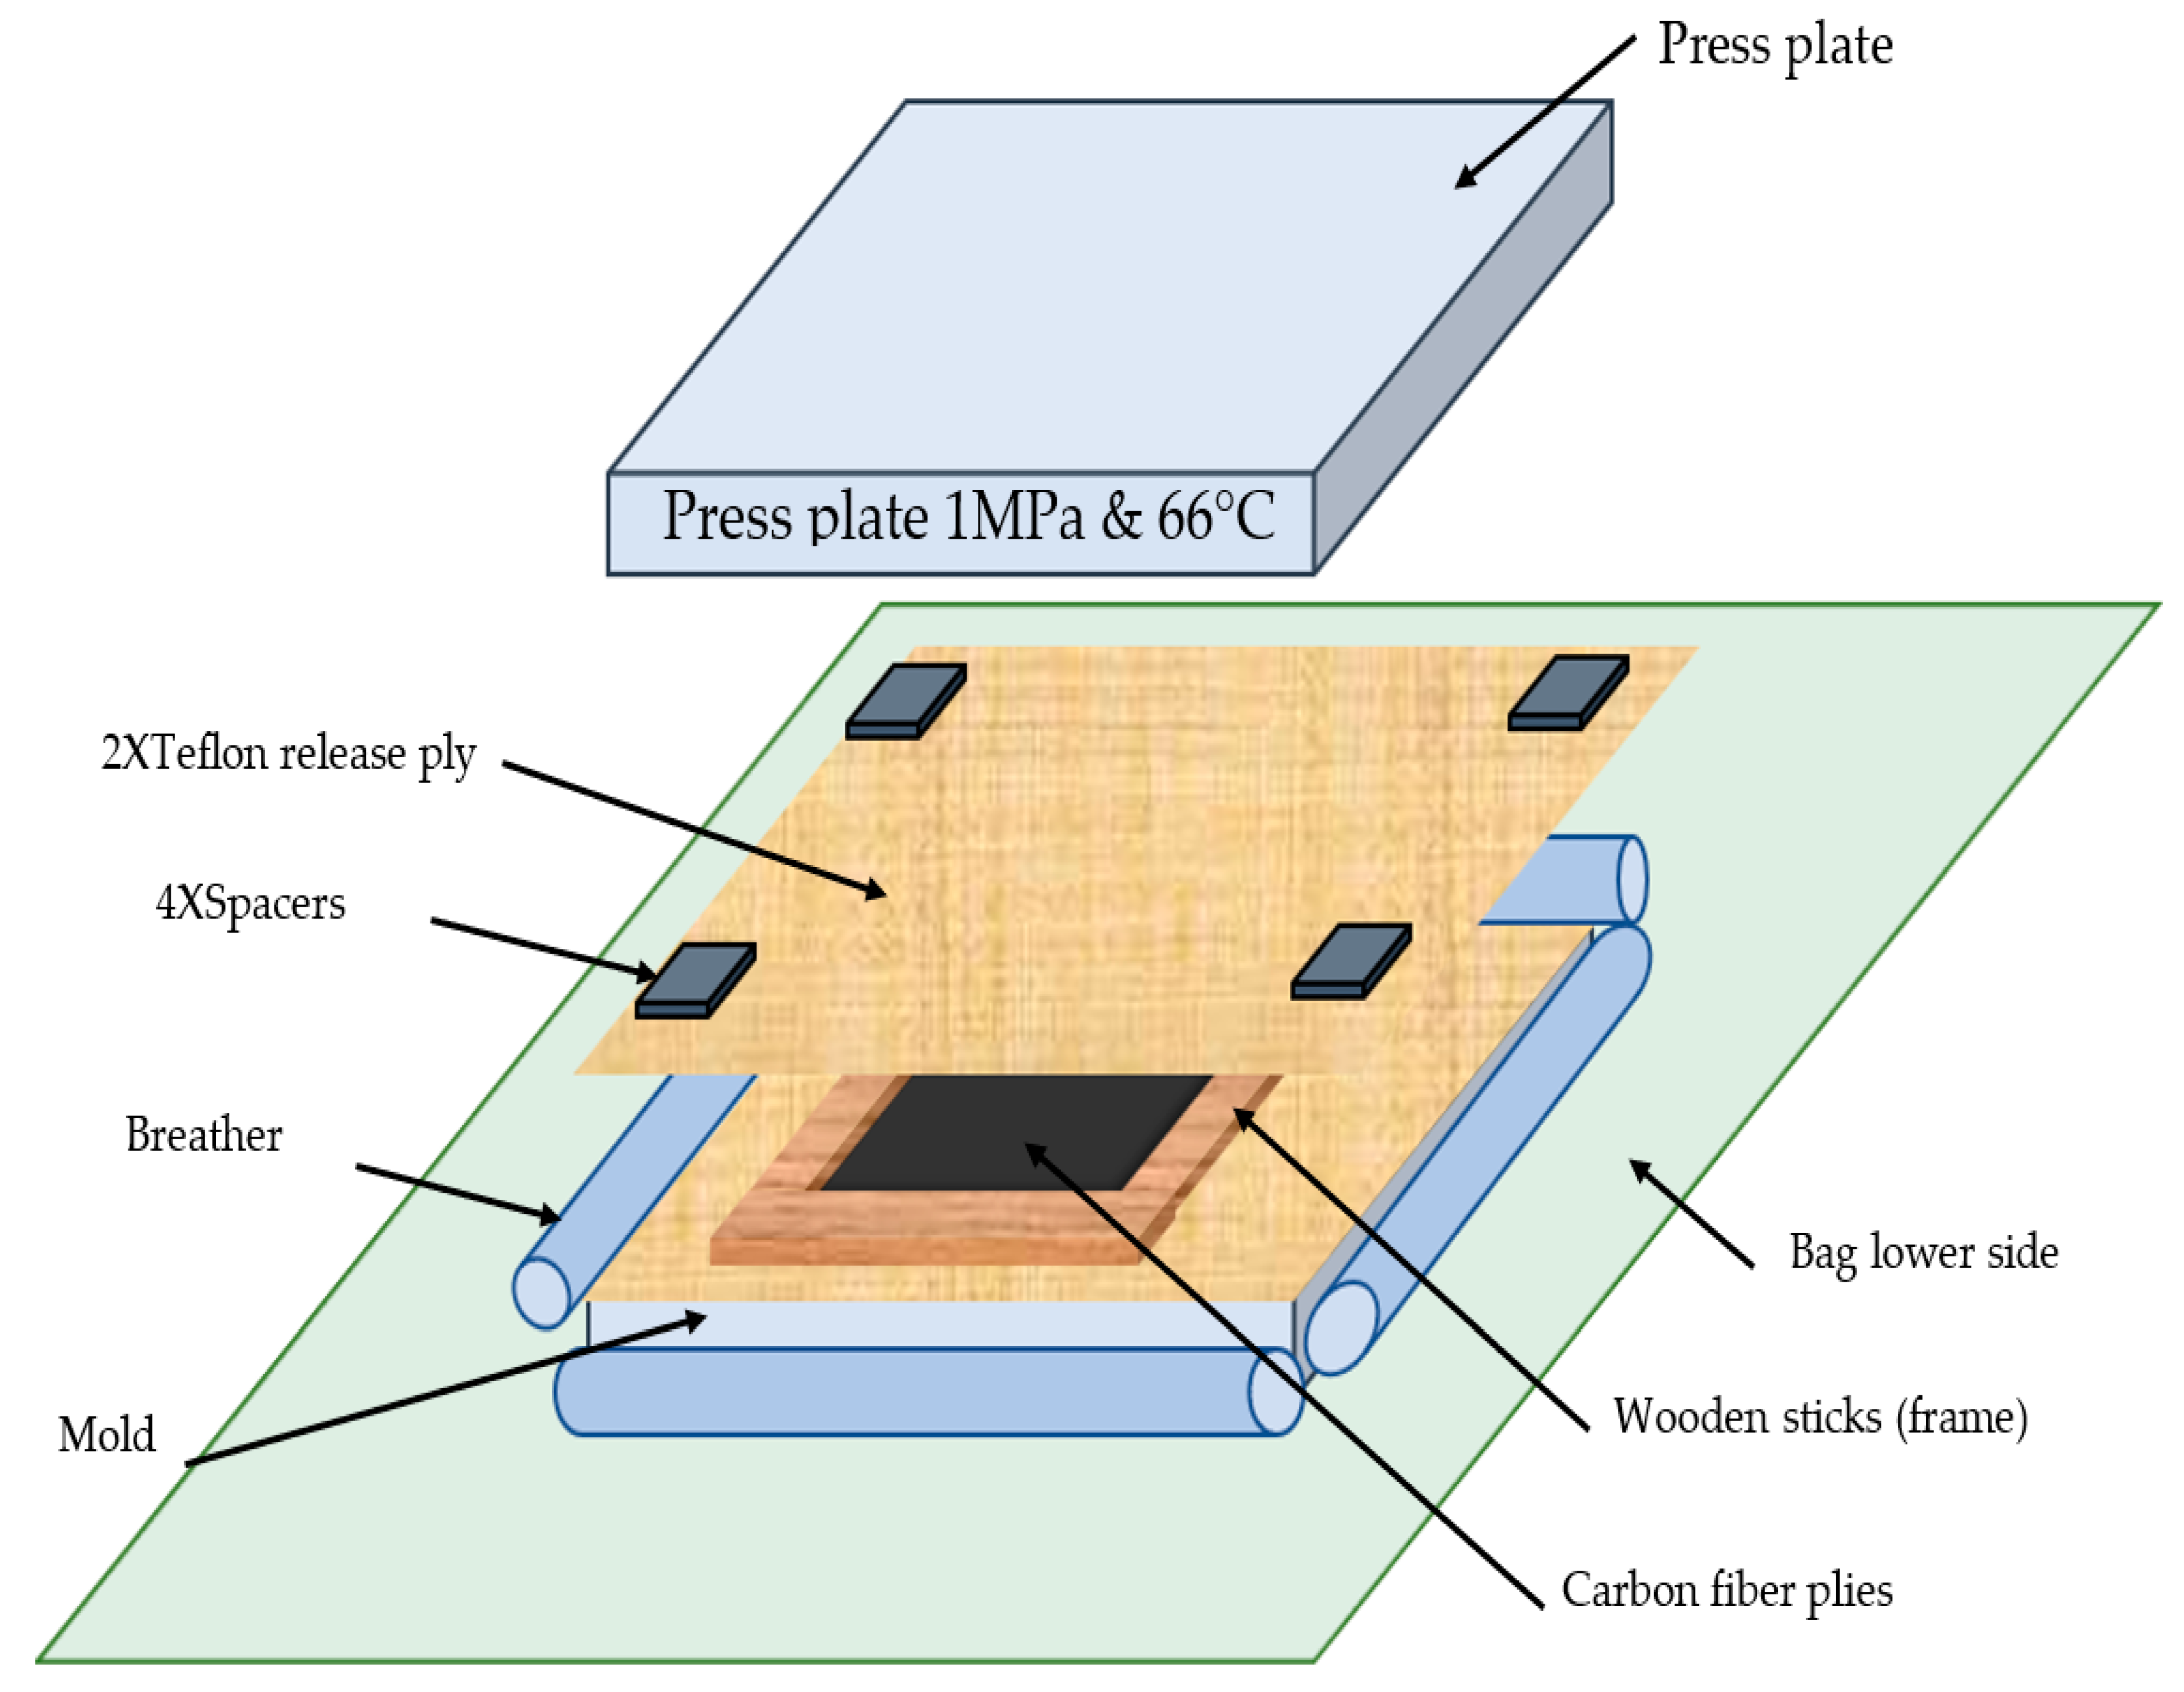
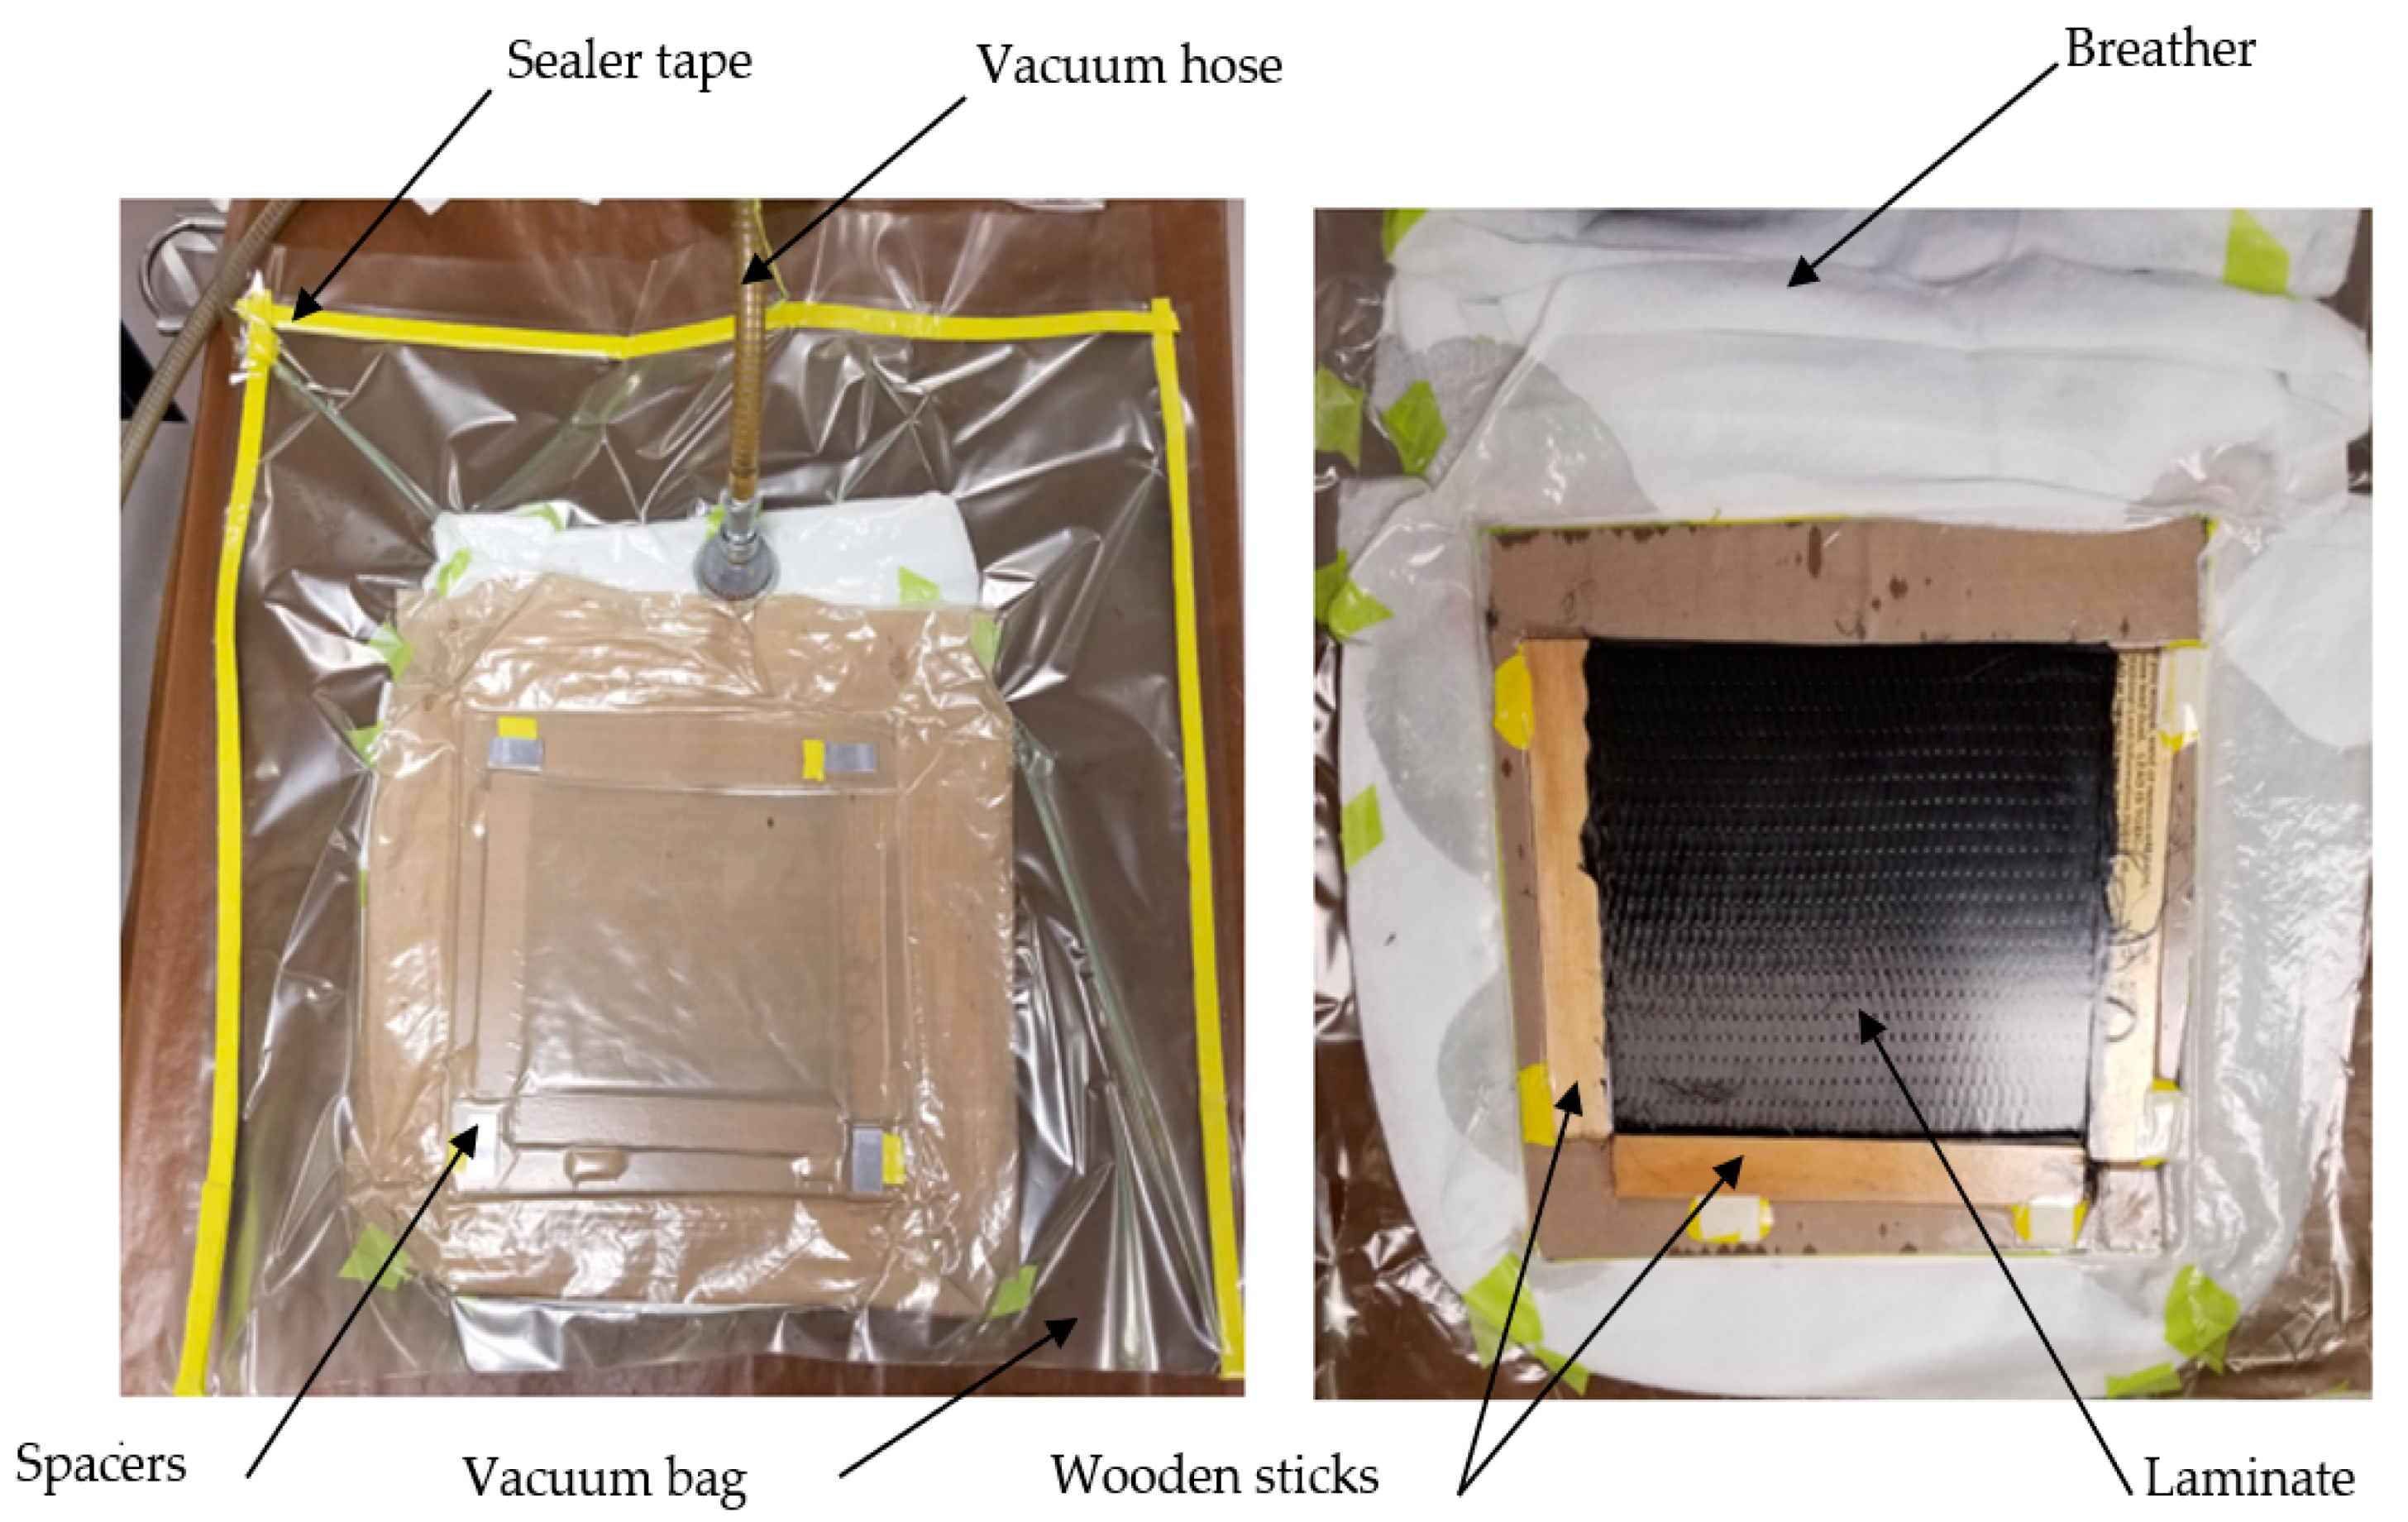
2.2. Laminate Manufacturing
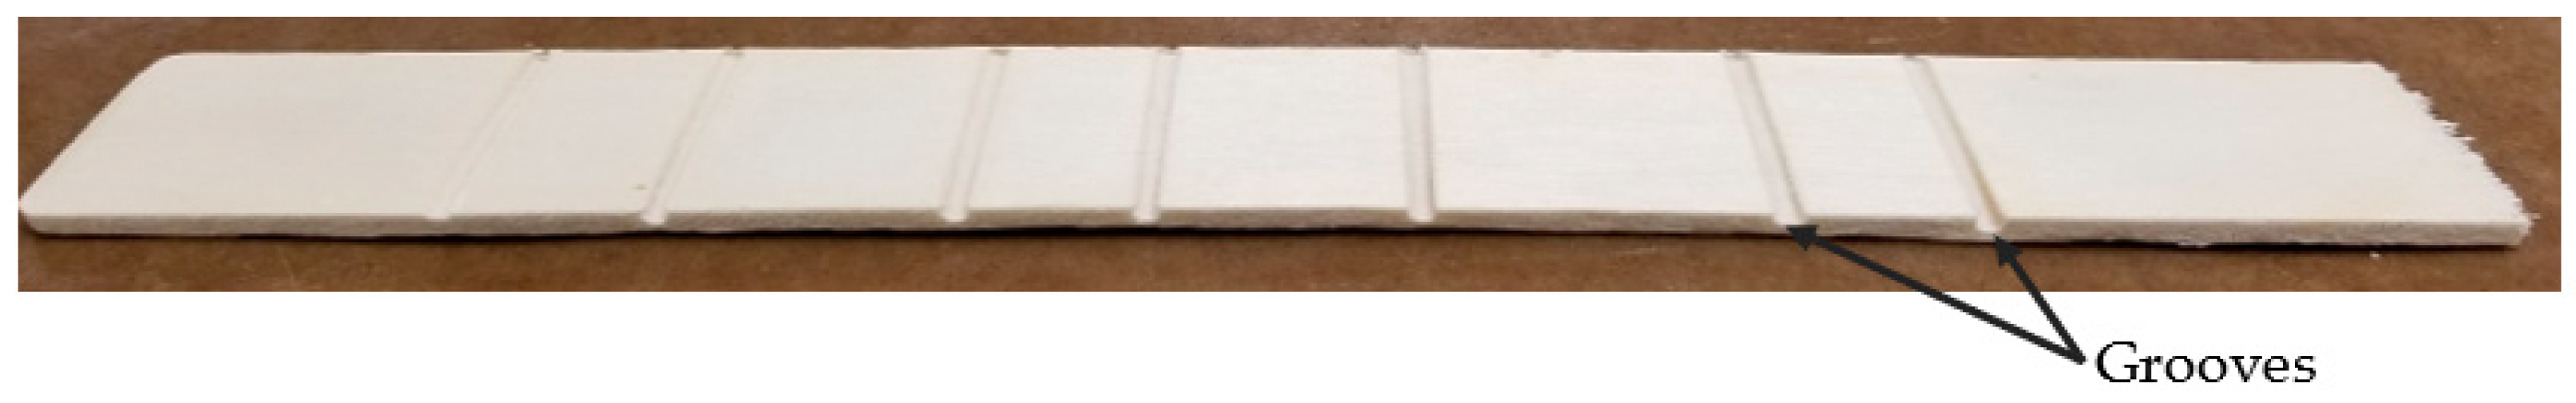
2.3. Mechanical Test
3. Results and Discussion
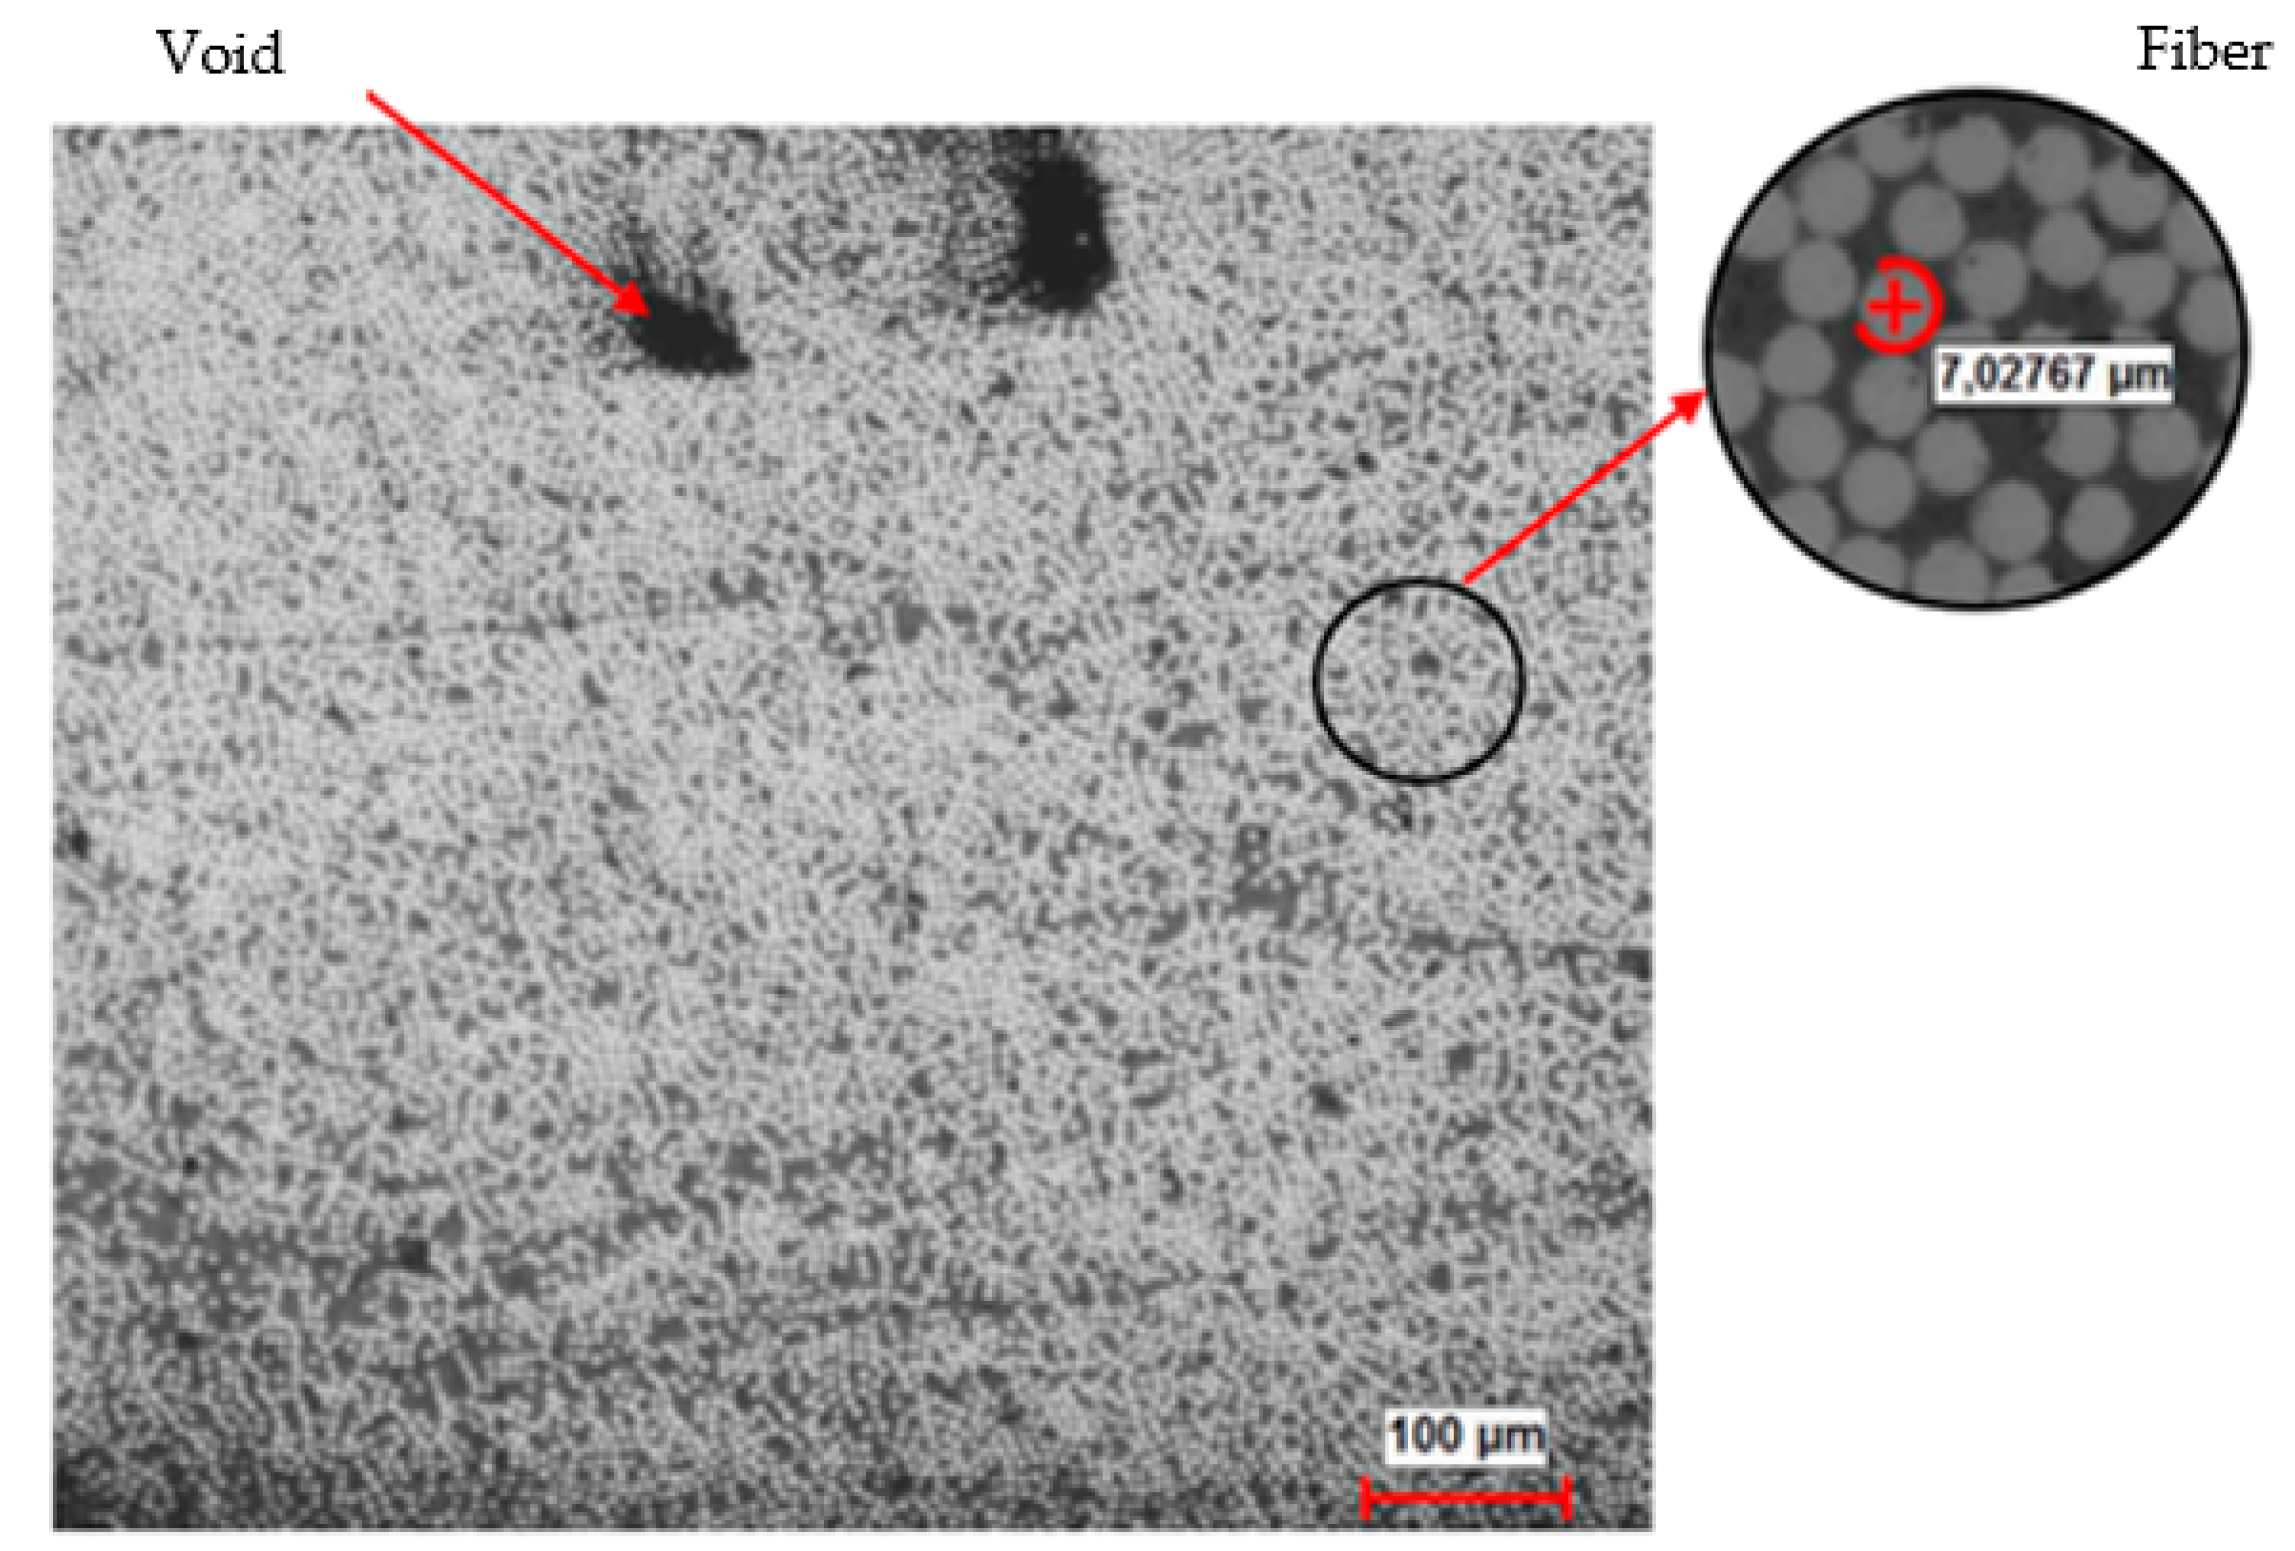
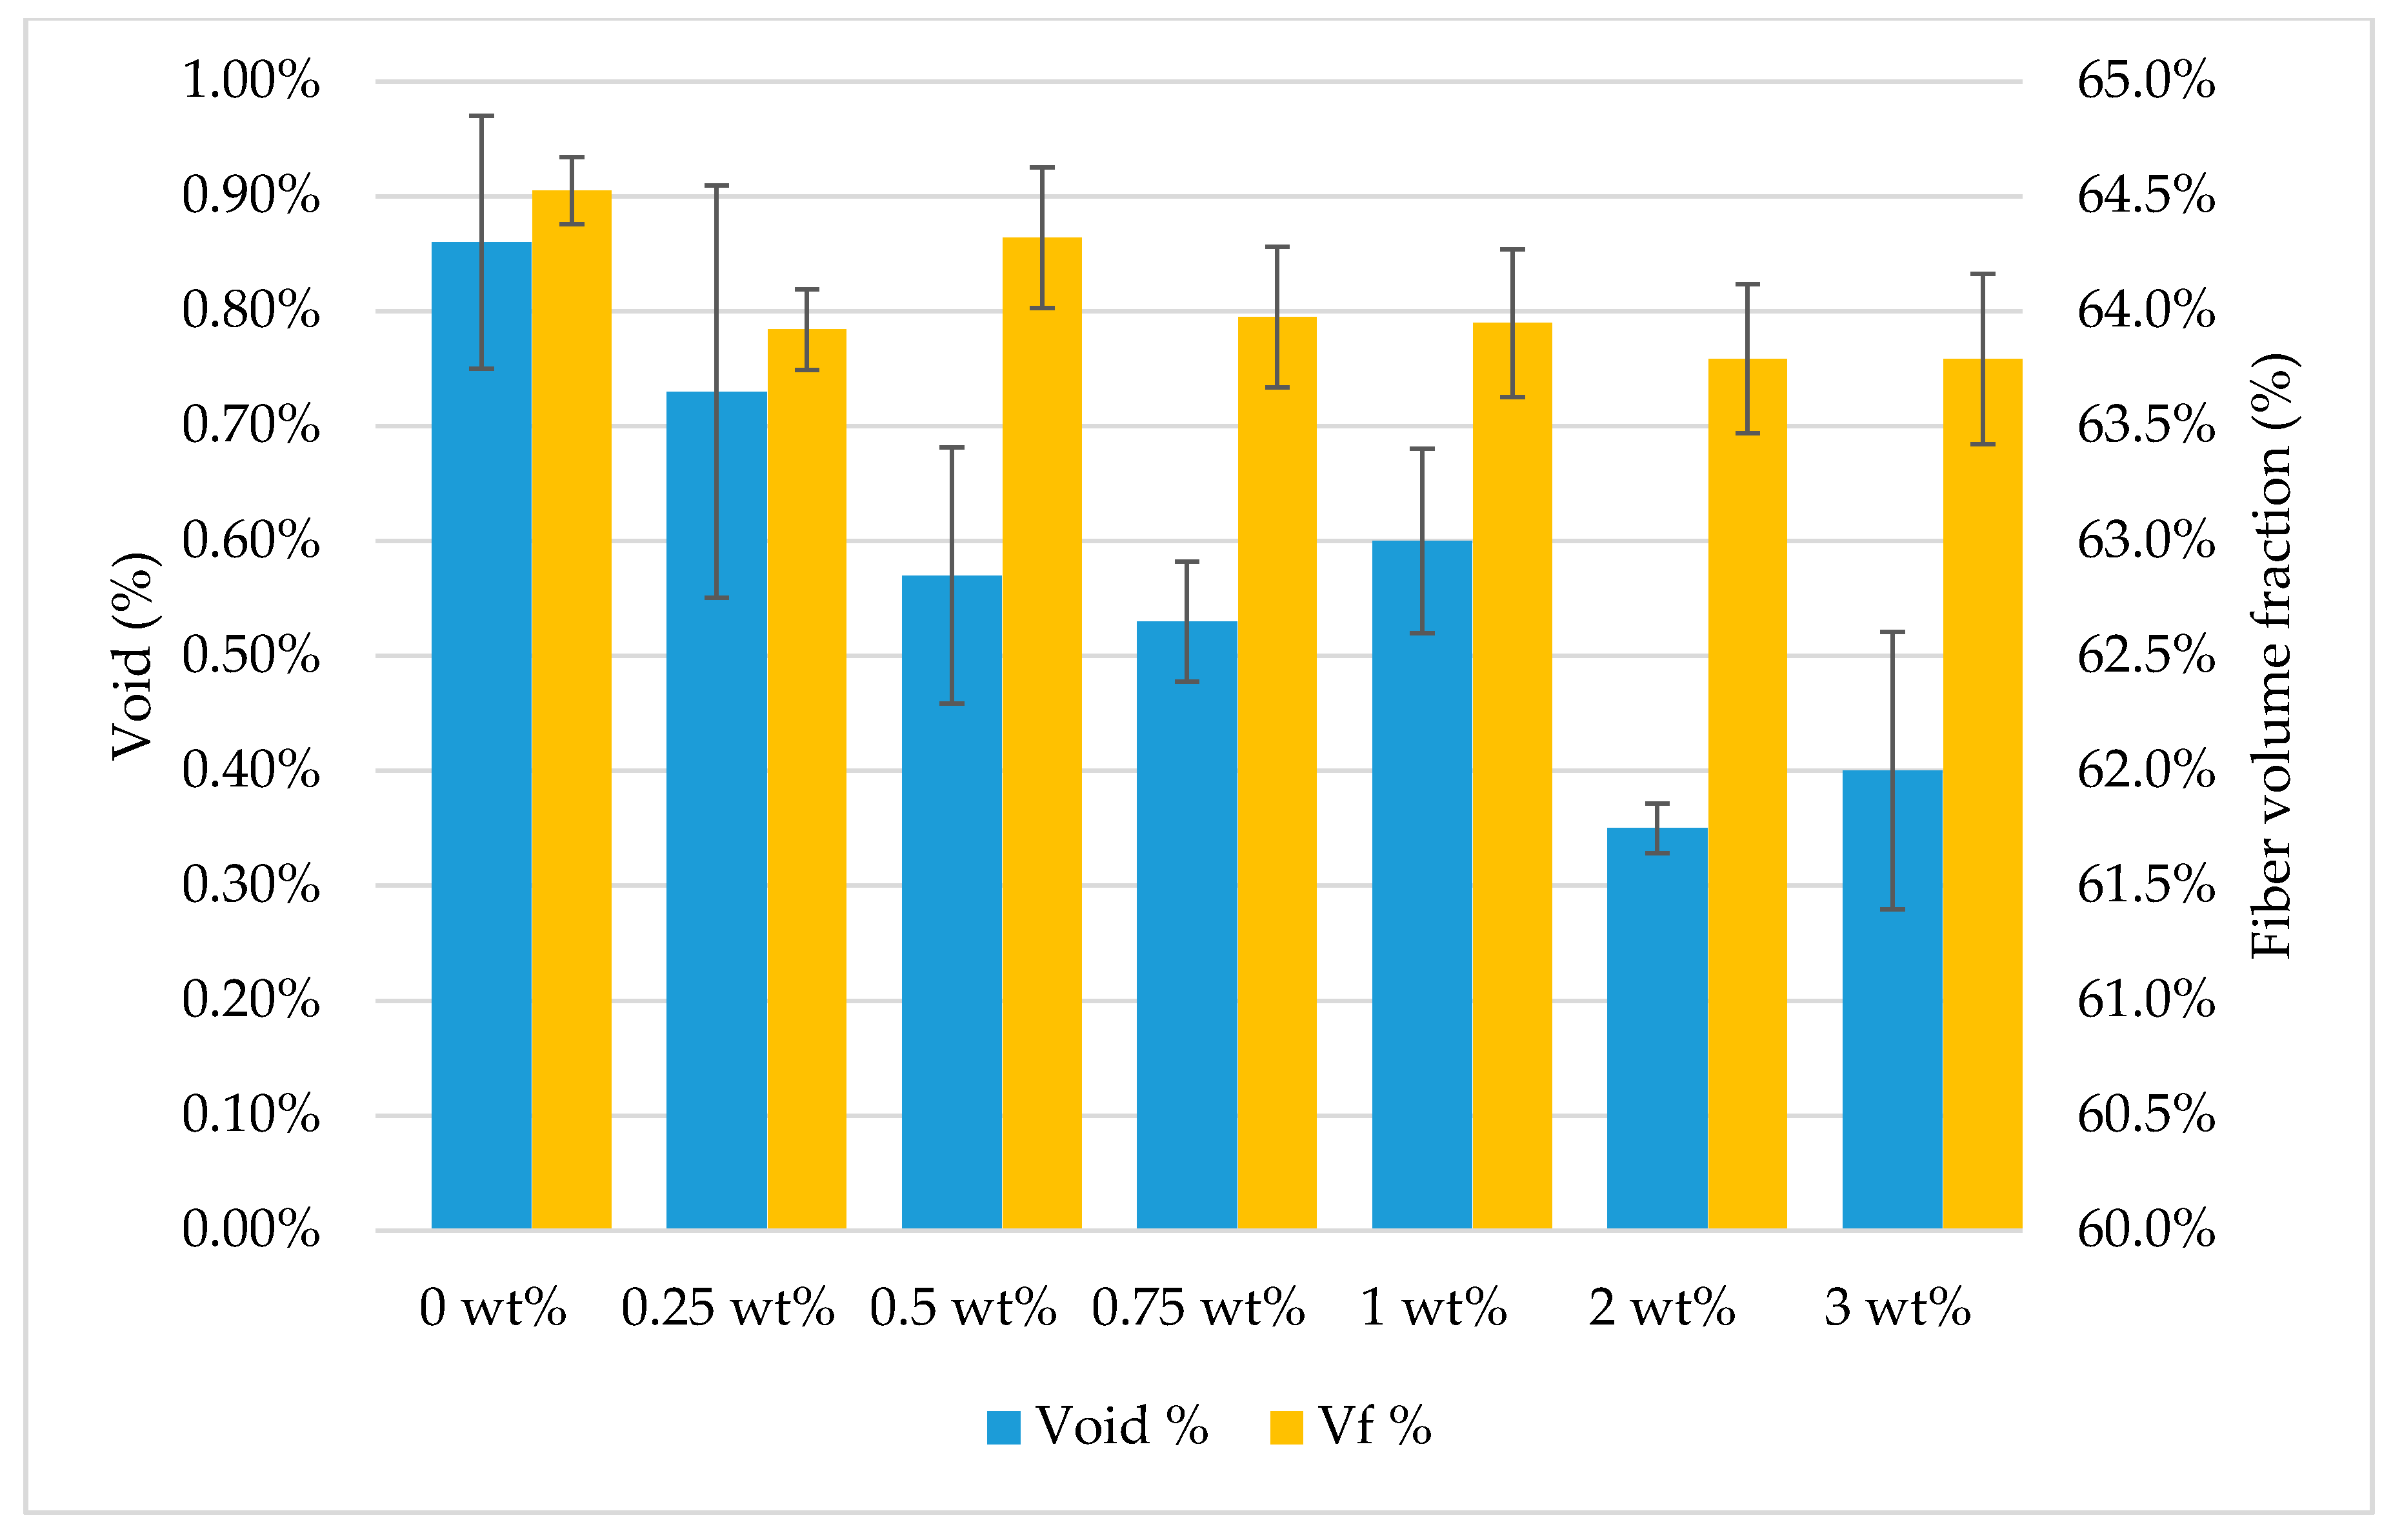
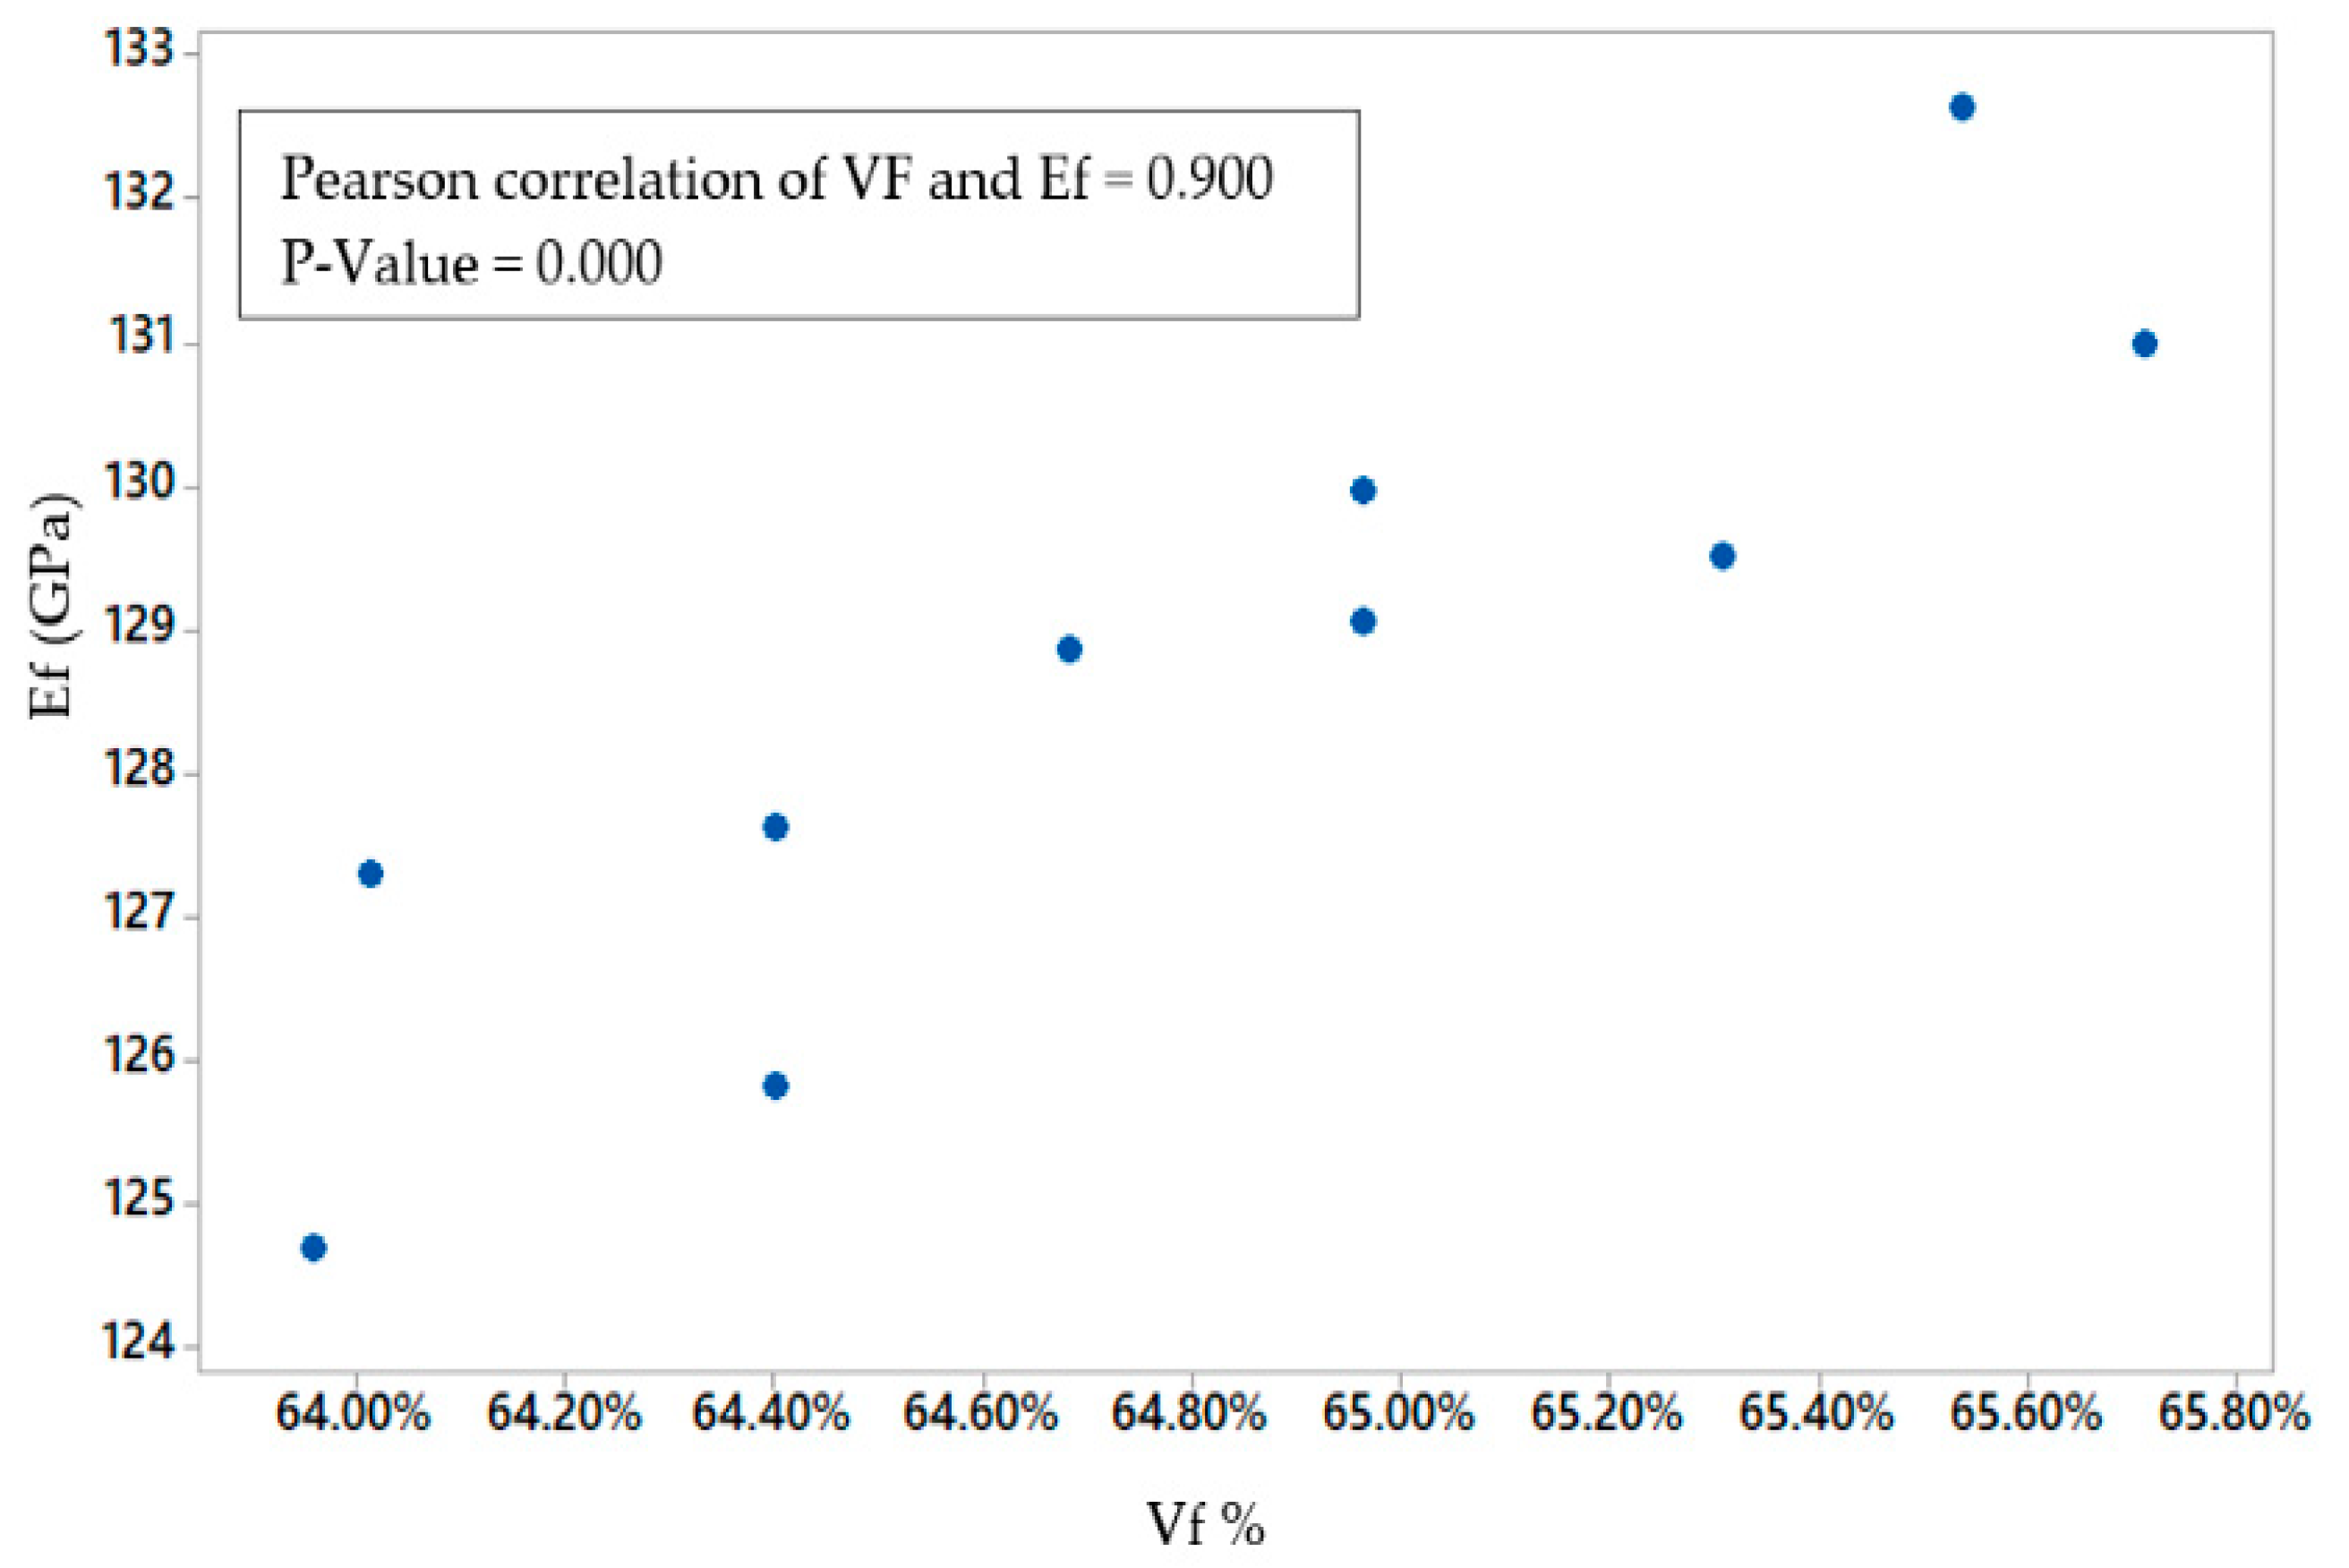
3.1. Fiber Volume Fraction
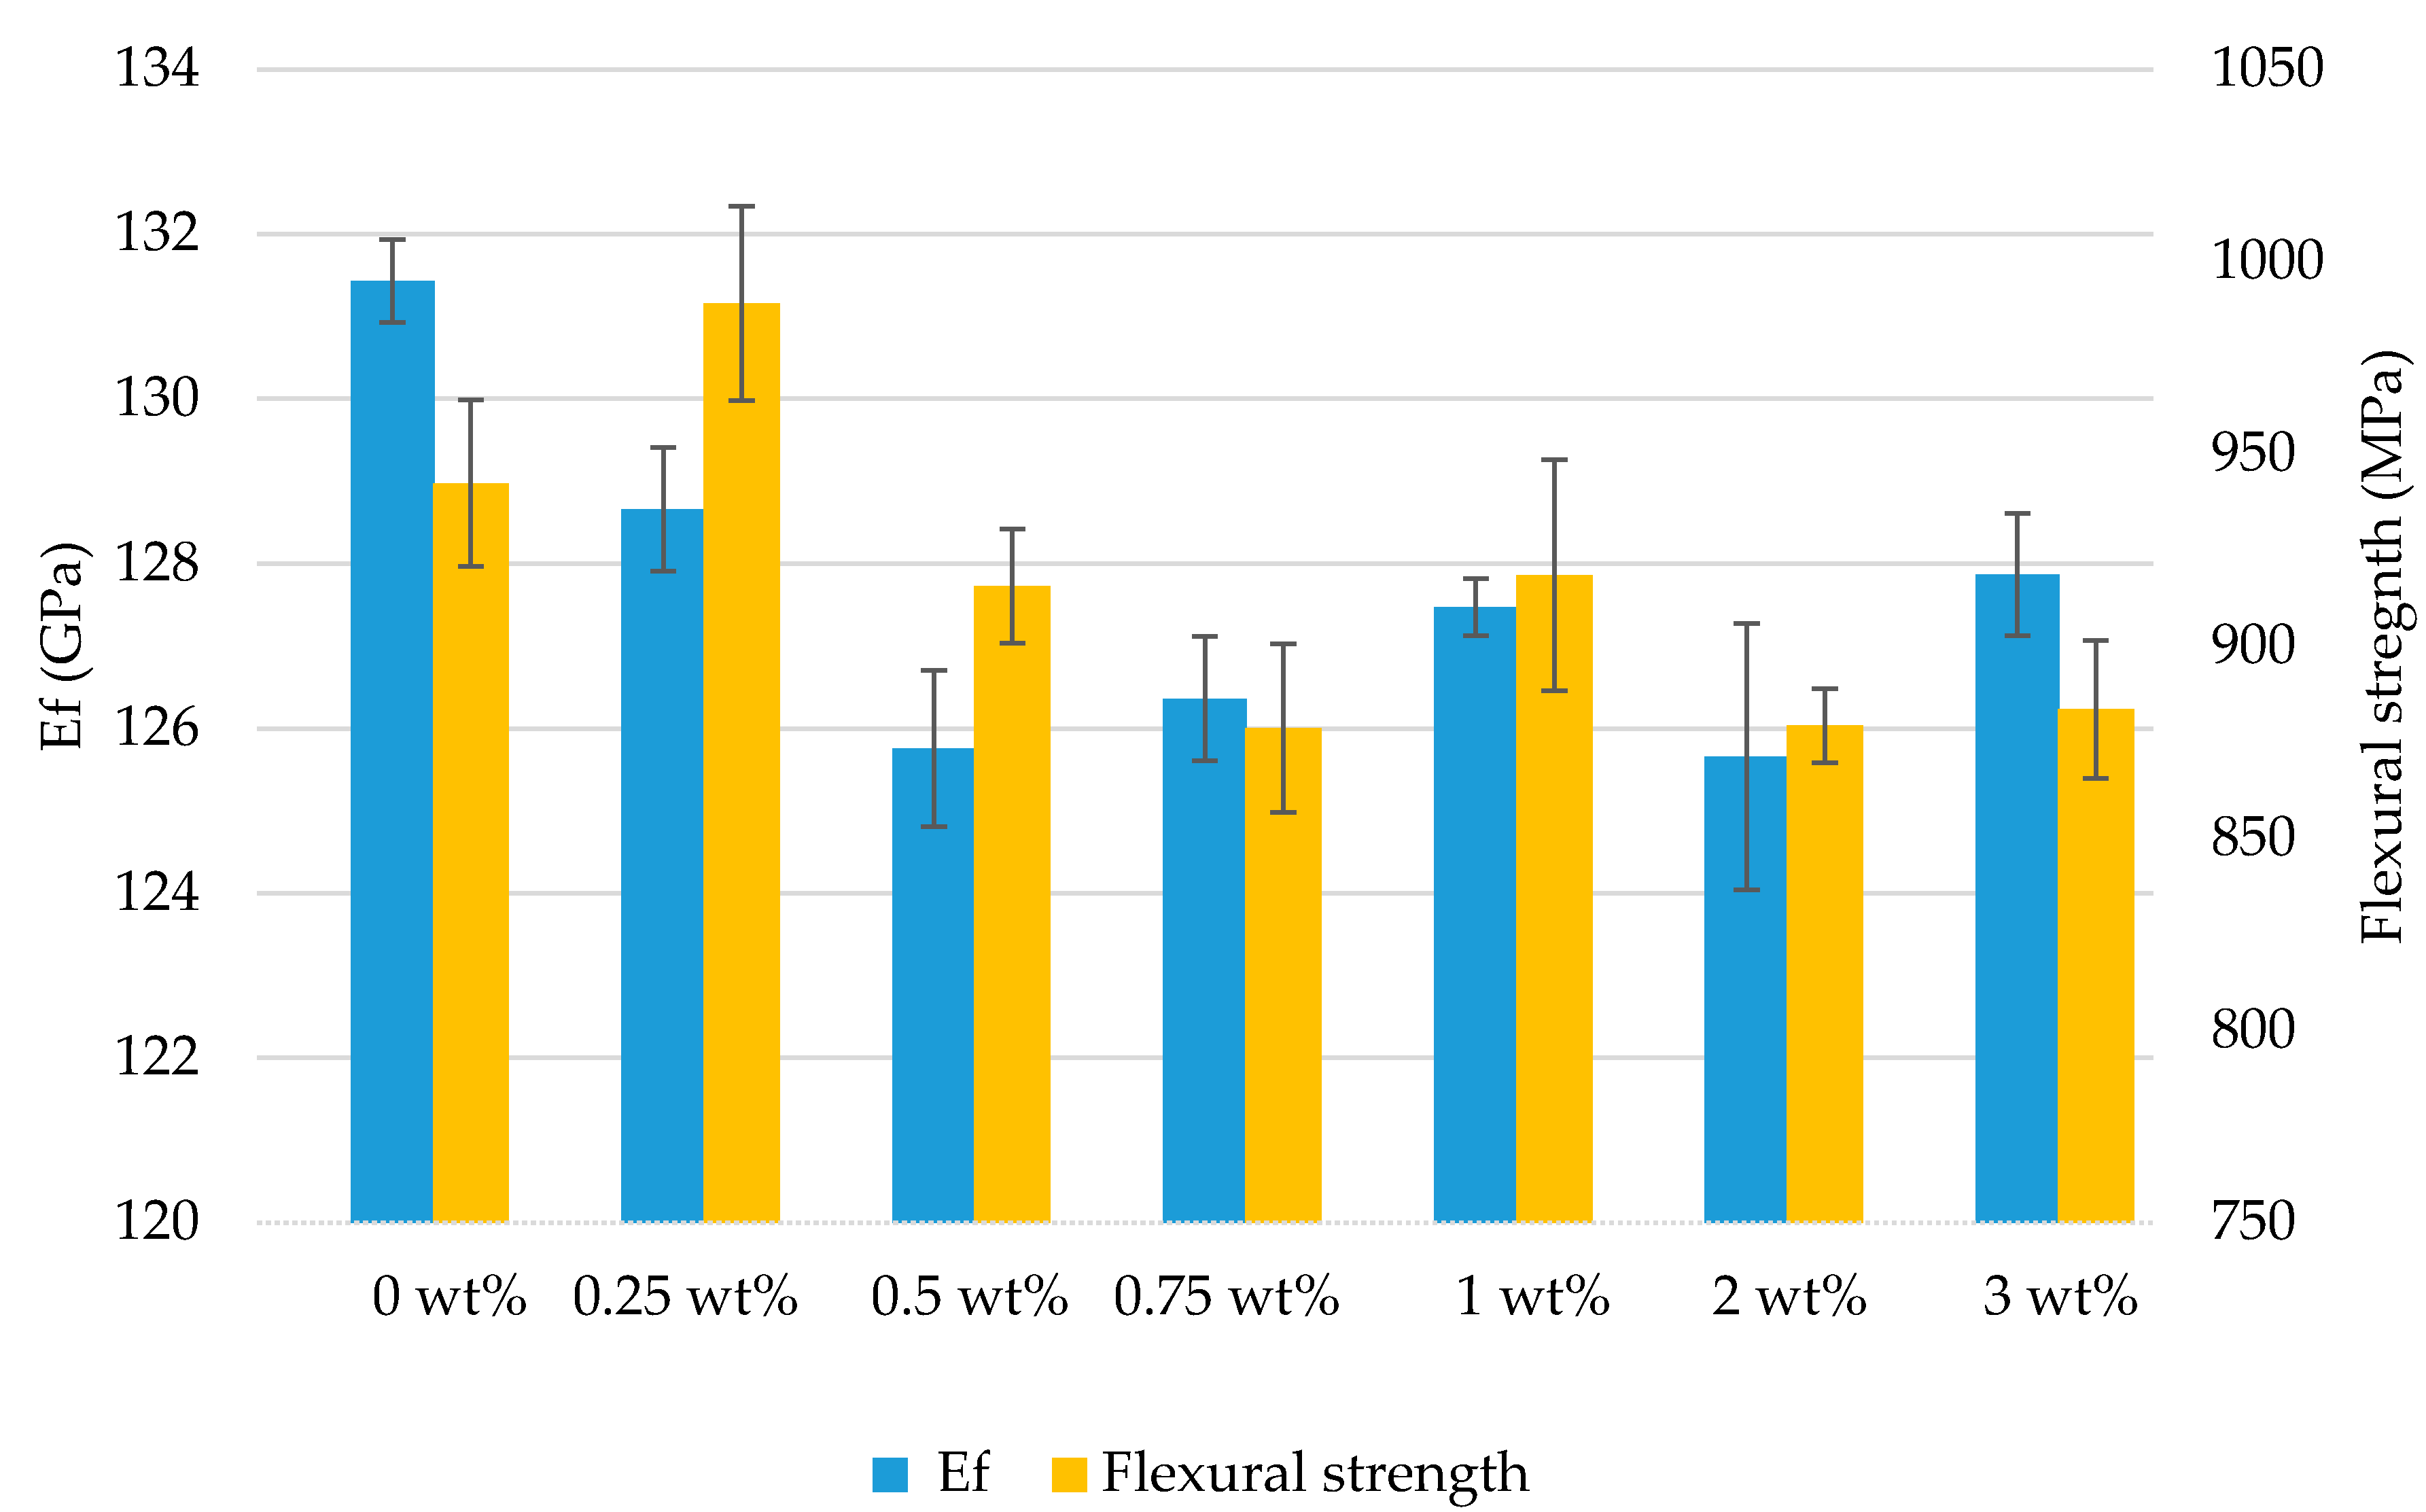
3.2. Mechanical Test
4. Conclusions
Author Contributions
Funding
Acknowledgments
Conflicts of Interest
References
- Othman, R.; Ismail, N.I.; Basri, H.M.; Sharudin, H.; Hemdi, A.R. Application of carbon fiber reinforced plastics in automotive industry: A review. J. Mech. Manuf. 2018, 1, 12. [Google Scholar]
- Zhang, J.Z. Study on Carbon Fiber Composite Materials in Sports Equipment. Appl. Mech. Mater. 2013, 329, 105–108. [Google Scholar] [CrossRef]
- Breuer, U.P. Commercial Aircraft Composite Technology; Springer International Publishing: Cham, Switzerland, 2016. [Google Scholar]
- Bouvet, C. Mechanics of Aeronautical Composite Materials; ISTE Ltd./John Wiley and Sons Inc.: Hoboken, NJ, USA, 2017; ISBN 978-1-78630-114-7. [Google Scholar]
- Budynas, R.G.; Nisbett, J.K. Shigley’s Mechanical Engineering Design, 9th ed.; McGraw-Hill: New York, NY, USA, 2011; ISBN 978-0-07-352928-8. [Google Scholar]
- Shesan, O.J.; Stephen, A.C.; Chioma, A.G.; Neerish, R.; Rotimi, S.E. Fiber-Matrix Relationship for Composites Preparation. In Renewable and Sustainable Composites; Pereira, A.B., Fernandes, F.A.O., Eds.; IntechOpen: Rijeka, Croatia, 2019. [Google Scholar]
- Liu, X.; Chen, F. A Review of Void Formation and its Effects on the Mechanical Performance of Carbon Fiber Reinforced Plastic. Eng. Trans. 2016, 64, 33–51. [Google Scholar]
- Pathak, A.K.; Borah, M.; Gupta, A.; Yokozeki, T.; Dhakate, S. Improved mechanical properties of carbon fiber/graphene oxide-epoxy hybrid composites. Compos. Sci. Technol. 2016, 135, 28–38. [Google Scholar] [CrossRef]
- Qin, W.; Vautard, F.; Drzal, L.T.; Yu, J. Mechanical and electrical properties of carbon fiber composites with incorporation of graphene nanoplatelets at the fiber–matrix interphase. Compos. Part B Eng. 2015, 69, 335–341. [Google Scholar] [CrossRef]
- Novoselov, K.S.; Geim, A.K.; Morozov, S.V.; Jiang, D.; Zhang, Y.; Dubonos, S.V.; Grigorieva, I.V.; Firsov, A.A. Electric Field Effect in Atomically Thin Carbon Films. Science 2004, 306, 666–669. [Google Scholar] [CrossRef] [PubMed] [Green Version]
- Kim, H.; Abdala, A.A.; Macosko, C.W. Graphene/Polymer Nanocomposites. Macromolecules 2010, 43, 6515–6530. [Google Scholar] [CrossRef]
- Stankovich, S.; Dikin, D.A.; Dommett, G.H.B.; Kohlhaas, K.M.; Zimney, E.J.; Stach, E.A.; Piner, R.D.; Nguyen, S.T.; Ruoff, R.S. Graphene-based composite materials. Nat. Cell Biol. 2006, 442, 282–286. [Google Scholar] [CrossRef]
- Balandin, A.A.; Ghosh, S.; Bao, W.; Calizo, I.; Teweldebrhan, D.; Miao, F.; Lau, C.N. Superior Thermal Conductivity of Single-Layer Graphene. Nano Lett. 2008, 8, 902–907. [Google Scholar] [CrossRef]
- Lee, C.; Wei, X.; Kysar, J.W.; Hone, J. Measurement of the Elastic Properties and Intrinsic Strength of Monolayer Graphene. Science 2008, 321, 385–388. [Google Scholar] [CrossRef]
- Yang, W.; Zhao, Q.; Xin, L.; Qiao, J.; Zou, J.; Shao, P.; Yu, Z.; Zhang, Q.; Wu, G. Microstructure and mechanical properties of graphene nanoplates reinforced pure Al matrix composites prepared by pressure infiltration method. J. Alloys Compd. 2018, 732, 748–758. [Google Scholar] [CrossRef]
- Stoller, M.D.; Park, S.; Zhu, Y.; An, J.; Ruoff, R.S. Graphene-Based Ultracapacitors. Nano Lett. 2008, 8, 3498–3502. [Google Scholar] [CrossRef] [PubMed]
- Nazarpour, S.; Waite, S.R. (Eds.) Graphene Technology: From Laboratory to Fabrication; Wiley-VCH Verlag GmbH & Co. KGaA: Weinheim, Germany, 2016. [Google Scholar]
- Chen, G.-H.; Wu, D.-J.; Weng, W.-G.; Yan, W.-L. Preparation of polymer/graphite conducting nanocomposite by intercalation polymerization. J. Appl. Polym. Sci. 2001, 82, 2506–2513. [Google Scholar] [CrossRef]
- Giannelis, E.P. Polymer Layered Silicate Nanocomposites. Adv. Mater. 1996, 8, 29–35. [Google Scholar] [CrossRef]
- Sandler, J.; Pegel, S.; Cadek, M.; Gojny, F.; Van Es, M.; Lohmar, J.; Blau, W.; Schulte, K.; Windle, A.; Shaffer, M.S.P. A comparative study of melt spun polyamide-12 fibres reinforced with carbon nanotubes and nanofibres. Polymer 2004, 45, 2001–2015. [Google Scholar] [CrossRef]
- Rafiee, M.A.; Rafiee, J.; Wang, Z.; Song, H.; Yu, Z.-Z.; Koratkar, N. Enhanced Mechanical Properties of Nanocomposites at Low Graphene Content. ACS Nano 2009, 3, 3884–3890. [Google Scholar] [CrossRef]
- Al Imran, K. Enhancement of Electrical Conductivity of Carbon/Epoxy Composites by Graphene and Assessment of Thermal and Mechanical Properties. Ph.D. Thesis, North Carolina A&T State University, Greensboro, NC, USA, 2016. [Google Scholar]
- Han, X.; Zhao, Y.; Sun, J.; Li, Y.; Zhang, J.; Hao, Y. Effect of graphene oxide addition on the interlaminar shear property of carbon fiber-reinforced epoxy composites. New Carbon Mater. 2017, 32, 48–55. [Google Scholar] [CrossRef]
- Kamar, N.T.; Hossain, M.M.; Khomenko, A.; Haq, M.; Drzal, L.T.; Loos, A. Interlaminar reinforcement of glass fiber/epoxy composites with graphene nanoplatelets. Compos. Part A Appl. Sci. Manuf. 2015, 70, 82–92. [Google Scholar] [CrossRef]
- Tang, L.-C.; Wan, Y.-J.; Yan, D.; Pei, Y.-B.; Zhao, L.; Li, Y.-B.; Wu, L.-B.; Jiang, J.-X.; Lai, G.-Q. The effect of graphene dispersion on the mechanical properties of graphene/epoxy composites. Carbon 2013, 60, 16–27. [Google Scholar] [CrossRef]
- Raza, M.; Westwood, A.; Stirling, C. Effect of processing technique on the transport and mechanical properties of graphite nanoplatelet/rubbery epoxy composites for thermal interface applications. Mater. Chem. Phys. 2012, 132, 63–73. [Google Scholar] [CrossRef]
- Chandrasekaran, S.; Seidel, C.; Schulte, K. Preparation and characterization of graphite nano-platelet (GNP)/epoxy nano-composite: Mechanical, electrical and thermal properties. Eur. Polym. J. 2013, 49, 3878–3888. [Google Scholar] [CrossRef]
- Mclaughlin, A.M. The Effect of Exfpmoated Graphite on Carbon Fiber Reinforced Composites for Cryogenic Applications. Ph.D. Thesis, University of Massachusetts Lowell, Ann Arbor, MA, USA, 2013. [Google Scholar]
- Mayr, G.; Plank, B.; Sekelja, J.; Hendorfer, G. Active thermography as a quantitative method for non-destructive evaluation of porous carbon fiber reinforced polymers. NDT E Int. 2011, 44, 537–543. [Google Scholar] [CrossRef]
- Chowdhury, F.; Hosur, M.; Jeelani, S. Studies on the flexural and thermomechanical properties of woven carbon/nanoclay-epoxy laminates. Mater. Sci. Eng. A 2006, 421, 298–306. [Google Scholar] [CrossRef]
- El-Ghaoui, K.; Chatelain, J.F.; Ouellet-Plamondon, C.; Mathieu, R. Effects of Nano Organoclay and Wax on the Machining Temperature and Mechanical Properties of Carbon Fiber Reinforced Plastics (CFRP). J. Compos. Sci. 2019, 3, 85. [Google Scholar] [CrossRef] [Green Version]
- Mehdikhani, M.; Gorbatikh, L.; Verpoest, I.; Lomov, S.V. Voids in fiber-reinforced polymer composites: A review on their formation, characteristics, and effects on mechanical performance. J. Compos. Mater. 2018, 53, 1579–1669. [Google Scholar] [CrossRef]
- Kite, A.H.; Hsu, D.K.; Barnard, D.J.; Thompson, D.O.; Chimenti, D.E. Determination of Porosity Content in Composites by Micrograph Image Processing. In AIP Conference Proceedings; American Institute of Physics: Golden, CO, USA, 2008; Volume 975, pp. 942–949. [Google Scholar] [CrossRef]
- Kastner, J.; Plank, B.; Salaberger, D.; Sekelja, J. Defect and Porosity Determination of Fibre Reinforced Polymers by X-ray Computed Tomography. In Proceedings of the 2nd International Symposium on NDT in Aerospace, Hamburg, Germany, 22–24 November 2010; pp. 1–12. [Google Scholar]
- Costa, M.L.; Almeida, S.F.M.; Rezende, M.C. The influence of porosity on the interlaminar shear strength of carbon/epoxy and carbon/bismaleimide fabric laminates. Compos. Sci. Technol. 2001, 61, 2101–2108. [Google Scholar] [CrossRef]
- Hakim, I.; Donaldson, S.L.; Meyendorf, N.; Browning, C. Porosity Effects on Interlaminar Fracture Behavior in Carbon Fiber-Reinforced Polymer Composites. Mater. Sci. Appl. 2017, 8, 170–187. [Google Scholar] [CrossRef] [Green Version]
- Technomic Publishing Company (Ed.) The Composite Materials Handbook: MIL 17, Volume 3: Materials, Usage, Design, and Analysis; Technomic Publ.: Lancaster, UK, 1999. [Google Scholar]
- Hung, P.-Y.; Lau, K.-T.; Qiao, K.; Fox, B.; Hameed, N. Property enhancement of CFRP composites with different graphene oxide employment methods at a cryogenic temperature. Compos. Part A Appl. Sci. Manuf. 2019, 120, 56–63. [Google Scholar] [CrossRef]


| Test Number | Graphene (wt. %) |
|---|---|
| 1 | 0 |
| 2 | 0.25 |
| 3 | 0.50 |
| 4 | 0.75 |
| 5 | 1.00 |
| 6 | 2.00 |
| 7 | 3.00 |
| Time | Speed (RPM) |
|---|---|
| 2 min | 1000 |
| 2 min | 3500 |
| 2 min | 6000 |
| 2 min | 8000 |
| 2 × 3 min | 10,000 |
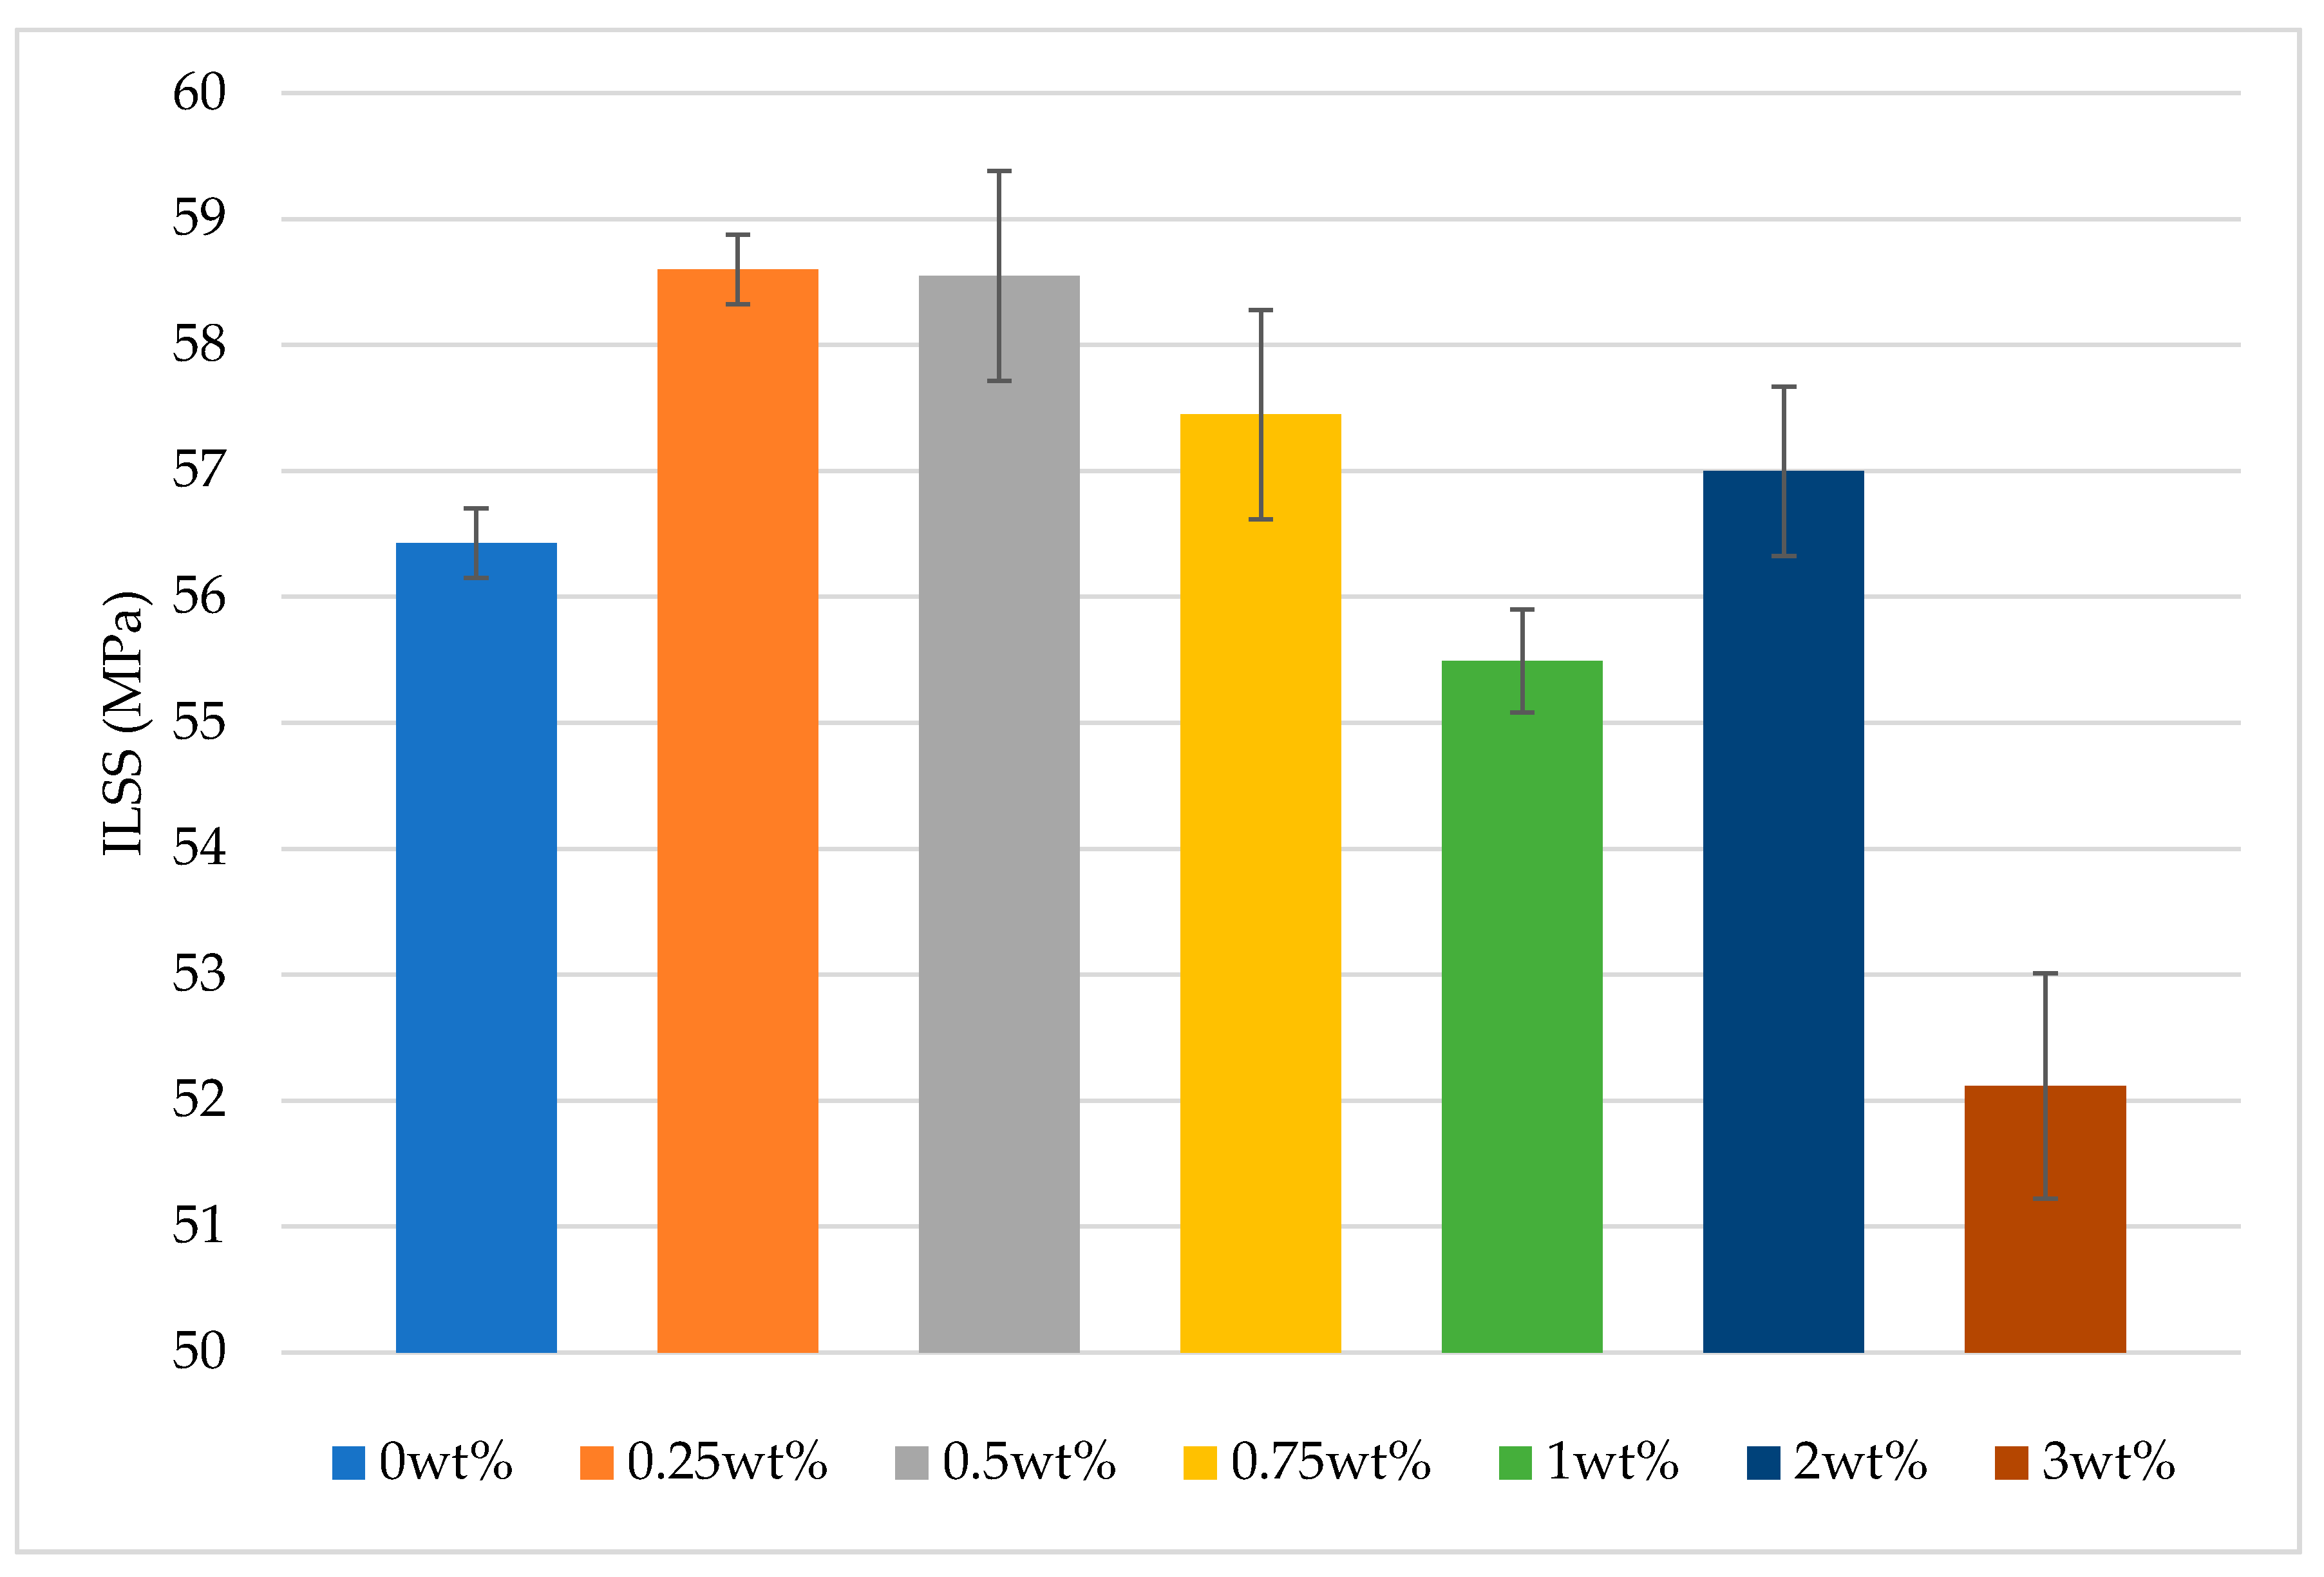
| GnPs wt.% % | Vf % | Void% | Flexural Strength (MPa) | Stiffness (GPa) | ILSS (MPa) |
|---|---|---|---|---|---|
| 0 | 64.5 | 0.86 | 942.3 | 131.4 | 56.4 |
| 0.25 | 63.9 | 0.73 | 989.1 | 128.6 | 58.6 |
| 0.50 | 64.3 | 0.57 | 915.6 | 125.7 | 58.5 |
| 0.75 | 64.0 | 0.53 | 878.7 | 126.3 | 57.4 |
| 1.00 | 63.9 | 0.60 | 918.5 | 127.4 | 55.5 |
| 2.00 | 63.8 | 0.35 | 879.3 | 125.6 | 57 |
| 3.00 | 63.8 | 0.40 | 883.6 | 127.8 | 52.1 |
Publisher’s Note: MDPI stays neutral with regard to jurisdictional claims in published maps and institutional affiliations. |
© 2020 by the authors. Licensee MDPI, Basel, Switzerland. This article is an open access article distributed under the terms and conditions of the Creative Commons Attribution (CC BY) license (http://creativecommons.org/licenses/by/4.0/).
Share and Cite
Ali Charfi, M.; Mathieu, R.; Chatelain, J.-F.; Ouellet-Plamondon, C.; Lebrun, G. Effect of Graphene Additive on Flexural and Interlaminar Shear Strength Properties of Carbon Fiber-Reinforced Polymer Composite. J. Compos. Sci. 2020, 4, 162. https://0-doi-org.brum.beds.ac.uk/10.3390/jcs4040162
Ali Charfi M, Mathieu R, Chatelain J-F, Ouellet-Plamondon C, Lebrun G. Effect of Graphene Additive on Flexural and Interlaminar Shear Strength Properties of Carbon Fiber-Reinforced Polymer Composite. Journal of Composites Science. 2020; 4(4):162. https://0-doi-org.brum.beds.ac.uk/10.3390/jcs4040162
Chicago/Turabian StyleAli Charfi, Mohamed, Ronan Mathieu, Jean-François Chatelain, Claudiane Ouellet-Plamondon, and Gilbert Lebrun. 2020. "Effect of Graphene Additive on Flexural and Interlaminar Shear Strength Properties of Carbon Fiber-Reinforced Polymer Composite" Journal of Composites Science 4, no. 4: 162. https://0-doi-org.brum.beds.ac.uk/10.3390/jcs4040162