
Strain Mapping and Damage Tracking in Carbon Fiber Reinforced Epoxy Composites during Dynamic Bending Until Fracture with Quantum Resistive Sensors in Array

 , and
, and 
Abstract
:1. Introduction
2. Experimental Details
2.1. Materials
2.2. Manufacture of Samples
2.3. Characterization Techniques
3. Results and Discussion
3.1. Mechanical Properties of the Sample with and without Embedded QRS
3.2. Electrical Response of QRS According to Their Location in the Specimen
4. Conclusions
Author Contributions
Funding
Acknowledgments
Conflicts of Interest
References
- Burck, J.; Marten, F.; Bals, C.; Dertinger, A.; Uhlich, T. Climate Change Performance Index Results 2017. Available online: https://germanwatch.org/en/13042 (accessed on 19 February 2021).
- UNFCCC. Adoption of the Paris Agreement: Proposal by the President to the United Nations Framework Convention on Climate Change. 2015. Available online: https://unfccc.int/documents/9064 (accessed on 19 February 2021).
- Islam, M.; Mekhilef, S.; Saidur, R. Progress and recent trends of wind energy technology. Renew. Sustain. Energy Rev. 2013, 21, 456–468. [Google Scholar] [CrossRef]
- Kumar, Y.; Ringenberg, J.; Depuru, S.S.; Devabhaktuni, V.K.; Lee, J.W.; Nikolaidis, E.; Andersen, B.; A Afjeh, A. Wind energy: Trends and enabling technologies. Renew. Sustain. Energy Rev. 2016, 53, 209–224. [Google Scholar] [CrossRef]
- Jones, R.M. Mechanics of Composite Materials; Taylor & Francis: New York, NY, USA, 1998. [Google Scholar]
- Syndicat des Energies Renouvelables, Etat des Coûts de Production de L’éolien Terrestre en France Analyse Economique de la Commission Eolienne du SER. 2014. Available online: https://www.syndicat-energies-renouvelables.fr/les-energies-renouvelables/eolien/eolien-terrestre/ (accessed on 19 February 2021).
- The Tide Turns on Offshore Maintenance Costs. Windpower Offshore. Available online: https://www.windpowermonthly.com/article/1314299/tide-turns-offshore-maintenance-costs (accessed on 19 February 2021).
- Floating Offshore Wind Farms; Springer International Publishing: Cham, Switzerland, 2016.
- Schubel, P.; Crossley, R.; Boateng, E.; Hutchinson, J. Review of structural health and cure monitoring techniques for large wind turbine blades. Renew. Energy 2013, 51, 113–123. [Google Scholar] [CrossRef]
- Structural Health Monitoring Person of the Year Award. Struct. Heal. Monit. 2008, 7, 89–90. [CrossRef]
- Huston, D. Structural Sensing, Health Monitoring and Performance Evaluation; Series in Sensors; CRC Press: Boca Raton, FL, USA, 2010. [Google Scholar]
- Farrar, C.R.; Worden, K. An introduction to structural health monitoring. Philos. Trans. R. Soc. A Math. Phys. Eng. Sci. 2006, 365, 303–315. [Google Scholar] [CrossRef]
- Raman, V.; Drissi-Habti, M.; Guillaumat, L.; Khadhour, A. Numerical simulation analysis as a tool to identify areas of weakness in a turbine wind-blade and solutions for their reinforcement. Compos. Part B Eng. 2016, 103, 23–39. [Google Scholar] [CrossRef] [Green Version]
- Resor, B.R. Definition of a 5 MW/61.5 m Wind Turbine Blade Reference Model. 2013. Available online: https://prod.sandia.gov/techlib-noauth/access-control.cgi/2013/132569.pdf (accessed on 19 February 2021).
- Holmes, C.; Godfrey, M.; Bull, D.J.; Dulieu-Barton, J. Real-time through-thickness and in-plane strain measurement in carbon fibre reinforced polymer composites using planar optical Bragg gratings. Opt. Lasers Eng. 2020, 133, 106111. [Google Scholar] [CrossRef]
- Iijima, S. Helical microtubules of graphitic carbon. Nat. Cell Biol. 1991, 354, 56–58. [Google Scholar] [CrossRef]
- Radushkevich, L.V.; Lukyanovich, V.M. About the structure of carbon formed by thermal decomposition of carbon monoxide on iron substrate. J. Phys. Chem. 1952, 26, 88–95. [Google Scholar]
- Robert, C.; Feller, J.F.; Castro, M. Sensing Skin for Strain Monitoring Made of PC–CNT Conductive Polymer Nanocomposite Sprayed Layer by Layer. ACS Appl. Mater. Interfaces 2012, 4, 3508–3516. [Google Scholar] [CrossRef] [Green Version]
- Nag-Chowdhury, S.; Bellegou, H.; Pillin, I.; Castro, M.; Longrais, P.; Feller, J. Non-intrusive health monitoring of infused composites with embedded carbon quantum piezo-resistive sensors. Compos. Sci. Technol. 2016, 123, 286–294. [Google Scholar] [CrossRef]
- Gao, L.; Thostenson, E.T.; Zhang, Z.; Chou, T.-W. Coupled carbon nanotube network and acoustic emission monitoring for sensing of damage development in composites. Carbon 2009, 47, 1381–1388. [Google Scholar] [CrossRef]
- Gao, L.; Thostenson, E.T.; Zhang, Z.; Chou, T.-W. Sensing of Damage Mechanisms in Fiber-Reinforced Composites under Cyclic Loading using Carbon Nanotubes. Adv. Funct. Mater. 2009, 19, 123–130. [Google Scholar] [CrossRef]
- Wichmann, M.H.G.; Buschhorn, S.T.; Gehrmann, J.; Schulte, K. Piezoresistive response of epoxy composites with carbon nanoparticles under tensile load. Phys. Rev. B 2009, 80, 245437. [Google Scholar] [CrossRef]
- Böger, L.; Wichmann, M.H.; Meyer, L.O.; Schulte, K. Load and health monitoring in glass fibre reinforced composites with an electrically conductive nanocomposite epoxy matrix. Compos. Sci. Technol. 2008, 68, 1886–1894. [Google Scholar] [CrossRef] [Green Version]
- Sebastian, J.; Schehl, N.; Bouchard, M.; Boehle, M.; Li, L.; Lagounov, A.; Lafdi, K. Health monitoring of structural composites with embedded carbon nanotube coated glass fiber sensors. Carbon 2014, 66, 191–200. [Google Scholar] [CrossRef]
- Gojny, F.H.; Wichmann, M.H.; Fiedler, B.; Bauhofer, W.; Schulte, K. Influence of nano-modification on the mechanical and electrical properties of conventional fibre-reinforced composites. Compos. Part A Appl. Sci. Manuf. 2005, 36, 1525–1535. [Google Scholar] [CrossRef]
- Tripathi, K.M.; Vincent, F.; Castro, M.; Feller, J.F. Flax fibers–epoxy with embedded nanocomposite sensors to design lightweight smart bio-composites. Nanocomposites 2016, 2, 125–134. [Google Scholar] [CrossRef] [Green Version]
- Chowdhury, S.N.; Tung, T.T.; Ta, Q.T.H.; Kumar, G.; Castro, M.; Feller, J.-F.; Sonkar, S.K.; Tripathi, K.M. Upgrading of Diesel Engine Exhaust Waste into Onion-like Carbon Nanoparticles for Integrated Degradation Sensing in Nano-biocomposites. New J. Chem. 2021. [Google Scholar] [CrossRef]
- Treacy, M.M.J.; Ebbesen, T.W.; Gibson, J.M. Exceptionally high Young’s modulus observed for individual carbon nanotubes. Nat. Cell Biol. 1996, 381, 678–680. [Google Scholar] [CrossRef]
- Pillin, I.; Castro, M.; Chowdhury, S.N.; Feller, J.-F. Robustness of carbon nanotube-based sensor to probe composites’ interfacial damage in situ. J. Compos. Mater. 2015, 50, 109–113. [Google Scholar] [CrossRef]
- Robert, C.; Pillin, I.; Castro, M.; Feller, J.-F. Multifunctional Carbon Nanotubes Enhanced Structural Composites with Improved Toughness and Damage Monitoring. J. Compos. Sci. 2019, 3, 109. [Google Scholar] [CrossRef] [Green Version]
- Fidelus, J.; Wiesel, E.; Gojny, F.; Schulte, K.; Wagner, H. Thermo-mechanical properties of randomly oriented carbon/epoxy nanocomposites. Compos. Part A Appl. Sci. Manuf. 2005, 36, 1555–1561. [Google Scholar] [CrossRef]
- Gojny, F.H.; Wichmann, M.H.; Fiedler, B.; Kinloch, I.A.; Bauhofer, W.; Windle, A.H.; Schulte, K. Evaluation and identification of electrical and thermal conduction mechanisms in carbon nanotube/epoxy composites. Polymer 2006, 47, 2036–2045. [Google Scholar] [CrossRef]
- Feller, J.-F. 6.10 Electrically Conductive Nanocomposites. In Comprehensive Composite Materials II; Elsevier BV: Amsterdam, The Netherlands, 2018; pp. 248–314. [Google Scholar]
- Ebbesen, T.W.; Lezec, H.J.; Hiura, H.; Bennett, J.W.; Ghaemi, H.F.; Thio, T. Electrical conductivity of individual carbon nanotubes. Nat. Cell Biol. 1996, 382, 54–56. [Google Scholar] [CrossRef]
- Feller, J.-F.; Kumar, B.; Castro, M. Conductive biopolymer nanocomposites for sensors. Nanocompos. Biodegrad. Polym. 2011, 368–399. [Google Scholar] [CrossRef]
- Levin, Z.S.; Robert, C.; Feller, J.F.; Castro, M.; Grunlan, J.C. Flexible latex—polyaniline segregated network composite coating capable of measuring large strain on epoxy. Smart Mater. Struct. 2012, 22, 1–9. [Google Scholar] [CrossRef]
- Thostenson, E.T.; Chou, T.-W. Real-timein situsensing of damage evolution in advanced fiber composites using carbon nanotube networks. Nanotechnology 2008, 19, 215713. [Google Scholar] [CrossRef] [PubMed]
- Tzounis, L.; Zappalorto, M.; Panozzo, F.; Tsirka, K.; Maragoni, L.; Paipetis, A.S.; Quaresimin, M. Highly conductive ultra-sensitive SWCNT-coated glass fiber reinforcements for laminate composites structural health monitoring. Compos. Part B Eng. 2019, 169, 37–44. [Google Scholar] [CrossRef]
- Wang, Y.; Wang, Y.; Wan, B.; Han, B.; Cai, G.; Chang, R. Strain and damage self-sensing of basalt fiber reinforced polymer laminates fabricated with carbon nanofibers/epoxy composites under tension. Compos. Part A Appl. Sci. Manuf. 2018, 113, 40–52. [Google Scholar] [CrossRef]
- Esmaeili, A.; Sbarufatti, C.; Ma, D.; Manes, A.; Jiménez-Suárez, A.; Ureña, A.; Dellasega, D.; Hamouda, A. Strain and crack growth sensing capability of SWCNT reinforced epoxy in tensile and mode I fracture tests. Compos. Sci. Technol. 2020, 186, 107918. [Google Scholar] [CrossRef]
- Tung, T.T.; Karunagaran, R.; Tran, D.N.H.; Gao, B.; Nag-Chowdhury, S.; Pillin, I.; Castro, M.; Feller, J.-F.; Losic, D. Engineering of graphene/epoxy nanocomposites with improved distribution of graphene nanosheets for advanced piezo-resistive mechanical sensing. J. Mater. Chem. C 2016, 4, 3422–3430. [Google Scholar] [CrossRef]
- Chiacchiarelli, L.M.; Rallini, M.; Monti, M.; Puglia, D.; Kenny, J.M.; Torre, L. The role of irreversible and reversible phenomena in the piezoresistive behavior of graphene epoxy nanocomposites applied to structural health monitoring. Compos. Sci. Technol. 2013, 80, 73–79. [Google Scholar] [CrossRef]
- Meeuw, H.; Viets, C.; Liebig, W.; Schulte, K.; Fiedler, B. Morphological influence of carbon nanofillers on the piezoresistive response of carbon nanoparticle/epoxy composites under mechanical load. Eur. Polym. J. 2016, 85, 198–210. [Google Scholar] [CrossRef]
- Kanoun, O.; Benchirouf, A.; Sanli, A.; Bouhamed, A.; Bu, L. Potential of Flexible Carbon Nanotube Films for High Performance Strain and Pressure Sensors, One Central Press 148–183. Available online: https://www.researchgate.net/publication/281438116_Potential_of_Flexible_Carbon_Nanotube_Films_for_High_Performance_Strain_and_Pressure_Sensors (accessed on 19 February 2021).
- Sanli, A.; Benchirouf, A.; Müller, C.; Kanoun, O. Piezoresistive performance characterization of strain sensitive multi-walled carbon nanotube-epoxy nanocomposites. Sens. Actuators A Phys. 2017, 254, 61–68. [Google Scholar] [CrossRef]
- Bouhamed, A.; Müller, C.; Choura, S.; Kanoun, O. Processing and characterization of MWCNTs/epoxy nanocomposites thin films for strain sensing applications. Sens. Actuators A Phys. 2017, 257, 65–72. [Google Scholar] [CrossRef]
- Sanli, A.; Müller, C.; Kanoun, O.; Elibol, C.; Wagner, M.F.-X. Piezoresistive characterization of multi-walled carbon nanotube-epoxy based flexible strain sensitive films by impedance spectroscopy. Compos. Sci. Technol. 2016, 122, 18–26. [Google Scholar] [CrossRef]
- Michelis, F.; Bodelot, L.; Bonnassieux, Y.; Lebental, B. Highly reproducible, hysteresis-free, flexible strain sensors by inkjet printing of carbon nanotubes. Carbon 2015, 95, 1020–1026. [Google Scholar] [CrossRef] [Green Version]
- Kaiyan, H.; Weifeng, Y.; Shuying, T.; Haidong, L. A fabrication process to make CNT/EP composite strain sensors. High Perform. Polym. 2017, 30, 224–229. [Google Scholar] [CrossRef]
- Dai, H.; Thostenson, E.T.; Schumacher, T. Processing and Characterization of a Novel Distributed Strain Sensor Using Carbon Nanotube-Based Nonwoven Composites. Sensors 2015, 15, 17728–17747. [Google Scholar] [CrossRef] [Green Version]
- Chou, T.-W. Microstructural Design of Fiber Composites; Cambridge University Press: Cambridge, UK, 1992. [Google Scholar]
- Corum, J. Basic Properties of Reference Crossply Carbon-Fiber Composite. 2001. Available online: https://www.osti.gov/biblio/777662-basic-properties-reference-crossply-carbon-fiber-composite (accessed on 19 February 2021).
- Morioka, K.; Tomita, Y. Effect of lay-up sequences on mechanical properties and fracture behavior of CFRP laminate composites. Mater. Charact. 2000, 45, 125–136. [Google Scholar] [CrossRef]
- Hu, N.; Karube, Y.; Arai, M.; Watanabe, T.; Yan, C.; Li, Y.; Liu, Y.; Fukunaga, H. Investigation on sensitivity of a polymer/carbon nanotube composite strain sensor. Carbon 2010, 48, 680–687. [Google Scholar] [CrossRef]


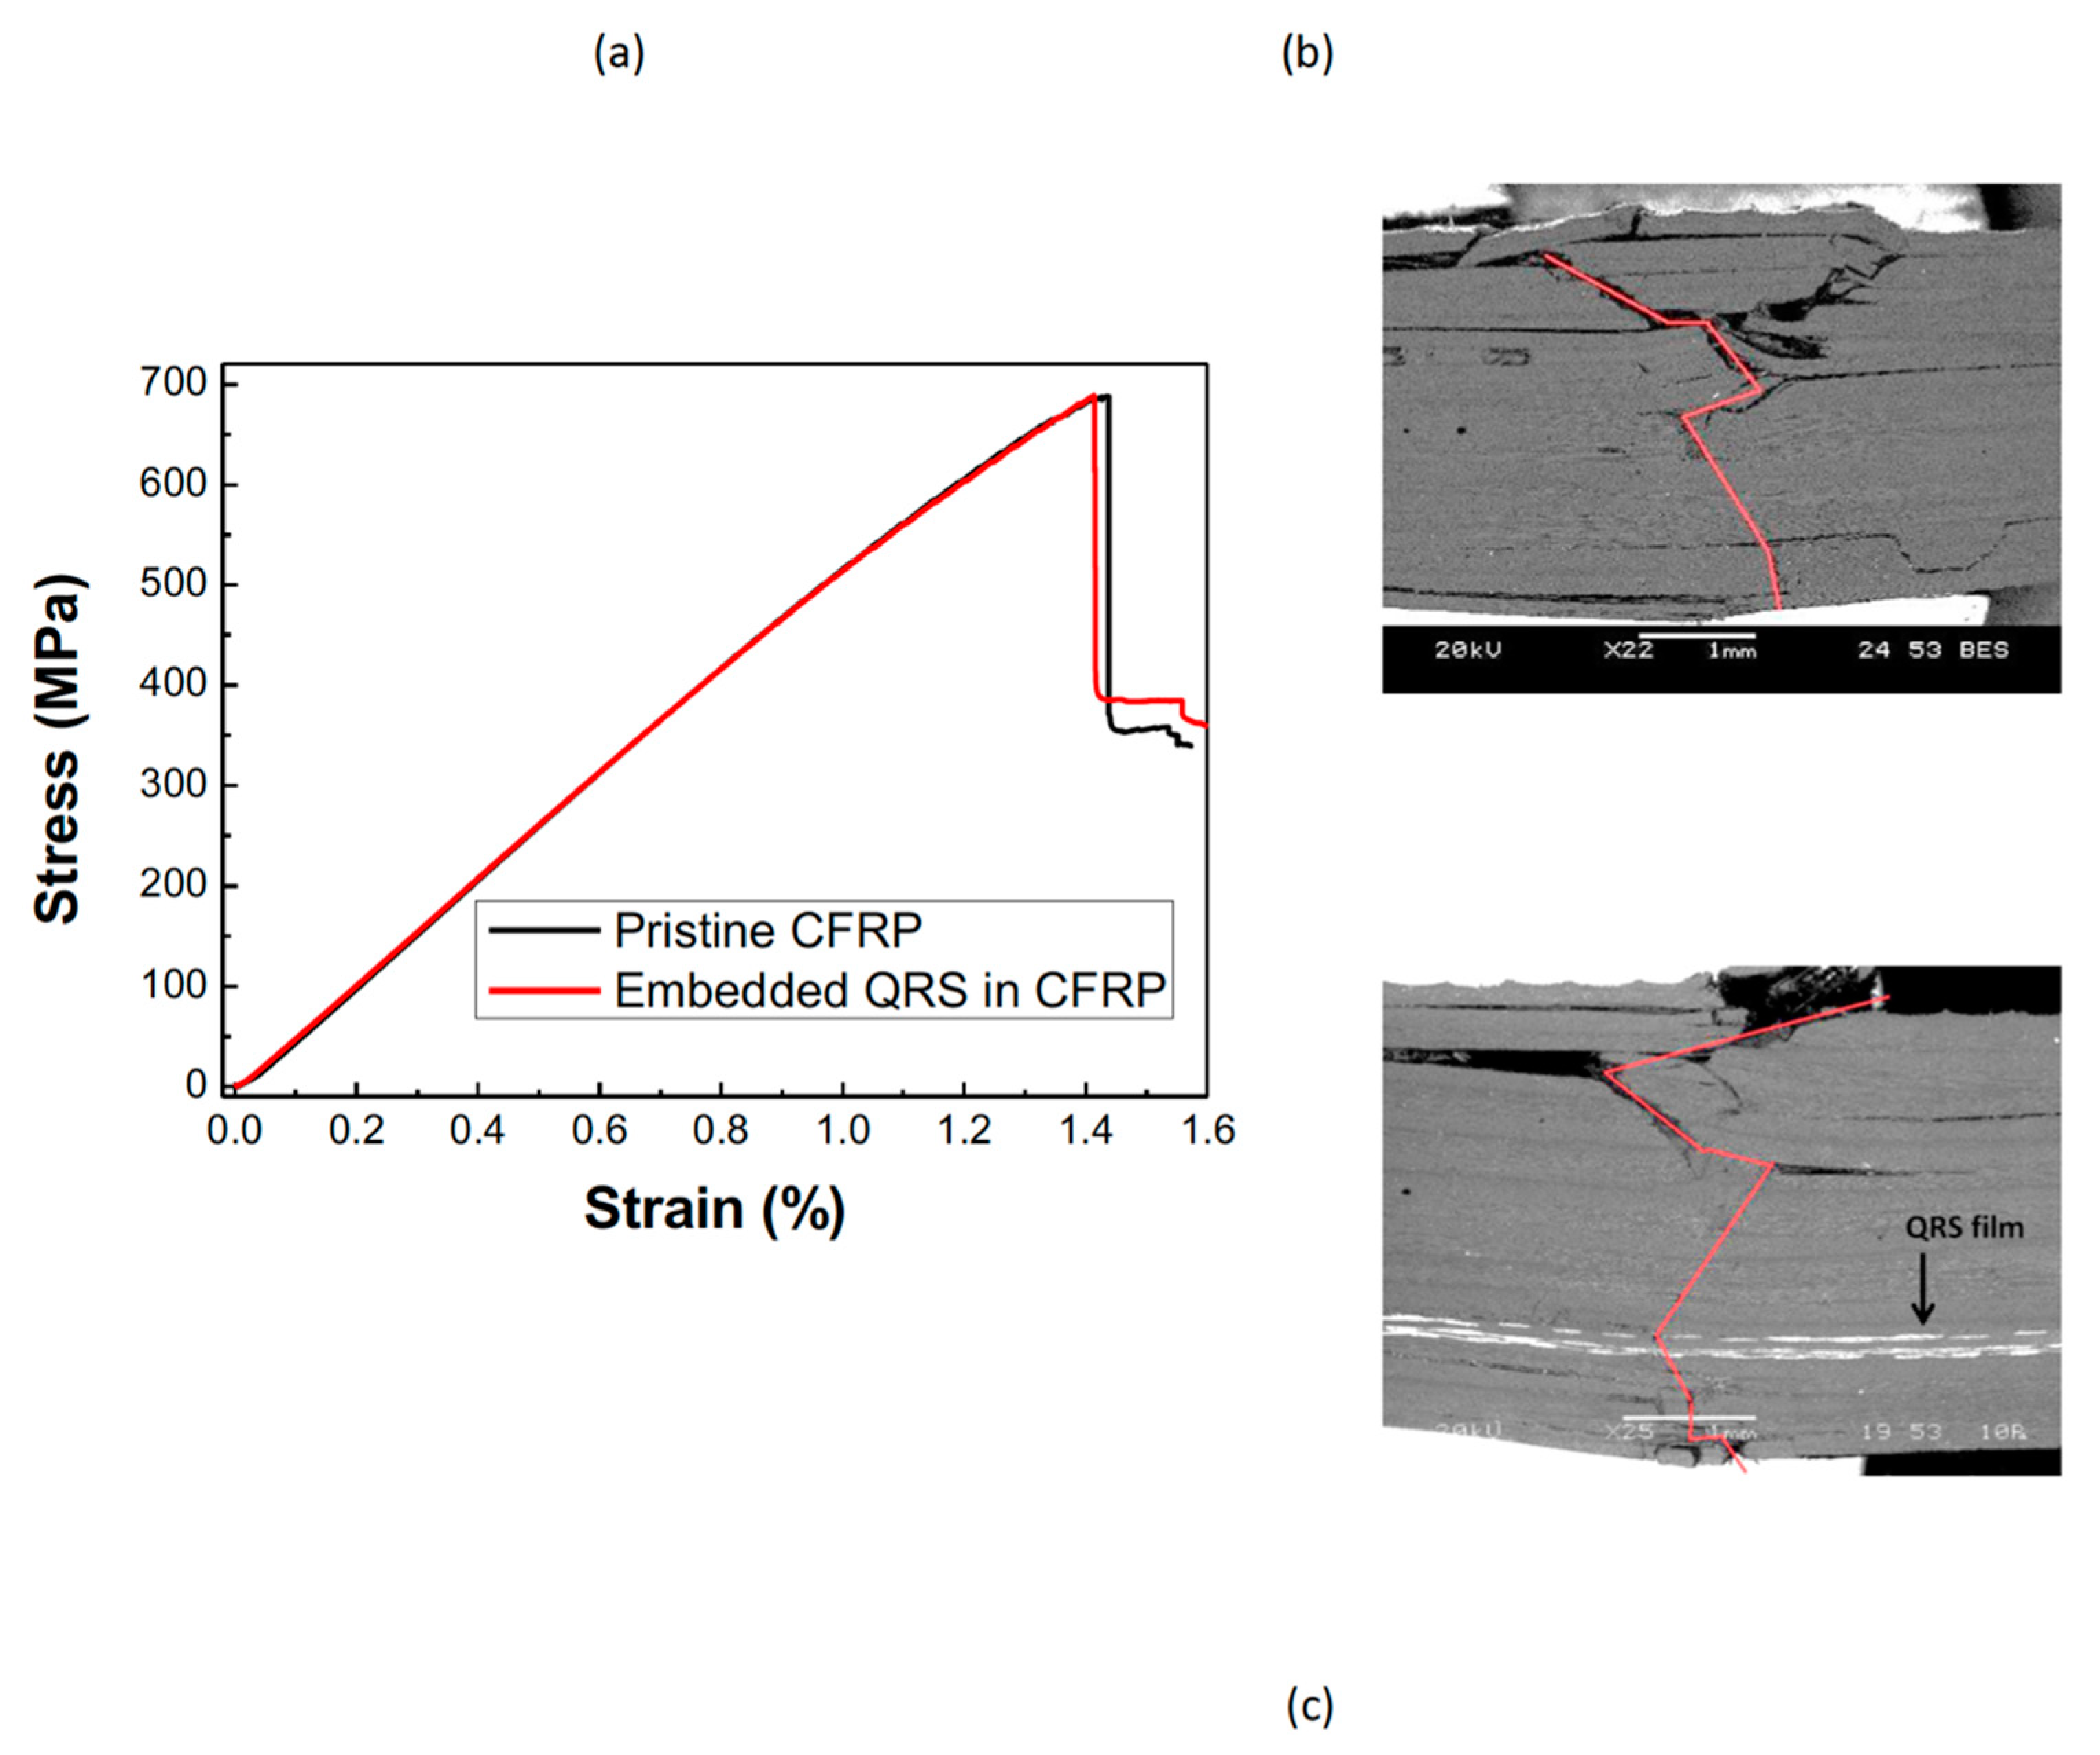
| Type of Sample | Young Modulus (GPa) | Failure Stress (MPa) | Failure Strain (%) |
|---|---|---|---|
| Pristine CFRP | 52.1 ± 1.8 | 669 ± 27 | 1.42 ± 0.06 |
| CFRP with embedded QRS | 51.5 ± 2.1 | 629 ± 61 | 1.34 ± 0.11 |
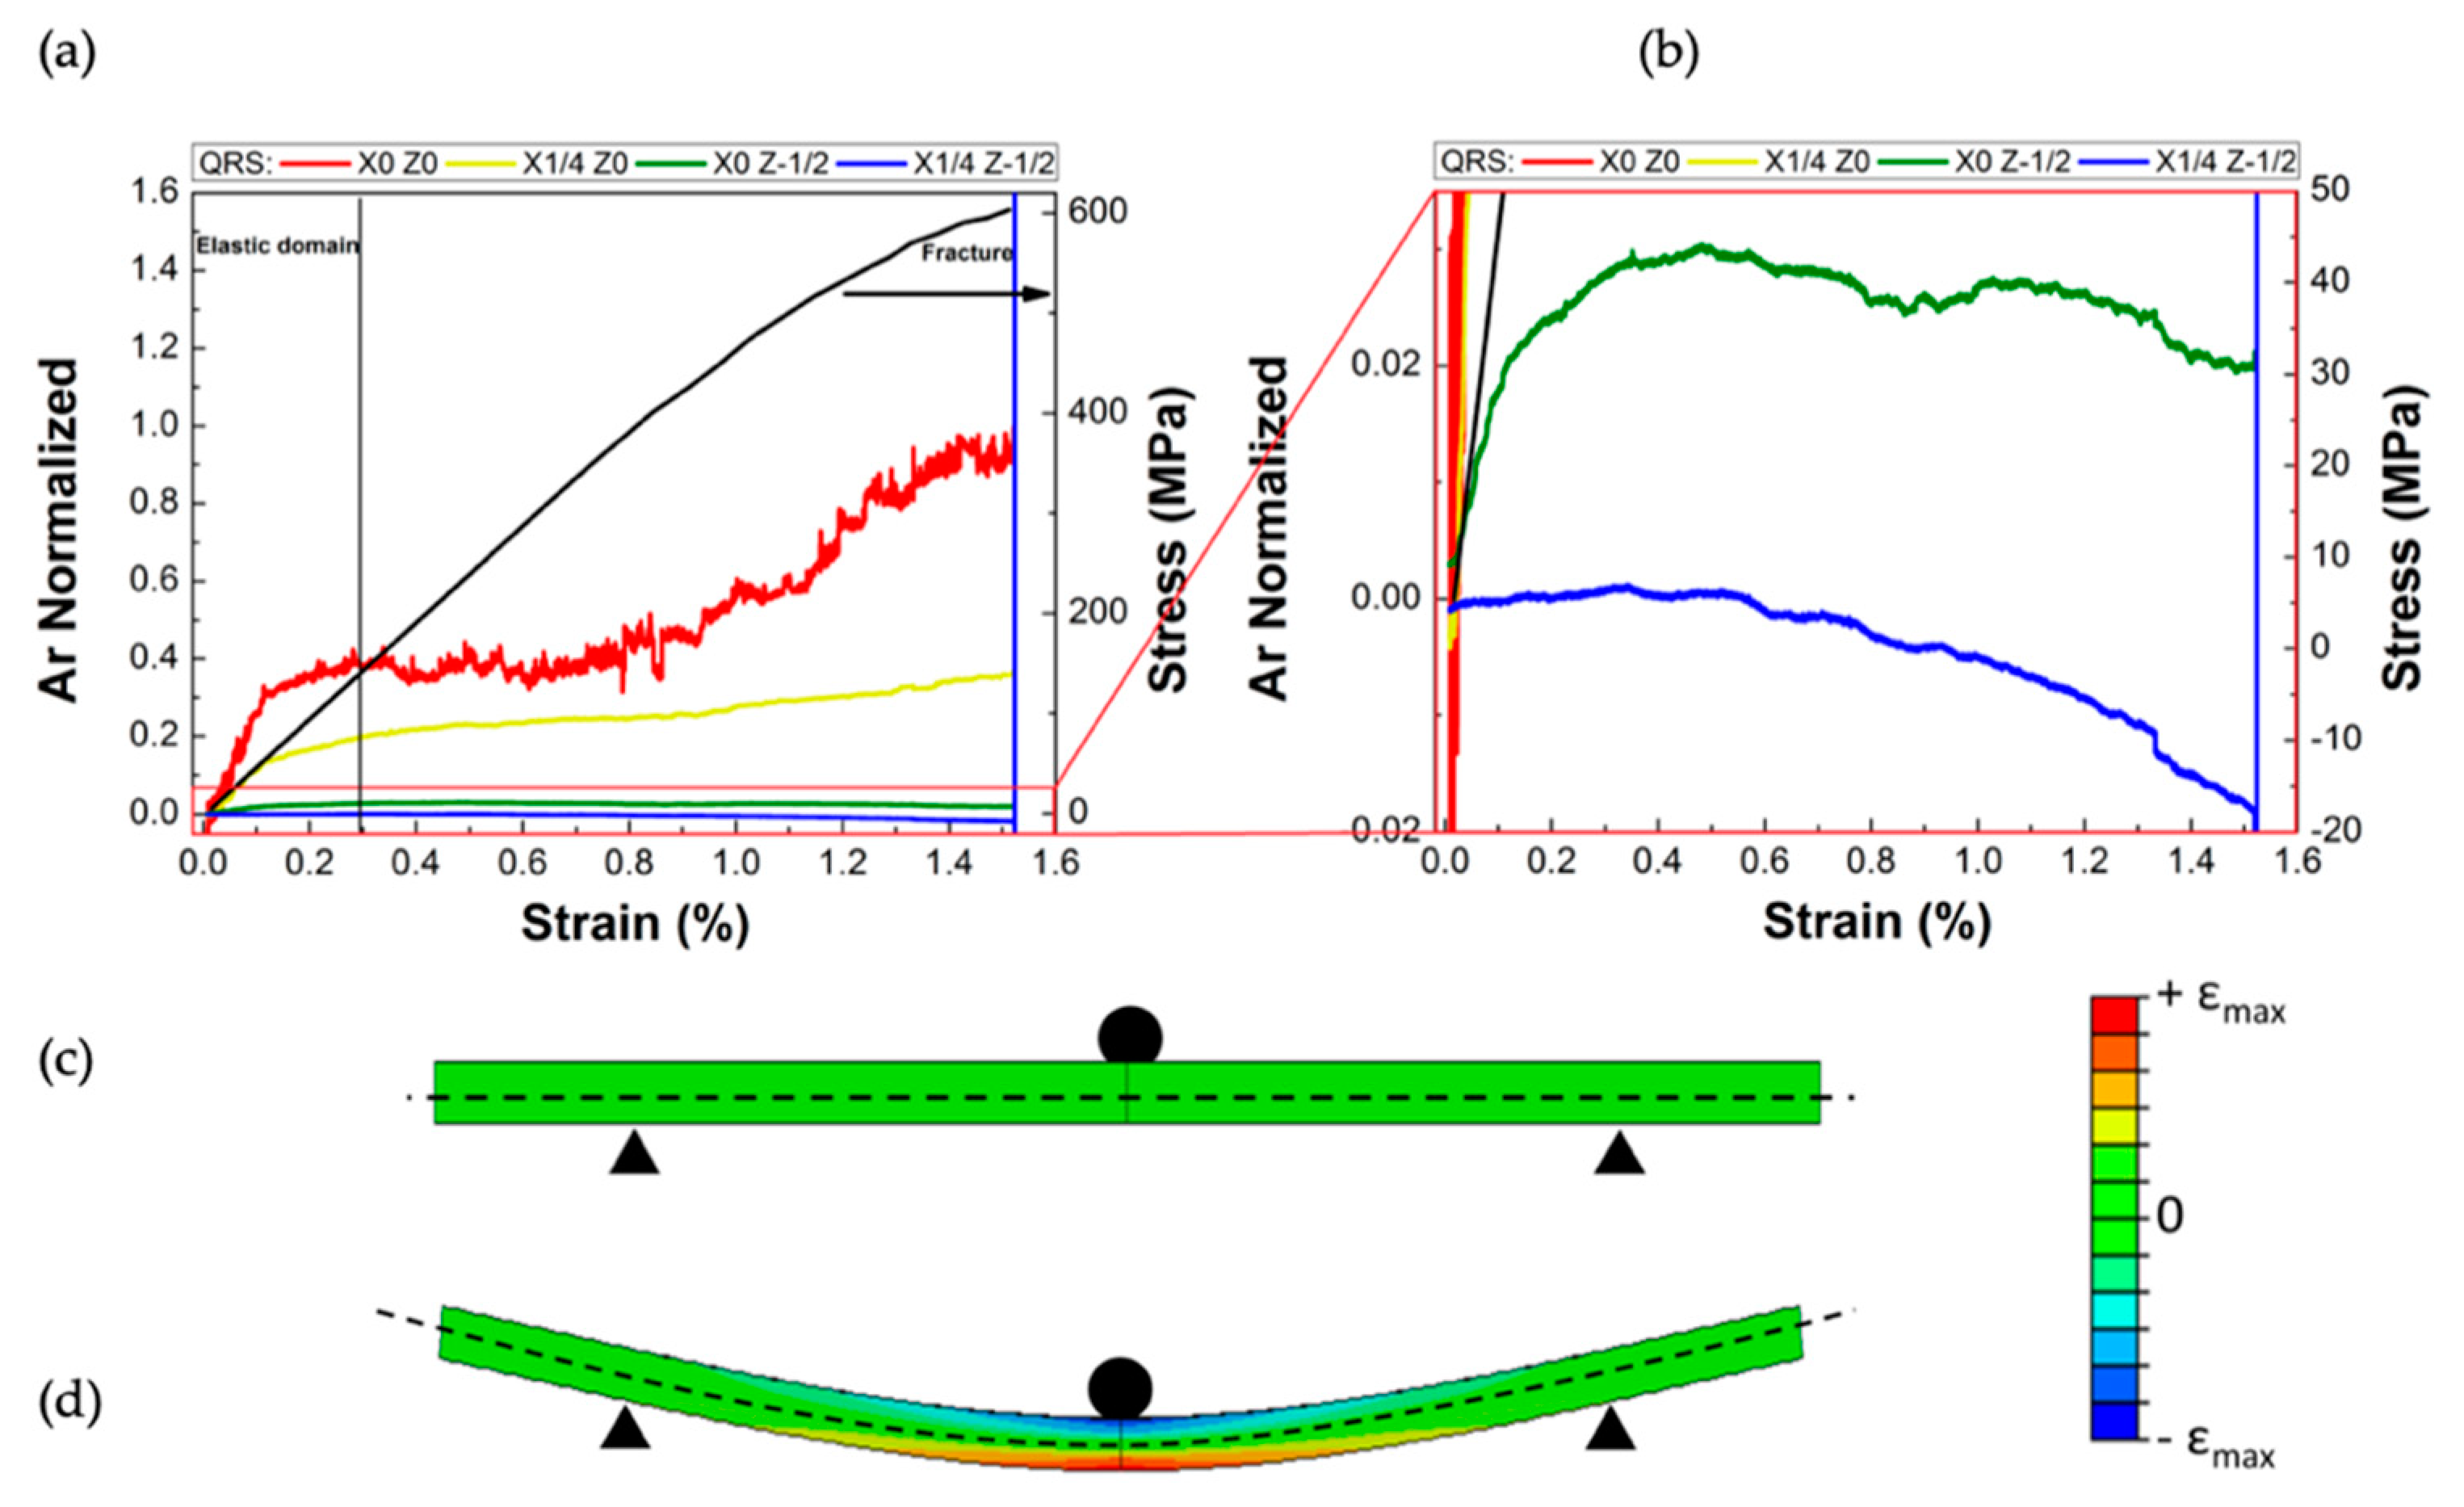
| Step | (X0;Z0) | (X1/4; Z0) | (X0; Z-1/2) | (X1/4; Z-1/2) |
|---|---|---|---|---|
| ε1 | 0.070 | 0.072 | 0.019 | 0.008 |
| ε2 | 0.075 | 0.072 | 0.015 | 0.011 |
| ε1–2 | 0.072 | 0.067 | 0.019 | 0.008 |
| ε3 | 0.096 | 0.082 | 0.012 | 0.014 |
| ε1–3 | 0.067 | 0.082 | 0.017 | 0.007 |
| ε4 | 0.080 | 0.79 | 0.044 | 0.015 |
| ε1–4 | 0.064 | 0.095 | 0.017 | 0.010 |
Publisher’s Note: MDPI stays neutral with regard to jurisdictional claims in published maps and institutional affiliations. |
© 2021 by the authors. Licensee MDPI, Basel, Switzerland. This article is an open access article distributed under the terms and conditions of the Creative Commons Attribution (CC BY) license (http://creativecommons.org/licenses/by/4.0/).
Share and Cite
Lemartinel, A.; Castro, M.; Fouché, O.; De Luca, J.-C.; Feller, J.-F. Strain Mapping and Damage Tracking in Carbon Fiber Reinforced Epoxy Composites during Dynamic Bending Until Fracture with Quantum Resistive Sensors in Array. J. Compos. Sci. 2021, 5, 60. https://0-doi-org.brum.beds.ac.uk/10.3390/jcs5020060
Lemartinel A, Castro M, Fouché O, De Luca J-C, Feller J-F. Strain Mapping and Damage Tracking in Carbon Fiber Reinforced Epoxy Composites during Dynamic Bending Until Fracture with Quantum Resistive Sensors in Array. Journal of Composites Science. 2021; 5(2):60. https://0-doi-org.brum.beds.ac.uk/10.3390/jcs5020060
Chicago/Turabian StyleLemartinel, Antoine, Mickaël Castro, Olivier Fouché, Julio-César De Luca, and Jean-François Feller. 2021. "Strain Mapping and Damage Tracking in Carbon Fiber Reinforced Epoxy Composites during Dynamic Bending Until Fracture with Quantum Resistive Sensors in Array" Journal of Composites Science 5, no. 2: 60. https://0-doi-org.brum.beds.ac.uk/10.3390/jcs5020060