
Effect of Graphene Oxide as a Reinforcement in a Bio-Epoxy Composite


1
Department of Mechanical Engineering, University of Saskatchewan, 57 Campus Drive, Saskatoon, SK S7N 5A9, Canada
2
Department of Chemistry, University of Saskatchewan, 110 Science Place (Room 156 Thorvaldson Building), Saskatoon, SK S7N 5C9, Canada
*
Authors to whom correspondence should be addressed.
J. Compos. Sci. 2021, 5(3), 91; https://0-doi-org.brum.beds.ac.uk/10.3390/jcs5030091
Submission received: 11 March 2021
/
Revised: 18 March 2021
/
Accepted: 19 March 2021
/
Published: 23 March 2021
(This article belongs to the Special Issue Graphene Oxide Composites)
Abstract
:Graphene oxide (GO) has gained interest within the materials research community. The presence of functional groups on GO offers exceptional bonding capabilities and improved performance in lightweight polymer composites. A literature review on the tensile and flexural mechanical properties of synthetic epoxy/GO composites was conducted that showed differences from one study to another, which may be attributed to the oxidation level of the prepared GO. Herein, GO was synthesized from oxidation of graphite flakes using the modified Hummers method, while bio-epoxy/GO composites (0.1, 0.2, 0.3 and 0.6 wt.% GO) were prepared using a solution mixing route. The GO was characterized using Fourier transform infrared (FTIR) spectroscopy, scanning electron microscopy (SEM) and transmission electron microscope (TEM) analysis. The thermal properties of composites were assessed using thermogravimetric analysis (TGA) and differential scanning calorimetry (DSC). FTIR results confirmed oxidation of graphite was successful. SEM showed differences in fractured surfaces, which implies that GO modified the bio-epoxy polymer to some extent. Addition of 0.3 wt.% GO filler was determined to be an optimum amount as it enhanced the tensile strength, tensile modulus, flexural strength and flexural modulus by 23, 35, 17 and 31%, respectively, compared to pure bio-epoxy. Improvements in strength were achieved with considerably lower loadings than traditional fillers. Compared to the bio-epoxy, the 0.6 wt.% GO composite had the highest thermal stability and a slightly higher (positive) glass transition temperature (Tg) was increased by 3.5 °C, relative to the pristine bio-epoxy (0 wt.% GO).
1. Introduction
Conventional epoxy thermosets are used in a number of applications including electronic packaging circuit encapsulation, construction, wind turbines, automotive, marine, aerospace and consumer products. Lightweight, low shrinkage, chemical and corrosion resistance are some of the advantages of using epoxies. Bio-epoxy resins are better for the environment since they use an alternative monomer to petroleum based synthetic di-glycidyl ether of bisphenol-A (DGEBA) for synthesizing epoxy. Bio-resins are obtained from bio-based monomers derived from commercially available epoxidized natural oils and modified cardanol [1] which lower the carbon footprint of the final epoxy resin. The bio-content will be influenced by the type of monomer and curing agent selected. Current bio-epoxy resins on the market (with known wt. percentage (%) amount of bio-content) are; SuperSap® (28–31%), EcoPoxy® (70%), GreenPoxy® (28–51%), Epicerol® (100%) and Change Climate Pty Ltd. (77%).
Cured epoxy tends to have moderate strength with low stiffness and ductility which may limit its use for certain applications. Conventional fillers are added to polymers to reduce component costs without large reductions in mechanical properties. In general, fillers can improve impact toughness, stiffness, hardness, hygrothermal properties [2] and solar ultraviolet (UV) radiation resistance properties [3] of such polymer composites. Conversely, adding too much filler material tends to decrease the tensile and flexural strengths of polymer composites. Interestingly, the addition of graphene oxide (GO) powder as a filler to polymers represents a promising design strategy. It has been reported that lower amounts of GO fillers are required in polymer composites as compared to traditional mineral fillers to improve mechanical properties [4,5].
Graphite is a two-dimensional, layered, and crystalline carbon material discovered by KW Scheele in 1779. Each layer of carbon atoms within the plane is covalently bonded, while the bonding between the graphite sheets interact non-covalently via van der Waals interactions [6]. The tensile strength and modulus of several layers of graphite were reported to be 300 nN and 0.5 TPa, respectively [7]. Due to its low cost, graphite has been added to epoxy with beneficial mechanical properties. For example, graphite platelets were added to epoxy resin at loadings of 2.5–5 wt.%, which increased the tensile strength by 25%–9% and tensile modulus by 10–21%, respectively, as compared with the pure epoxy [8].
By exfoliating the sheets of graphite, graphene, a two-dimensional material is formed. Graphene was discovered in 2004 and is defined as a single flat sheet of graphite in which its carbon atoms are arranged in a hexagonal structure [9]. Graphite flakes consist of hundreds of graphene layers. Flakes can be exfoliated into single graphene sheets/layers (or graphite nanoplatelets) having an estimated thickness of 0.34 nm, while the graphite flake is about 30 to 100 nm thick [10]. Graphene is a very strong carbonaceous material with tensile strength of 130 GPa (~220 times greater than high strength steel (HSS), ~590 MPa) steel and a tensile modulus of 1 TPa (~5 times greater than HSS, ~200 GPa) [11]. Graphene has been added to epoxy in the amount of 0.1 wt.%, where the tensile strength and tensile modulus of the composite was increased by 40% and 31%, as compared to the epoxy without filler [12]. Although studies have shown graphene can improve properties of polymer composites, there are issues that restrict the mass production of graphene composites. The challenge relates to the difficulty in obtaining a homogeneous dispersion of graphene throughout the polymer matrix and its compatibility with polymer matrices. Graphene has a smooth, non-reactive surface which prevents good adhesion bonding, where this limits the load transfer from the graphene sheets to the polymer phase [13].
GO is obtained from graphite flakes that have been oxidized using an oxidative treatment. Similar to graphite, GO is also a layered structure having a stacking arrangement of GO sheets which can be exfoliated into sheets by sonication in water, solvents and polymers. GO layers are slightly thicker than graphite flakes due to the presence of oxygen containing functional groups on both sides of its basal plane surface. In the same way, the thickness of single GO sheets has been reported to be about 0.7 nm to 1.5 nm [14,15], with an average of 1 nm [10,15], while GO layers would be greater than the precursor graphite flakes. The tensile strength and tensile modulus of one layer of GO were reported to be 77 MPa and 208 GPa, respectively [14], much lower than pristine graphene. The price of GO is relatively high compared to other mineral filler materials and is dependent on precursors, method of preparation, degree of oxidation, etc. Graphene oxide production methods were recently reviewed for the years 1859 to 2019. The authors outlined that some approaches could be tweaked to produce GO at a lower cost using less sophisticated techniques that would be amenable to scale-up for mass production [16]. Herein, GO was incorporated at relatively low levels (cf. Table 1) that did not exceed 0.6 wt.% in bio-epoxy composites, where a GO content of 0.3 wt.% will be shown to have optimal mechanical properties (vide infra). Although the mechanical properties of GO are lower than graphene, the advantage of using GO in polymers is due to the presence of functional groups on the surface and edges of the GO sheets. The presence of surface functional groups such as carbonyl (C=O) and carboxyl (-COOH) groups, and the hydroxyl (-OH) and C-O groups of an epoxide on the basal plane of the GO surface, in turn, provides better adhesive bonding compatibility and performance in epoxy matrices. For example, significant improvements in composite tensile and flexural properties have been reported with the addition of GO to synthetic epoxy resins as outlined in Table 2 and Table 3, respectively. The percentage change in property values in these two tables do not provide a clear trend in the current studies. However, the results appear to show an improvement in tensile and flexural properties as the GO content was increased.
As a result of GO’s compatibility with polymers, GO has been added to various polymer matrix materials. Example polymers include polycarbonate [17], a biodegradable polyester, poly(ε-caprolactone) [18], unsaturated polyester resin [19], a polyester elastomer [20], poly (vinyl alcohol) [21], polybenzimidazole [22] and polypropylene [23].
Of the few studies conducted on epoxy/GO composites, the matrix is generally synthetic epoxy. To date, GO reinforced bio-epoxy composites have not been reported in the literature. From the studies conducted on synthetic epoxy/GO, the mechanical property results differ across the literature. The objective of this research was to synthesize GO material and evaluate the tensile and flexural properties of bio-epoxy composites containing various amounts of GO fillers and to compare against the pure bio-epoxy. Fourier transform infrared (FTIR) spectroscopy was used to verify appropriate oxidation of the graphite and bonding between the bio-epoxy resin and the graphite sheets. Scanning electron microscopy (SEM) was used to view the GO filler morphology and fractured surfaces of the modified and unmodified composites. Thermogravimetric analysis (TGA) and differential scanning calorimetry (DSC) were performed to assess the thermal properties. The results provide information on the use of a bio-resin with low GO contents and its utility as an alternative to synthetic equivalent systems.
2. Materials and Methods
2.1. Materials
Super Sap CPM/CPL is a bio-based epoxy that was purchased from Entropy Resins Inc., San Antonio, TX, USA. The resin was mixed with a ratio of 10:4 by weight bio-epoxy to hardener. Natural pristine graphite flakes, 325 mesh (<44 μm), 99.8% (metals basis) were procured from Alfa Aesar Thermo Fisher Scientific, Tewksbury, MA, USA. All other chemicals and solvents were purchased from suppliers.
2.2. Graphene Oxide Preparation
GO was produced using a modified Hummer’s method [24]. Typically, 4 g of natural graphite flakes and 100 mL of sulfuric acid (H2SO4; 98%) were added to a 500 mL beaker. About 2 g of sodium nitrate (NaNO3) was then added to the beaker and the mixture was stirred for 4 h in an ice bath. About 9 g of potassium permanganate (KMnO4) was slowly added to the beaker over a 1 h period and mechanically stirred for 2 h. The mixture was then removed from the ice bath and the reaction enhanced by heating at 35 °C for 30 min. Next, 240 mL distilled water added slowly to the system which caused a temperature rise. The solution was stirred and maintained at 90 °C for 30 min. To terminate the reaction, 160 mL of water, and 30% v/v hydrogen peroxide (H2O2) solution was added to the beaker. The solution was centrifuged and purified by rinsing multiple times with milli-pore water, hydrochloric acid (HCl) 30% and ethanol until a pH ≈ 7 was reached. Lastly, the product was dried under vacuum at 40 °C for 12 h to produce a GO film. The film was made into powder by grinding in a mortar and pestle.
2.3. Bio-Epoxy/GO Composite Preparation
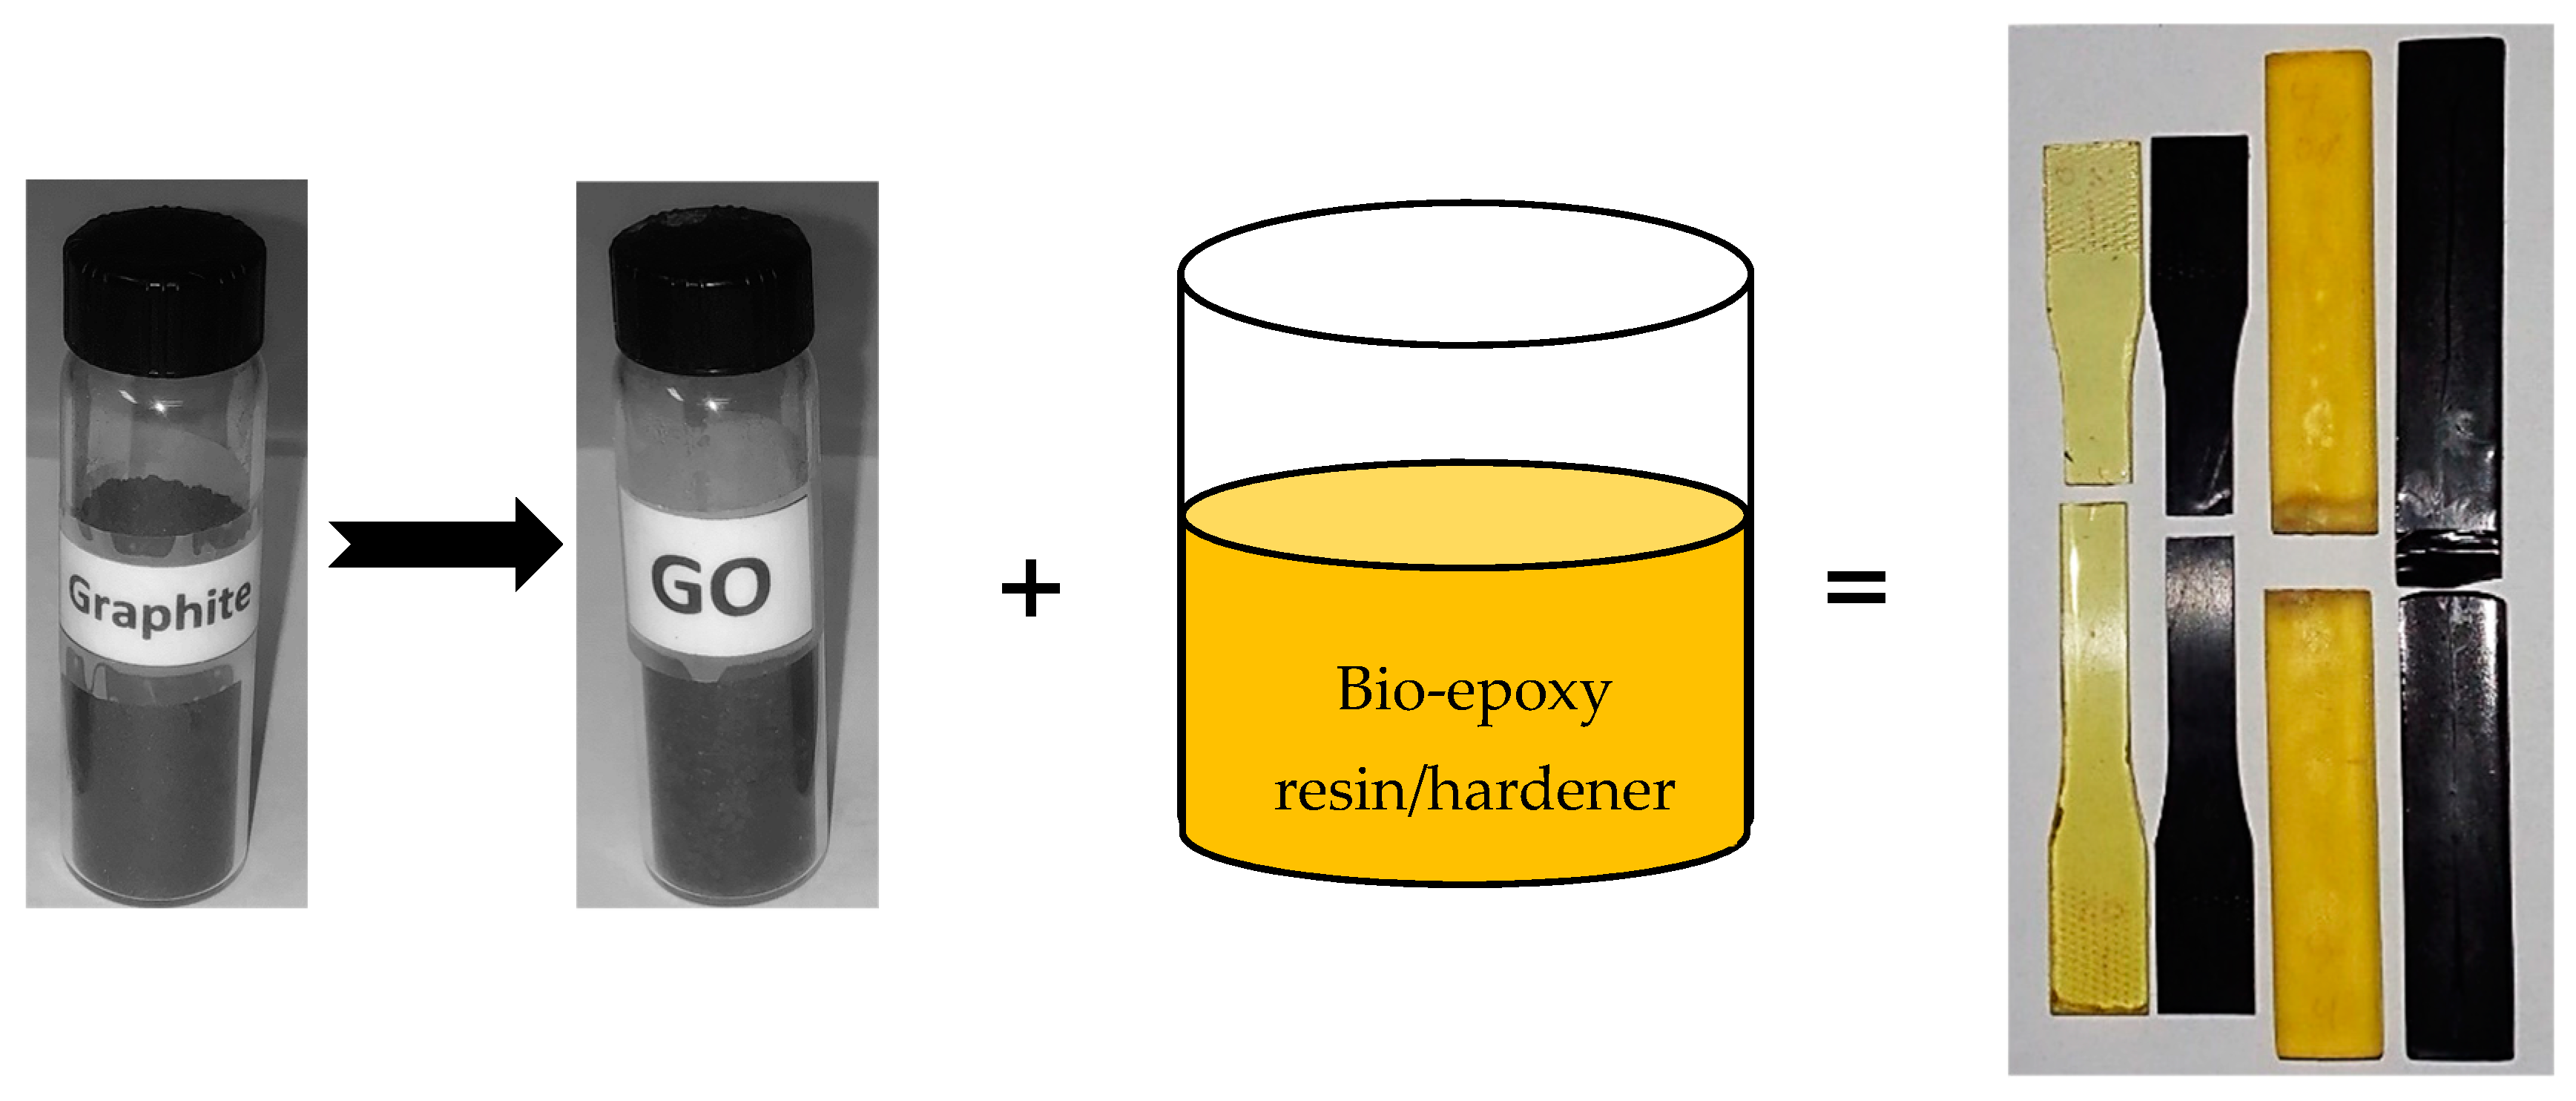
A selected amount of GO powder to produce each composite was separately dispersed in acetone [25,26] and sonicated using an ultrasonic homogenizer (FS-900N), Shanghai Shengxi Co. Ltd. (Shanghai, China) for 60 min. to produce a uniform, exfoliated GO dispersion. Sonication helped to separate the multiple layered graphene oxide into layers of graphene oxide in solution. An amount of bio-epoxy resin as outlined in Table 1 was added to the GO/acetone mixture and mechanically stirred for 60 min. To evaporate the acetone solvent, the resin was placed overnight (~12 h) in an oven under vacuum at 40 °C. The hardener was added to the bio-epoxy/GO and mechanically stirred for 10 min. The mixture was degassed at room temperature in a vacuum oven for 30 min to remove air bubbles. A vacuum less than 27 in. Hg (68.6 cm Hg) was determined to be optimum to completely degas the epoxy with 29 in. Hg (73.7 cm Hg) as the best setting. At 27 in. Hg and higher, bubbles in the epoxy were still present. The bio-epoxy mixture was slowly (to prevent formation of air bubbles) poured into pre-determined specimen sized silicone molds. The silicon molds were made with Mold Max® 10T, from Smooth-On Inc., Macungie, USA. To improve the quality, the silicon molds were cured for 24 h followed by a post-cure of 38 °C for 4 h as recommended by the manufacturer. The bio-epoxy specimens were cured at room temperature (23 °C) for 24 h and post-cured at 82 °C for 1 h. The preparation scheme for tensile and flexural specimens is shown in Figure 1.
2.4. Measurements and Characterization
FTIR spectroscopy was performed on “as received” graphite, “as produced” GO, pure bio-epoxy, and bio-epoxy containing 0.2, 0.3, 0.6 and 1.2 wt.% GO. The FTIR spectra were conducted on a Bio-Rad FTS-40 spectrophotometer. The spectra for each analysis were obtained in reflectance mode with a resolution of 4 cm−1 over the spectral range between 500 and 4000 cm−1. The samples were made into powdered form and compressed into tablets of KBr in a weight ratio of 1:10 (sample powder: KBr) which were determined to be optimum levels to obtain good spectral resolution and intensity. Graphite and graphene powder morphology as well as tensile and flexural fractured surfaces of materials were observed by SEM using a JEOL JSM-6010 LV (Tokyo, Japan) operated at 10–15 kV. The bio-epoxy and composite samples were initially sputter-coated with a layer of gold prior to viewing. The morphology of graphite GO powders and the dispersion of GO in the epoxy composites were viewed via a transmission electron microscope (TEM) (Hitachi HT7700, Tokyo, Japan) with an accelerating voltage of 80–100 kV. The powders were prepared by mixing with 70% ethanol and three micro-liters were dropped on a formvar/carbon-coated 400 mesh Cu TEM grid. The GO composites were sectioned to 100 nm thickness on an Ultramicrotome Leica EM UC7 (Leica Microsystems, Wetzlar, Germany). Tensile and three-point flexural strength specimens were tested using an Instron 1137 universal testing machine with a 10 kN load cell. Tensile strength was evaluated at a strain rate of 5 mm/min according to ASTM D638-14 on dog-bone shaped specimens measuring 165 × 13.0 × 3.3 mm3 (l × w × t). Flexural, three-point loading strength tests were performed according to ASTM D790-15. The support span length was 120 mm in order to maintain a support span-to-depth ratio of not less than 16:1. The specimens measured 180 × 20.0 × 7.5 mm3 (l × w × t). The rate of the crosshead was calculated to be 3.20 mm/min. For both tensile and flexural mechanical tests, five specimens of each composite were tested and reported as an average value. The thermal stability of the materials was studied using thermogravimetric analysis (TGA) TA Q50 (New Castle, DE, USA) from 30 to 500 °C using a heating rate of 10 °C/min under nitrogen flow rate. The glass transition temperature (Tg) of the materials were investigated using a differential scanning calorimeter (DSC) TA Q50 (New Castle, DE, USA) in the temperature range of 30 to 200 °C at a heating rate of 10 °C/min under nitrogen atmosphere. The Tg values were taken at the midpoint temperature of the heat flow curves.
3. Results and Discussion
3.1. FTIR Analysis
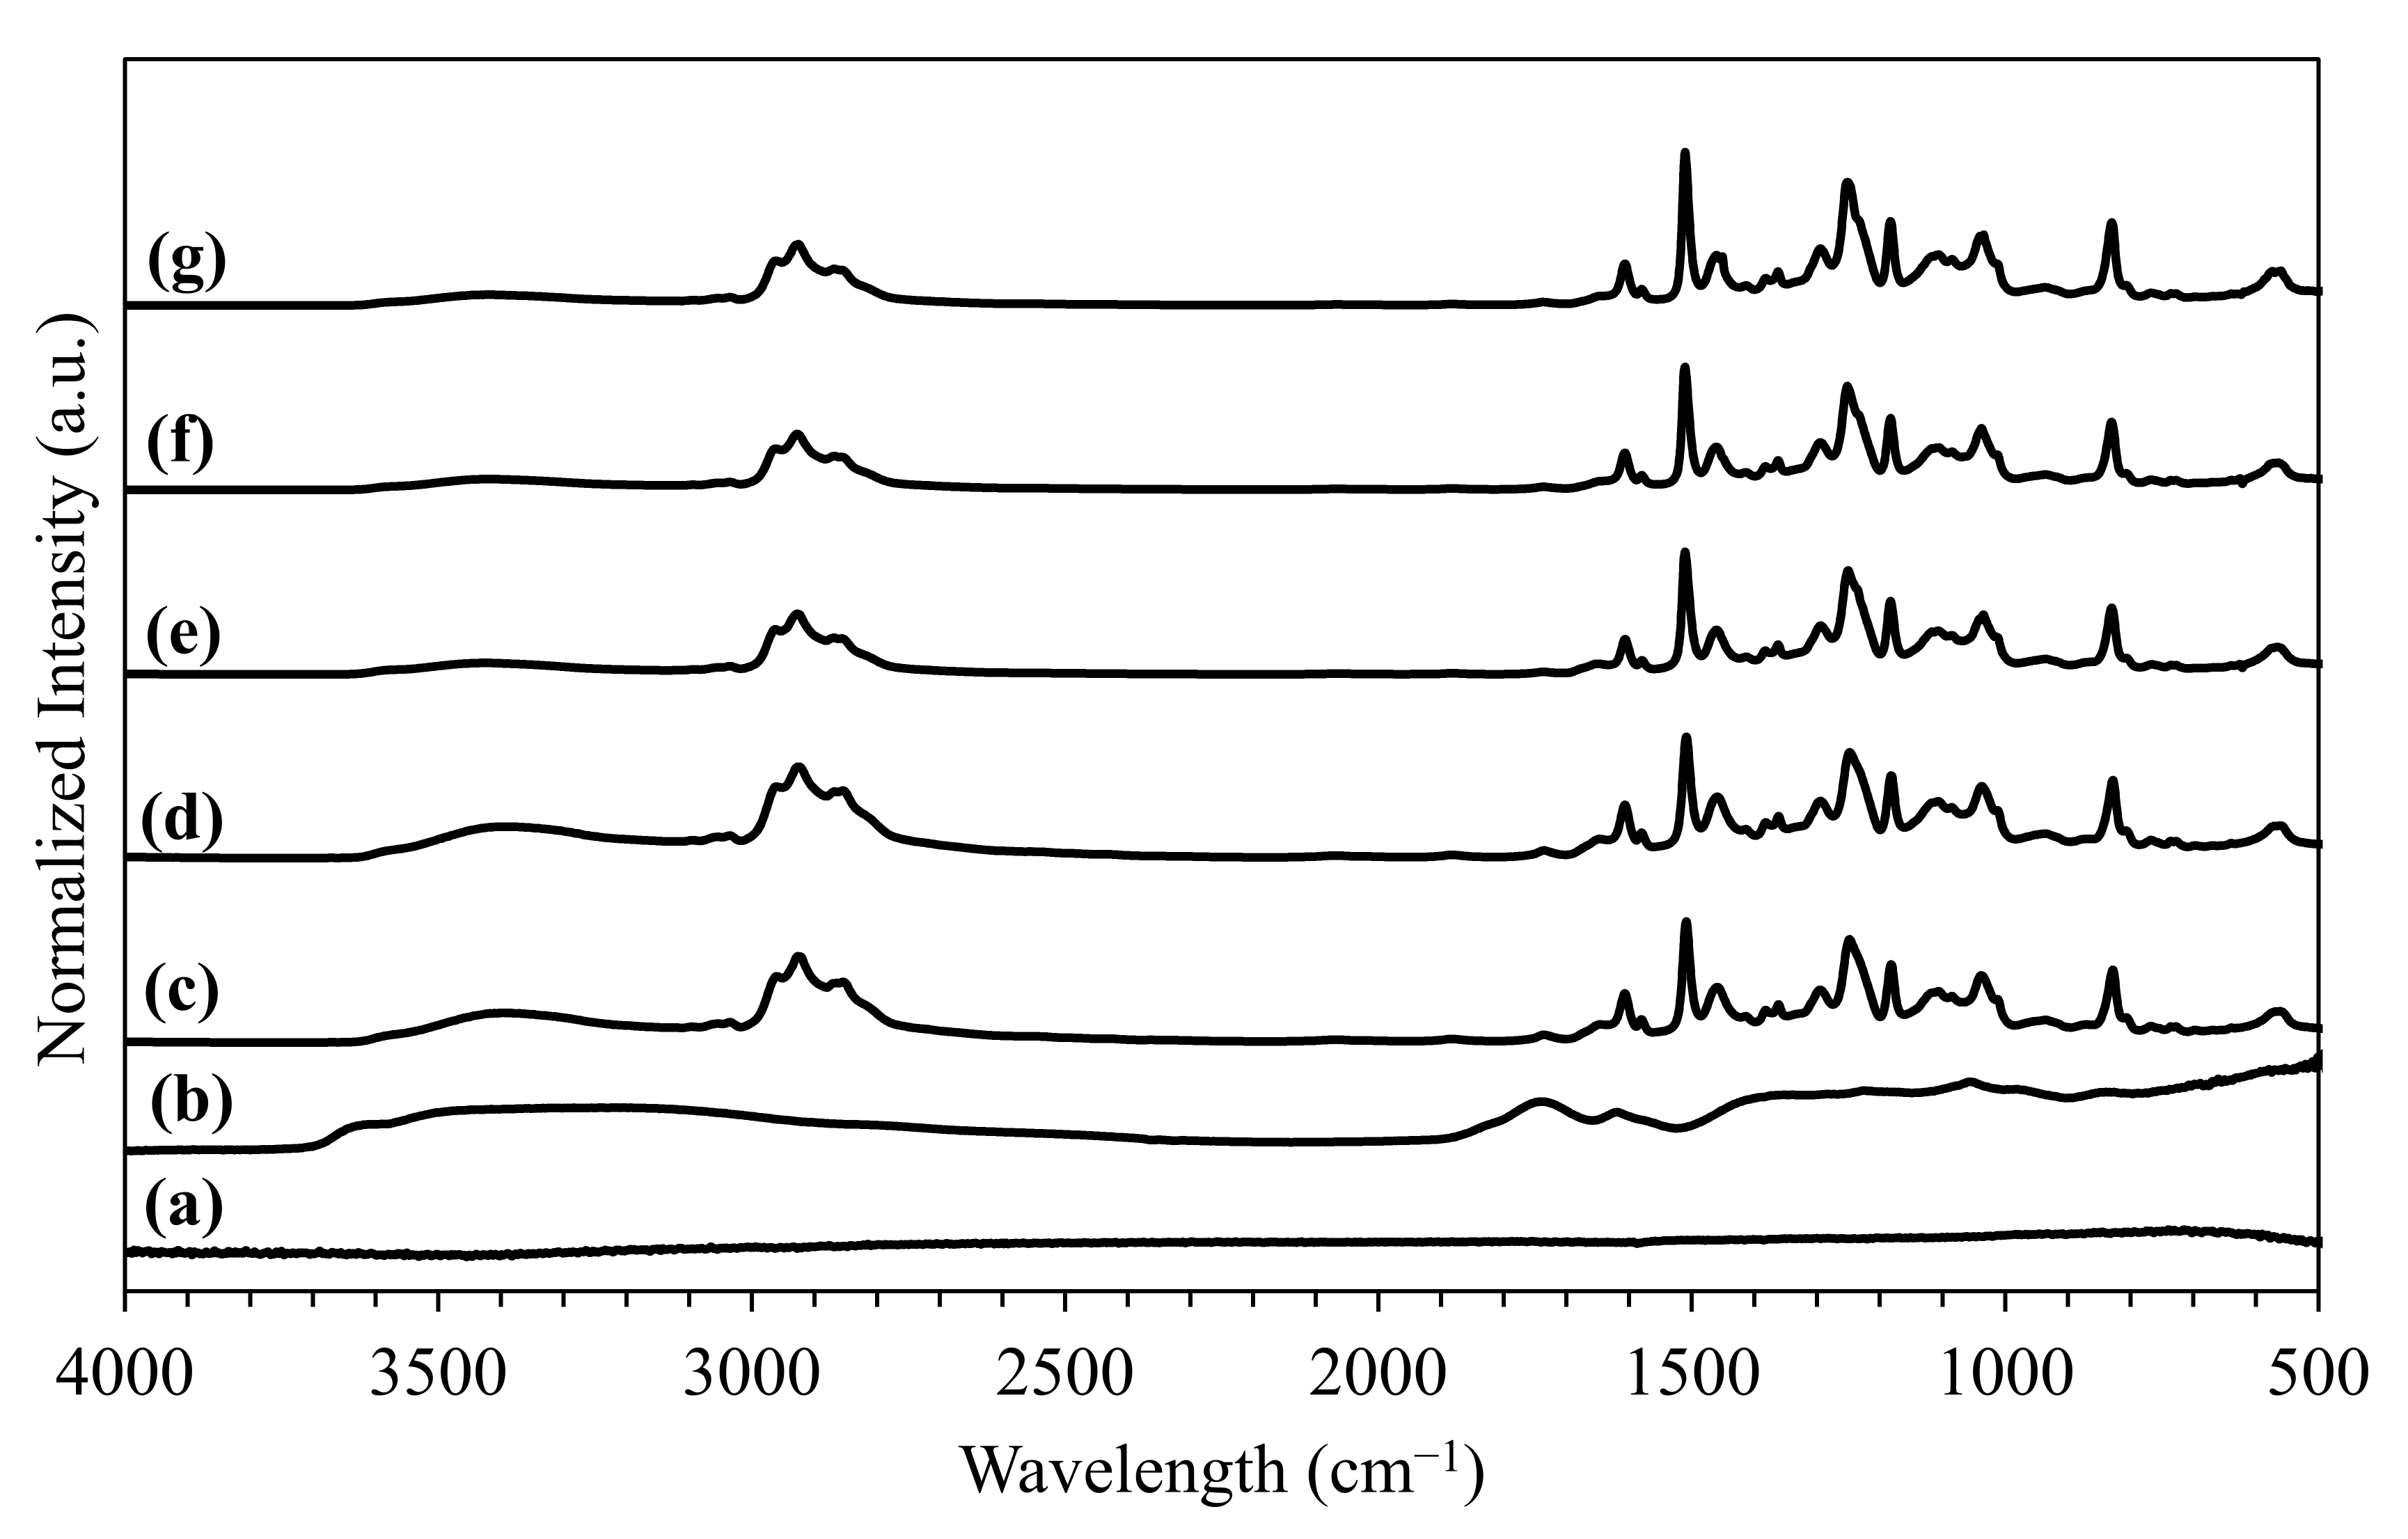
FTIR tests were carried out to confirm oxidation of graphite to GO, and to verify the presence of the functional groups of GO. As shown in Figure 2a, the as-received graphite powder did not display any major IR signatures. The FTIR spectra for GO contained characteristic peaks related to its functional groups as depicted in Figure 2b. A broad IR band at 3400–3600 cm−1 signified O-H stretching and vibration of the hydroxyl group [4] and adsorbed water at 3200 cm−1 [9]. The absorption peak at 1720–1745 cm−1 is attributed to stretching vibration of the carbonyl (C=O)/carboxyl (COOH) groups [27,28]. The peak at 1620–1622 cm−1 is attributed to the vibration of adsorbed water and vibrational contributions from skeletal graphitic domains (unoxidized) that are assigned to C=C bonds [27]. The 1200–1237 cm−1 peak is the C-OH stretching from carboxylic groups, while the peak at 1050–1057 cm−1 is attributed to the skeletal C-O or C-C stretching from carbonyl, carboxylic and epoxy groups [27]. A peak at 640 cm−1 was assigned to an epoxy symmetric ring deformation on the GO sheets [29]. FTIR confirmed that GO was successfully synthesized based on the presence of the oxygen-containing functional groups (O-H, C=O, COOH, C-OH and C-O), as compared with graphite (Figure 2a).
Cured epoxy resin has characteristic spectral bands as shown in Figure 2c, where the FTIR spectra for pure bio-epoxy resin has a broad absorption peak at 3397 cm−1 which coincides with the presence of O-H stretching of hydroxyl groups reported in this range between (3650–3000 cm−1) [30]. The band at 3050 cm−1 is attributed to the C-H stretching vibration of epoxy [31], while 1607, 1580 and 1508 cm−1 are related to the benzene ring of epoxy [32]. The absorption bands at 1248 cm−1 and 935 cm−1 are the symmetric stretching band of the epoxy ring [31] and the C–O band of the epoxy group [33], respectively. A relatively high peak at 827 cm−1 is assigned to the aromatic C-H (phenyl) out-of-plane bending [34].
FTIR spectroscopy was also used to confirm interaction between the GO reinforcement and the bio-epoxy matrix. Initially, FTIR spectra were obtained for epoxy samples with up to 0.6 wt.% GO; however, since the GO signature was not present in the epoxy matrix at these GO levels, an additional bio-epoxy/1.2 wt.% GO sample was produced to illustrate the effects of high filler content. Similarly, the results did not show any perceptible differences in the absorption peaks. This apparent effect relates to the small amounts of GO in the epoxy resin even at 1.2 wt.% GO. The broad band in the range of 3200–3500 cm−1 for epoxy is shown in Figure 2c. When the composite contained GO above 0.3 wt.%, this range visibly broadens even further and the intensity of absorption bands decrease. In general, both O-H (hydroxyl groups) and -COOH (carboxylic groups) stretching bands in GO are sensitive to hydrogen bonding which can result in a shift to a lower wavenumber. For example, the IR band at 3424 cm−1 for GO shifts to a lower wavenumber of 3419–3418 cm−1 for composites that contain more than 0.2 wt.% GO. The peak broadening, reduction in intensity and peak shifting suggests exchange between GO oxygen containing functional groups and epoxy hydroxyl groups through hydrogen bonding [29,35]. Reports on the role of oxygen containing functional groups located on the edges and basal plane of the GO surfaces and the epoxy hydroxyl groups are known [36]. Careful examination of the IR bands in the range 3383–2871 cm−1 resulted in small but measurable shifts for the –OH groups of the epoxy resin, GO, and/or residual water contributions. For instance, Rajabi et al. [31] suggested the range of absorption bands of pure epoxy between 3395–2874 cm−1 shifted slightly to lower wavenumber 3383–2871 cm−1 for epoxy containing 0.5 wt.% GO. In the current study, for 0.3–1.2 wt.% GO composites, two peaks 3096 cm−1 and 2926 cm−1 were observed to shift slightly to lower wavenumber values 3094 cm−1 and 2924 cm−1, respectively. The shift is not visible for 0.2 wt.% GO possibly due to its low content compared to epoxy. Similarly, a peak in GO at 1738 cm−1 corresponding to the carboxylic group, is not present in the GO composites which suggests hydrogen bonding between the GO sheets and epoxy [29]. It can be inferred that shifts in the IR spectral bands of the hydroxyl groups relate to changes in adhesive interactions through hydrogen bonding within the resin phase along with the minor GO additive component. It will be shown that GO affects the adhesive interactions of such epoxy composites in accordance with the change in the mechanical properties (vide infra).
3.2. Scanning Electron Microscopy Analysis (Powders)
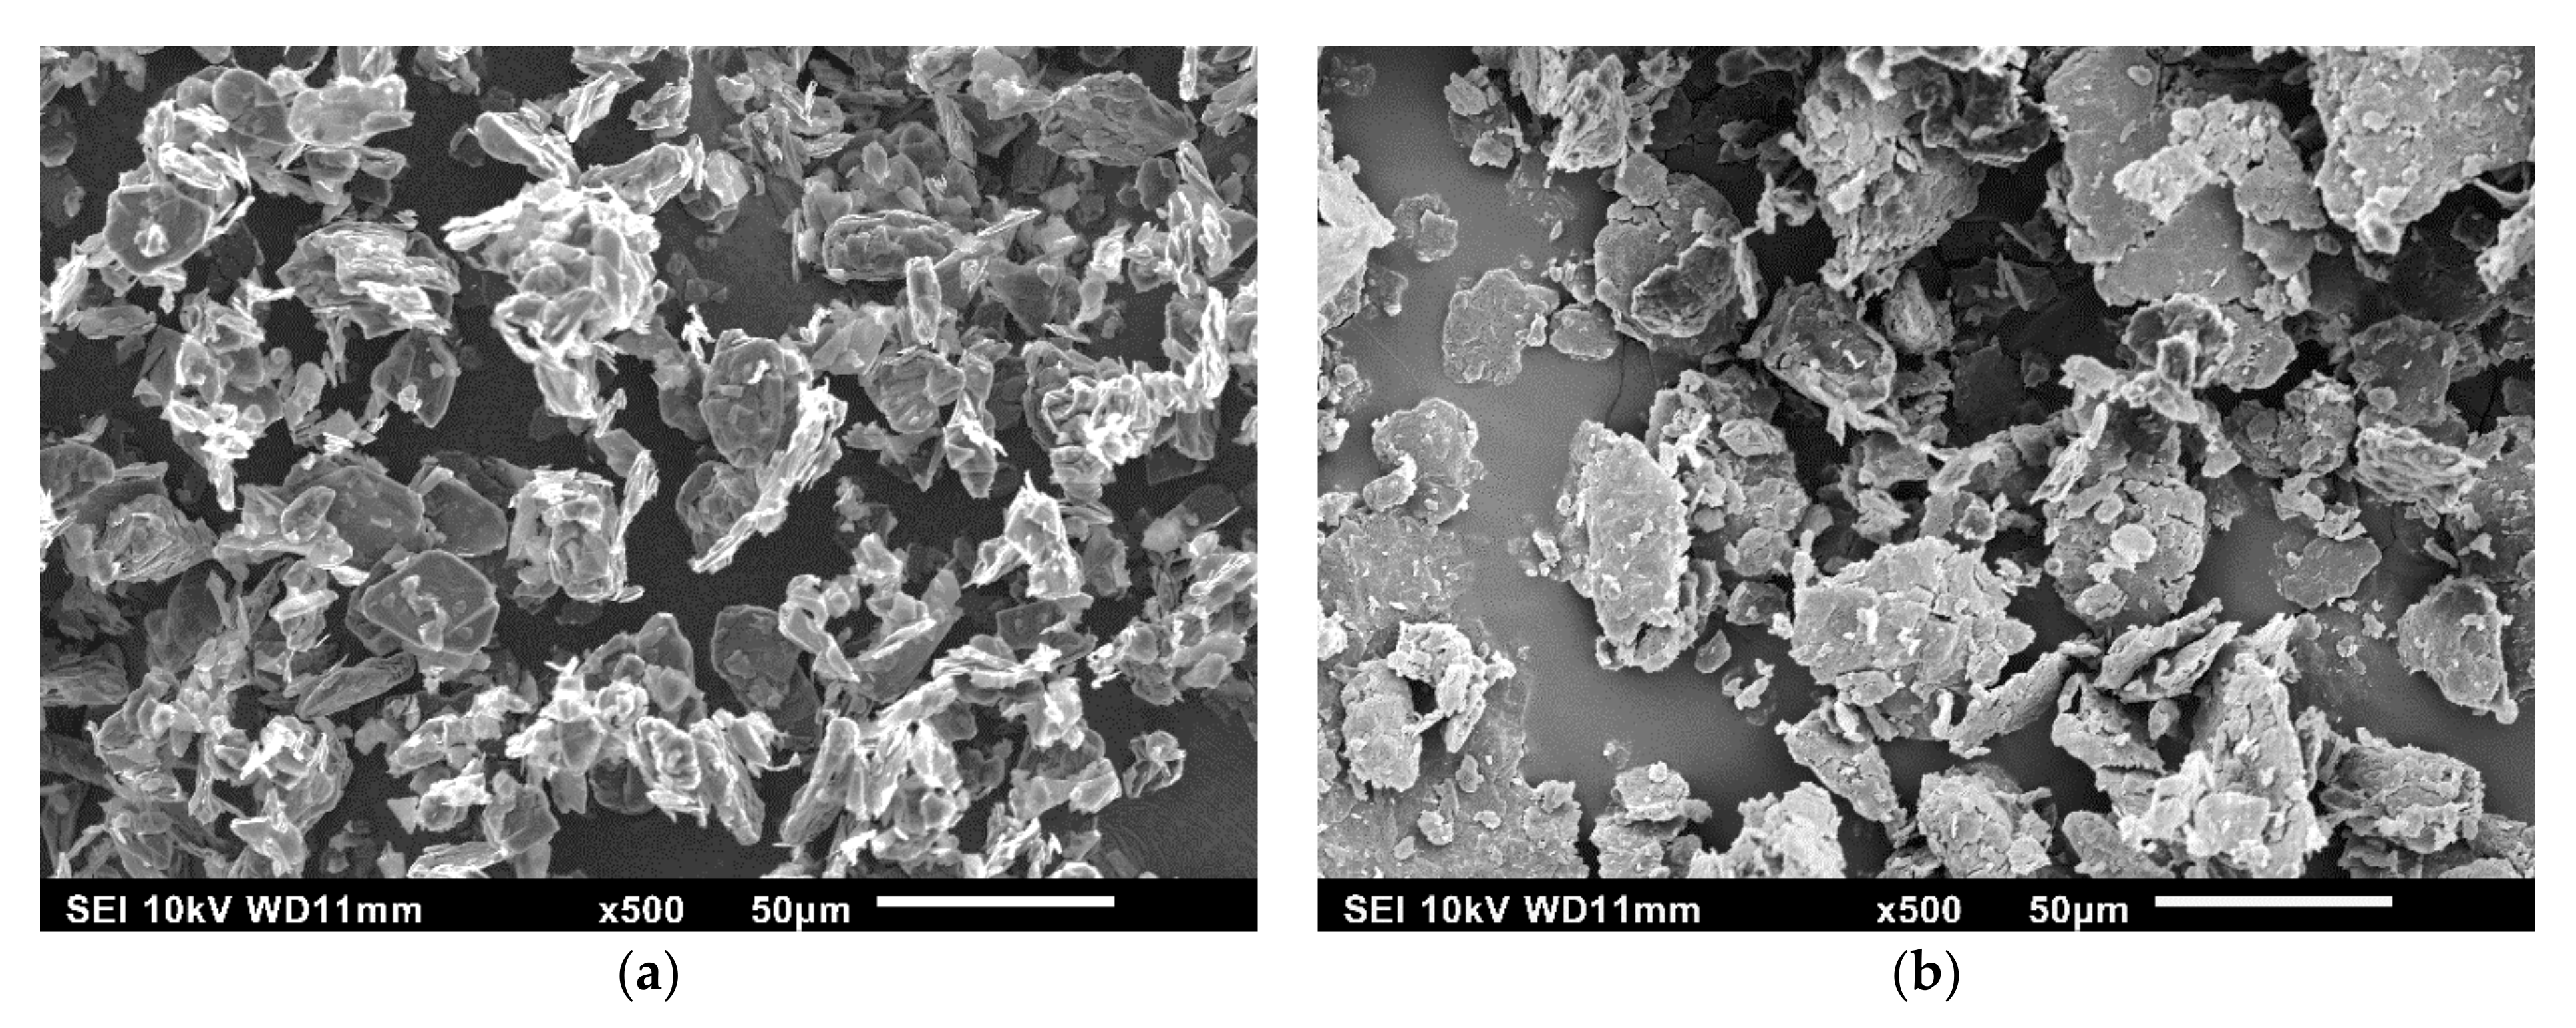
SEM micrographs of as-received natural graphite powder and synthesized GO sheets are shown in Figure 3. In Figure 3a, the graphite appears as platelet structures, where some have smooth, rounded edges stacked together that form solid materials. The graphite flakes have width sizes below 44 μm and a thickness of several micrometers. After chemical oxidation treatment, the GO product shows multi-stacked sheets having irregular shapes, as shown in Figure 3b. During sonication, the GO flakes were exfoliated into thinner multi-stacked sheets. By comparison, after sonication and drying of the GO material, there is a trend to reassemble and form tightly packed layers of thicker GO clusters (many multi-stacked sheets). In the literature, this is referred to as “re-packing” or “re-stacking” of GO sheets due to the oxygen domains on the graphene basal plane [37] from the oxidation treatment. In contrast, graphite flakes do not have spaces between the layers as they do not have functional groups. Functional groups make the GO sheets negatively charged. Dispersing GO in a polar solution such as water produces a stable, colloidal GO solution dispersed throughout the solution. When isolating the GO powder from water (a polar solvent) by centrifuge, filtering or sonication, the removal of water between the GO sheets tends to re-stack several GO sheets on top of each other. To ensure effective dispersion of GO in the epoxy resin, re-stacking of GO sheets should be avoided [15]. It has been suggested to mix the GO in a solvent and further transfer into the epoxy resin to prevent re-stacking and agglomeration as the epoxy can act as a ‘spacer’ [38].
3.3. Transmission Electron Microscopy Analysis
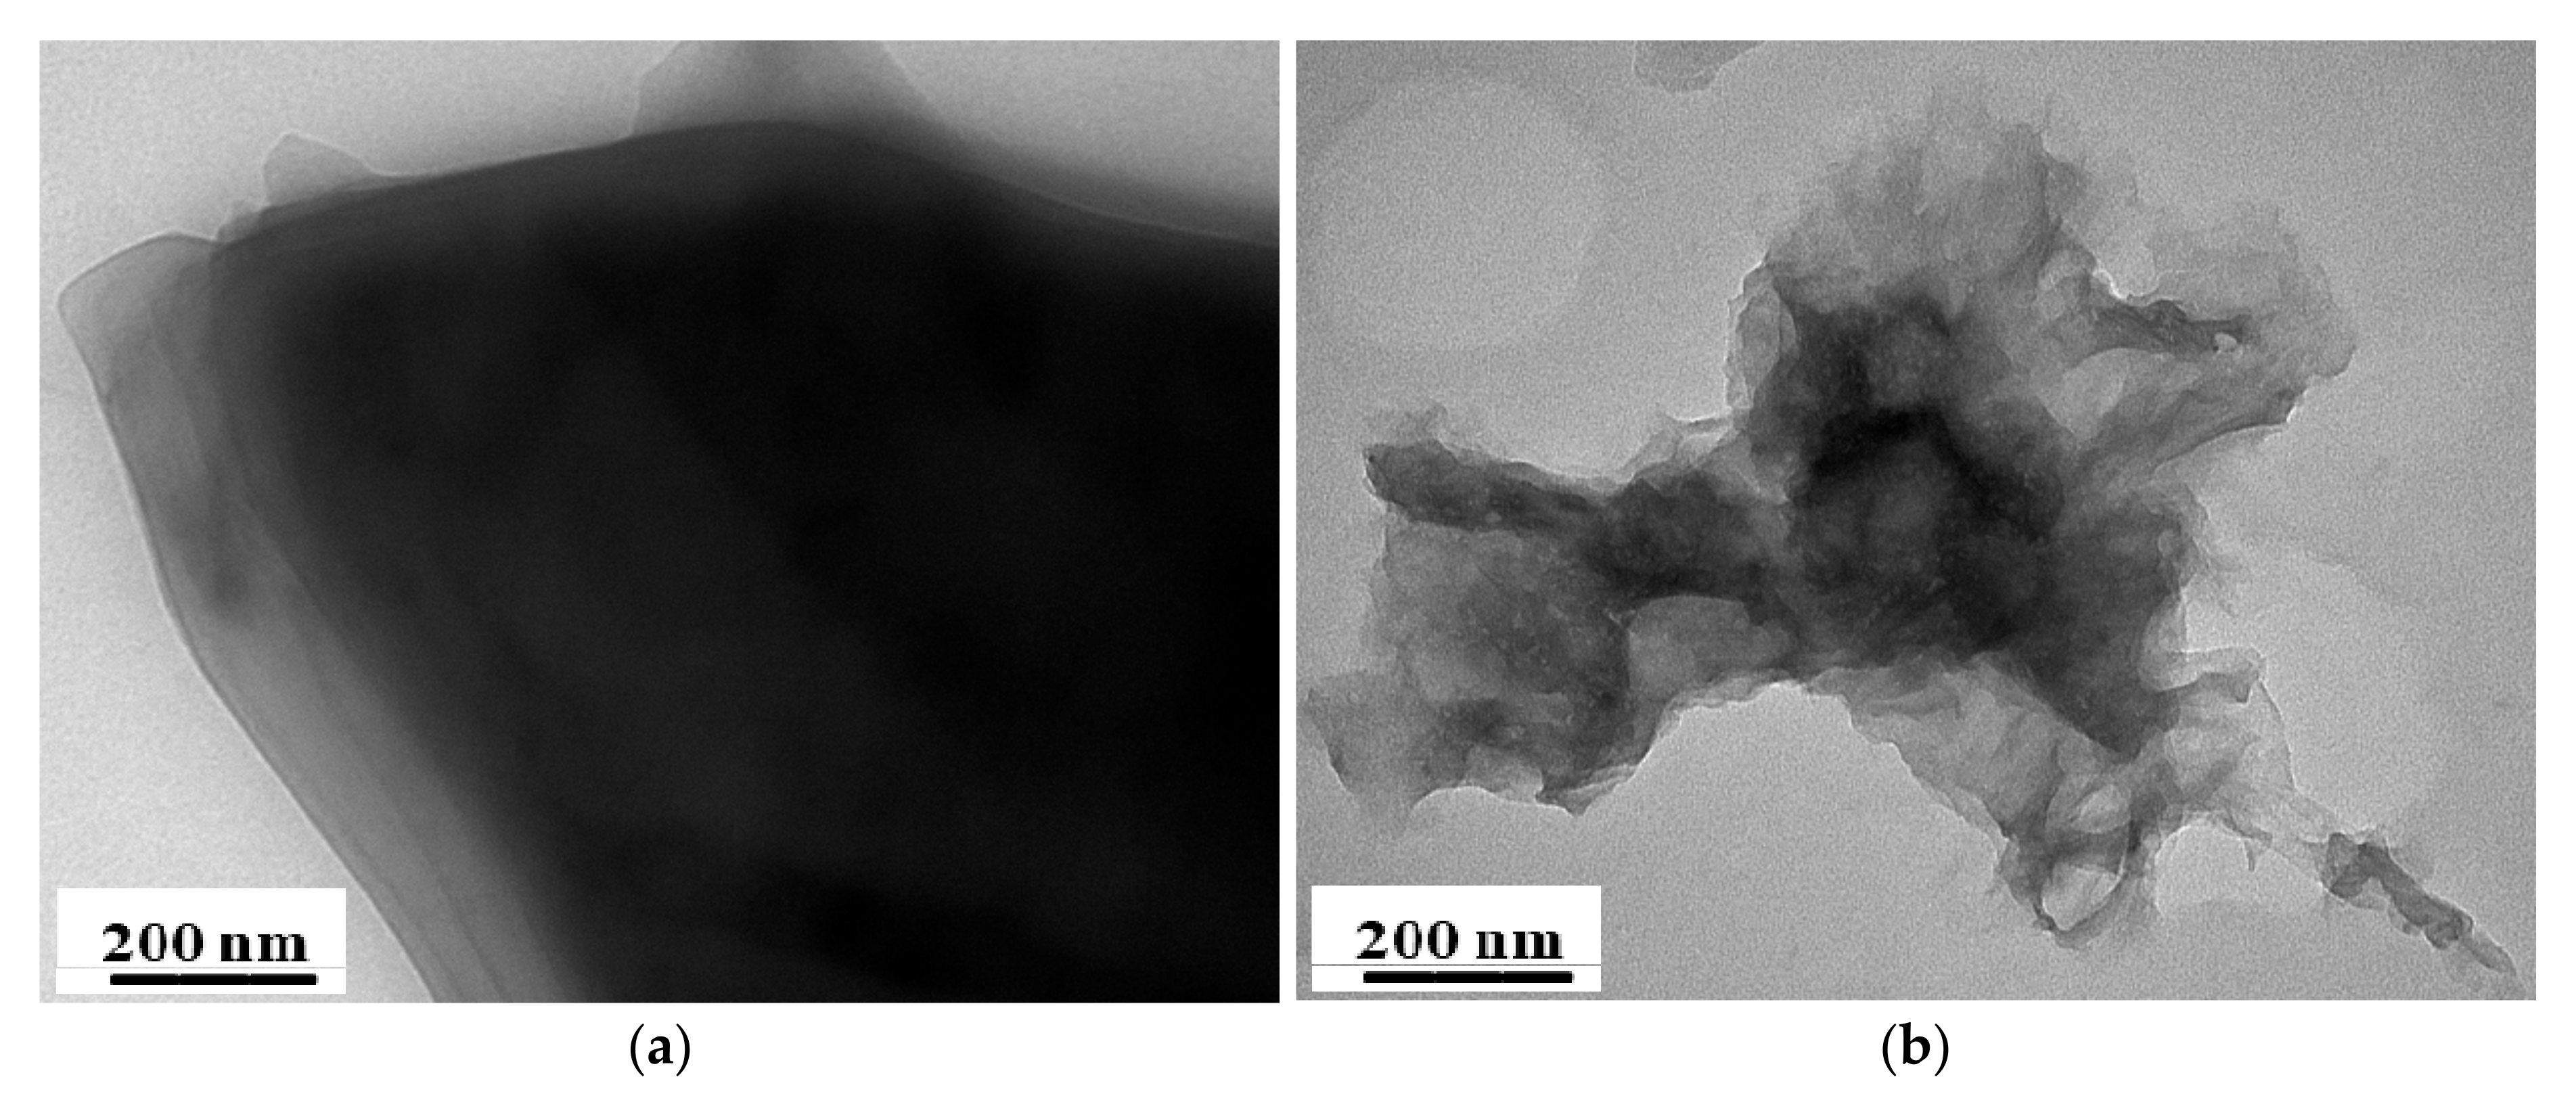
TEM was used to visualize the changes in microstructure of GO and its composites. Figure 4a shows the TEM image of the starting graphite flake material. Graphite is a collection of multiple layers of individual graphene sheets stacked on top of each other. The graphite flake shows multi-layers along the edges as depicted by the lighter color. Figure 4b shows a multitude of exfoliated, folded, and wrinkled GO sheets that were initially, dispersed in acetone, sonicated and dried. The GO sample revealed different levels of transparent sheet-like arrangements characteristic of GO. After sonication and drying, the GO sheets tend to re-stack on top of each other forming multi-layers. The thickness of the graphite is much larger than the thickness of the GO sheets. This can be observed from the transparency of the exfoliated GO sheets, as compared to the opaqueness of the graphite since the beam of electrons cannot penetrate thick sections. The different shades from transparent to black (denser regions) for the GO suggest single to several GO sheets are stacked on top of each other, respectively.
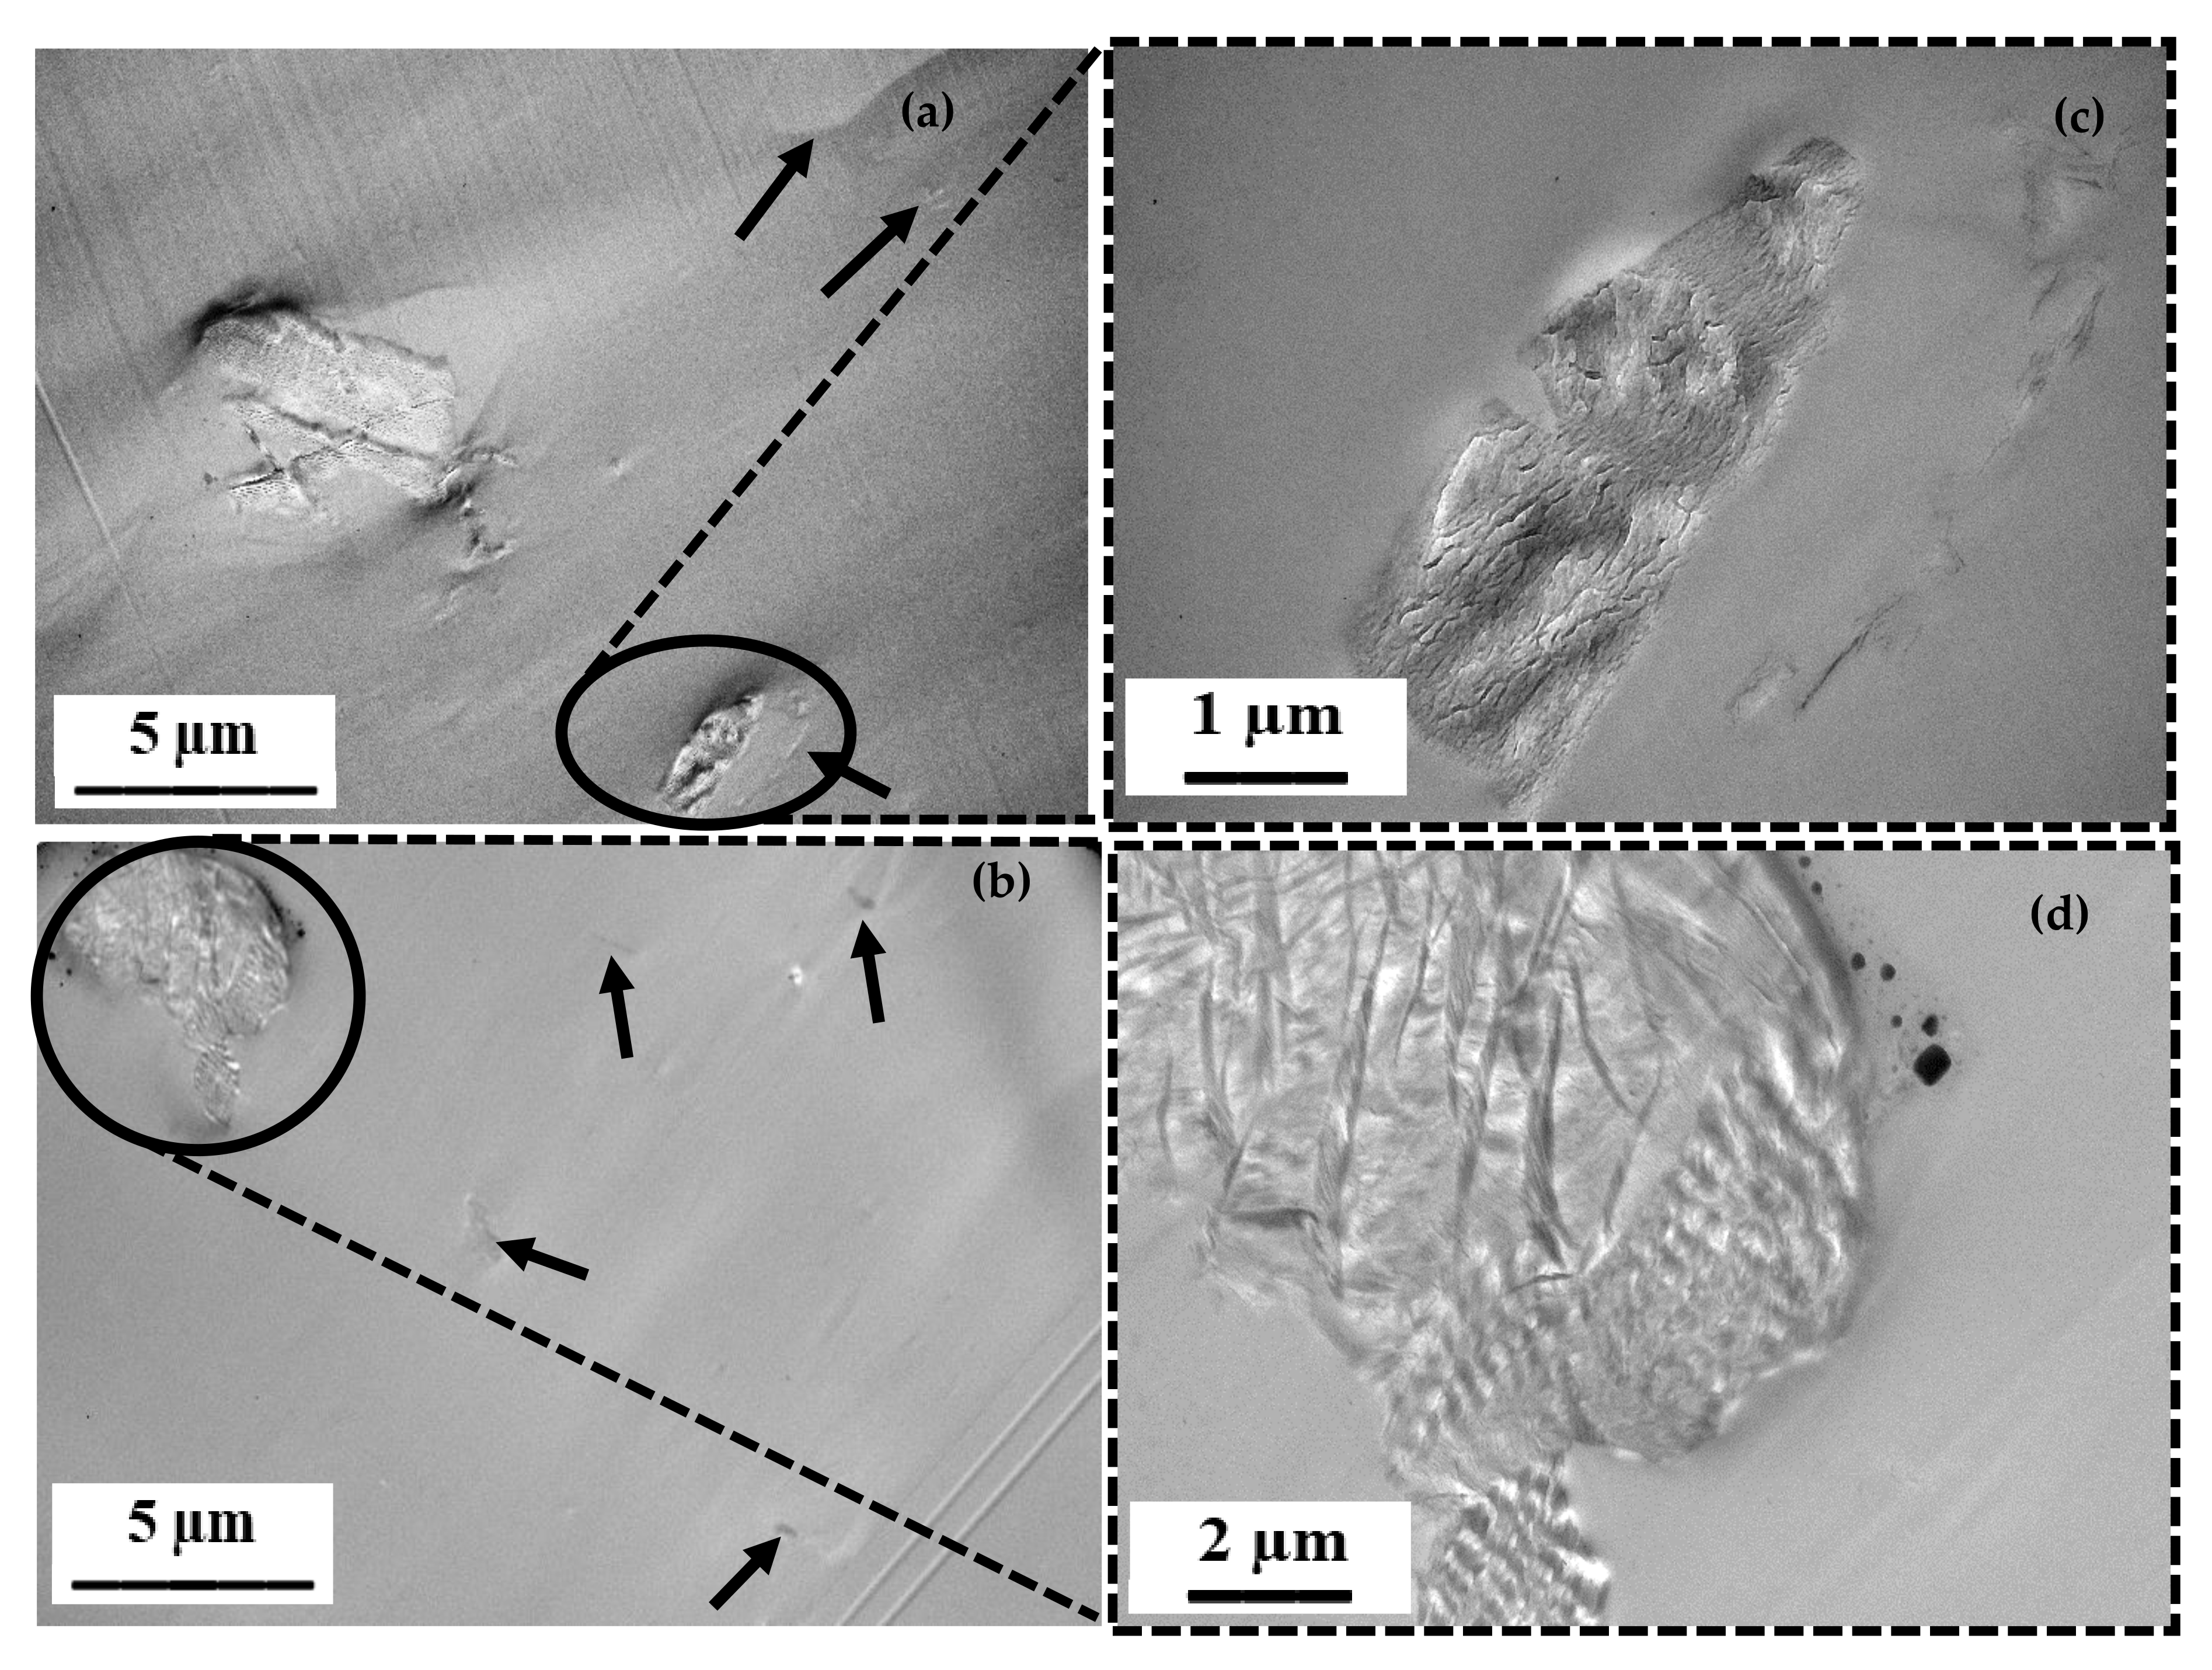
TEM was conducted on the composite materials at low magnification to determine the dispersion of GO sheets within the epoxy matrix. As shown in Figure 5a,b, the GO was randomly dispersed throughout the cured matrix (black arrows indicate small areas with GO sheets). The GO is visible as flat sheets when positioned longitudinally to the TEM cut surface, and as thin lines when they are transverse to the surface. Although some areas appear to have single GO sheets, larger surface area masses may have aggregated GO sheets. After sonication of GO in acetone, the mixture is poured into the epoxy resin, stirred and the acetone evaporated. After pouring the mixture into the molds, it is possible that some individual GO sheets revert back to a stacked sequence before full cure of the epoxy as a result of strong van der Waals interactions. Fillers at the nano-level have been reported to be homogeneously dispersed but can in fact be grouped into structures at the micron scale level [39]. This phenomenon can manifest or be more prominent for higher loadings of filler. At higher magnifications in Figure 5c,d, the GO appears to be well bonded with the epoxy matrix suggesting a good interface/affinity between the two materials.
3.4. Scanning Electron Microscopy Analysis (Fractured Surfaces)
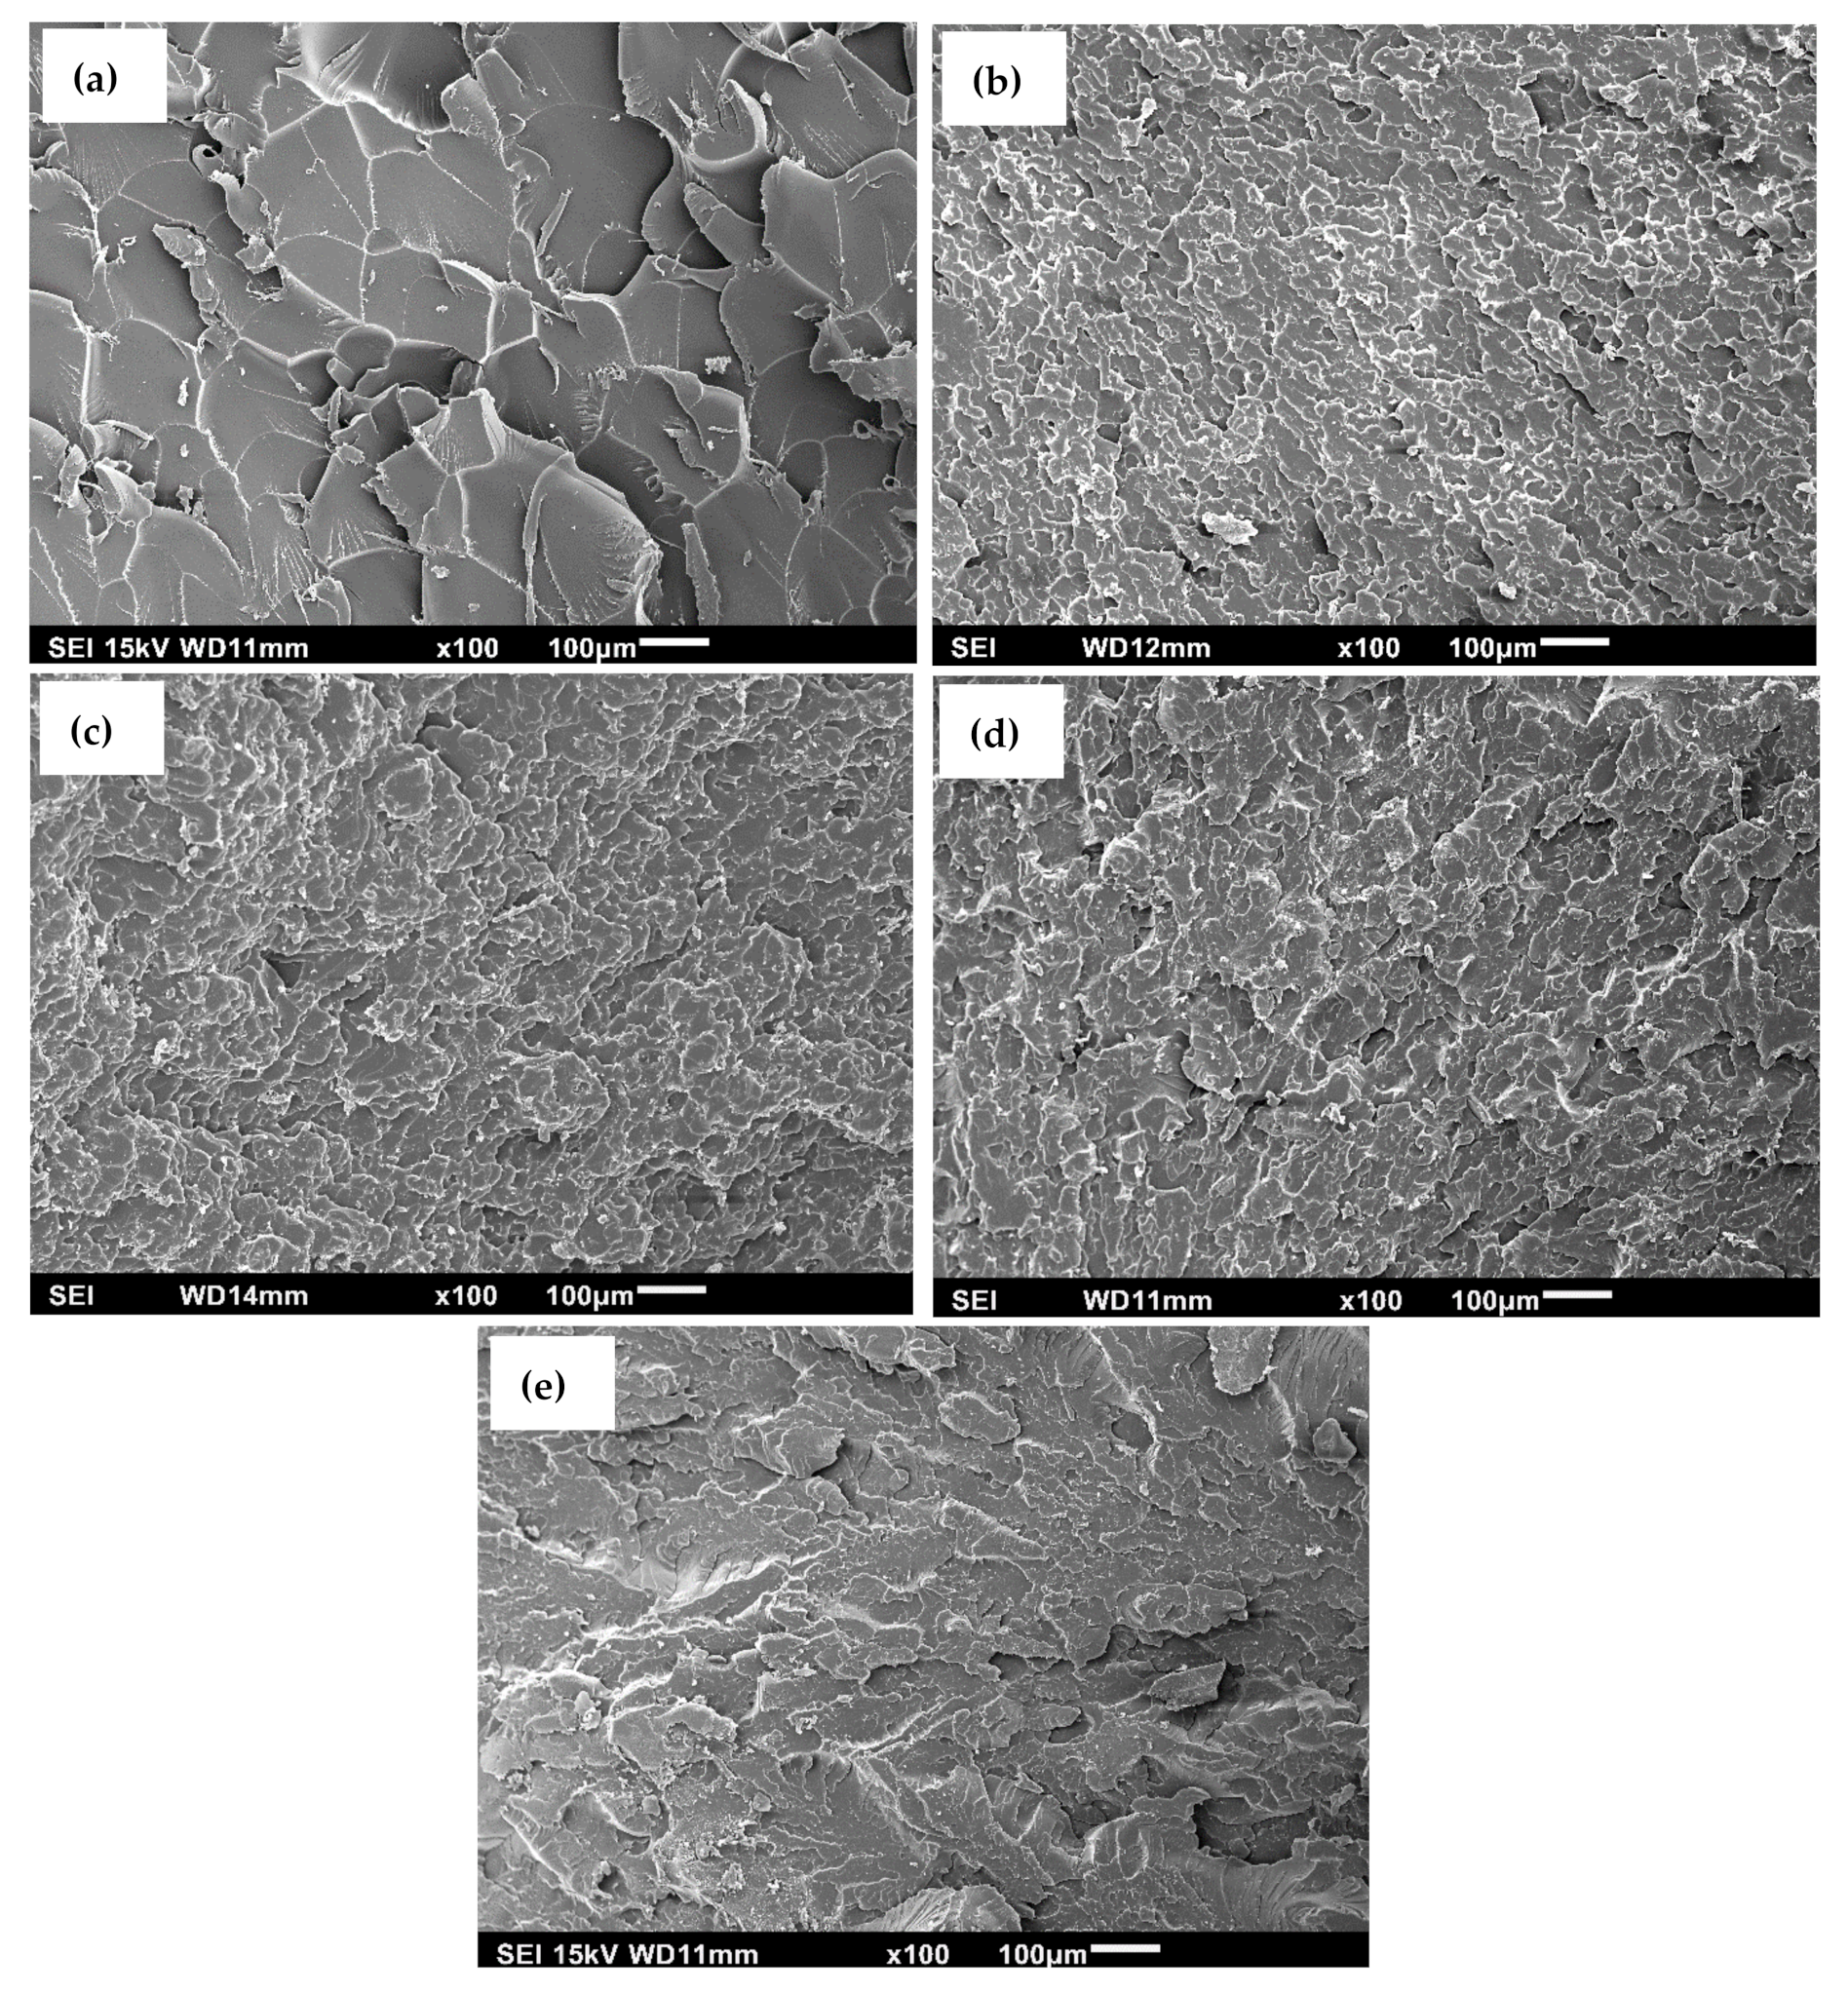
Figure 6 shows the tensile fractured surfaces of pure bio-epoxy and the bio-epoxy containing 0.1, 0.2, 0.3 and 0.6 wt.% GO. The pure bio-epoxy in Figure 6a has a fractured surface with a smooth, mirror-like appearance that is typical of brittle fracture mechanism for epoxy materials. The flat planes in polymers indicate weak, low resistance to crack initiation and propagation. With the addition of GO (Figure 6b–e), the fractured surfaces are altered. By visual inspection, the surfaces of the GO composites contain rougher, reduced flat failure surfaces inhibiting fracture. The morphology of a rough surface fracture containing many ridges is depicted by the white regions that are representative of a ductile fracture mechanism. It has been reported that when rigid fillers are added to epoxy, the toughening mechanisms are crack deflection, plastic deformation and crack tip pinning [40]. There is no obvious trend in morphology change as the content of GO is increased. The SEM micrographs are similar to a previous study where GO was alleged to increase the toughness of the composite due to the increased surface roughness of the fractured surface [4]. The surfaces are relatively similar throughout the fracture which may indicate a good dispersion of GO within the matrix. However, it is difficult to view the dispersion of GO sheets with SEM in the bio-epoxy matrix. One method proposed in the literature was to etch the composite with sulfuric acid to reveal the location of the GO sheets [41]. At 0.6 wt.% GO (Figure 6e), the SEM image appears to show slightly more micro-cracks than at lower amounts of GO which may contribute to the observed strength reduction. In a similar study, an epoxy composite containing 0.7 wt.% GO showed an increase in flaws, which is attributed to early fracture of the composite [27].
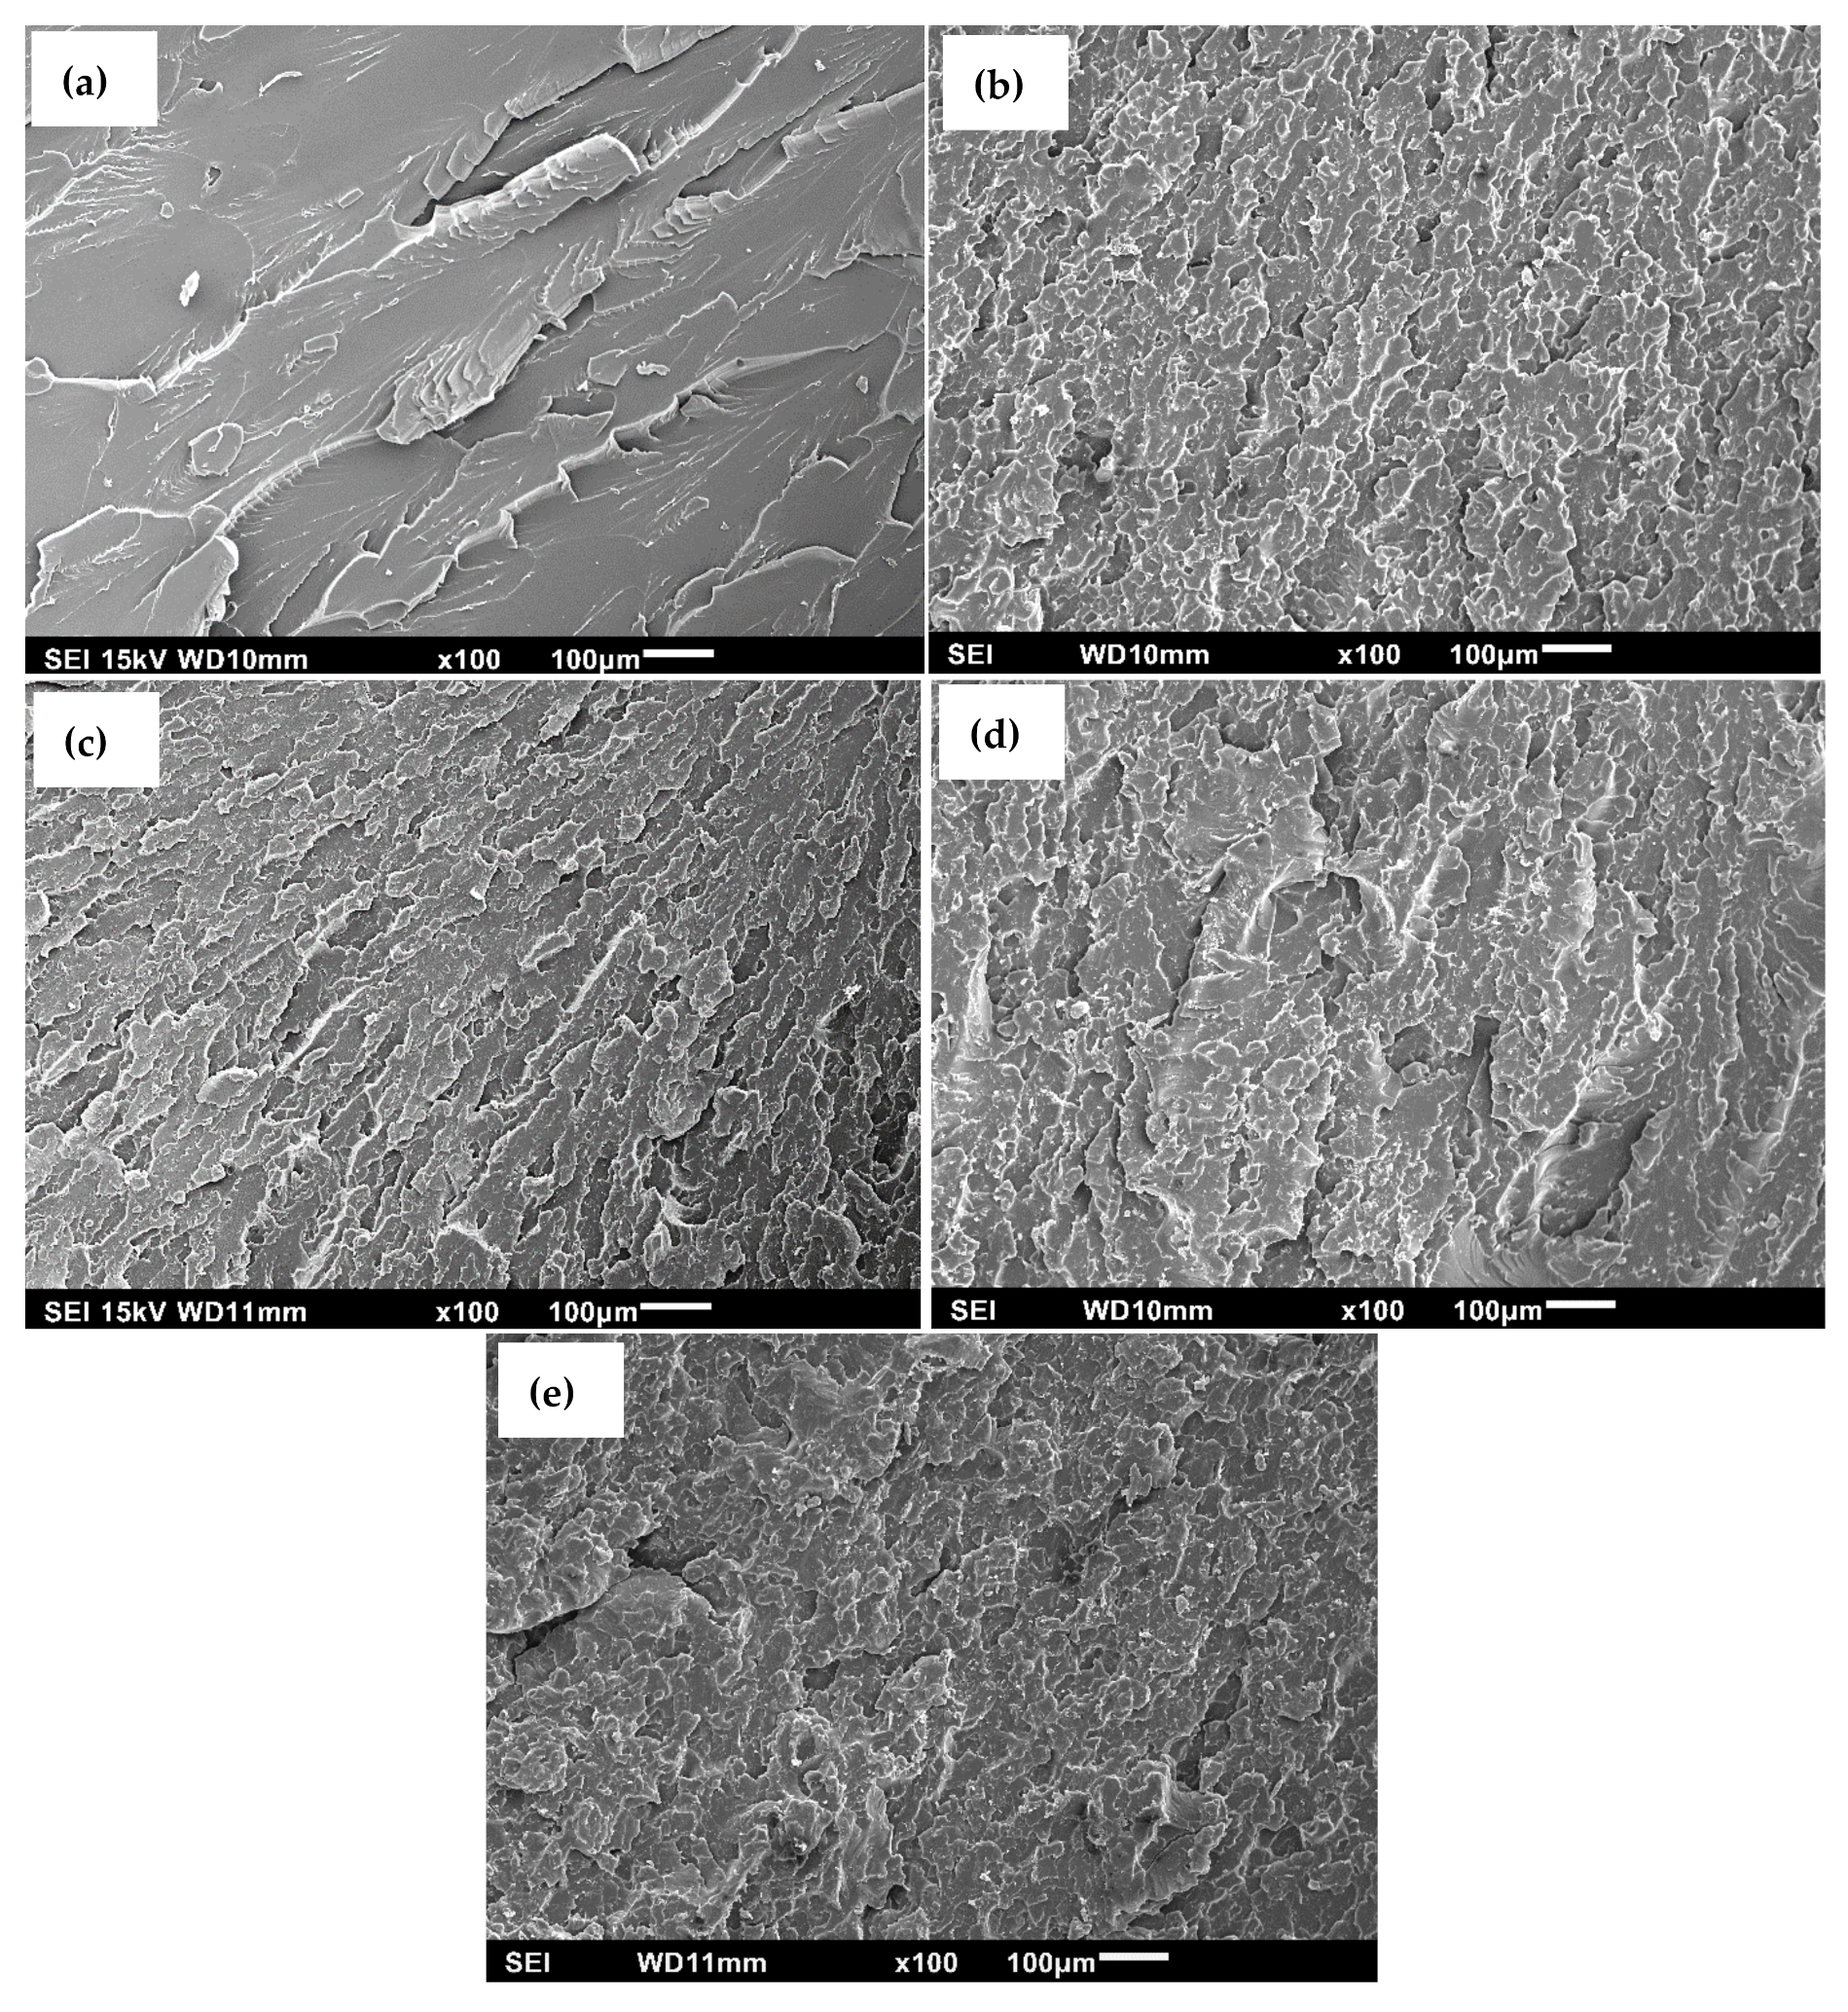
Figure 7 shows the flexural fractured surfaces of pure bio-epoxy and the bio-epoxy containing 0.1, 0.2, 0.3 and 0.6 wt.% GO. Similar to the tensile fractures, the bio-epoxy fractured surface is identified as flat regions, which are consistent with reduced ductility and brittle fracture mechanism of epoxy resins, as shown in Figure 7a. When GO was added (Figure 7b–e), the deformation mechanism is different compared to the pure-bio-epoxy such that the fractured surfaces appear more irregular and contain additional faceted features. The additional white regions are indicative of increased plastic deformation of the matrix that reveals a more ductile fracture. During loading, cracks initiate and move through the weaker bio-epoxy matrix until they are interrupted by GO. Then, the cracks deviate in different directions and planes thus influencing the fracture mechanism. The increase in the number of cracks is an indication that the deformation mechanism requires a larger applied load for failure to occur leading to a toughness mechanism with improved flexural strength. There is not an apparent tendency to morphology transition as the GO content is increased. To some extent the fractured surface of bio-epoxy containing 0.6 wt.% GO tends to have larger micro-cracks and voids than at lower GO loadings, which may be an indication of its filler content limit.
3.5. Mechanical Properties
As shown in Figure 1, the non-reinforced cured bio-epoxy resin is light in color. The graphite powder was black in color, while the synthesized GO powder was brown due to the moderate level of oxidation treatment which imparts hydrophilic character to the GO material. However, when the GO powder was mixed with the bio-epoxy resin, the color of the final composites appeared black at all GO filler loading levels (0.1, 0.2, 0.3 and 0.6 wt.%). This phenomenon was also observed by Shen et al. (2013) for epoxy composites containing 0.5–2 wt.% GO [42]. The observed color change (brown to black) is consistent with the formation of covalent and/or physical adhesive interactions between GO and the epoxy resin upon formation of the epoxy/GO composite material, in agreement with previous reports.
Table 2 and Table 3 provide a literature survey on the tensile and flexural mechanical properties of synthetic epoxy/GO composites, respectively. The review targeted synthetic epoxy resins and GO sheets produced by oxidation and exfoliation of graphite, in contrast to other forms of GO (e.g., functionalized GO and chemically or thermally reduced GO (rGO)). To extract data points directly from published article figures, an open source Web Plot Digitizer, version 4.1 [43], was used. In addition, for the data in reference [44], the GO loadings were based on parts per hundred (phr) rather than weight percentage (wt.%) additions. In order for the data in Table 2 to be consistent, a personal communication with the corresponding author showed the conversion used was wt.% = (phr/(phr + 100 + 5)) * 100. Therefore 0.05, 0.1, 0.2 and 0.3 phr corresponds to 0.047 (~0.05), 0.095 (~0.1), 0.190 (~0.2) and 0.285 (~0.3) wt.%. The tabulated values represent an increase (%) or in some cases a decrease (%) in the property. In general, the data suggests that, as the GO loading increased, the tensile and flexural properties tended to increase. Loadings of 0.1 wt.% to 2.0 wt.% have the greatest level of improvement in tensile properties while 0.1 wt.% to 1.5 wt.% GO contents appear to improve the flexural properties. In general, the improvements were attributed to several factors: the high modulus and aspect ratio of the GO sheets, good dispersion/exfoliation of GO sheets in the epoxy resin, and a strong interfacial bonding/compatibility between the epoxy resin and the GO functional groups. The formation of favorable adhesion between GO and the epoxy resin supports effective load transfer from the epoxy matrix to the GO sheets. Although the presence of GO generally produced positive results on the epoxy matrices, there are differences in the tensile and flexural properties from one study to another. These dissimilarities can be attributed to the oxidation level of GO during preparation which is directly related to its functional groups. A study determined that as the oxidation level increased, higher contents of functional groups were measured [45]. However, an optimum level of oxidation has not been established to date for such epoxy/GO composites.

Table 2.
A review summary of tensile properties of past research with synthetic epoxy/GO composites.
Table 2.
A review summary of tensile properties of past research with synthetic epoxy/GO composites.
| Percentage (%) Increase or Decrease (↓) in Tensile Properties Based on GO Filler Content | |||||||||||||||
|---|---|---|---|---|---|---|---|---|---|---|---|---|---|---|---|
| Property | GO Filler Content (wt.%) | Ref. | |||||||||||||
| 0.05 | 0.10 | 0.15 | 0.20 | 0.25 | 0.3 | 0.4 | 0.5 | 0.54 | 0.7–0.8 | 1.0–1.2 | 1.5 | 2.0 | 3.0 | ||
| a TS b TE | - - | 7 8 | - - | 9 20 | - - | - - | - - | 11 24 | - - | - - | 14 24 | - - | - - | - - | [4] |
| a TS b TE | 10 7 | 6 3 | - - | 4↓ 2↓ | - - | 18↓ 11↓ | - - | - - | - - | - - | - - | - - | - - | - - | [43] |
| a TS | - | - | - | - | 22 | - | - | 30 | - | - | 42 | 31 | - | - | [46] |
| a TS b TE | - - | - - | - - | - - | - - | - - | - - | 6 7 | - - | - - | 11 11 | 21 17 | 50 20 | - - | [41] |
| a TS b TE | - - | - - | - - | - - | - - | - - | - - | - - | - - | - - | 4 2 | - - | - - | 8 11 | [47] |
| a TS b TE | - - | 7 28 | - - | - - | - - | 4 33 | - - | 5 36 | - - | 1 31 | - - | - - | - - | - - | [27] |
| a TS b TE | - - | 35 4 | - - | - - | 28 5 | - - | - - | 22 7 | - - | - - | - - | - - | - - | - - | [48] |
| a TS b TE | - - | - - | - - | - - | - - | - - | - - | - - | 10 25 | - - | - - | - - | - - | - - | [49] |
| a TS b TE | - - | 8 12 | - - | - - | 8 6 | - - | - - | 13 6 | - - | - - | 1 ↓5 | - - | - - | - - | [50] |
| a TS b TE | - - | 21 16 | - - | 68 20 | - - | 105 50 | 168 113 | 116 84 | - - | - - | - - | - - | - - | - - | [51] |
| a TS b TE | - - | - - | - - | 2–16 1–6 | - - | - - | - - | - - | - - | - - | - - | - - | - - | - - | [45] |
| a TS b TE | - - | 7 8 | - - | 9 20 | - - | - - | - - | 11 24 | - - | - - | - - | - - | - - | - - | [52] |
| a TS b TE | - - | 2 3 | - - | 6 6 | - - | - - | - - | 8 8 | - - | - - | 9 10 | - - | - - | - - | [25] |
| a TS b TE | - - | - - | - - | - - | - - | - - | - - | 8 10 | - - | - - | 17 9 | - - | 43 8 | - - | [53] |
| a TS b TE | - - | - - | - - | - - | - - | - - | 22 5 | - - | - - | 35 12 | 3 8 | - - | - - | - - | [54] |
| a TS b TE | - - | - - | - - | - - | - - | - - | - - | 15 5↓ | - - | - - | - - | - - | - - | - - | [55] |
| a TS b TE | - - | - - | - - | - - | - - | - - | - - | 38 7 | - - | - - | 246 27 | 269 39 | 215 47 | - - | [56] |
a TS: Tensile strength; b TE: Tensile modulus.
Table 3.
A review summary of flexural properties of past research with synthetic epoxy/GO composites.
Table 3.
A review summary of flexural properties of past research with synthetic epoxy/GO composites.
| Percentage (%) Increase or Decrease (↓) in Flexural Properties Based on GO Filler Content | ||||||||||||||
|---|---|---|---|---|---|---|---|---|---|---|---|---|---|---|
| Property | GO Filler Content (wt.%) | Ref. | ||||||||||||
| 0.05 | 0.10 | 0.15 | 0.20 | 0.25 | 0.3 | 0.5 | 0.54 | 0.7 | 1.0 | 1.5 | 2.0 | 3.0 | ||
| c FS d FE | - - | 18 9 | - - | - - | 20 10 | - - | 22 11 | - - | - - | 23 12 | - - | - - | - - | [50] |
| d FE | 2 | 51 | 18 | 32 | - | - | - | - | - | - | - | - | - | [57] |
| c FS d FE | - - | 36 21 | - - | - - | - - | 54 35 | 17 15 | - - | - - | - - | - - | - - | - - | [58] |
| c FS d FE | - - | 7 ↓ 2 | - - | 11 ↓ 0 | - - | - - | 47 6 | - - | - - | 1 ↓ 12 | - - | - - | - - | [59] |
| c FS d FE | - - | 3 1 ↓ | - | - - | - - | - - | 9 2 | - - | - - | 15 10 | 14 11 | - - | - - | [60] |
c FS: Flexural strength; d FE: Flexural modulus.
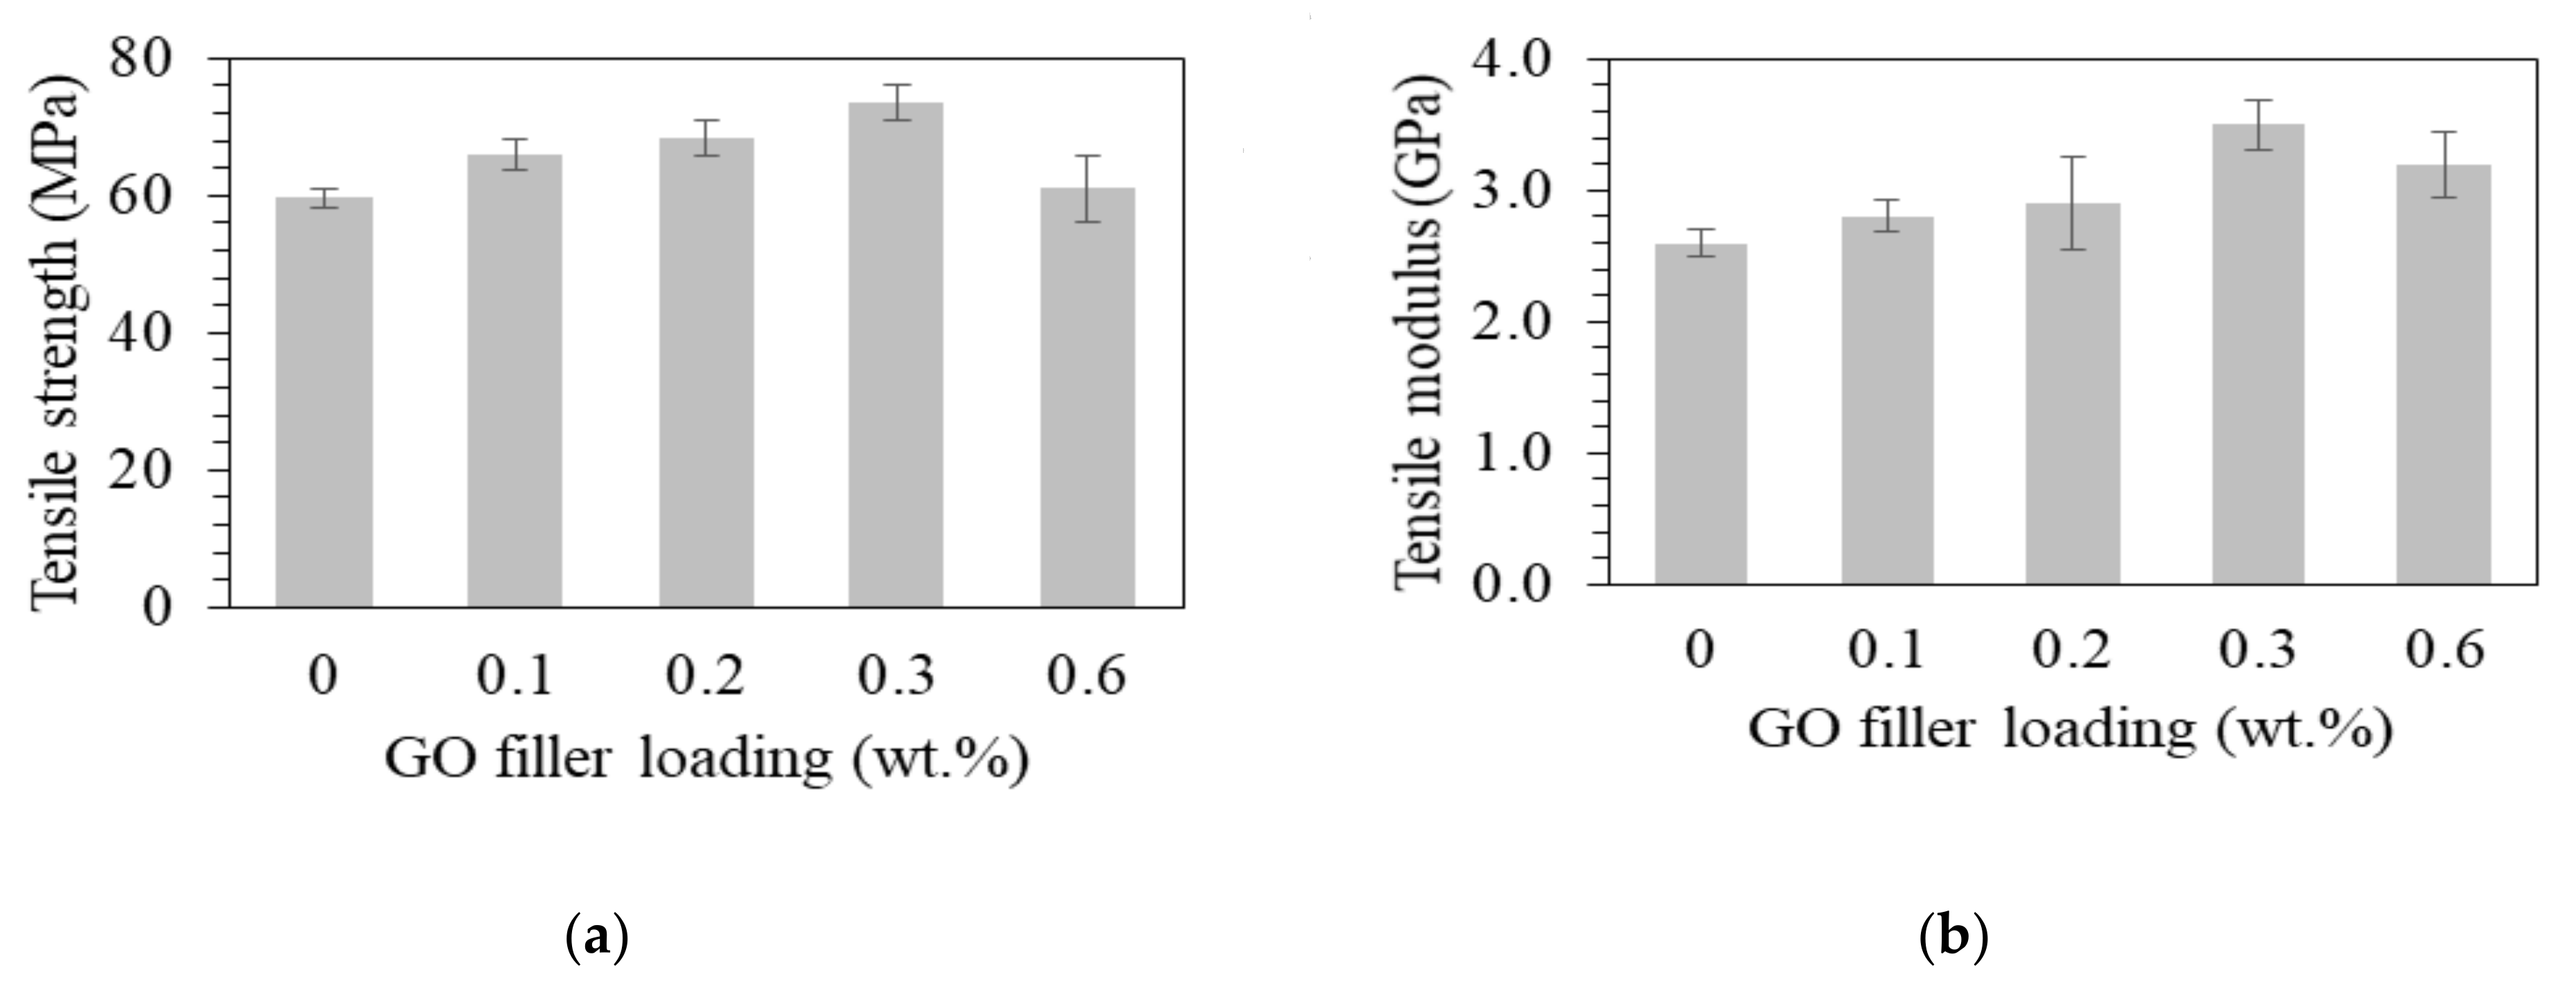
The tensile properties of pure bio-epoxy and bio-epoxy/GO composites reinforced with 0.1, 0.2, 0.3 and 0.6 wt.% GO fillers are shown in Figure 8. The error bars represent the standard deviations. The results show an incremental improvement for both tensile strength and tensile modulus, where the addition of GO compared to the pure bio-epoxy suggests efficient load transfer from the bio-epoxy matrix to the reinforcement. Agglomeration of the GO fillers within the matrix would have tended to reduce the tensile properties. The SEM tensile fractured images of the GO composites exhibited an increase in surface roughness as evidenced by more fractured surfaces when compared to the pure bio-epoxy which suggests improvements in fracture energy [48]. The tensile strength and modulus of the pure bio-epoxy was recorded to be 60 ± 1.4 MPa and 2.6 ± 0.11 GPa, respectively. These results are comparable to values reported by the manufacturer, 62–66 MPa and 2.7 to 3.2 GPa, respectively. The composites reinforced with 0.1, 0.2, 0.3 and 0.6 wt.% GO led to an enhancement in the tensile strength at 11, 15, 23 and 2%, respectively, while the modulus improved by 8, 12, 35 and 23%, respectively, as compared with the pristine bio-epoxy resin. The largest improvement occurred for 0.3 wt.% GO, where the tensile strength increased from 60 ± 1.4 MPa to 74 ± 2.6 MPa, and the modulus from 2.6 ± 0.11 GPa to 3.5 ± 0.19 GPa. The results are comparable to other synthetic epoxy/GO systems. For example, epoxy composites containing 0.25 wt.% GO, improved in tensile strength by 22% [46] and 28% [48]. In another study, the tensile modulus of epoxy composites with 0.3 wt.% GO increased by 33% [27]. Similar to this study, Bari et al. [51] reported similar behavior in tensile properties where greater than 0.4 wt.% GO reduced the properties of the epoxy composite. The low level of GO reinforcement added to the bio-epoxy produced substantial results, as compared to conventional filler materials.
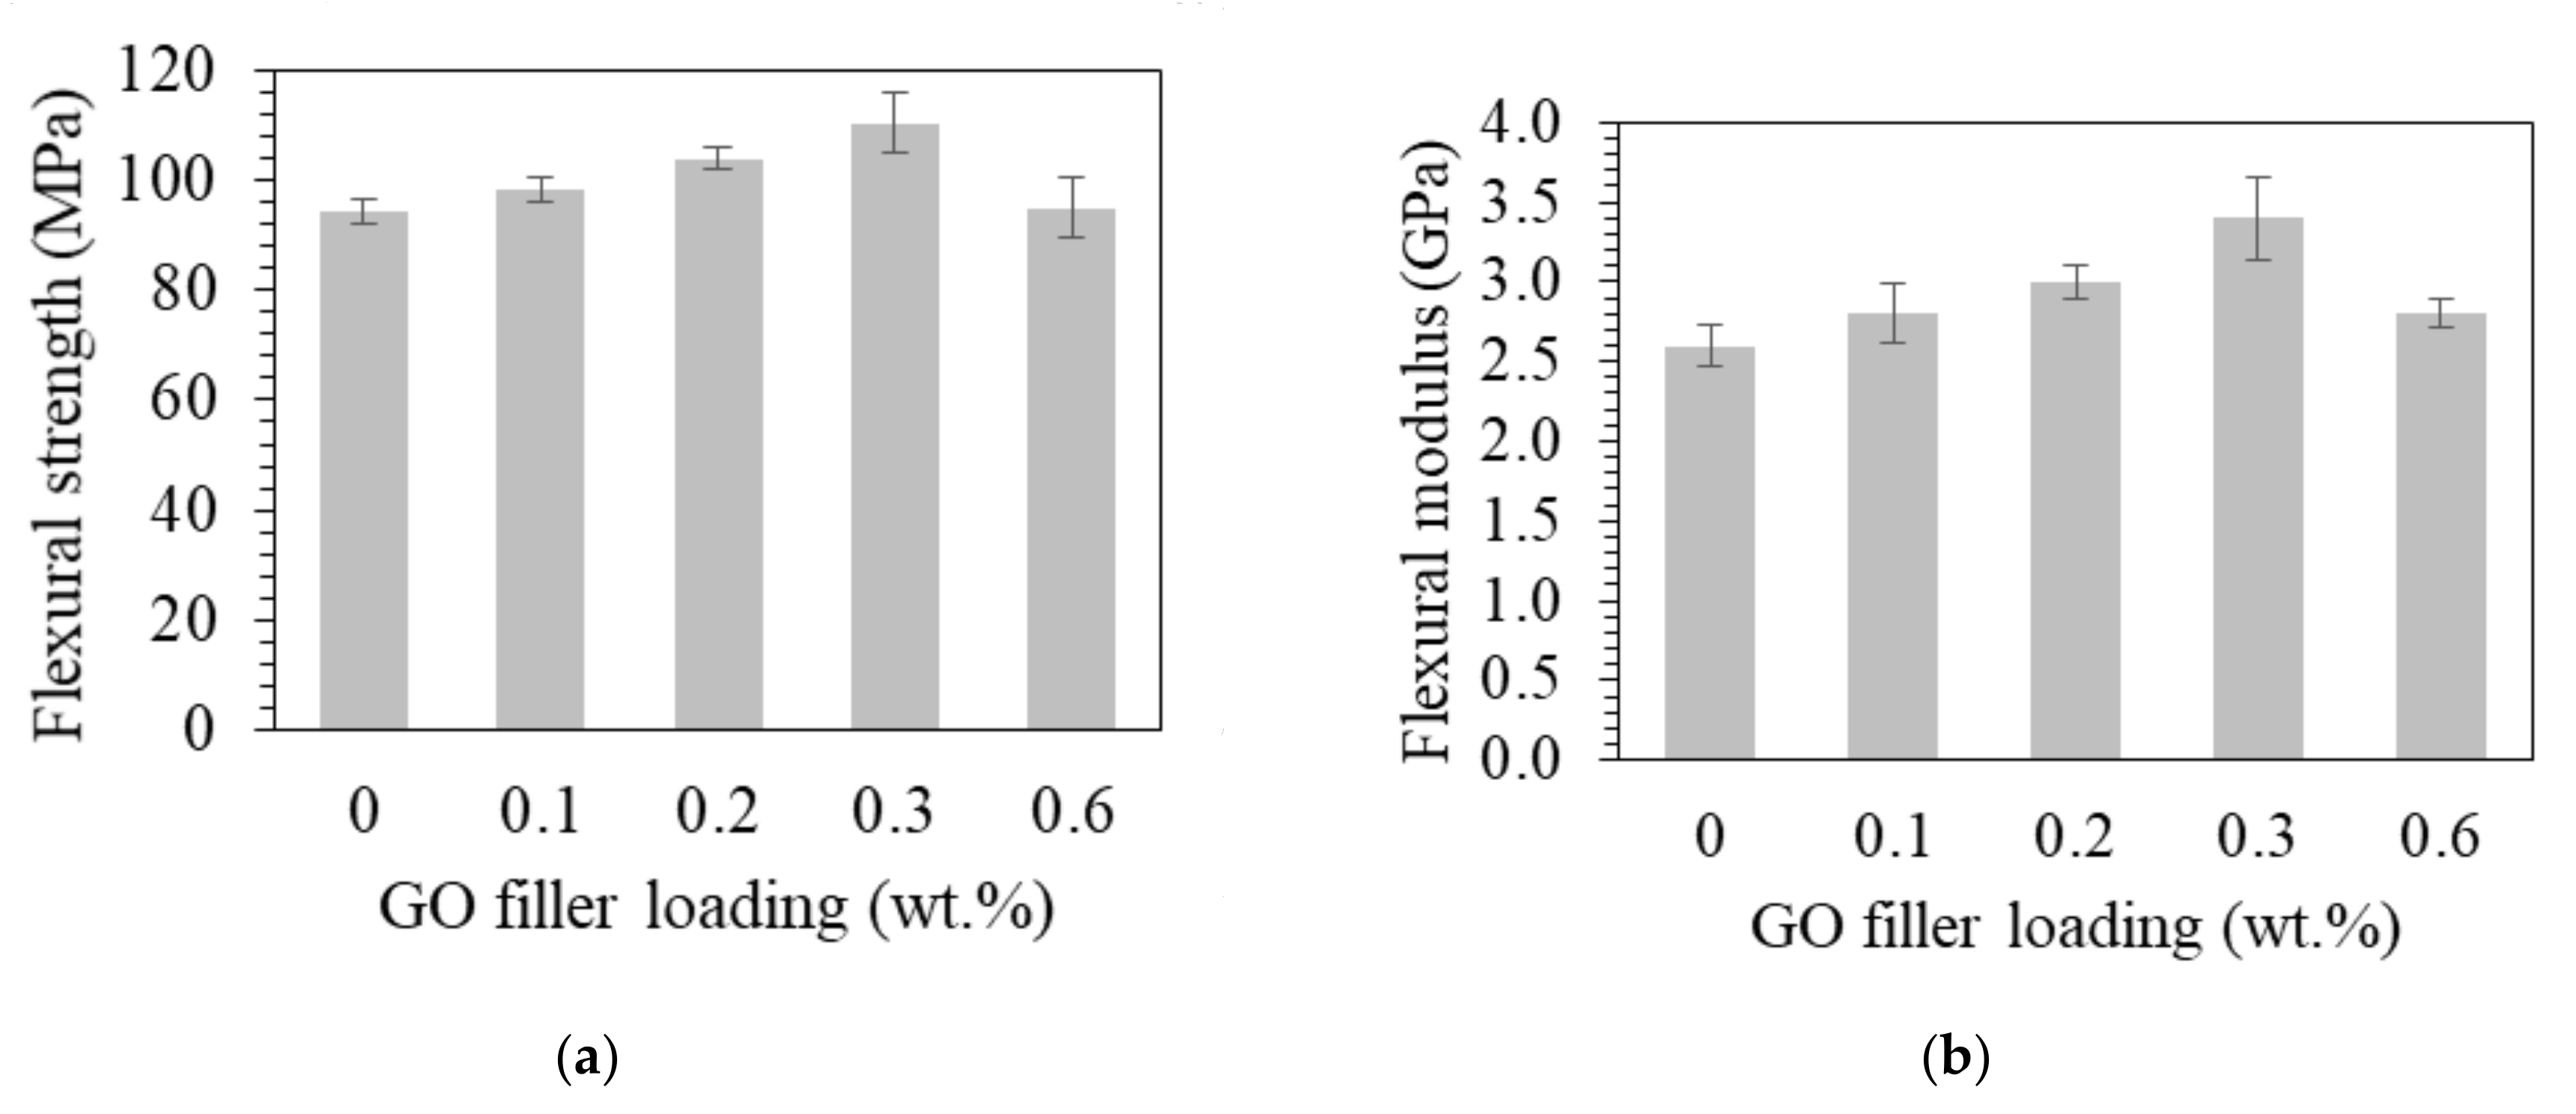
The flexural properties exhibited a similar tendency to increase steadily with filler content as shown in Figure 9. The flexural strength and modulus measurements of the pristine bio-resin was 94.2 ± 2.3 MPa and 2.6 ± 0.13 GPa, respectively. These values are in-line with the manufacturer estimates of 92–97 MPa and 2.5–3.0 GPa, respectively. Incorporating GO loadings of 0.1, 0.2, 0.3 and 0.6 wt.% into the bio-epoxy resin enhanced the composite flexural strength and modulus. At such a low weight filler fraction, it was not expected to form an aggregated GO material. In addition, the functional groups attached to the surfaces and edges of the GO sheets were anticipated to form strong adhesive interactions with the epoxy matrix [61]. The improved interaction translates to a strong interfacial adhesion and load transfer between the matrix and the GO reinforcements. When compared to the unmodified bio-epoxy, the flexural strengths of the composite increased by 4, 10, 17 and 1%, respectively, while the flexural modulus increased by 8, 15, 31 and 7%, respectively. The most significant improvement was at a loading of 0.3 wt.% GO where the flexural strength and modulus reached 110 ± 5.5 MPa and 3.4 ± 0.26 GPa, respectively. The flexural properties were significantly affected by the addition of GO material. The results are consistent with previous studies on synthetic epoxy/GO composites where the addition of 0.25 wt.% improved the flexural strength by 20%, while with 0.5 wt.% it increased to 22% [50]. Similarly, the flexural modulus was enhanced by 35% when GO at 0.3 wt.% content was added [58]. The addition of low weight fractions of GO fillers were able to improve the flexural properties. This is notably impressive, as compared with conventional fillers at higher levels to yield similar effects.
3.6. Thermal Gravimetric Analysis
The thermal stability and degradation process of the composite formulations with different GO filler loadings were assessed using TGA. Both TGA and DTA results are shown in Figure 10a,b, respectively. The thermal degradation behavior showed a three-step degradation process. Initially, the pure epoxy and GO composites had a small weight reduction at around 100 °C due to loss of surface moisture. A second minor weight loss observed for all materials ranged from 120 to 180 °C due to desorption of vapors from the hardening agent [62]. In aprevious study, it was reported that GO begins to decompose/deteriorate at a variety of elevated temperatures of 120 °C [63], 150 °C [51] and 200 °C [20], which leads to the loss of its surface-bound oxygen functional groups. The TGA for GO composites did not have a significant weight loss compared to the pure epoxy, possibly due to the small GO loadings. The last major drop in weight for all specimens occurred between 260–475 °C, which relates to epoxy degradation from the breakdown of epoxy chains above 300 °C [64]. For TGA results, the first (onset) decomposition temperature was measured at a 5% weight loss (T95), while T50 is the temperature at which 50% weight loss occurs and represents the mid-point of phase transition of the material. For 0, 0.1, 0.2, 0.3 and 0.6 wt.% GO, the T95 values were 297.6, 302.3, 302.9, 303.4 and 308.7 °C, respectively, while the T50 were 373.2, 373.4, 373.4, 373.8 and 374.4 °C, respectively. With the addition of 0.6 wt.%, the decomposition temperature for T95 increased by a maximum of 11.1 °C or by about 4% which suggests a minor improvement to the pure epoxy with the addition of GO. For T50, at 0.6 wt.%, the decomposition temperature improved by only 1.2 °C or by 0.33%, as compared to the pure epoxy.
The curves in the differential thermal analysis (DTA) results of Figure 10b are plotted as thermal decomposition rate as a function of decomposition temperature. The exothermic peak height at any decomposition temperature (°C) corresponds to the thermal decomposition rate of weight loss (%/°C). The highest thermal decomposition rate occurred for pure bio-epoxy which had a value of 1.347%/°C at a decomposition temperature of 367.4 °C. However, an increase in GO loadings from 0.1, 0.2, 0.3 and 0.6 wt.% resulted in a decrease of the thermal decomposition weight-loss rate of the composite decreased to 1.343, 1.339, 1.336 and 1.336%/°C, respectively. By comparison, the decomposition temperature slightly reduced to 367.4, 367.4, 367.1, 367.2 and 366.8 °C, respectively. Overall, the TGA and DTA results for the addition of GO into an epoxy resin were not significant, where the trend was upward. The composite containing 0.6 wt.% GO had the lowest decomposition rate and slightly improved decomposition temperature for T95 and T50, which illustrated a small enhancement in thermal stability. A number of studies have confirmed that the addition of GO to polymer matrices contribute to improved thermal stability. This trend may be a result of the barrier effects of the GO sheet structure delaying the breakdown of the polymer [65]. It is anticipated that greater amounts of GO loadings would further increase the thermal stability of the pure bio-epoxy.
3.7. Differential Scanning Calorimetry
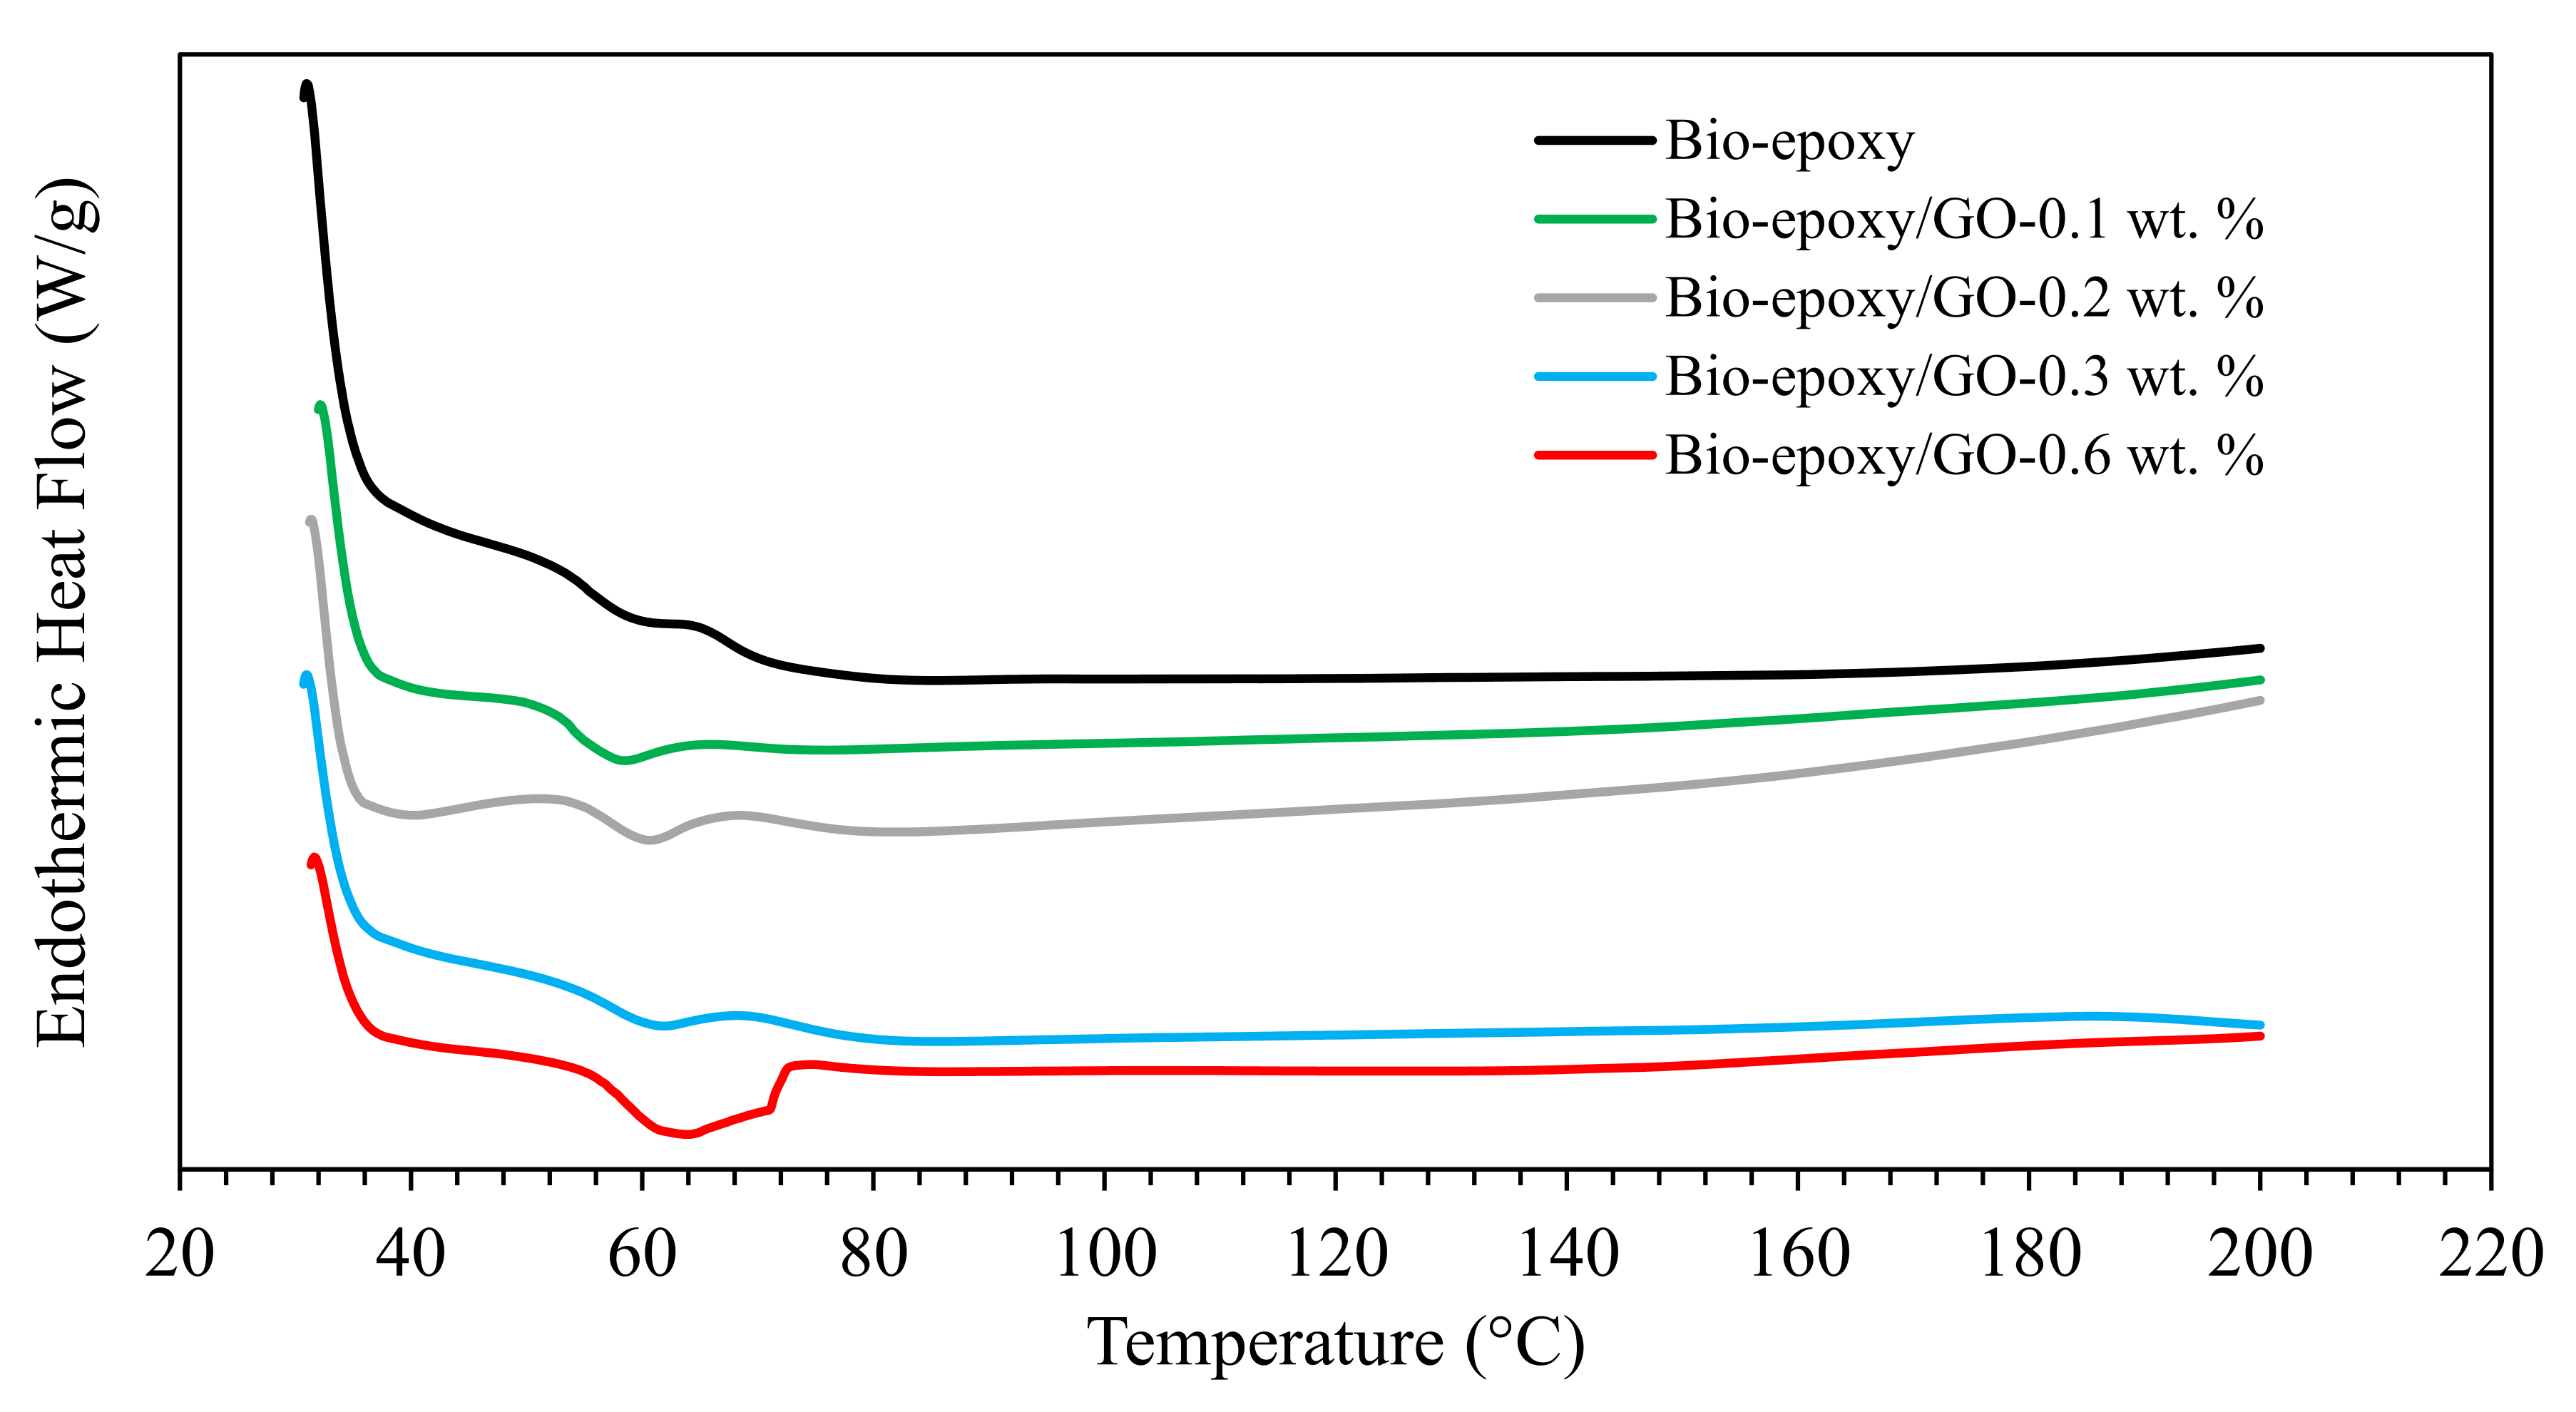
The DSC curves for determining the glass transition temperature of the bio-epoxy and the bio-epoxy/GO composites are shown in Figure 11. For composites containing 0, 0.1, 0.2, 0.3 and 0.6 wt.% GO, the Tg values were 54.6, 54.9, 55.3, 57.8 and 58.1 °C, respectively. The Super Sap bio-epoxy manufacturer reports a Tg value at a midpoint of 53 °C. The addition of GO slightly increased the Tg of the pure bio-epoxy for a maximum increment of 3.5 °C at a filler loading of 0.6 wt.% GO. The results are consistent with a study by Yousefi et al. [56], where an increase in Tg was observed for GO filler loadings of 0.5–2 wt.% in an epoxy matrix. Improvements in the Tg value have been attributed to higher cross-link density due to reactions between the oxygen containing functional groups on GO and the epoxy matrix [66]. This suggests that the addition of small amounts (<0.6 wt.%) of GO to the bio-epoxy did not interfere with polymer chain mobility upon curing which resulted in greater cross-linking density with a decrease in the polymer chain mobility.
4. Conclusions
It was demonstrated that a bio-epoxy can be successfully reinforced with GO powder. Addition of low amounts (≤0.6 wt.%) of GO was determined to be an efficient way to improve the tensile and flexural strength properties of bio-epoxy composites. The maximum enhancements were seen at GO contents of 0.3 wt.% which relates to the favorable adhesive interactions between the GO functional groups and the bio-epoxy resin, as supported by FTIR spectroscopy and mechanical strength testing results. This study indicates that addition of GO to a green bio-epoxy polymer enhances the tensile and flexural strength properties of such composites beyond that of traditional fillers at the same composition (wt.%). The tensile and flexural modulus were improved due to the addition of the GO filler having a higher stiffness than the bio-epoxy matrix. The TGA and DSC showed a slight improvement in the thermal stability and glass transition temperature of the bio-epoxy/GO composites, respectively, as compared to the pristine bio-epoxy. This study attempted to present the recent developments in tensile and flexural properties of epoxy/GO composites. Researchers and end users can make an informed decision as to whether to use a more eco-friendly resin in their applications. The bio-based composite described herein is a sustainable alternative material with competitive advantages for industries where synthetic epoxies are currently used. The authors believe there is a need to study the level of GO oxidation on the mechanical and thermal properties of epoxy composites.
Author Contributions
Conceptualization, D.E.C. and L.D.W.; methodology, D.E.C.; formal analysis, A.L., M.S. and D.E.C.; investigation, A.L. and M.S.; resources, D.E.C. and L.D.W.; data curation, A.L., M.S. and D.E.C.; writing—original draft preparation, D.E.C.; writing—review and editing, D.E.C. and L.D.W.; supervision, D.E.C. and L.D.W.; project administration and funding acquisition, D.E.C. and L.D.W. All authors have read and agreed to the published version of the manuscript.
Funding
This research was funded by Natural Sciences and Engineering Research Council of Canada (NSERC), Discovery Grant (RGPIN-2020-06701) and the University of Saskatchewan Undergraduate Student Research Assistantship. The APC was funded by MDPI.
Data Availability Statement
The data presented in this study are available on request from the corresponding author. The data are not publicly available due to the raw/processed data required to reproduce these findings cannot be shared at this time as the data also forms part of an ongoing study.
Conflicts of Interest
The authors declare no conflict of interest. The funders had no role in the design of the study; in the collection, analyses, or interpretation of data; in the writing of the manuscript, or in the decision to publish the results.
References
- Ng, F.; Couture, G.; Philippe, C.; Boutevin, B.; Caillol, S. Bio-based aromatic epoxy monomers for thermoset materials. Molecules 2017, 22, 149. [Google Scholar] [CrossRef] [Green Version]
- Khotbehsara, M.M.; Manalo, A.; Aravinthan, T.; Ferdous, W.; Nguyen, K.T.; Hota, G. Ageing of particulate-filled epoxy resin under hygrothermal conditions. Constr. Build. Mater. 2020, 249, 118846. [Google Scholar] [CrossRef]
- Khotbehsara, M.M.; Manalo, A.; Aravinthan, T.; Turner, J.; Ferdous, W.; Hota, G. Effects of ultraviolet solar radiation on the properties of particulate-filled epoxy based polymer coating. Polym. Degrad. Stab. 2020, 181, 109352. [Google Scholar] [CrossRef]
- Li, Z.; Young, R.J.; Wang, R.; Yang, F.; Hao, L.; Jiao, W.; Liu, W. The role of functional groups on graphene oxide in epoxy nanocomposites. Polymers 2013, 54, 5821–5829. [Google Scholar] [CrossRef]
- Hou, W.; Gao, Y.; Wang, J.; Blackwood, D.J.; Teo, S. Recent advances and future perspectives for graphene oxide reinforced epoxy resins. Mater. Today Commun. 2020, 23, 100883. [Google Scholar] [CrossRef]
- Charlier, J.C.; Gonze, X.; Michenaud, J.P. Graphite interplanar bonding: Electronic delocalization and van der Waals interac-tion. Europhys. Lett. 1994, 28, 403–408. [Google Scholar] [CrossRef]
- Frank, I.W.; Tanenbaum, D.M.; Van Der Zande, A.M.; McEuen, P.L. Mechanical properties of suspended graphene sheets. J. Vac. Sci. Technol. B Microelectron. Nanometer Struct. 2007, 25, 2558. [Google Scholar] [CrossRef] [Green Version]
- Asma, Y.; Daniel, I.M. Mechanical and thermal properties of graphite platelet/epoxy composites. Polymer 2004, 45, 8211–8219. [Google Scholar]
- Imran, A.; Alharbi, O.M.L.; Tkachev, A.; Galunin, E.; Burakov, A.; Grachev, V.A. Water treatment by new-generation gra-phene materials: Hope for bright future. Environ. Sci. Pollut. Res. 2018, 25, 1–15. [Google Scholar]
- Stankovich, S.; Dikin, D.A.; Piner, R.D.; Kohlhaas, K.A.; Kleinhammes, A.; Jia, Y.; Wu, Y.; Nguyen, S.T.; Ruoff, R.S. Synthesis of graphene-based nanosheets via chemical reduction of exfoliated graphite oxide. Carbon 2007, 45, 1558–1565. [Google Scholar] [CrossRef]
- Lee, C.; Wei, X.; Kysar, J.W.; Hone, J. Measurement of the elastic properties and intrinsic strength of monolayer graphene. Science 2008, 321, 385–388. [Google Scholar] [CrossRef] [PubMed]
- Rafiee, M.A.; Rafiee, J.; Wang, Z.; Song, H.; Yu, Z.-Z.; Koratkar, N. Enhanced Mechanical Properties of Nanocomposites at Low Graphene Content. ACS Nano 2009, 3, 3884–3890. [Google Scholar] [CrossRef] [PubMed]
- Yan, J.-L.; Chen, G.-J.; Cao, J.; Yang, W.; Xie, B.-H.; Yang, M.-B. Functionalized graphene oxide with ethylenediamine and 1,6-hexanediamine. New Carbon Mater. 2012, 27, 370–376. [Google Scholar] [CrossRef]
- Suk, J.W.; Piner, R.D.; An, J.; Ruoff, R.S. Mechanical Properties of Monolayer Graphene Oxide. ACS Nano 2010, 4, 6557–6564. [Google Scholar] [CrossRef]
- Gudarzi, M.M.; Sharif, F. Enhancement of dispersion and bonding of graphene-polymer through wet transfer of functionalized graphene oxide. Express Polym. Lett. 2012, 6, 1017–1031. [Google Scholar] [CrossRef]
- Brisebois, P.P.; Siaj, M. Harvesting graphene oxide-years 1859 to 2019: A review of its structure, synthesis, properties and exfoliation. J. Mater. Chem. C 2020, 8, 1517–1547. [Google Scholar] [CrossRef]
- Singh, J.; Bansal, S.A.; Singh, A.P. Mechanical Characterization of Polycarbonate-Graphene Oxide (PCG) Nanocomposite. Adv. Mech. Eng. 2020, 103–110. [Google Scholar] [CrossRef]
- Kołodziej, A.; Długoń, E.; Świętek, M.; Ziąbka, M.; Dawiec, E.; Gubernat, M.; Michalec, M.; Wesełucha-Birczyńska, A. A Raman Spectroscopic Analysis of Polymer Membranes with Graphene Oxide and Reduced Graphene Oxide. J. Compos. Sci. 2021, 5, 20. [Google Scholar] [CrossRef]
- Bora, C.; Gogoi, P.; Baglari, S.; Dolui, S.K. Preparation of polyester resin/graphene oxide nanocomposite with improved me-chanical strength. J. Appl. Polym. Sci. 2013, 129, 3432–3438. [Google Scholar] [CrossRef]
- Pandey, N.; Tewari, C.; Dhali, S.; Bohra, B.S.; Rana, S.; Mehta, S.; Singhal, S.; Chaurasia, A.; Sahoo, N.G. Effect of graphene oxide on the mechanical and thermal properties of graphene oxide/hytrel nanocomposites. J. Thermoplast. Compos. Mater. 2021, 34, 55–67. [Google Scholar] [CrossRef]
- Wang, Y.; Shi, Z.; Yu, J.; Chen, L.; Zhu, J.; Hu, Z. Tailoring the characteristics of graphite oxide nanosheets for the production of high-performance poly(vinyl alcohol) composites. Carbon 2012, 50, 5525–5536. [Google Scholar] [CrossRef]
- Wang, Y.; Shi, Z.; Fang, J.; Xu, H.; Yin, J. Graphene oxide/polybenzimidazole composites fabricated by a solvent-exchange method. Carbon 2011, 49, 1199–1207. [Google Scholar] [CrossRef]
- Shin, K.-Y.; Hong, J.-Y.; Lee, S.; Jang, J. Evaluation of anti-scratch properties of graphene oxide/polypropylene nanocomposites. J. Mater. Chem. 2012, 22, 7871–7879. [Google Scholar] [CrossRef]
- Hummers Jr, W.S.; Offeman, R.E. Preparation of graphitic oxide. J. Am. Chem. Soc. 1958, 80, 1339. [Google Scholar] [CrossRef]
- Xue, G.; Zhang, B.; Sun, M.; Zhang, X.; Li, J.; Wang, L.; Song, C. Morphology, thermal and mechanical properties of epoxy adhesives containing well-dispersed graphene oxide. Int. J. Adhes. Adhes. 2019, 88, 11–18. [Google Scholar] [CrossRef]
- Wang, X.; Jin, J.; Song, M. An investigation of the mechanism of graphene toughening epoxy. Carbon 2013, 65, 324–333. [Google Scholar] [CrossRef] [Green Version]
- Galpaya, D.; Wang, M.; George, G.; Motta, N.; Waclawik, E.R.; Yan, C. Preparation of graphene oxide/epoxy nanocomposites with significantly improved mechanical properties. J. Appl. Phys. 2014, 116, 053518. [Google Scholar] [CrossRef] [Green Version]
- Hayatgheib, Y.; Ramezanzadeh, B.; Kardar, P.; Mahdavian, M. A comparative study on fabrication of a highly effective cor-rosion protective system based on graphene oxide-polyaniline nanofibers/epoxy composite. Corros. Sci. 2018, 133, 358–373. [Google Scholar] [CrossRef]
- Gogoi, P.; Boruah, R.; Dolui, S.K. Jatropha curcas oil based alkyd/epoxy/graphene oxide (GO) bionanocomposites: Effect of GO on curing, mechanical and thermal properties. Prog. Org. Coat. 2015, 84, 128–135. [Google Scholar] [CrossRef]
- Huang, H.-D.; Ren, P.-G.; Chen, J.; Zhang, W.-Q.; Ji, X.; Li, Z.-M. High barrier graphene oxide nanosheet/poly(vinyl alcohol) nanocomposite films. J. Membr. Sci. 2012, 409-410, 156–163. [Google Scholar] [CrossRef]
- Rajabi, M.; Rashed, G.R.; Zaarei, D. Assessment of graphene oxide/epoxy nanocomposite as corrosion resistance coating on carbon steel. Corros. Eng. Sci. Technol. 2014, 50, 509–516. [Google Scholar] [CrossRef]
- Pourhashem, S.; Vaezi, M.R.; Rashidi, A.; Bagherzadeh, M.R. Exploring corrosion protection properties of solvent based epoxy-graphene oxide nanocomposite coatings on mild steel. Corros. Sci. 2017, 115, 78–92. [Google Scholar] [CrossRef]
- Lu, S.; Li, S.; Yu, J.; Yuan, Z.; Qi, B. Epoxy nanocomposites filled with thermotropic liquid crystalline epoxy grafted graphene oxide. RSC Adv. 2013, 3, 8915. [Google Scholar] [CrossRef]
- Li, M.S.; Ma, C.C.M.; Chen, J.L.; Lin, M.L.; Chang, F.C. Epoxy-polycarbonate blends catalyzed by a tertiary amine: 1. Mecha-nism of transesterification and cyclization. Macromolecules 1996, 29, 499–506. [Google Scholar] [CrossRef]
- Baruah, P.; Karak, N. Bio-based tough hyperbranched epoxy/graphene oxide nanocomposite with enhanced biodegradability attribute. Polym. Degrad. Stab. 2016, 129, 26–33. [Google Scholar] [CrossRef]
- Zhao, X.; Zhang, Q.; Hao, Y.; Li, Y.; Fang, Y.; Chen, D. Alternate Multilayer Films of Poly(vinyl alcohol) and Exfoliated Graphene Oxide Fabricated via a Facial Layer-by-Layer Assembly. Macromolecules 2010, 43, 9411–9416. [Google Scholar] [CrossRef]
- Pendolino, F.; Armata, N.; Masullo, T.; Cuttitta, A. Temperature influence on the synthesis of pristine graphene oxide and graphite oxide. Mater. Chem. Phys. 2015, 164, 71–77. [Google Scholar] [CrossRef]
- Yang, X.; Zhu, J.; Qiu, L.; Li, D. Bioinspired Effective Prevention of Restacking in Multilayered Graphene Films: Towards the Next Generation of High-Performance Supercapacitors. Adv. Mater. 2011, 23, 2833–2838. [Google Scholar] [CrossRef]
- Potts, J.R.; Dreyer, D.R.; Bielawski, C.W.; Ruoff, R.S. Graphene-based polymer nanocomposites. Polymer 2011, 52, 5–25. [Google Scholar] [CrossRef] [Green Version]
- Wetzel, B.; Rosso, P.; Haupert, F.; Friedrich, K. Epoxy nanocomposites-fracture and toughening mechanisms. Eng. Fract. Mech. 2006, 73, 2375–2398. [Google Scholar] [CrossRef]
- Xiao, W.; Liu, Y.; Guo, S. Composites of graphene oxide and epoxy resin assuming a uniform 3D graphene oxide network structure. RSC Adv. 2016, 6, 86904–86908. [Google Scholar] [CrossRef]
- Shen, B.; Zhai, W.; Tao, M.; Lu, D.; Zheng, W. Chemical functionalization of graphene oxide toward the tailoring of the in-terface in polymer composites. Compos. Sci. Technol. 2013, 77, 87–94. [Google Scholar] [CrossRef]
- Rohatgi, A. WebPlotDigitalizer: HTML5 Based Online Tool to Extract Numerical Data from Plot Images 2018 Version 4.1. Available online: https://automeris.io/WebPlotDigitizer (accessed on 9 March 2021).
- Mehrabi Kooshki, M.; Jalali-Arani, A. High performance graphene oxide/epoxy nanocomposites fabricated through the solvent exchange method. Polym. Compos. 2018, 39, E2497–E2505. [Google Scholar] [CrossRef]
- Wei, Y.; Hu, X.; Jiang, Q.; Sun, Z.; Wang, P.; Qiu, Y.; Liu, W. Influence of graphene oxide with different oxidation levels on the properties of epoxy composites. Compos. Sci. Technol. 2018, 161, 74–84. [Google Scholar] [CrossRef]
- Bansal, S.A.; Singh, A.P.; Kumar, A.; Kumar, S.; Kumar, N.; Goswamy, J.K. Improved mechanical performance of bisphenol-A graphene-oxide nano-composites. J. Compos. Mater. 2018, 52, 2179–2188. [Google Scholar] [CrossRef]
- Larsen, R.M.; Jensen, E.A. Epoxy-graphite oxide nanocomposites: Mechanical properties. J. Appl. Polym. Sci. 2016, 133, 43591–43599. [Google Scholar] [CrossRef]
- Wan, Y.-J.; Tang, L.-C.; Gong, L.-X.; Yan, D.; Li, Y.-B.; Wu, L.-B.; Jiang, J.-X.; Lai, G.-Q. Grafting of epoxy chains onto graphene oxide for epoxy composites with improved mechanical and thermal properties. Carbon 2014, 69, 467–480. [Google Scholar] [CrossRef]
- Qiu, J.; Wang, S. Enhancing polymer performance through graphene sheets. J. Appl. Polym. Sci. 2010, 119, 3670–3674. [Google Scholar] [CrossRef]
- Bortz, D.R.; Heras, E.G.; Martin-Gullon, I. Impressive fatigue life and fracture toughness improvements in graphene ox-ide/epoxy composites. Macromolecules 2011, 45, 238–245. [Google Scholar] [CrossRef]
- Bari, P.; Khan, S.; Njuguna, J.; Mishra, S. Elaboration of properties of graphene oxide reinforced epoxy nanocomposites. Int. J. Plast. Technol. 2017, 21, 194–208. [Google Scholar] [CrossRef]
- Li, Z.; Wang, R.; Young, R.J.; Deng, L.; Yang, F.; Hao, L.; Jiao, W.; Liu, W. Control of the functionality of graphene oxide for its application in epoxy nanocomposites. Polymer 2013, 54, 6437–6446. [Google Scholar] [CrossRef]
- Orestis, V.; Virtanen, S.; Andritsch, T.; Vaughan, A.; Lewin, P. Understanding the cross-linking re-actions in highly oxidized graphene/epoxy nanocomposite systems. J. Mater. Sci. 2019, 54, 3035–3051. [Google Scholar]
- Yu, Z.; Wang, Z.; Li, H.; Teng, J.; Xu, L. Shape Memory Epoxy Polymer (SMEP) Composite Mechanical Properties Enhanced by Introducing Graphene Oxide (GO) into the Matrix. Materials 2019, 12, 1107. [Google Scholar] [CrossRef] [Green Version]
- Shan, X.; Liu, Y.; Wu, Z.; Liu, H.; Zhang, Z.; Huang, R.; Huang, C.; Liu, Z.; Li, L. Preparation and property study of graphene oxide reinforced Epoxy resin insulation nanocomposites with high heat conductivity. In IOP Conference Series: Materials Science and Engineering, Proceedings of the 26th International Cryogenic Engineering Conference & International Cryogenic Materials Conference 2016, New Delhi, India, 7–11 March 2016; IOP Publishing: New Delhi, India, 2017; Volume 171, p. 012151. [Google Scholar]
- Yousefi, N.; Lin, X.; Zheng, Q.; Shen, X.; Pothnis, J.R.; Jia, J.; Zussman, E.; Kim, J.-K. Simultaneous in situ reduction, self-alignment and covalent bonding in graphene oxide/epoxy composites. Carbon 2013, 59, 406–417. [Google Scholar] [CrossRef]
- Amirova, L.; Surnova, A.; Balkaev, D.; Musin, D.; Amirov, R.; Dimiev, A.M. Homogeneous Liquid Phase Transfer of Graphene Oxide into Epoxy Resins. ACS Appl. Mater. Interfaces 2017, 9, 11909–11917. [Google Scholar] [CrossRef]
- Norhakim, N.; Ahmad, S.H.; Chia, C.H.; Huang, N.M. Mechanical and thermal properties of graphene oxide filled epoxy nanocomposites. Sains Malays. 2014, 43, 603–609. [Google Scholar]
- Tang, J.; Zhou, H.; Liang, Y.; Shi, X.; Yang, X.; Zhang, J. Properties of Graphene Oxide/Epoxy Resin Composites. J. Nanomater. 2014, 2014, 696859. [Google Scholar] [CrossRef]
- Liu, Q.; Zhou, X.; Fan, X.; Zhu, C.; Yao, X.; Liu, Z. Mechanical and thermal properties of epoxy resin nanocomposites rein-forced with graphene oxide. Polym. Plast. Technol. Eng. 2012, 51, 251–256. [Google Scholar] [CrossRef]
- Chatterjee, S.; Wang, J.; Kuo, W.; Tai, N.; Salzmann, C.; Li, W.; Hollertz, R.; Nüesch, F.; Chu, B. Mechanical reinforcement and thermal conductivity in expanded graphene nanoplatelets reinforced epoxy composites. Chem. Phys. Lett. 2012, 531, 6–10. [Google Scholar] [CrossRef]
- Fernandes, F.C.; Kirwan, K.; Lehane, D.; Coles, S.R. Epoxy resin blends and composites from waste vegetable oil. Eur. Polym. J. 2017, 89, 449–460. [Google Scholar] [CrossRef] [Green Version]
- Sabzevari, M.; Cree, D.E.; Wilson, L.D. Graphene Oxide–Chitosan Composite Material for Treatment of a Model Dye Effluent. ACS Omega 2018, 3, 13045–13054. [Google Scholar] [CrossRef] [PubMed] [Green Version]
- Zhao, C.; Li, Y.; Xing, Y.; He, D.; Yue, J. Flame retardant and mechanical properties of epoxy composites containing APP−PSt core−shell microspheres. J. Appl. Polym. Sci. 2013, 131, 40218. [Google Scholar] [CrossRef]
- Song, P.; Cao, Z.; Cai, Y.; Zhao, L.; Fang, Z.; Fu, S. Fabrication of exfoliated graphene-based polypropylene nanocomposites with enhanced mechanical and thermal properties. Polymer 2011, 52, 4001–4010. [Google Scholar] [CrossRef]
- Monteserín, C.; Blanco, M.; Aranzabe, E.; Vilas, J.L. Effects of graphene oxide and chemically reduced graphene oxide on the curing kinetics of epoxy amine composites. J. Appl. Polym. Sci. 2017, 134, 44803. [Google Scholar] [CrossRef]
Figure 1.
Bio-epoxy/graphene oxide (GO) tensile (dog-bone) and flexural (rectangular) composite preparation route.
Figure 1.
Bio-epoxy/graphene oxide (GO) tensile (dog-bone) and flexural (rectangular) composite preparation route.

Figure 2.
Fourier transform infrared (FTIR) spectra of (a) graphite; (b) GO; (c) pure bio-epoxy; (d) bio-epoxy/0.2 wt.% GO; (e) bio-epoxy/0.3 wt.% GO; (f) bio-epoxy/0.6 wt.% GO and (g) bio-epoxy/1.2 wt.% GO.
Figure 2.
Fourier transform infrared (FTIR) spectra of (a) graphite; (b) GO; (c) pure bio-epoxy; (d) bio-epoxy/0.2 wt.% GO; (e) bio-epoxy/0.3 wt.% GO; (f) bio-epoxy/0.6 wt.% GO and (g) bio-epoxy/1.2 wt.% GO.

Figure 3.
Scanning electron microscopy (SEM) micrograph of (a) graphite powder and (b) GO powder.

Figure 4.
Typical transmission electron microscope (TEM) images of (a) graphite, and (b) graphene oxide (GO) in a dry state.
Figure 4.
Typical transmission electron microscope (TEM) images of (a) graphite, and (b) graphene oxide (GO) in a dry state.

Figure 5.
Typical TEM images of epoxy containing (a) 0.3 wt.% GO sheets and (b) 0.6 wt.% GO sheets at low magnification; (c,d) magnified images of GO sheets from image (a,b), respectively.
Figure 5.
Typical TEM images of epoxy containing (a) 0.3 wt.% GO sheets and (b) 0.6 wt.% GO sheets at low magnification; (c,d) magnified images of GO sheets from image (a,b), respectively.

Figure 6.
SEM images of fractured tensile surfaces of (a) pure bio-epoxy; (b) bio-epoxy/0.1 wt.% GO; (c) bio-epoxy/0.2 wt.% GO; (d) bio-epoxy/0.3 wt.% GO and (e) bio-epoxy/0.6 wt.% GO composites.
Figure 6.
SEM images of fractured tensile surfaces of (a) pure bio-epoxy; (b) bio-epoxy/0.1 wt.% GO; (c) bio-epoxy/0.2 wt.% GO; (d) bio-epoxy/0.3 wt.% GO and (e) bio-epoxy/0.6 wt.% GO composites.

Figure 7.
SEM images of fractured flexural surfaces of (a) pure bio-epoxy; (b) bio-epoxy/0.1 wt.% GO; (c) bio-epoxy/0.2 wt.% GO; (d) bio-epoxy/0.3 wt.% GO and (e) bio-epoxy/0.6 wt.% GO composites.
Figure 7.
SEM images of fractured flexural surfaces of (a) pure bio-epoxy; (b) bio-epoxy/0.1 wt.% GO; (c) bio-epoxy/0.2 wt.% GO; (d) bio-epoxy/0.3 wt.% GO and (e) bio-epoxy/0.6 wt.% GO composites.

Figure 8.
(a) Tensile strength and (b) tensile modulus results for pure bio-epoxy and bio-epoxy/GO composites containing 0.1–0.6 wt.% GO.
Figure 8.
(a) Tensile strength and (b) tensile modulus results for pure bio-epoxy and bio-epoxy/GO composites containing 0.1–0.6 wt.% GO.

Figure 9.
(a) Flexural strength and (b) flexural modulus results for pure bio-epoxy and bio-epoxy/GO composites containing 0.1–0.6 wt.% GO.
Figure 9.
(a) Flexural strength and (b) flexural modulus results for pure bio-epoxy and bio-epoxy/GO composites containing 0.1–0.6 wt.% GO.

Figure 10.
(a) Thermogravimetric analysis (TGA) and (b) Differential thermal gravimetry (DTG) for pure bio-epoxy and bio-epoxy/0.1–0.6 wt.% GO composites.
Figure 10.
(a) Thermogravimetric analysis (TGA) and (b) Differential thermal gravimetry (DTG) for pure bio-epoxy and bio-epoxy/0.1–0.6 wt.% GO composites.

Figure 11.
Differential scanning calorimetry (DSC) thermographs of pure bio-epoxy and bio-epoxy/0.1–0.6 wt.% GO composites (endo ↓).
Figure 11.
Differential scanning calorimetry (DSC) thermographs of pure bio-epoxy and bio-epoxy/0.1–0.6 wt.% GO composites (endo ↓).

Table 1.
Filler loadings in bio-epoxy (BE) composites.
| Composite | Graphene Oxide Content (wt.%) | BE Resin (wt.%) | Hardener (wt.%) |
|---|---|---|---|
| BE | 0.0 | 100 | 40.0 |
| BE + GO-0.1 | 0.1 | 71.40 | 28.50 |
| BE + GO-0.2 | 0.2 | 71.30 | 28.50 |
| BE + GO-0.3 | 0.3 | 71.25 | 28.50 |
| BE + GO-0.6 | 0.6 | 71.00 | 28.40 |
Publisher’s Note: MDPI stays neutral with regard to jurisdictional claims in published maps and institutional affiliations. |
© 2021 by the authors. Licensee MDPI, Basel, Switzerland. This article is an open access article distributed under the terms and conditions of the Creative Commons Attribution (CC BY) license (http://creativecommons.org/licenses/by/4.0/).
Share and Cite
MDPI and ACS Style
Loeffen, A.; Cree, D.E.; Sabzevari, M.; Wilson, L.D. Effect of Graphene Oxide as a Reinforcement in a Bio-Epoxy Composite. J. Compos. Sci. 2021, 5, 91. https://0-doi-org.brum.beds.ac.uk/10.3390/jcs5030091
AMA Style
Loeffen A, Cree DE, Sabzevari M, Wilson LD. Effect of Graphene Oxide as a Reinforcement in a Bio-Epoxy Composite. Journal of Composites Science. 2021; 5(3):91. https://0-doi-org.brum.beds.ac.uk/10.3390/jcs5030091
Chicago/Turabian StyleLoeffen, Anthony, Duncan E. Cree, Mina Sabzevari, and Lee D. Wilson. 2021. "Effect of Graphene Oxide as a Reinforcement in a Bio-Epoxy Composite" Journal of Composites Science 5, no. 3: 91. https://0-doi-org.brum.beds.ac.uk/10.3390/jcs5030091