Article

Compounding of Short Fiber Reinforced Phenolic Resin by Using Specific Mechanical Energy Input as a Process Control Parameter

1
Karlsruhe Institute of Technology (KIT), Institute for Applied Materials—Materials Science and Engineering (IAM-WK), Engelbert-Arnold-Straße 4, 76131 Karlsruhe, Germany
2
Fraunhofer Institute for Chemical Technology (ICT), Joseph-von-Fraunhofer-Straße 7, 76327 Pfinztal, Germany
3
Institute for Materials Resource Management MRM, Hybrid Composite Materials, Augsburg University, Am Technologiezentrum 8, 86159 Augsburg, Germany
*
Author to whom correspondence should be addressed.
J. Compos. Sci. 2021, 5(5), 127; https://0-doi-org.brum.beds.ac.uk/10.3390/jcs5050127
Submission received: 19 April 2021 / Revised: 30 April 2021 / Accepted: 5 May 2021 / Published: 11 May 2021

Abstract

:
For a newly developed thermoset injection molding process, glass fiber-reinforced phenolic molding compounds with fiber contents between 0 wt% and 60 wt% were compounded. To achieve a comparable remaining heat of the reaction in all compound formulations, the specific mechanical energy input (SME) during the twin-screw extruder compounding process was used as a control parameter. By adjusting the extruder screw speed and the material throughput, a constant SME into the resin was targeted. Validation measurements using differential scanning calorimetry showed that the remaining heat of the reaction was higher for the molding compounds with low glass fiber contents. It was concluded that the SME was not the only influencing factor on the resin crosslinking progress during the compounding. The material temperature and the residence time changed with the screw speed and throughput, and most likely influenced the curing. However, the SME was one of the major influence factors, and can serve as an at-line control parameter for reactive compounding processes. The mechanical characterization of the test specimens revealed a linear improvement in tensile strength up to a fiber content of 40–50 wt%. The unnotched Charpy impact strength at a 0° orientation reached a plateau at fiber fractions of approximately 45 wt%.

1. Introduction

Composite parts manufactured from fiber-reinforced phenolic molding compounds have a high maximum operating temperature, an excellent chemical resistance, and a very good dimensional accuracy. These characteristics enable their application in the direct vicinity of internal combustion engines [1,2,3,4]. Recent developments have proven that phenolic molding compounds can successfully be used in electric motors for traction applications [5]. Typical filler and fiber contents for such applications are in the range of 50–80 wt%. In contrast to thermoplastics, unfilled materials are highly uncommon for phenolic molding compounds. Instead, the filler composition is typically tailored by the material supplier for the specific application [6]. Hence, compounds with a wide variety of very specialized filler and fiber compositions are offered by material suppliers.
For a newly developed thermoset injection molding process, several general-purpose molding compounds with different short glass fiber (SGF) contents are required. At the same time, the resin formulation and the degree of cure must be comparable for all SGF molding compounds, despite the different fiber contents.
This new thermoset injection molding process enables the manufacturing of phenolic resin (PF) parts with a tailored combination of long glass fibers (LGF) and short glass fibers (SGF), and is shown in Figure 1. The variable adjustment of LGF and SGF contents is achieved by separating the SGF and LGF mass flows.
While the SGF are gravimetrically fed as a part of the short fiber molding compound, the LGF are directly chopped from continuous fiber rovings and fed into the plasticizing unit of the injection molding machine. To adjust the LGF content while keeping the overall glass fiber content of the molded part constant, the SGF content in the short fiber molding compounds needs to be adjusted, while keeping the resin formulation and the remaining heat of reaction the same.
As outlined above, the commercially available molding compounds are tailored to individual, specific applications. There are no general-purpose molding compounds with the required fiber content range of 0–60 wt% available on the market today. For this reason, compounding them specifically for the long fiber thermoset injection molding process is necessary. This article focuses on the twin-screw extruder compounding process and correlates the experimental work with the calorimetric and mechanical characterization of those tailor-made phenolic molding compounds.
The following sections first describe the compounding process of phenolic molding compounds and the power balance of this process. Subsequently, the typical characterization techniques for monitoring the processability and the curing progress of the resin are described.

1.1. Compounding of Phenolic Molding Compounds

For producing phenolic molding compounds, the powdery raw materials are mixed and fed into a kneading process [6]. Various kneading techniques have been used in laboratory and industrial scale manufacturing processes. Typical examples are laboratory processes such as hot roller mills [7] or ball mills [8], as well as larger scale production machines such as Buss co-kneaders [9,10] and twin-screw extruders [11,12]. In the present work, a twin-screw extruder setup was used for manufacturing the phenolic molding compounds.
Due to the energy input during the compounding process, the crosslinking reaction in the phenolic resin progresses. Monitoring and controlling the energy input into the material is crucial for ensuring a good moldability (which includes aspects such as flowability, curing, and mold release behavior) in the subsequent injection molding process [13].
The total power input into the material is the sum of the mechanical power input PMech, the power required for temperature and enthalpy change between the extruder inlet and outlet (PHeat and PEnthalpy), and the power used to increase the material pressure PPressure [14]
Ptot = PMech + PHeat + PEnthalpy + PPressure
With the extruder speed ω, the extruder torque MExtr, the mass throughput Q, the enthalpy difference ΔH, the pressure difference Δp, and the material density ρ, Equation (1) becomes
Ptot = 2πω MExtr + PHeat + Q ΔH + Q Δp/ρ
The first term in Equations (1) and (2), the mechanical power input PMech, is, by far, the largest summand in the power balance [15]. It can be quantified by calculating the specific mechanical energy input (SME)
SME = 2πω MExtr/Q
according to Equation (3). The second term in Equations (1) and (2), PHeat, describes the heat transfer between the polymer and the processing chamber walls. No literature that reported a direct measurement of the heat transfer was found. Instead, PHeat can be calculated by estimating the third and fourth term in Equation (1) [14]. The enthalpy difference ΔH can be calculated using the thermodynamic properties of the compounded material, e.g., the heat capacity, the heat of the fusion, and/or the heat of the reaction. If a pressure build-up occurs at the end of the extruder, the pressure difference Δp can be used for calculating the power PPressure.
The SME has been used by Methe and Gehde [11] for monitoring the extrusion process of a chemically foamed phenolic novolak resin. While the end application for extrusion-foamed phenolic resins is different from standard injection molding compounds, the scientific questions regarding the compounding process are the same. Methe and Gehde investigated the influence of the process and machine parameters on the curing progress of the phenolic resin in a twin-screw extruder. They found that the position of the kneading elements on their twin-screw extruder machine had a significantly larger influence on the SME than the number of kneading elements. They explained this using the temperature dependency of the resin’s viscosity. If the kneading elements were positioned further towards the inlet of the extruder, the resin would reach them in a colder, higher viscosity state. For this reason, the kneading elements could introduce high shear stresses into the resin and, consequently, the SME was high. If the kneading elements were positioned further downstream, the resin powder was already heated by the extruder barrel. Due to the lower viscosity in this state, less shear energy could be introduced and consequently, the SME was lower.
Methe and Gehde correlated the SME to the reaction progress of the phenolic resin at the extruder exit using the glass transition temperature (Tg). The Tg was determined by a subsequent, separate differential scanning calorimetry (DSC) measurement of samples taken after exiting the extruder. They showed that a higher SME during extruder compounding resulted in a higher Tg at the extruder outlet, which indicated a higher degree of crosslinking. However, one main conclusion that they drew was that this correlation between the SME and the reaction progress was only valid for process parameter variations—in their case, the extruder speed—within one identical screw element configuration. For different screw configurations, a comparability using the SME was not possible in their experiments. They concluded that the newly chosen screw configurations must be characterized regarding their influence on the reaction progress first, before process parameter values such as the SME can be used for controlling the process.
Other examples of using the SME for describing the properties of a polymer extrusion process can be found in Inceoglu et al. [16]. They identified a good correlation between the SME and the residual fiber length during the compounding of glass fiber-reinforced polyamide. Similar results were obtained by Berzin et al. [17], who found a good correlation between SME and the average fiber length in a polycaprolactone (PCL) composite material reinforced with lignocellulosic fibers. Their simulation results showed that the blocks of the kneading discs and the filled section prior to that are responsible for most of the energy input into the material. Stratiychuk-Dear et al. [18] found a linear correlation between the SME and the dispersion quality of additives in polymer composites. Dreiblatt and Canedo [14] confirmed by numerical simulation that the main mechanical energy input happens in the first kneading zone, in which the polymer is melted. They also noted that the SME does not provide any information about the residence time over which the energy is introduced into the polymer.

1.2. At-Line Characterization Techniques

The common at-line tests for moldability can be classified into three groups according to Englich [19] and Tonogai et al. [13]. In this context, “at-line characterization” is defined as quick and simple tests that can be used for adjusting the process parameters to the required values. The first group of test methods measures the flow path length that the molding compound can cover under defined temperature and pressure conditions until it cures. Representatives of this group are the orifice flow test (OFT) [20], spiral flow test [21], stick flow test [22], and disc flow test [13]. The second group of tests is closely related, measuring the time that is required until a defined mold geometry can be closed against the counter-pressure of the molding compound. A typical example is the cup flow test [23]. The third group of moldability tests directly measures the changing viscosity of the molding compound upon heating. In a torque rheometer [24], the molding compound is subjected to a defined temperature, and the required torque for rotating the instrument is monitored. The resulting torque vs. time curve gives an indication of the curing time and the minimum viscosity during the processing of the thermoset molding compound.
The main advantage of the described methods is their simplicity and their ease of use, especially in a production environment. They typically yield a single numerical value for the material’s moldability, for example, the flow path length. However, this simplicity has some significant disadvantages, as will be described by using the OFT according to ISO 7808 [20] as an example. The test setup is shown in Figure 2.
In this test, 50 g of granular molding compound is poured into a heated mold cavity (165 °C mold temperature as required by the technical standard). A plunger with two precisely machined orifices is pressed down with a constant force F, heating and compressing the molding compound. Under these conditions, the molding compound softens and bypasses the plunger through the two orifices. Due to the heat and shear energy input, the resin starts to cure in the orifices and in the cavity, eventually stopping the plunger movement. The metric for the test result is calculated from the weight mrem of the molding compound that remains in the cavity using Equation (4).
OFT = 2 (50 − mrem)
A high value for the OFT means that a large amount of molding compound is pushed through the orifices. This behavior is typically called a “soft flow”, whereas a low OFT value—or a “stiff flow”—is achieved for small amounts of molding compound bypassing the plunger.
The first shortcoming of the OFT is the superposition of cure and flow; a low-viscosity, fast-curing molding compound can have the same OFT value as a high-viscosity, slow-curing material. It is apparent that such molding compounds require different strategies for their processing. Second, the OFT is used for judging moldability in the injection process, but it does so in a compression molding process at significantly lower pressure levels and shear rates. For the specific challenge of the research study described here (comparing molding compounds over a wide fiber content range), OFT and similar tests are not suitable. The flow behavior of a fiber-reinforced polymer is significantly influenced by the filler content [25], thus making any comparability impossible. To separate the effect of curing from the material flow, calorimetry measurements can be carried out as described below.

1.3. Differential Scanning Calorimetry

DSC is a commonly used thermal analysis method. A typical measurement objective for thermosets is the total heat of the reaction ΔH, which can be obtained by the integration of the exothermic curing peak [26]. Typical sample sizes for a DSC analysis are a few milligrams. The preparation of the sample is crucial for high-quality measurement results. For phenolic novolak resins, a representative sample must be taken from the, typically granular or powdery, resin. The successful utilization of a ball mill has been reported by Domínguez et al. [27] and Stark [28] for the pulverization of the sample. Scheffler [29] states that he conducted an ultrafine grinding process, without giving more details.
The condensation polymerization of the phenolic resin produces low-molecular reaction products such as water and formaldehyde. Additionally, ammonia is produced by the decomposition of the hardener hexamethylenetetramine (HMTA). The evaporation of these substances is an endothermic process, whereas the curing reaction is exothermic [30]. The use of standard crucibles with an open or perforated lid would skew the determination of the total heat of the reaction ΔH, since the measured heat flow would be a superposition of both effects. Therefore, sealed medium- or high-pressure crucibles that suppress the evaporation are used by most research works. The crucible volume is between 60 µL [31], 120 µL [27,32], and 270 µL [33]. In studies where no sealed crucibles have been used, inconsistent measurement results regarding the total heat of the reaction have been reported [34].
For determining the total heat of the reaction, temperature ramps from room temperature up to temperatures of T = 250–300 °C with a heating rate of 10 K/min are typical. For phenolic molding compounds containing fillers and fibers, a subsequent thermogravimetric analysis of the identical sample has been conducted by Scheffler [29]. The determination of the solids content of each individual sample makes it possible to calculate the heat of the reaction only for the resin fraction of the sample.

1.4. Aim and Scope of the Present Work

Summing up the currently available characterization methods for phenolic molding compounds, the conclusion can be drawn that the typical at-line tests mentioned above have the shortcoming that they are only applicable for molding compounds with the same fiber content. Changing the fiber content—as is required for the SGF molding compounds used in the long fiber thermoset injection molding process—affects the measurement results of the at-line single value characterization techniques much stronger than any potential changes in the degree of resin crosslinking. For this reason, characterization methods such as the OFT are not suitable for monitoring the curing progress and adjusting the process parameters during the compounding. At the same time, the differential scanning calorimetry requires both a sample preparation and a significant measurement time. This means that an off-line measurement method such as DSC is not suited for quick decisions that need to be made during compounding trials.
For these reasons, a method using the power balance of the compounding process is proposed within this work. The specific mechanical energy input, SME, is an easily calculatable, quickly accessible process parameter that provides instant feedback. The feasibility of using the SME as a control parameter for adjusting the reaction progress of phenolic molding compounds with varying fiber contents of 0–60 wt% is investigated.

2. Materials and Methods

2.1. Materials

The SGF-reinforced phenolic molding compounds manufactured for this study are based on Vyncolit X6952 [35], which is a commercially available, 55 wt% SGF-reinforced phenolic molding compound (PF-SGF55) by Sumitomo Bakelite (Gent, Belgium). The phenolic resin system was provided as a two-piece formulation consisting of the novolak resin powder with premixed hexamethylenetetramine (HMTA) and a masterbatch containing the processing additives. For this work, the SGF content was adjusted to fractions ranging from 0 wt% up to 60 wt%. The SGF were provided by 3B fibreglass (Hoeilaart, Belgium) in the form of their DS5163-13P [36] chopped strands. Due to their high bulk density and low initial fiber length of 4 mm, they have a free-flowing feeding behavior and are widely used for the industrial manufacture of phenolic molding compounds such as Vyncolit X6952.

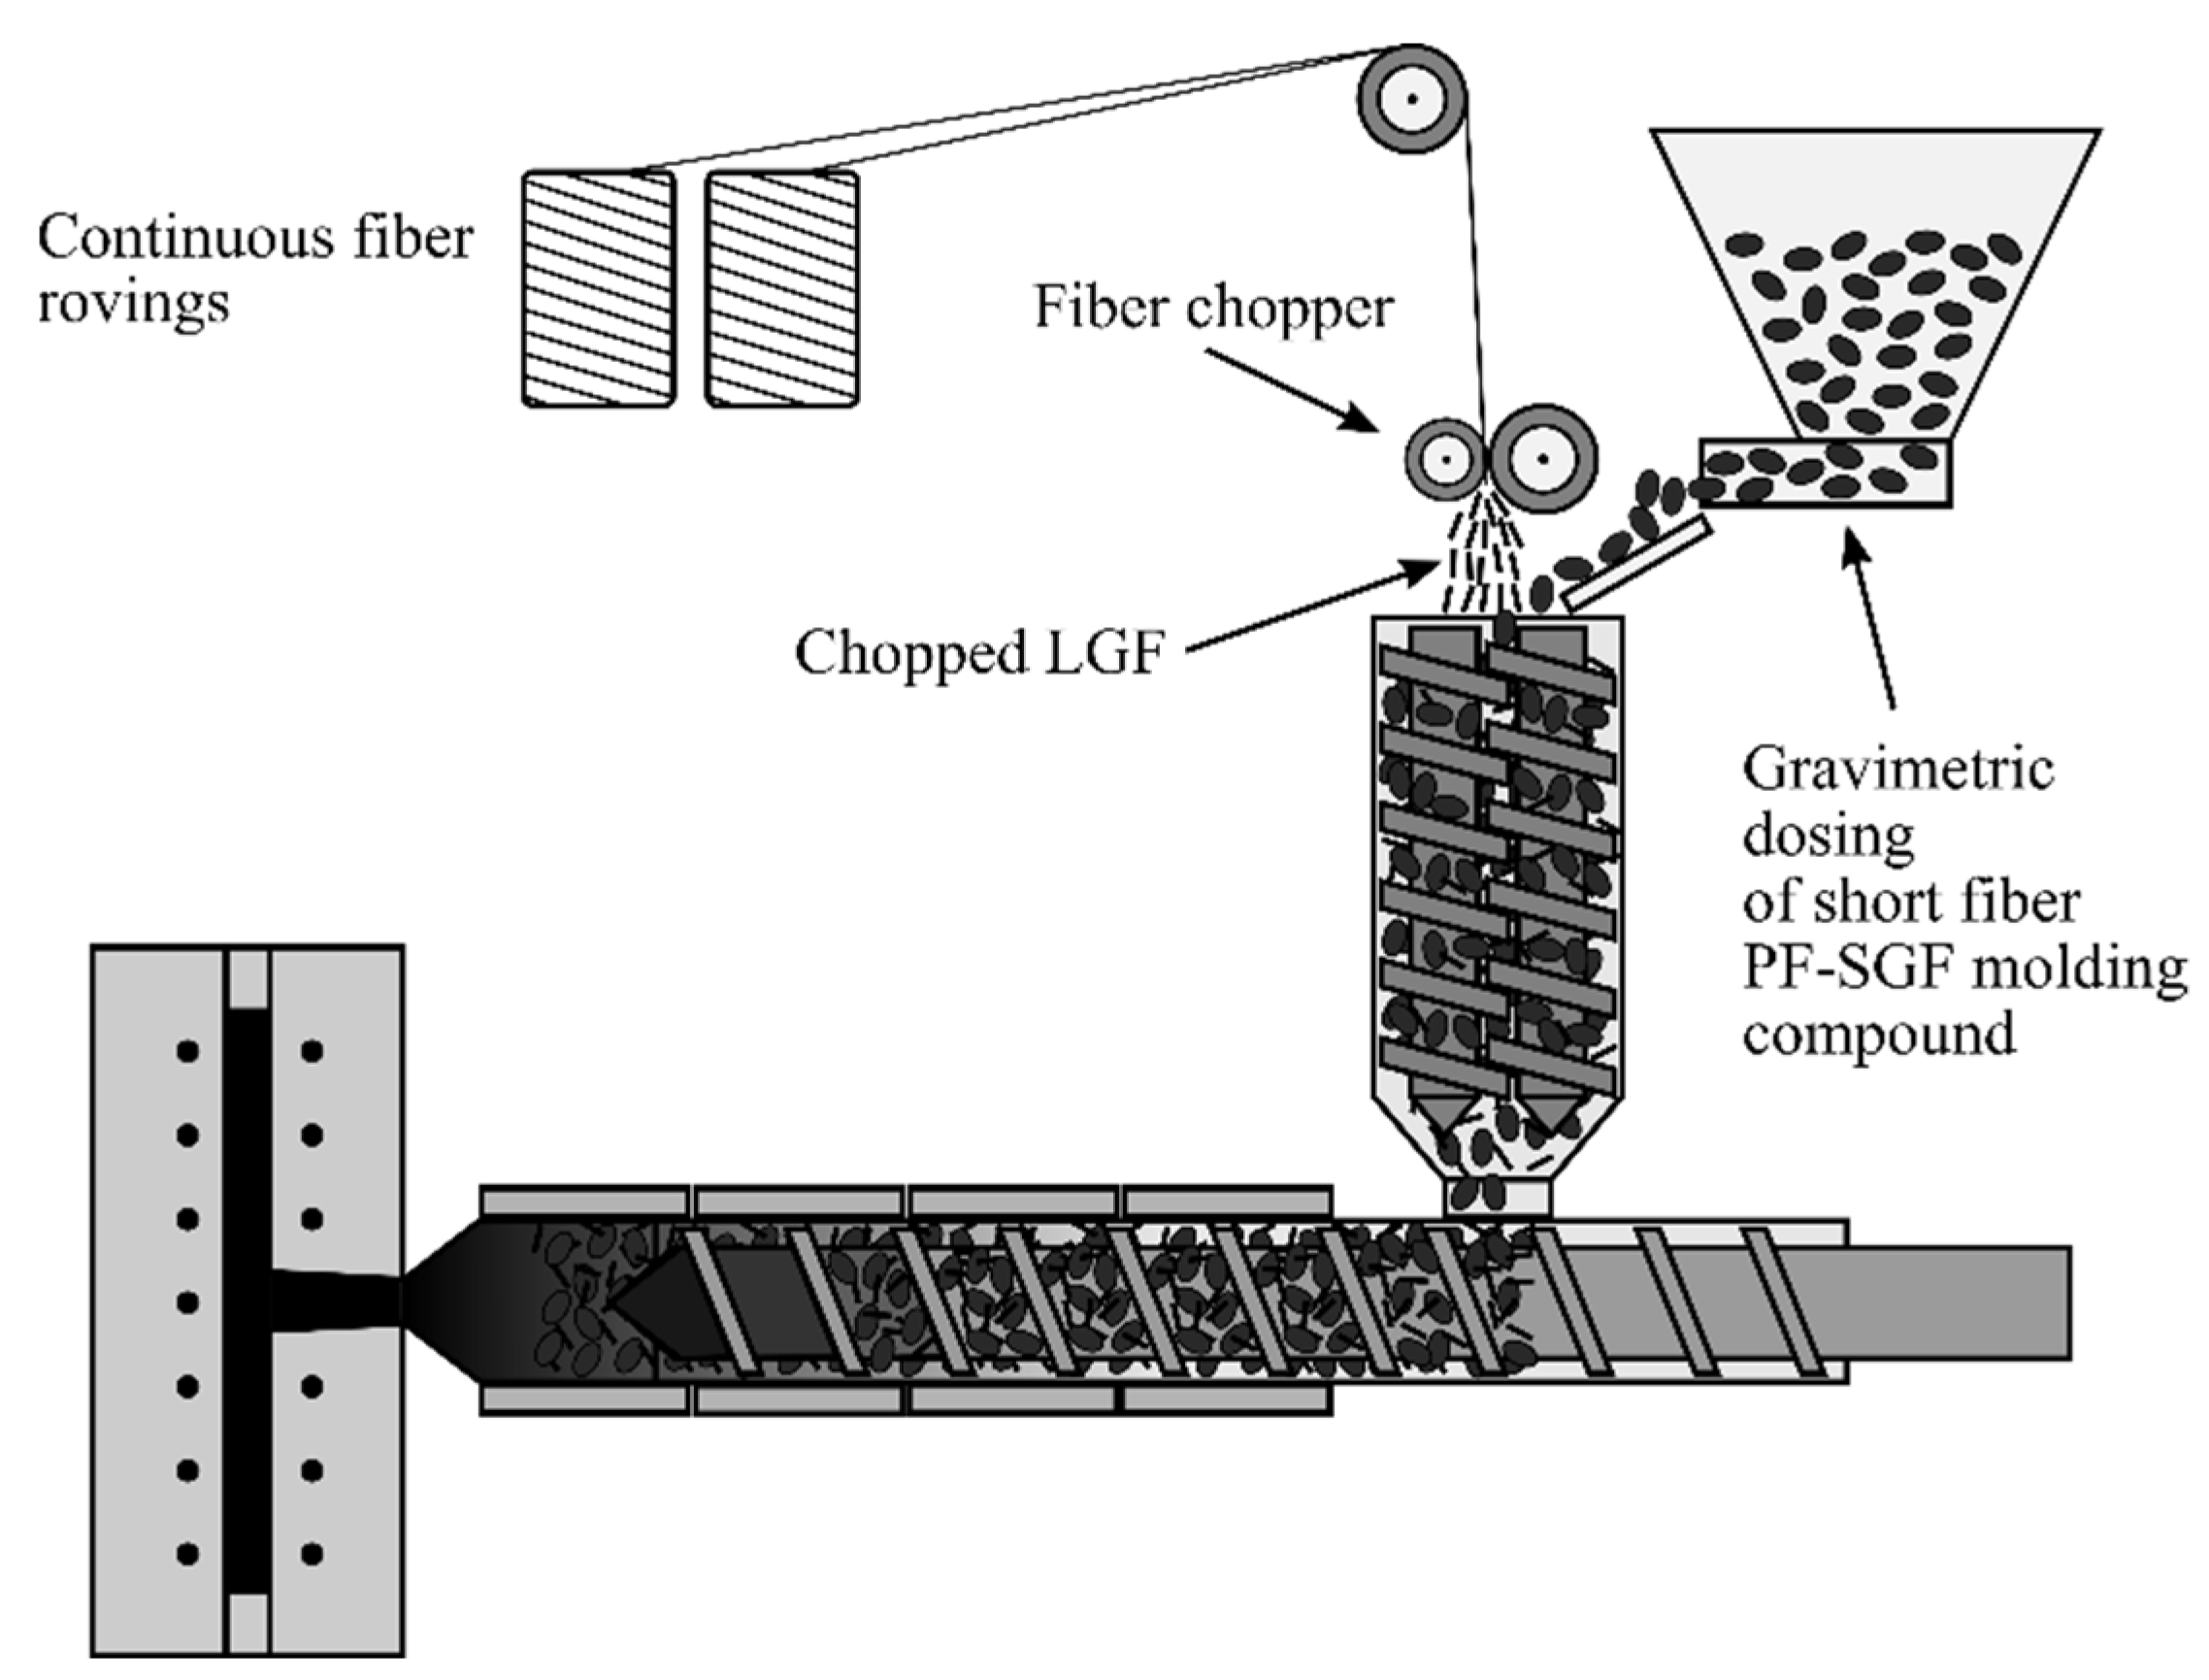
2.2. Twin-Screw Extruder Compounding

A 27 mm co-rotating twin-screw extruder with an active processing length of 28 D (Leistritz Extrusionstechnik GmbH, Nuremberg, Germany) was used for the compounding trials. The three components, resin/HMTA, masterbatch, and SGF, were fed gravimetrically into the extruder using single screw loss-in-weight-feeders by Brabender Technologie (Duisburg, Germany). Figure 3 shows the screw layout and the temperature profile. The direction of the material flow was from right to left.
Both resin/HMTA and masterbatch were fed into the main feed and melted in the first kneading zone, which consisted of kneading elements with 30°, 30°, and 60° angles between the kneading discs. The increase in barrel temperature to 110 °C supported the melting of the resin powder. After the kneading zone, the short glass fibers were fed into the melt using a 26 mm co-rotating twin-screw sidefeed (Leistritz LSB26). To open the chopped fiber strands, additional kneading elements with 30°, 60°, and 90° angles were utilized. In the last three barrel zones, the material was cooled down and conveyed to the extruder outlet.
The extruder speed and the throughput were adjusted to keep the specific mechanical energy input into the resin (SMER) as constant as possible. It was calculated using the fiber weight content ψ according to Equation (5).
SMER = 2πω MExtr/Q (1 − ψ)
The molding compound exited the extruder in lumps, which were subsequently compacted and cooled down by free convection. After cooling, the compound was granulated to using a Hosokawa Alpine cutting mill with a 10 mm rectangular screen, through which the material exited the mill (Augsburg, Germany). The granulation process produced a dust-rich, irregular granulate, which was stored in sealed containers at room temperature until molding.

2.3. Manufacturing of Test Specimens

The test specimens for this study were manufactured using a KraussMaffei 550/2000 GX injection molding machine equipped with a standard 60 mm thermoset screw without a non-return valve. The temperature control of the plasticizing unit was realized by using four individually controlled, oil-tempered zones. The clamping unit had a maximum clamping force of 5500 kN. The injection molding parameters are listed in Table 1.
During all injection molding trials, rectangular plates with a size of 190 mm × 480 mm and a thickness of 4 mm were molded. The plates were filled via a central sprue with a diameter of 15 mm. After molding, all plates were post-cured according to the temperature cycle in Table 2 to ensure that they had the same degree of cure, despite the varying fiber and resin contents.
The test specimens were cut out of the molded plates and post-cured plates by means of waterjet-cutting according to SN 214001:2010-03 and the cutting pattern shown in Figure 4.
The test specimen geometries will be described in the mechanical characterization section below.

2.4. Characterization of Molding Compounds and Molded Test Specimen

2.4.1. Orifice Flow Test

The OFT according to ISO 7808 [20] was utilized for obtaining the initial comparison values to commercially available phenolic molding compounds. The mold temperature was adjusted to 165 °C and a molding pressure of 7 MPa (70 bar) was chosen. This pressure level is the lowest that is allowed by the ISO 7808 standard, with the other pressure levels being 12 MPa (120 bar) and 19 MPa (190 bar). Using the OFT, the correct initial SME for the short fiber molding compound for the twin-screw extruder compounding trials was chosen. Molding compounds with a fiber content of 60 wt% were manufactured and the extruder process parameters (screw speed and throughput) were adjusted until the target value of OFT (7 MPa) ≈ 50 was reached, which is a typical value for commercially available phenolic molding compounds. For the chosen extruder parameter settings, the SME into the resin (SMER) were calculated and subsequently used as a target value for compounding the other formulations with lower fiber weight contents.

2.4.2. Differential Scanning Calorimetry

A three-step measurement process has been established for achieving valid and repeatable results in the DSC measurements. In the first step, the granular molding compound was milled and homogenized using a CryoMill by Retsch (Haan, Germany). In this mill, a compound mass of approximately 5.5 g was ground by impact and friction while being cooled with liquid nitrogen at a temperature of −196 °C. The grinding was required to provide a good contact between the DSC pan and the sample [26]. At the same time, the low temperature reduced the energy input into the material and facilitated the milling process due to the embrittlement of the polymer. The glass fibers in the molding compound were ground as well, thus ensuring an even distribution of the inert glass fibers in the reactive resin.
The ground compound powder was transferred into the DSC pan for the second step. Due to the condensation reaction of the phenolic resin and the release of ammonia caused by the HMTA decomposition, sealed DSC medium pressure pans were utilized (Mettler Toledo type 29,990, 120 µL). Three samples were taken from each ground molding compound and analyzed by using a DSC 1 device by Mettler Toledo (43240 Columbus, OH, USA). The chosen DSC profile was a temperature ramp of 10 K/min in the range of 40 °C to 300 °C under a nitrogen atmosphere. The heat of reaction ΔH was calculated according to DIN EN ISO 11357-5 [37] by integrating the area between the reaction peak and the interpolated baseline.
To account for the different fiber weight contents of the various formulations and to ensure comparability, each DSC sample was removed from the pan after completing the measurement and was subjected to a thermogravimetric analysis (TGA) in the third step of the measurement procedure. The chosen TGA profile was a temperature ramp of 10 K/min in the range of 25 °C to 650 °C, with a subsequent holding time of 10 min under an air atmosphere. The TGA served the purpose of determining the solids content in the sample, so that the heat of reaction ΔH could be related to the resin content. Additionally, analyzing each of the three samples per specimen allowed for a judgement of the homogenization quality achieved in the grinding process. Typical deviations between the three samples were below 0.5 wt%-points, which indicates a good homogenization.

2.4.3. Fiber Length Measurement

A fiber length analysis was carried out for the short fiber molding compound granulate. The measurement process consisted of the following four steps: (1) matrix removal by pyrolysis at 650 °C for 18 h under an air atmosphere, (2) transfer into an aqueous suspension and dilution to the required concentration, (3) image acquisition using a flatbed scanner, and (4) image evaluation using the commercially available FASEP® software [38]. Four separate samples with an initial compound mass of 3 g were analyzed for each molding compound formulation, resulting in a total number between 25,000 and 31,000 analyzed fibers per formulation. The development and validation of the measurement method are described in detail in [39].

2.4.4. Mechanical Characterization

The mechanical characterization was carried out using the test specimens shown in Figure 4 according to the technical standards DIN EN ISO 527 [40] (tensile testing) and DIN EN ISO 179-1 [41] (unnotched Charpy impact testing).
For the tensile testing, the specimen geometry type 1B according to DIN EN ISO 527-2 was chosen. The total specimen length was 160 mm, with a length of 60 mm for the narrow parallel part. The specimens had a thickness of 4 mm. The measurement length for the tactile extensometer was 50 mm. During the testing, a testing speed of 1 mm/min was chosen as required by DIN EN ISO 527-2 for the determination of the Young’s modulus. The unnotched Charpy impact test specimens had dimensions of 80 mm × 10 mm × 4 mm. A broadside impact with a support width of 64 mm was chosen. The impactor energy was 1 J.

3. Results

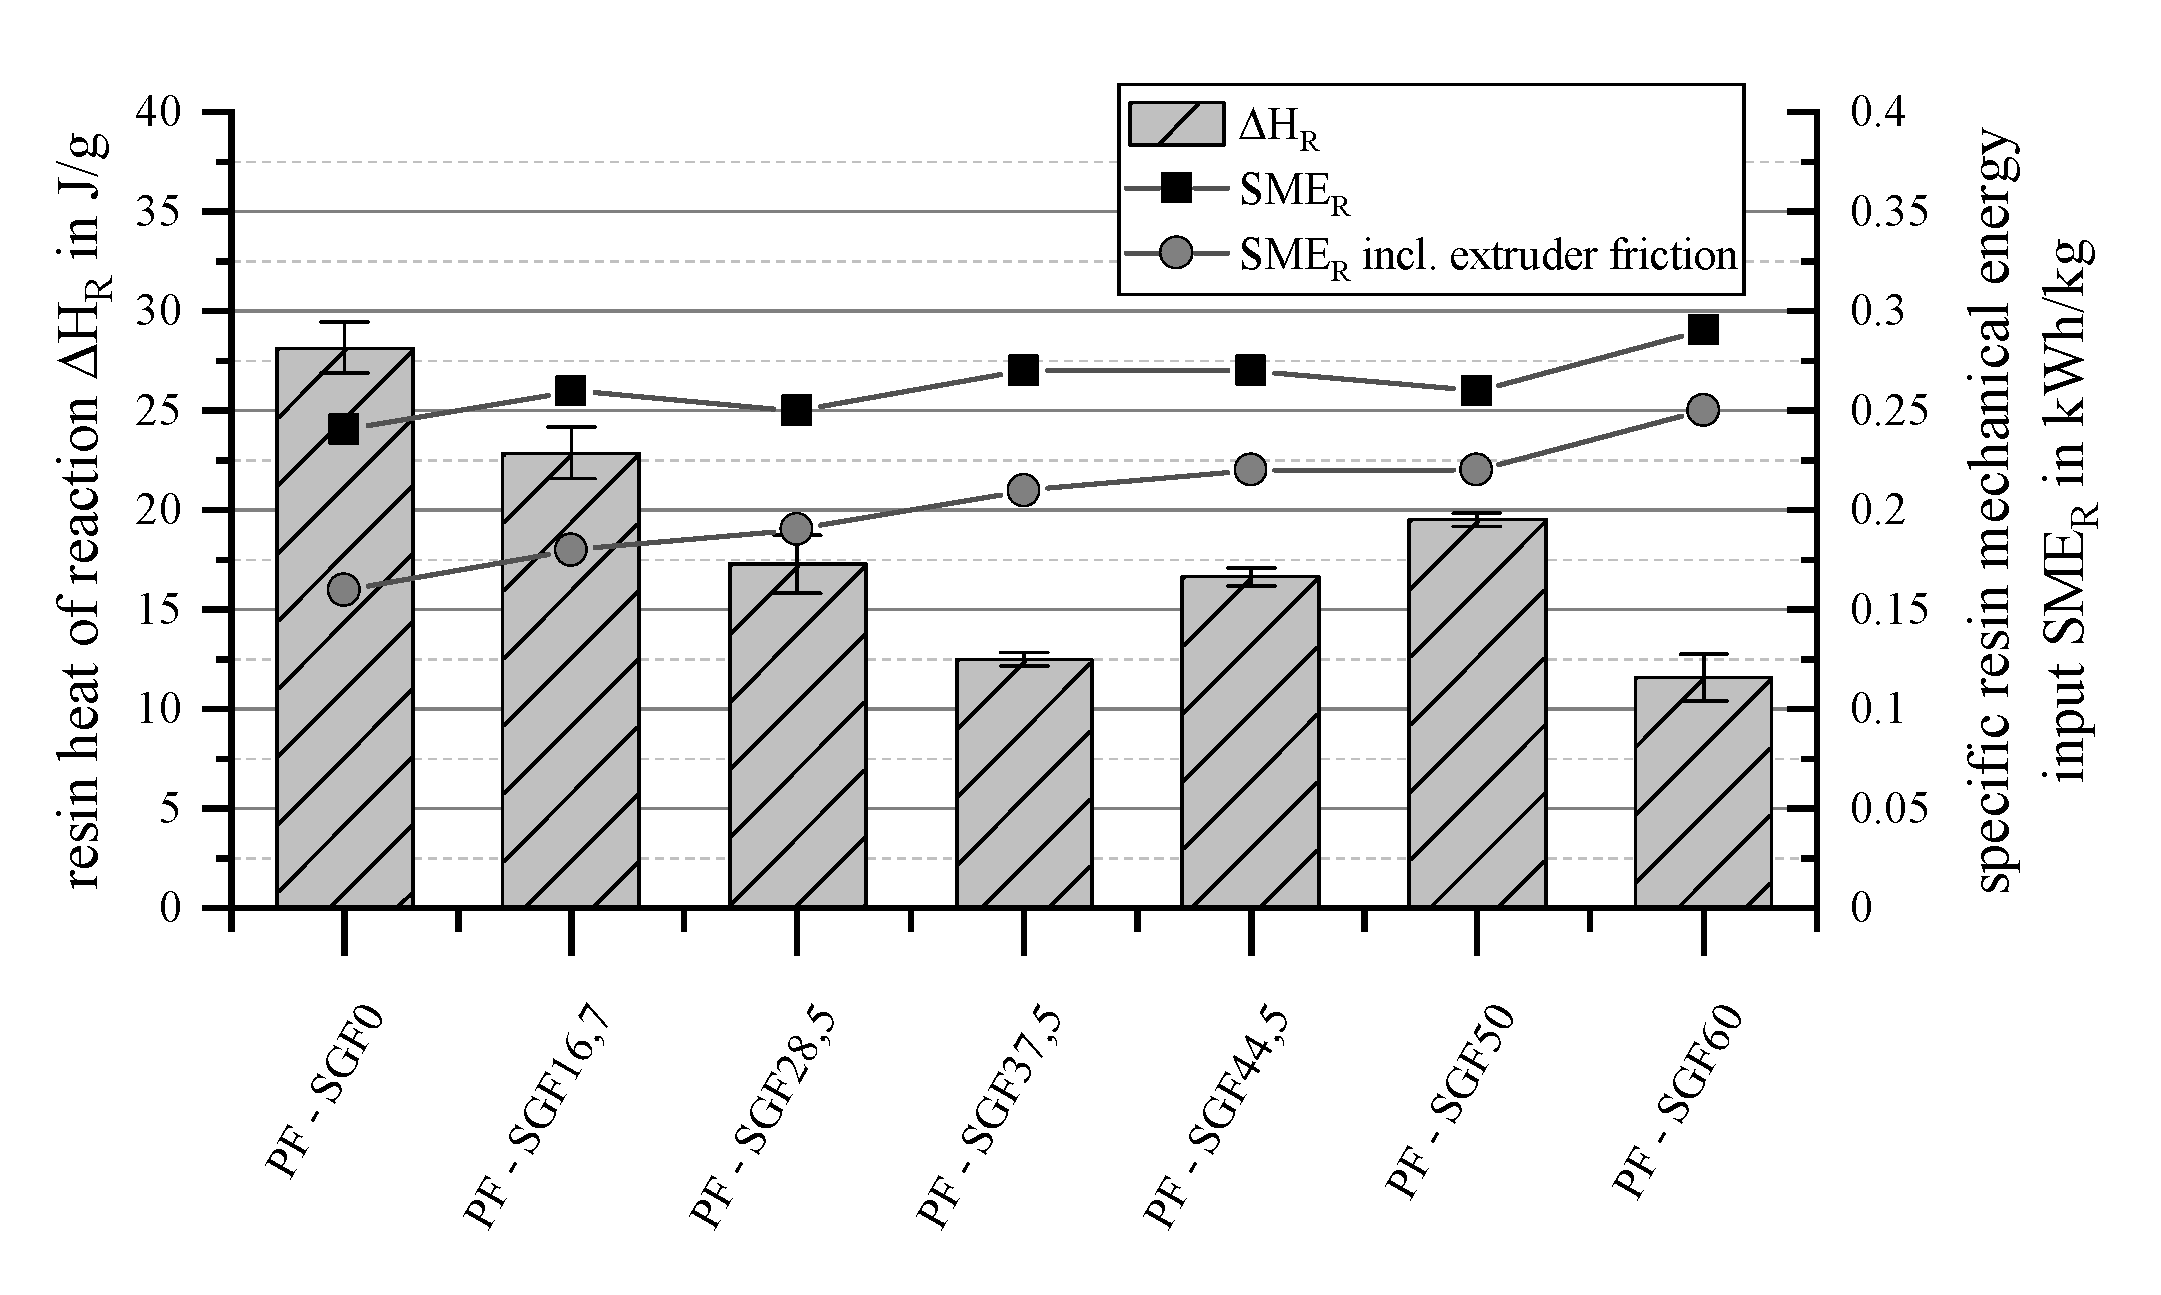
3.1. Compounding and Calorimetric Measurements

The orifice flow test (OFT) was used to adjust the energy input into the molding compound in the compounding process. Based on an OFT value of OFT (7 MPa) ≈ 50, the reference value for the specific mechanical energy input was set to SMER = 0.28 kWh/kg. By adjusting the extruder speed and the throughput, it was targeted for maintaining the energy input SMER constant for all formulations. Figure 5 shows the values achieved for SMER, and the corresponding DSC measurement results for the residual reaction enthalpy ΔHR.
Low fiber weight contents generally require a higher extruder speed and a lower throughput to keep the SME constant. Nevertheless, its value decreased from SMER = 0.28 kWh/kg for the PF-SGF60 formulation to SMER = 0.24 kWh/kg for PF-SGF0. Since the extruder motor power was used to calculate SMER, this value includes both the energy input to the material and the energy dissipation due to extruder friction. In this context, the extruder friction was defined as the sum of the friction losses in the motor, the gearbox, and between the screws and the barrel. It was determined by operating the extruder at the selected screw speeds for a short time without any molding compound, this means that the gravimetric feeders were switched off. For this reason, a second data series for SMER is shown in Figure 5, considering the extruder friction. With increasing extruder speed, the delta between SMER and SMER including the extruder friction increases.
The residual reaction enthalpy ΔHR was highest for the lower fiber content formulations, indicating that they experienced less reaction progress during the compounding process than the higher fiber content formulations. The fundamental trend for ΔHR was consistent with the calculated values for the specific mechanical energy input during compounding. However, this relationship can only explain the decrease in ΔHR from the PF-SGF0 to the PF-SGF37,5 formulation. There must be other reasons for the increase in ΔHR for the PF-SGF44,5 and PF-SGF50 formulations, which will be discussed below.

3.2. Fiber Length Measurement

The weighted average fiber length distributions Lp,i for the different formulations are shown in Figure 6.
The weighted average fiber length is the highest for the PF-SGF15 formulation at Lp = 439 µm, and drops down to Lp = 336 µm for the PF-SGF60 compound. It can be seen that this compound has the highest fraction of fibers of the two shortest fiber length classes. Starting with the length class L = 401–600 µm, this order is reversed.

3.3. Mechanical Testing

The test specimen plates manufactured from the molding compounds were characterized with respect to their tensile and Charpy impact properties, see Figure 7.
For both specimen orientations, 0° and 90° to the flow direction, an approximately linear increase of the Young’s modulus can be observed with increasing fiber content. The Young’s modulus is approximately 25% higher in the 0° direction than at 90° to the material flow. The curve for the tensile strength was also similarly shaped for both orientations. It reached a plateau at fiber fractions larger than 45 wt%. Again, the 0° specimens were stronger than those with a 90° orientation, and reached tensile strength values of σm,0 = 90 MPa.
The unnotched Charpy impact strength in the 0° orientation reached a plateau at fiber fractions of approximately 45 wt%. In contrast to that, the impact strength perpendicular to the direction of flow showed no significant dependence on the fiber content. Only a slight increase within the uncertainty of the measurement up to 50 wt% fiber content was observed, with an equally slight and unsignificant drop for the 60 wt% formulation.

4. Discussion

4.1. Compounding and Calorimetric Measurements

Possible explanations for the deviations in the residual reaction enthalpy ΔHR are examined in the following paragraphs. Besides the total mechanical energy input into the reactive phenolic resin, relevant aspects for the curing process are the temperature and the time for which the polymer is exposed to that temperature. Both time and temperature are influenced by the process parameters of throughput and screw speed, which were used for adjusting the SME. As noted by Dreiblatt [14], the SME only reflects the total amount of shear energy input into the material, not the duration over which the shear energy is introduced into the material. With a longer residence time in the extruder, the molding compound would be exposed to elevated temperatures for longer, likely increasing the reaction progress.
Both an increase in throughput and an increase in the screw speed shorten the residence time in the extruder. The effect of the throughput is larger according to the literature [42,43]. Measurements of the residence time distribution for the specific experimental setup used within this study confirmed this correlation. The residence time distribution was measured by putting a colorant into the extruder main feed and observing the material’s color at the extruder outlet. The time from the first appearance of the colorant to the maximum color intensity and to the end of color change, were measured, see Figure 8.
Doubling the extruder speed from 150 rpm to 300 rpm, e.g., increasing it by 100%, reduced the residence time by approximately 10–15 s, which is a reduction of 22–33%. To achieve the same residence time reduction, only a 50% increase in throughput from 20 kg/h to 30 kg/h is required.
While the effects of extruder speed and throughput on residence time have the same trend direction, they are opposite with respect to their influence on the material temperature. Increasing screw speed increases the temperature, while increasing throughput decreases temperature [43]. The influences of the process parameters on the material temperature and the residence time are summarized in Figure 9.
Another possible influence on the time the resin spends at an elevated temperature is the post-processing after the extruder outlet. It was observed that with decreasing fiber content, the bulk density increased, which led to a more compact, quicker cooling material. At high fiber concentrations, more entrapped air could be observed, likely leading to slower cooling and therefore further reaction progress.

4.2. Fiber Length Measurement

The observed decrease in weighted average fiber length with increasing fiber content can likely be explained by an increased number of fiber–fiber interactions and the higher compound viscosity. These are likely the reasons for the decrease in average fiber length for the formulations with high fiber contents. Identical trends were observed by Bajracharya et al. [44] and Goris et al. [45] for polypropylene.
The ratio of the weighted average fiber length and the number average fiber length, FLD = Lp/Ln, has been used by several authors to assess the quality of fiber dispersion. According to Meyer et al. [46], a good fiber dispersion in the polymer matrix is achieved at a value of FLD = Lp/Ln ≈ 1.4. This value is in good agreement with the experimental [45,47] and numerical [48] studies of other authors. For the phenolic molding compounds manufactured in the present study, the quotient is in a narrow range of FLD = 1.23 … 1.26, which indicates that a good fiber dispersion without bundles can be assumed.

4.3. Mechanical Testing

Subsequently, the mechanical testing results are discussed based on the literature information. For the significant difference between the 0° and 90° specimen orientations towards the material flow, the skin and core structure of the molded plates are responsible. This has been studied extensively by several authors. Singh et al. [49], Englich [50], as well as Kobayashi and Hamada [51] showed that the skin layers with fibers oriented at 0° to the flow direction and a core layer with fibers perpendicular to the flow exist. Due to the high degree of fiber orientation in those skin layers, the composite exhibits better mechanical properties in the 0° direction.
With increasing fiber content, a linear increase in the modulus should be expected, according to the rule of mixtures. Several researchers have carried out experimental investigations for varying fiber contents in thermoplastics, but none exist for thermoset molding compounds. Thomason and Vlug conducted extensive investigations for the modulus [52], the strength, and the strain at failure [53], as well as the impact strength [54] of glass fiber-reinforced polypropylene (PP) with fiber contents of 3–60 wt%. The cited works [52,53,54] were carried out using random in-plane oriented specimens prepared by a wet deposition process. Thomason and Vlug found that for these composite materials, the modulus increased in a linear fashion until a fiber content of 40 wt% was reached. For higher fiber contents, the improvement flattened and was less pronounced. Similarly, both the tensile strength and the impact strength showed an almost linear increase with increasing fiber content.
Thomason also investigated the behavior of injection molded polypropylene test bars with fiber contents of 0–40 wt% [55] and high fiber contents of [56] up to 70 wt%. The interesting aspect of this work is that the tests were also conducted at temperatures below the glass transition temperature Tg of the polypropylene, which means that a very brittle matrix was present. Since Thomason was working with net-shape molded test bars, a predominant fiber orientation in the 0° orientation must be assumed. The maximum notched Charpy impact strength for these test bars at T < Tg was found at 40–50 wt% fiber content. At higher fiber content values, the impact strength was dropping off again. This behavior reflects the 0° specimens of the phenolic molding compound investigated here. For the 90° specimens, the brittle matrix behavior of the phenolic resin appears to be dominant.
The low-temperature impact tests with varying fiber content by Thomason were found to be the closest literature comparison results for the phenolic molding compounds produced within this study. In general, a good accordance of the measured mechanical properties with the available literature results can be stated.

5. Conclusions

For a newly developed thermoset injection molding process, short glass fiber-reinforced phenolic molding compounds with a fiber content between 0 wt% and 60 wt% were manufactured by twin-screw extruder compounding. To achieve a comparable degree of remaining heat of the reaction in the phenolic resin, despite the different fiber contents, the specific mechanical energy input (SME) was used as a control parameter for adjusting the extruder processing parameters of screw speed and material throughput. The molding compounds were subsequently characterized by calorimetric laboratory measurements. In contrast to the laboratory measurements, the SME can be calculated directly during the compounding trials, enabling a quick and simple determination of the required processing parameters.
It was found that for formulations with a fiber content between 30 wt% and 60 wt%, the SME showed a good correlation with the remaining heat of the reaction of the resin. Other diffuse influence factors on the resin reaction progress, such as material temperature and residence time in the extruder, were identified. Their influence could not be quantified, but they can serve as an explanation for the worse correlation between SME and the remaining heat of the reaction for the lower fiber content formulations. However, it was shown that the specific mechanical energy input was a major influence factor on the reaction progress. In contrast to the other factors (residence time and material temperature), it can quickly be measured and adjusted directly during the compounding process.
In addition, mechanical characterization and a fiber length distribution measurement were carried out. A reduction in the weighted average fiber length from Lp = 439 µm for a 15 wt% fiber content formulation to Lp = 336 µm for 60 wt% fibers was found, which can be explained by the higher molding compound viscosity and the increased number of fiber–fiber interactions. The tensile testing showed a linear improvement in the tensile strength up to a fiber content of 40–50 wt%. The unnotched Charpy impact properties showed a similar behavior. The Young’s modulus continued its linear increase up to a fiber content of 60 wt%, which is in accordance with the rule of mixtures.

Author Contributions

Conceptualization, R.M., P.E. and K.A.W.; methodology, R.M., W.V.L. and K.A.W.; validation, R.M., W.V.L. and K.A.W.; investigation, R.M.; resources, R.M. and P.E.; data curation, R.M.; writing—original draft preparation, R.M.; writing—review and editing, R.M., W.V.L. and K.A.W.; visualization, R.M.; supervision, W.V.L., P.E. and K.A.W.; project administration, W.V.L., P.E. and K.A.W.; funding acquisition, P.E. and K.A.W. All authors have read and agreed to the published version of the manuscript.

Funding

This research was funded by the Deutsche Forschungsgemeinschaft (DFG, German Research Foundation), grant number EL 473/9-1 and WE 4273/18-1. The APC was funded by the Deutsche Forschungsgemeinschaft (DFG, German Research Foundation), grant number EL 473/9-1 and WE 4273/18-1.

Acknowledgments

The phenolic molding compound was provided by Sumitomo Bakelite Co., Ltd. (Vyncolit N.V., Gent, Belgium).

Conflicts of Interest

The authors declare no conflict of interest. The funders had no role in the design of the study; in the collection, analyses, or interpretation of data; in the writing of the manuscript, or in the decision to publish the results.

References

  1. Beran, T.; Hübel, J.; Maertens, R.; Reuter, S.; Gärtner, J.; Köhler, J.; Koch, T. Study of a polymer ejector design and manufacturing approach for a mobile air conditioning. Int. J. Refrig. 2021, 126, 35–44. [Google Scholar] [CrossRef]
  2. Ball, C. Phenolic molding compounds in automotive powertrain applications. In Proceedings of the 17th Annual Automotive Conference & Exhibition, Novi, MI, USA, 6–8 September 2017. [Google Scholar]
  3. Jauernick, M.; Pohnert, D.; Kujawski, W.; Otte, R. Hybrid lightweight cylinder crankcase: Challenges and feasibility. MTZ Worldw. 2019, 80, 70–75. [Google Scholar] [CrossRef]
  4. Schindele, K.; Sorg, T.; Hentschel, T.; Liebertseder, J. Lightweight camshaft module made of high-strength fiber-reinforced plastic. MTZ Worldw. 2020, 81, 26–31. [Google Scholar] [CrossRef]
  5. Langheck, A.; Reuter, S.; Saburow, O.; Maertens, R.; Wittemann, F.; Berg, L.F.; Doppelbauer, M. Evaluation of an integral injection molded housing for high power density synchronous machines with concentrated single-tooth winding. In Proceedings of the 2018 8th International Electric Drives Production Conference (EDPC), Schweinfurt, Germany, 4–5 December 2018; pp. 187–192. [Google Scholar] [CrossRef]
  6. Koizumi, K.; Charles, T.; Keyser, H.D. Phenolic molding compounds. In Phenolic Resins: A Century of Progress; Pilato, L.A., Ed.; Springer: Berlin, Germany, 2010; pp. 383–437. ISBN 978-3-642-04713-8. [Google Scholar]
  7. Wan, J.; Wang, S.; Li, C.; Zhou, D.; Chen, J.; Liu, Z.; Yu, L.; Fan, H.; Li, B.-G. Effect of molecular weight and molecular weight distribution on cure reaction of novolac with hexamethylenetetramine and properties of related composites. Thermochim. Acta 2012, 530, 32–41. [Google Scholar] [CrossRef]
  8. Chaiwan, P.; Pumchusak, J. The synergistic effects of multi-filler addition on the mechanical and thermo-mechanical properties of phenolic resins. MSF 2018, 940, 23–27. [Google Scholar] [CrossRef]
  9. Šahinović, A.; Mušič, B. Improvement of the mechanical properties of thermosetting-binding-system-based composites by means of kneading procedure modification and composite formulation. Processes 2020, 8, 625. [Google Scholar] [CrossRef]
  10. Kalyon, D.M.; Hallouch, M. Compounding of thermosets in continuous kneaders. Adv. Polym. Technol. 1986, 6, 237–249. [Google Scholar] [CrossRef]
  11. Methe, D.; Gehde, M. Analysis of the flow-curing behavior of chemically foamable phenolic molding compounds in the extrusion process. J. Plast. Technol. 2020, 5, 227–254. [Google Scholar] [CrossRef]
  12. Rudin, B.; Drummer, D. Heat conductive thermosets for the injection molding process. In Proceedings of the 2012 2nd International Electric Drives Production Conference (EDPC), Nuremberg, Germany, 15–18 October 2012; IEEE: New York, NY, USA, 2012; pp. 1–4, ISBN 978-1-4673-3008-4. [Google Scholar]
  13. Tonogai, S.; Hasegawa, K.; Fukuda, A. The disk cure test—An evaluation method for flow and curing characteristics of thermosetting molding compounds. Polym. Eng. Sci. 1980, 20, 985–994. [Google Scholar] [CrossRef]
  14. Dreiblatt, A.; Canedo, E.L. Distribution of specific energy in twin-screw corotating extruders using one-dimensional process simulation. In ANTEC 2012; Society of Plastics Engineers: Danbury, CT, USA, 2012. [Google Scholar]
  15. Abeykoon, C.; Kelly, A.L.; Brown, E.C.; Vera-Sorroche, J.; Coates, P.D.; Harkin-Jones, E.; Howell, K.B.; Deng, J.; Li, K.; Price, M. Investigation of the process energy demand in polymer extrusion: A brief review and an experimental study. Appl. Energy 2014, 136, 726–737. [Google Scholar] [CrossRef]
  16. Inceoglu, F.; Ville, J.; Ghamri, N.; Pradel, J.L.; Durin, A.; Valette, R.; Vergnes, B. Correlation between processing conditions and fiber breakage during compounding of glass fiber-reinforced polyamide. Polym. Compos. 2011, 32, 1842–1850. [Google Scholar] [CrossRef]
  17. Berzin, F.; Vergnes, B.; Beaugrand, J. Evolution of lignocellulosic fibre lengths along the screw profile during twin screw compounding with polycaprolactone. Compos. Part A Appl. Sci. Manuf. 2014, 59, 30–36. [Google Scholar] [CrossRef]
  18. Stratiychuk-Dear, D.; Looney, K.; Oliver, P.; Blackburn, S.; Simmons, M. Investigating the impact of operating conditions on the extent of additive mixing during thermoplastic polymer extrusion. In AIP Conference Proceedings 1914, Proceedings of the Pps-32: The 32nd International Conference of The Polymer Processing Society—Conference Papers, Lyon, France, 25–29 July 2016; AIP Publishing: Melville, NY, USA, 2017; p. 150002. [Google Scholar]
  19. Englich, S. Strukturbildung bei der Verarbeitung von glasfasergefüllten Phenolformaldehydharzformmassen; Universitätsverlag Chemnitz: Chemnitz, Germany, 2015; ISBN 978-3-944640-61-7. [Google Scholar]
  20. ISO. 7808 Plastics: Thermosetting Moulding Materials—Determination of Transfer Flow; ISO: Geneva, Switzerland, 1998. [Google Scholar]
  21. ASTM. D3123—09 Standard Test Method for Spiral Flow of Low-Pressure Thermosetting Molding Compounds; ASTM: West Conshohocken, PA, USA, 2017. [Google Scholar]
  22. ASTM. D569 Method for Measuring the Flow Properties of Thermoplastic Molding Materials, Withdrawn; ASTM: West Conshohocken, PA, USA, 1995. [Google Scholar]
  23. ASTM. D731−18 Standard Test Method for Molding Index of Thermosetting Molding Powder; ASTM: West Conshohocken, PA, USA, 2018. [Google Scholar]
  24. DIN 53764. Test Method for Flow and Cure Properties of Pourable Thermosettings Using a Torque Rheometer and a Measuring Mixer (Withdrawn); DIN: Berlin, Germany, 1992. [Google Scholar]
  25. Osswald, T.A.; Rudolph, N. Polymer Rheology: Fundamentals and Applications; Hanser: Munich, Germany, 2014; ISBN 978-1-56990-523-4. [Google Scholar]
  26. Menczel, J.D.; Prime, R.B. Thermal Analysis of Polymers; John Wiley & Sons, Ltd.: Hoboken, NJ, USA, 2009; ISBN 9780471769170. [Google Scholar]
  27. Domínguez, J.C.; Alonso, M.V.; Oliet, M.; Rojo, E.; Rodríguez, F. Kinetic study of a phenolic-novolac resin curing process by rheological and DSC analysis. Thermochim. Acta 2010, 498, 39–44. [Google Scholar] [CrossRef]
  28. Stark, W. Investigation of curing behaviour of melamine/phenolic (MP) thermosets. Polym. Test. 2010, 29, 723–728. [Google Scholar] [CrossRef]
  29. Scheffler, T. Werkstoffeinflüsse auf den Spritzgussprozess von hochgefüllten Phenol-Formaldehydharz-Formmassen; Universitätsverlag Chemnitz: Chemnitz, Germany, 2018; ISBN 3961000735. [Google Scholar]
  30. Gardziella, A.; Pilato, L.A.; Knop, A. Phenolic Resins: Chemistry, Applications, Standardization, Safety and Ecology, 2nd ed.; Springer: Berlin, Germany, 2000; ISBN 3540655174. [Google Scholar]
  31. Ishida, H.; Rodriguez, Y. Curing kinetics of a new benzoxazine-based phenolic resin by differential scanning calorimetry. Polymer 1995, 36, 3151–3158. [Google Scholar] [CrossRef]
  32. Alonso, M.V.; Oliet, M.; Pérez, J.M.; Rodríguez, F.; Echeverría, J. Determination of curing kinetic parameters of lignin–phenol–formaldehyde resol resins by several dynamic differential scanning calorimetry methods. Thermochim. Acta 2004, 419, 161–167. [Google Scholar] [CrossRef]
  33. Park, B.-D.; Riedl, B.; Hsu, E.W.; Shields, J. Differential scanning calorimetry of phenol–formaldehyde resins cure-accelerated by carbonates. Polymer 1999, 40, 1689–1699. [Google Scholar] [CrossRef]
  34. De Medeiros, E.S.; Agnelli, J.A.M.; Joseph, K.; de Carvalho, L.H.; Mattoso, L.H.C. Curing behavior of a novolac-type phenolic resin analyzed by differential scanning calorimetry. J. Appl. Polym. Sci. 2003, 90, 1678–1682. [Google Scholar] [CrossRef]
  35. Sumitomo Bakelite Europe n.v. Technical Data Sheet X6952 Green. Available online: https://www.sbhpp.com/products-applications/catalog/item/vyncolit-x6952 (accessed on 8 April 2021).
  36. 3B Fibreglass. Technical Data Sheet Chopped Strands DS5163-13P. Available online: https://www.3b-fibreglass.com/sites/default/files/products-data-sheets/TDS-DS5163-13P.pdf (accessed on 8 April 2021).
  37. DIN EN ISO. 11357-5 Differential Scanning Calorimetry (DSC): Determination of Characteristic Reaction-Curve Temperatures and Times, Enthalpy of Reaction and Degree of Conversion (11357-5:2013); DIN: Berlin, Germany, 2014. [Google Scholar]
  38. Hartwich, M.R.; Höhn, N.; Mayr, H.; Sandau, K.; Stengler, R. FASEP ultra-automated analysis of fibre length distribution in glass-fibre-reinforced products. In Optical Measurement Systems for Industrial Inspection VI; Lehmann, P.H., Ed.; SPIE Europe Optical Metrology: Munich, Germany, 2009. [Google Scholar]
  39. Maertens, R.; Hees, A.; Schöttl, L.; Liebig, W.V.; Elsner, P.; Weidenmann, K.A. Fiber shortening during injection molding of glass fiber-reinforced phenolic molding compounds: Fiber length measurement method development and validation. Polym. Plast. Technol. Mater. 2021, 60, 872–885. [Google Scholar] [CrossRef]
  40. DIN EN ISO. 527 Plastic—Determination of Tensile Properties; DIN: Berlin, Germany, 2011. [Google Scholar]
  41. DIN EN ISO. 179-1 Plastics—Determination of Charpy Impact Properties; DIN: Berlin Germany, 2008. [Google Scholar]
  42. Kao, S.V.; Allison, G.R. Residence time distribution in a twin screw extruder. Polym. Eng. Sci. 1984, 24. [Google Scholar] [CrossRef]
  43. Rudolf, R. General overview of the compounding process: Tasks, selected applications, and process zones. In Co-Rotating Twin-Screw Extruders: Fundamentals; Kohlgrüber, K., Ed.; Hanser Publishers: Munich, Germany, 2020; ISBN 978-1-56990-748-1. [Google Scholar]
  44. Bajracharya, R.M.; Manalo, A.C.; Karunasena, W.; Lau, K.-T. Experimental and Theoretical Studies on the Properties of Injection Moulded Glass Fibre Reinforced Mixed Plastics Composites. Compos. Part A Appl. Sci. Manuf. 2016, 84, 393–405. [Google Scholar] [CrossRef]
  45. Goris, S.; Simon, S.; Montoya, C.; Bechara, A.; Candal, M.V.; Brands, D.; Yanev, A.; Osswald, T.A. Experimental study on fiber attrition of long glass fiber-reinforced thermoplastics under controlled conditions in a couette flow. In ANTEC 2017; Society of Plastics Engineers: Danbury, CT, USA, 2017; pp. 600–606. [Google Scholar]
  46. Meyer, R.; Almin, K.E.; Steenberg, B. Length reduction of fibres subject to breakage. Br. J. Appl. Phys. 1966, 17, 409–416. [Google Scholar] [CrossRef]
  47. Shon, K.; Liu, D.; White, J.L. Experimental studies and modeling of development of dispersion and fiber damage in continuous compounding. IPP 2005, 20, 322–331. [Google Scholar] [CrossRef]
  48. Sasayama, T.; Inagaki, M.; Sato, N. Direct simulation of glass fiber breakage in simple shear flow considering fiber-fiber interaction. Compos. Part A Appl. Sci. Manuf. 2019, 124. [Google Scholar] [CrossRef]
  49. Singh, R.; Chen, F.; Jones, F.R. Injection molding of glass fiber reinforced phenolic composites. 2: Study of the injection molding process. Polym. Compos. 1998, 19, 37–47. [Google Scholar] [CrossRef]
  50. Englich, S.; Scheffler, T.; Gehde, M. Specific mold filling characteristics of highly filled phenolic injection molding compounds. In ANTEC 2013; Society of Plastics Engineers: Danbury, CT, USA, 2013; pp. 2068–2071. [Google Scholar]
  51. Kobayashi, T.; Hamada, H. Basic study of thermosetting injection composites. In ANTEC 2015; Society of Plastics Engineers: Danbury, CT, USA, 2015; pp. 2873–2877. [Google Scholar]
  52. Thomason, J.L.; Vlug, M.A. Influence of fibre length and concentration on the properties of glass fibre-reinforced polypropylene: 1. Tensile and flexural modulus. Compos. Part A Appl. Sci. Manuf. 1996, 27, 477–484. [Google Scholar] [CrossRef]
  53. Thomason, J.L.; Vlug, M.A.; Schipper, G.; Krikor, H. Influence of fibre length and concentration on the properties of glass fibre-reinforced polypropylene: Part 3. Strength and strain at failure. Compos. Part A Appl. Sci. Manuf. 1996, 27, 1075–1084. [Google Scholar] [CrossRef]
  54. Thomason, J.L.; Vlug, M.A. The Influence of fibre length and concentration on the properties of glass fibre-reinforced polypropylene: 4. Impact properties. Compos. Part A Appl. Sci. Manuf. 1997, 28, 277–288. [Google Scholar] [CrossRef]
  55. Thomason, J.L. The Influence of fibre length and concentration on the properties of glass fibre-reinforced polypropylene: 5. Injection moulded long and short fibre PP. Compos. Part A Appl. Sci. Manuf. 2002, 33, 1641–1652. [Google Scholar] [CrossRef]
  56. Thomason, J.L. The Influence of fibre length and concentration on the properties of glass fibre-reinforced polypropylene: 6. The properties of injection moulded long fibre PP at high fibre content. Compos. Part A Appl. Sci. Manuf. 2005, 36, 995–1003. [Google Scholar] [CrossRef] [Green Version]
Figure 1. Process scheme of the long fiber injection molding process.
Jcs 05 00127 g001
Figure 2. Orifice flow test (OFT) according to ISO 7808 [20].
Jcs 05 00127 g002
Figure 3. Screw layout and temperature profile for manufacturing the short fiber phenolic molding compounds.
Jcs 05 00127 g003
Figure 4. Cutting pattern with specimen locations.
Jcs 05 00127 g004
Figure 5. Reaction enthalpy and specific mechanical energy input for the PF-SGF formulations.
Jcs 05 00127 g005
Figure 6. Weighted average fiber length distribution for the short fiber molding compounds.
Jcs 05 00127 g006
Figure 7. Results for the tensile testing and the Charpy impact testing.
Jcs 05 00127 g007
Figure 8. Residence time distribution for the selected process parameter combinations.
Jcs 05 00127 g008
Figure 9. Qualitative influence of extruder speed and throughput on residence time and material temperature.
Jcs 05 00127 g009
Table 1. Parameters for the injection molding of sample plates.
ParameterUnitValue
Plasticizing unit temperature profile inlet—nozzle°C60–70–80–90
Mold temperature°C185
Screw speed1/min40
Back pressurebar30
Injection speedcm3/s100
Switchover pressure at pressure sensor 2bar100
Hold pressure stage 1bar for sPF-SGF0:
constant 300 bar for 30 s
PF-SGF16.7 and PF-SGF28.5:
constant 600 bar for 30 s
All other formulations:
constant 800 bar for 30 s
Hold pressure stage 2bar to bar in sramp from hold pressure stage 1 (300 bar, 600 bar or 800 bar) to 10 bar in 10 s
Cure times110
Table 2. Post-cure cycle for molded plates.
Elapsed Time in MinStep End Temperature in °CStep
025start
60150linear ramp
120150hold
240180linear ramp
600180hold
Publisher’s Note: MDPI stays neutral with regard to jurisdictional claims in published maps and institutional affiliations.

