Article

Stress-Strain Behaviour and Mechanical Strengths of Concrete Incorporating Mixed Recycled Plastics

1
UniSA STEM, Scarce Resources and Circular Economy (ScaRCE), University of South Australia, Adelaide, SA 5000, Australia
2
Salisbury City Council, City of Salisbury, Salisbury, SA 5108, Australia
*
Author to whom correspondence should be addressed.
J. Compos. Sci. 2021, 5(6), 146; https://0-doi-org.brum.beds.ac.uk/10.3390/jcs5060146
Submission received: 11 May 2021 / Revised: 27 May 2021 / Accepted: 28 May 2021 / Published: 30 May 2021
(This article belongs to the Special Issue Feature Papers in Journal of Composites Science in 2021)

Abstract

:
Different types of recycled plastic have been used in concrete and most studies have focused on the behaviour of a single type of plastic. However, separating plastic wastes increases the cost and time of processing. To tackle this problem, this research presents an experimental investigation to determine the effect of incorporating different combinations of three types of recycled plastic waste aggregates—Polyethylene terephthalate (PET), High Density Polyethylene (HDPE) and Polypropylene (PP)—at different replacement ratios of coarse aggregate on physical and mechanical properties of concrete. The combinations include two plastic types at 10% and 20% replacement ratios and three plastic types at 15% and 30% replacement ratios. The performance of the plastic concrete was assessed based on various physical and mechanical properties including workability, fresh and dry densities, air content, compressive, indirect tensile and flexural strengths, modulus of elasticity, stress-strain behaviour and ultrasonic pulse velocity. It is found that the workability of Mixed Recycled Plastic Concrete (MRPC) at a low replacement rate is independent of the type of plastic. The minimum reduction in the compressive strength, indirect tensile and modulus of elasticity were achieved by R3 (PET + PP) at 10% replacement, while R5 (HDPE + PP) at 10% replacement achieved the highest flexural strength and ultrasonic pulse velocity values. The findings suggest that the mixed recycled plastics have a good possibility to partially replace coarse aggregates in concrete which will benefit the plastics recycling community and environment. Furthermore, the study will provide guidance to the concrete industry concerning the effect of the implementation of unsorted mixed types of plastic as coarse aggregates in the production of concrete.

1. Introduction

Over the past two decades, plastic waste is responsible for a significant proportion of pollution all over the world. According to official statistics, it is estimated that Australia recovers 393,800 tonnes of plastic annually [1]. Polyethylene terephthalate (PET), High density polyethylene (HDPE) and Polypropylene (PP) are among those with the highest recovery rates and make up 49.6% of the total plastic waste recovered [1]. Broadly speaking, the challenge for Australia to recycle its plastic waste is greater than other countries for many reasons. First, due to restrictions imposed by many countries on importing plastic waste especially those that contain mixed types. Secondly, while Australia’s existing waste-management infrastructure is capable of managing the current volumes of plastic waste, it has a limited capacity to process certain types of plastic. From 2006 to 2017, the plastic recycling rate remained relatively stable, and little was done for recycling plastic waste. Therefore, finding ways to expand and sustain plastic recycling becomes more necessary, in particular, if mixed plastic wastes can be used without further processing.
Recycling plastic waste has become a critical issue as large quantities of mixed plastic are collected but not separated nor recycled into new plastic products. The main management method has been to send this waste to landfills or energy recovery. The low compatibility of different plastic types present in mixed plastic waste results in poor mechanical and aesthetical properties. Separation of different types of plastic during recycling is a difficult and complicated process in addition to high labour costs. For this reason, current volumes of mixed plastic waste are maximal compared to other forms of waste.
There is an urgent need to find solutions for the accumulated mixed plastic waste. Incorporating mixed plastic waste in concrete as a partial replacement of natural aggregates can be a potential way to recycle a significant amount of plastic waste. This will increase the volume of plastic waste inclusion in the construction sector because the separation of different types of plastic is not needed. In addition, this will lead to the recycling of these materials in a sustainable way with a minimal impact on the environment.
Concrete incorporating mixed recycled plastic types has rarely been investigated when compared with the relatively large amount of research on single plastic types as fibre addition [2,3]. However, most researchers reported that the inclusion of mixed types of plastic waste as partial replacement of fine or coarse aggregate affected some of the engineering properties of concrete. A reduction in the slump values was reported by [4,5]. A similar trend was observed in the density of concrete incorporated with mixed plastic types [5] and the reduction is related to the lower density of the plastic. Others reported that the yielded product could be good as lightweight concrete [6]. Inadequate information was available on the compressive strength of concrete with mixed types of plastic waste. Mohammadinia et al. [7] used unknown mixed types of plastic waste as a partial replacement of coarse aggregate up to 50% to investigate its impact on the mechanical properties of concrete. They found a decrease in compressive strength and splitting tensile strength due to weak adhesive strength between the surface of the waste plastic and cement paste. A similar reduction in compressive strength was also reported by [8] when 10% and 20% of natural coarse aggregate were replaced by manufactured mixed recycled plastic aggregate with sizes of 3.35 mm, 5.6 mm and mixed sizes. The stress-strain curve of MRPC has been investigated by [4] who mixed five types of recycled plastic waste aggregate (polypropylene, Polyethylene, Polystyrene, polyvinyl chloride and others) in concrete with a replacement ratio of up to 20% by volume. Some researchers [4] investigated the effect of incorporating mixed waste plastic types (high-density polyethylene, polyvinyl chloride, and polypropylene) on the thermal properties of concrete. They found that the recycled plastic concrete lowered the cooling and heating loads of the buildings.
The literature review highlights that there are very limited studies on concrete incorporated with mixed types of plastics. Some researchers studied the unknown mixed types of plastic [7,8] without specifying the type of plastic or the ratios of each type; instead, they mixed many plastics then selected the ratio from the bulk sample [4,6]. By doing this, the effect of each unknown type and its ratio on the plastic concrete composite performance stay questionable. To the best knowledge of the authors of this paper, no previous study considered mixing the three plastic types (PET, HDPE and PP) in specific proportions in concrete. Therefore, the aim of this research is to address all the above-mentioned research gaps. In the current study, the effects on the mechanical behaviour of adding mixed recycled plastics into concrete are evaluated, which include, (i) fresh properties of concrete (workability, fresh and dry densities and air content); (ii) hardened properties of concrete (compressive, indirect tensile, flexural strengths and modulus of elasticity); (iii) stress-strain behaviour and (iv) ultrasonic pulse velocity (UPV) test. Replacing natural coarse aggregate with different combinations of mixed plastic waste will reduce the volume of plastic waste disposed of in landfills, reduce environmental pollution and help to manage the plastic waste in a more sustainable way.

2. Experimental Methodology
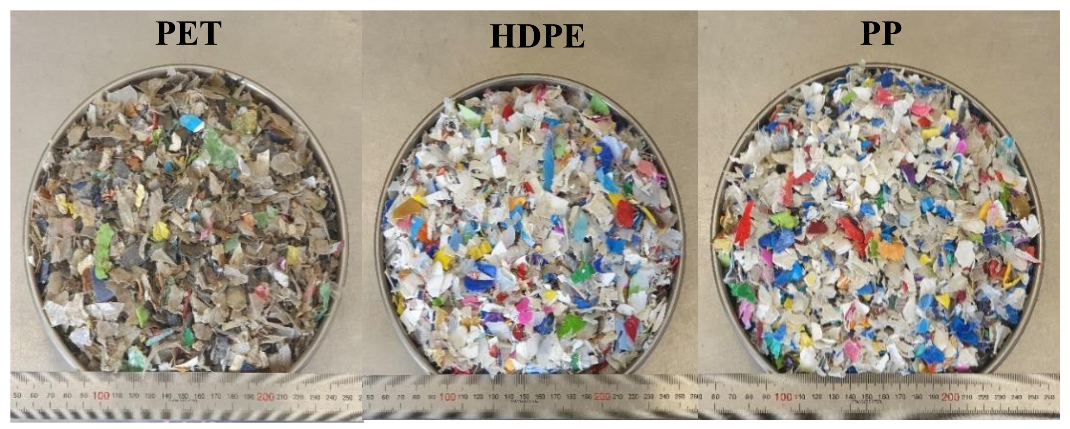
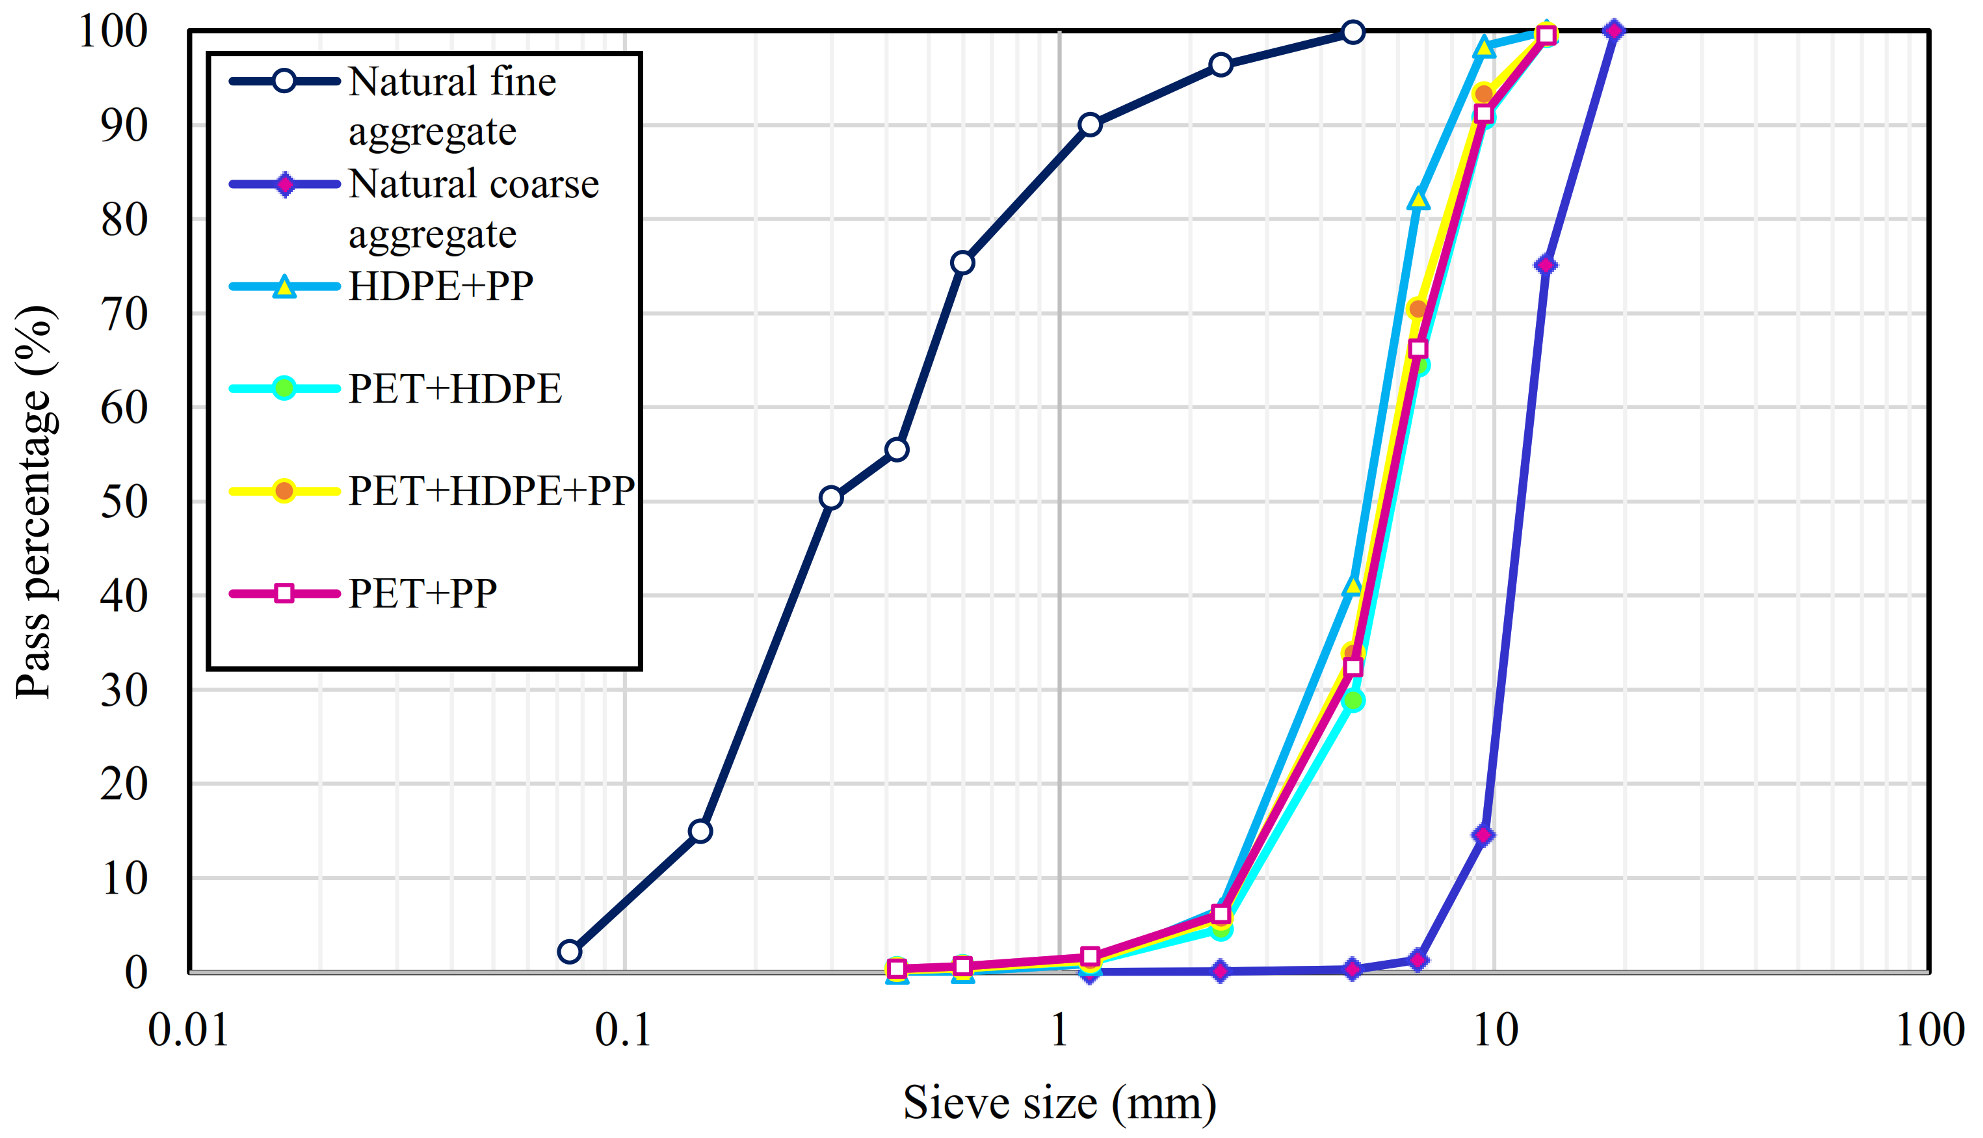
2.1. Materials

A General Purpose (Type GP) cement with a specific gravity of 3.15 was used as a cementitious material for all the mixes to comply with Australian standard (AS) AS 3972 [9]. Jennings Rosedale stone type of 14 mm maximum size was used as the coarse aggregate (particle density on a saturated surface-dried: 2.73 t/m3, apparent particle density: 2.83 t/m3 and water absorption: 2.3%). Natural river sand (Rocla Golden Grove) with a maximum size of 5 mm was used as fine aggregate (particle density on a saturated surface-dried: 2.60 t/m3, apparent particle density: 2.61 t/m3 and water absorption: 0.17%). The particle density, apparent particle density and water absorption for coarse and sand were measured according to AS 1141.6.1 [10] and AS 1141.5 [11], respectively.
Recycled plastic waste aggregates, supplied by RPA Recycling Plastics Australia Pty Ltd., were added to plastic concrete mixes on the basis of different partial replacements of coarse aggregate by volume. The used recycled plastic waste aggregates were PET, HDPE and PP. The specific gravities of PET, HDPE and PP were 1.23, 0.96, 0.91, respectively and the densities were 1224.95, 960.48, 905.32 kg/m3 respectively, according to ASTM D792 [12]. Figure 1 shows the three types of plastic particles. Particle distribution for natural aggregates and the shredded recycled plastic waste aggregate was carried out as per AS 1141.11.1 [13] and is shown in Figure 2. Superplasticizer (SP), BASF MasterGlenium SKY 8708, with a specific gravity of 1.085 was used as high range water reducing admixture.

2.2. Mix Proportion and Specimens Preparation

The proportion of the corresponding mixes were designed to replace the coarse aggregate with three plastic types in different combinations at different replacement ratios. The variables were different combinations of the three plastic types and the replacement ratios. Mixes were designed to include several different plastic-type combinations. A total of nine concrete mixes were designed in accordance with AS 1012.2 [14] (Table 1). Six mixes were selected to include two plastic types with 10% and 20% replacement ratios by volume (5% or 10% from each type) as partial replacements for coarse aggregate. Also, two mixes were selected to include three plastic types with 15% and 30% replacement ratios by volume (5% and 10% of each type) as partial replacements for coarse aggregate. The above-mentioned replacement percentages were chosen in order to be able to include the most acceptable replacement percentages without the need to add high quantities of superplasticizer since it was noticed from the primary trials that increasing the replacement ratio beyond 30% decrease the workability significantly.
A total of 216 cylinders (100 mm × 200 mm) and 27 flexural prisms (100 mm × 100 mm × 470 mm) were prepared for all tests. The control mix with a target strength of 27 MPa and workability of more than 80 mm was prepared by trial and error method. All mixes were designed with a constant water to cement ratio (W/C) and superplasticizer dosage by cement weight; 0.75 and 0.56%, respectively. The manufacturing process was done using a mixer pan with 70 litre capacity and a constant mixing speed of 25 rpm according to AS 1012.2 [14]. The dry fine sand and coarse aggregates including any plastic was mixed for 30 s while adding a part of water. After that, the cementitious materials, admixtures and the remainder of water were added and left to be mixed for 2 min then rested for 2 min then mixed for 2 min. The casting of the concrete was compacted by the standard rod and hammer. After 24 h of casting, the samples were demoulded and cured in a water bath at 23 ± 2 °C according to AS 1012.8.1 [15] until the test date. Compressive strength tests were completed at 3, 7, 14 and 28 days whereas the indirect tensile strength, flexural strength, modulus of elasticity, stress-strain curve and ultrasonic pulse velocity were completed at 28 days only.

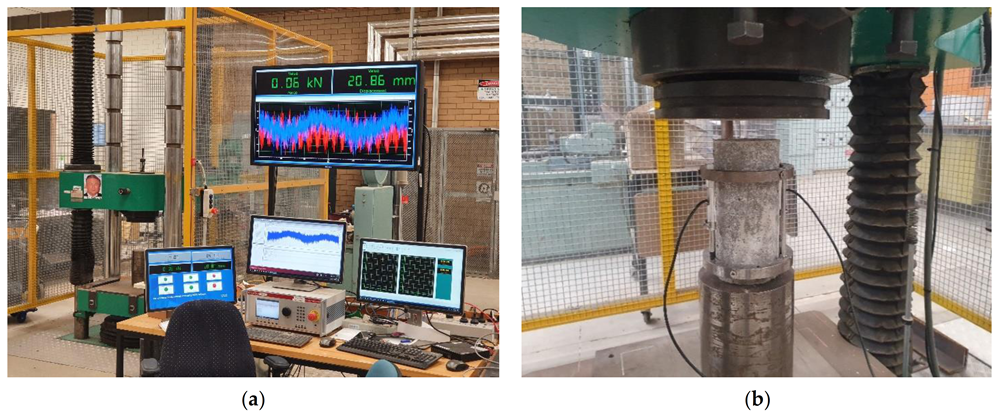
2.3. Laboratory Tests

The fresh concrete properties including, the workability and air content were assessed according to AS 1012.3.1 and 1012.4.2, respectively [16,17]. Fresh density was evaluated directly after preparing the mixes by using a mould with a known volume. Dry hardened density at 28 days was carried out according to AS 1012.12.1 [18]. The compressive strength of 100 mm × 200 mm concrete cylinders was completed in accordance with AS 1012.9 [19] using a 1500 kN capacity testing machine and a constant loading rate of 20 ± 2 MPa/min. Indirect tensile strength test was determined by AS 1012.10 [20] using a 1500 kN capacity testing machine and a constant loading rate of 1.5 ± 0.15 MPa/min. A flexural strength test was carried out according to AS 1012.11 [21] using a 100 kN capacity testing machine and a constant loading rate of 1.0 ± 0.1 MPa/min. The compressive strength, indirect tensile strength and flexural strength were tested using AutoCon Concrete Compressive Machine Model WF 55660. Modulus of elasticity was performed by utilizing Controls Testing Machine Model 50—C0050/CAL, according to AS 1012.17 [22], using 2000 kN capacity with a constant loading rate of 15 ± 2 MPa/min and two compressmeters mounted 180° apart and covering 100 mm of the specimen’s mid-height region. The stress-strain tests were carried out using a Baldwin Universal Testing Machine Model 400 WHVL—400.000 LB. CAP., with 1800 kN capacity testing under displacement control, as shown in Figure 3a. The constant loading rate was 0.005 mm/s and the vertical displacement was measured using two LVDTs mounted at 180° apart and covering 130 mm of the specimen’s mid-height region as shown in Figure 3b. Loading the test specimen was controlled using computer software (Moog Integrated Test Suite, Moog Inc., Elma, NY, USA) and the data were recorded using a data acquisition system (CatmanEasy V5.3.1, HBK, Darmstadt, Germany). The ultrasonic pulse velocity (UPV) values were measured by Portable Ultrasonic Non-destructive Digital Indicating Tester (Pundit 6) according to ASTM C597 [23]. The generated frequency and accuracy of the UPV machine was 54 kHz and ±0.1 µs, respectively. The results of all the mechanical tests were obtained from an average of three specimens.

3. Test Results and Discussion

The quality of recycled plastic is a critical and complex issue. It is affected by many factors including the primary quality of plastic, the manufacturing process, plastic sorting and grading, deterioration of plastics quality as a result of plastic ageing and presence of non-polymer impurities such as additives, catalyst residues, and adhesive materials. With this in mind, explaining the results of mixed recycled plastic in concrete is a challenging task.

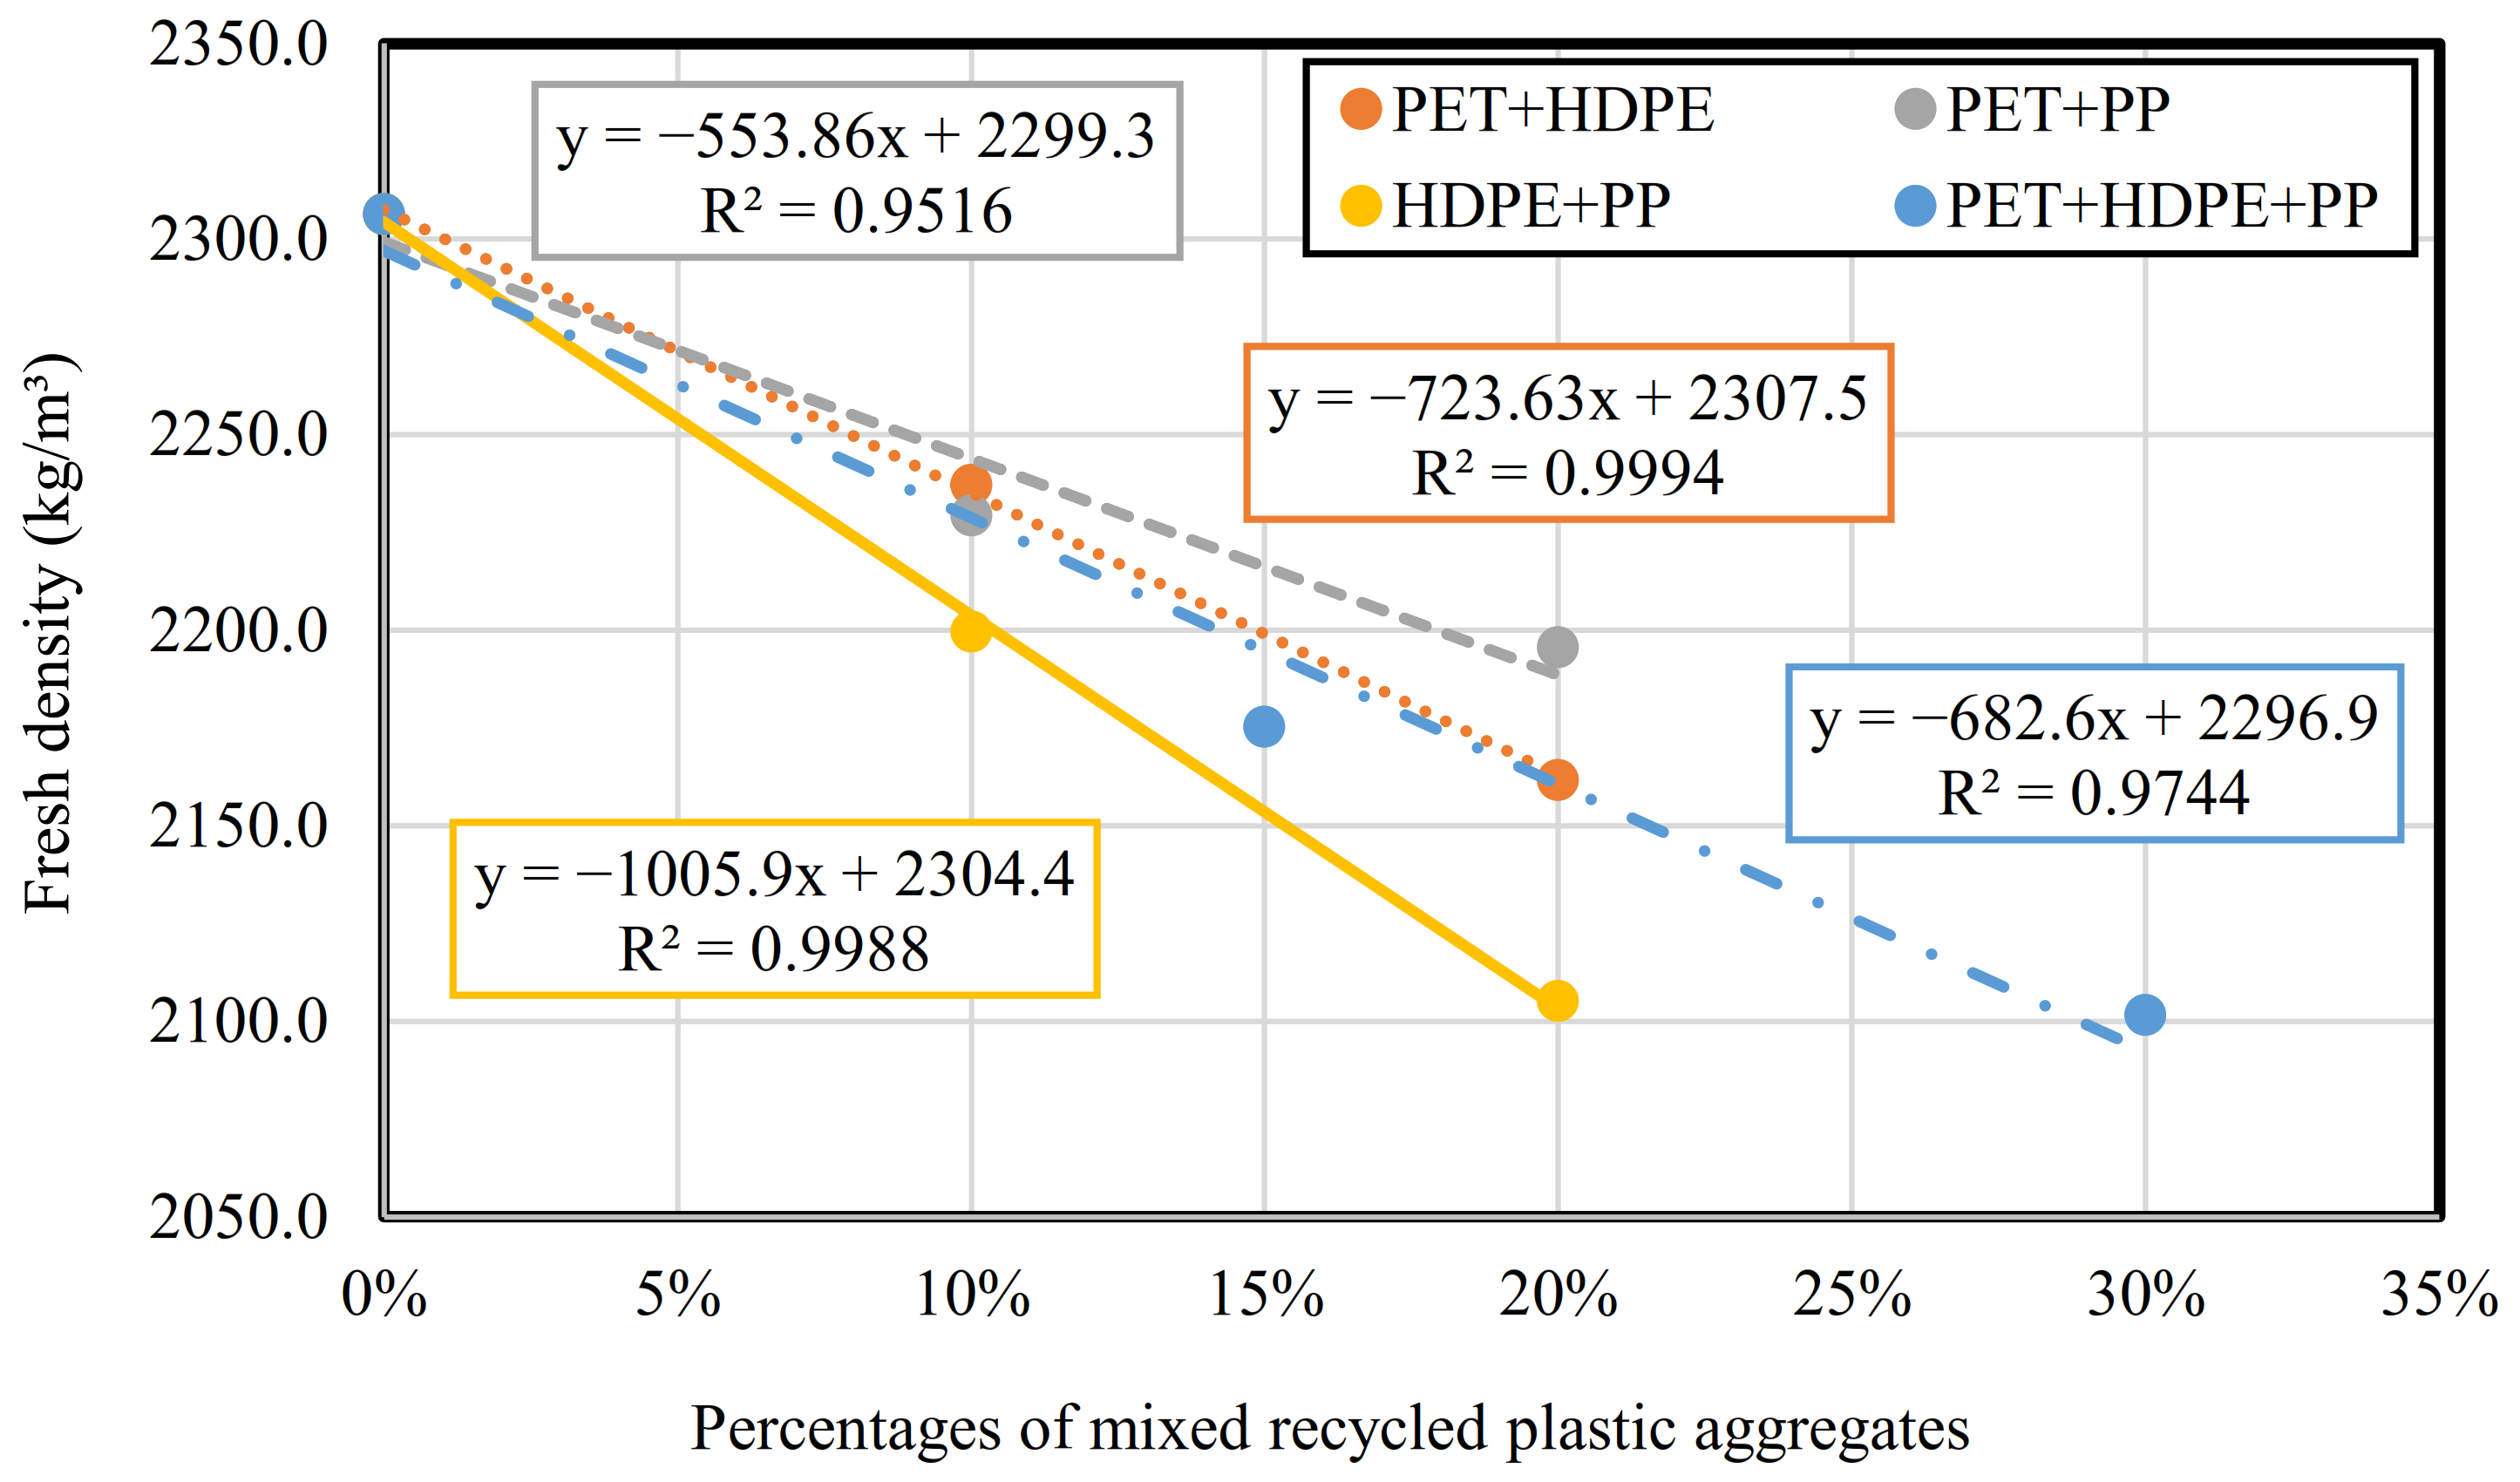
3.1. Fresh Properties

The physical properties of fresh concrete and the hardened density at 28 days are shown in Table 2 which include the slump values, fresh and hardened density and air content. As expected, the inclusion of plastic within concrete decreased the slump. Comparing the mixes containing identical plastic types but different replacement ratios, it was seen that increasing the plastic content decreased the slump. The mix with the highest ratio of plastic replacement (R8) achieved the lowest workability. This is attributed to the angular shape of plastic flakes which increased the friction between the particles and other concrete components [24] and decreased the continuity of the fresh concrete. However, the differences between the mixes which contained two plastic types with the same replacement ratios (10%) were very small. This may be due to the low substitution ratio in these mixes. The effect of PET in decreasing the slump values was noticeable when increasing the percentage of plastic from 10% to 20% compared to mixes with HDPE and PP only. This may be attributed to the presence of slight variation in the flake surface morphology of PET. R7, which contained three types of plastic with a 15% replacement ratio, demonstrated a slump value close to the control mix and less than other mixes that contained two types with 10% replacement ratios. This means that the effect of replacement ratios was more important than the effect of adding more types of plastic. The ability of PET to reduce the workability in a higher replacement (20%) may be partially explained by its flexural modulus (stiffness) values (2.8–3.5 GPa) which was higher than that of PP (1.2–1.6 GPa) and HDPE (0.75–1.57 GPa) [25]. Although no previous studies compared the concrete incorporating three plastic types in mixed combinations, the obtained results were in agreement with the finding of others who used different mixed types [4].
Examining the fresh density values showed that all mixes have values lower than the control mix. Increasing the percentage of plastic replacement ratios decreased the densities of all plastic concrete mixes. This is due to the lower density of plastic compared to that of natural aggregate. The fresh density values were a function of the plastic density and replacement ratios. PET plastic has a higher density value of 1224.95 kg/m3 compared to HDPE and PP with 960.48 and 905.322 kg/m3, respectively. The maximum loss in fresh density values (8.9%) was achieved at the higher replacement ratio (30%) in the R8 mix. However, the density of R8 with three types of plastic and 30% replacement ratio had a value close to R6 with two types and 20% replacement. This means that the density of plastic was the key factor in the resultant fresh density values. In spite of the differences in experiment details, this is consistent with previous findings of other authors who used one type of plastic as coarse plastic aggregates in concrete [26]. Our findings are supported by the excellent relationship between the plastic replacement ratio and the fresh density (Figure 4) since the coefficient of determination (R2) values were not less than 0.95 for all the mixes. The values of hardened density of all plastic concrete mixes at 28 days (Table 2) were not less than 2100 kg/m3 which is the maximum hardened density for structural lightweight concrete according to AS 3600 [27].
As shown in Table 2, incorporating plastic in concrete led to an increase in the air content percentage in all mixes compared to the control mix. Comparing the mixes that contained two plastic types, R6 at 20% replacement achieved the highest value. It is observed that increasing the plastic replacement ratio in the mix did not always lead to an increase in air content. Many factors seem to be responsible for the resultant value of each mix. The surface energy of each plastic type is set to become a vital factor when comparing the behaviour of different mixes. PET has a medium surface energy value (42 dynes/cm) compared to weaker values for HDPE and PP (34 and 30 dynes/cm, respectively) [28,29], which means that PET has more of a tendency to entrap water and repel air during mixing with other concrete constituents. On the other hand, the surface of plastic materials was degraded as a result of exposure to weathering factors, that is, sunlight, humidity and low temperature during accumulation in outdoor stores. This strongly suggests that the plastic surface would be filled with cracks and voids (Figure 5) filled with air. Hence any comparison of these results should be done with caution since each of these factors will affect the final values. This is also reflected in the good relationship between the plastic replacement ratio and the air content (Figure 6) in some mixes like (PET+ HDPE) and (HDPE + PP) with R2 values 0.99 for both, respectively. The acceptable R2 values of 0.519 and 0.657 of mixes like (PET + PP) and (PET + HDPE + PP), respectively confirmed the previous discussion.

3.2. Mechanical Properties

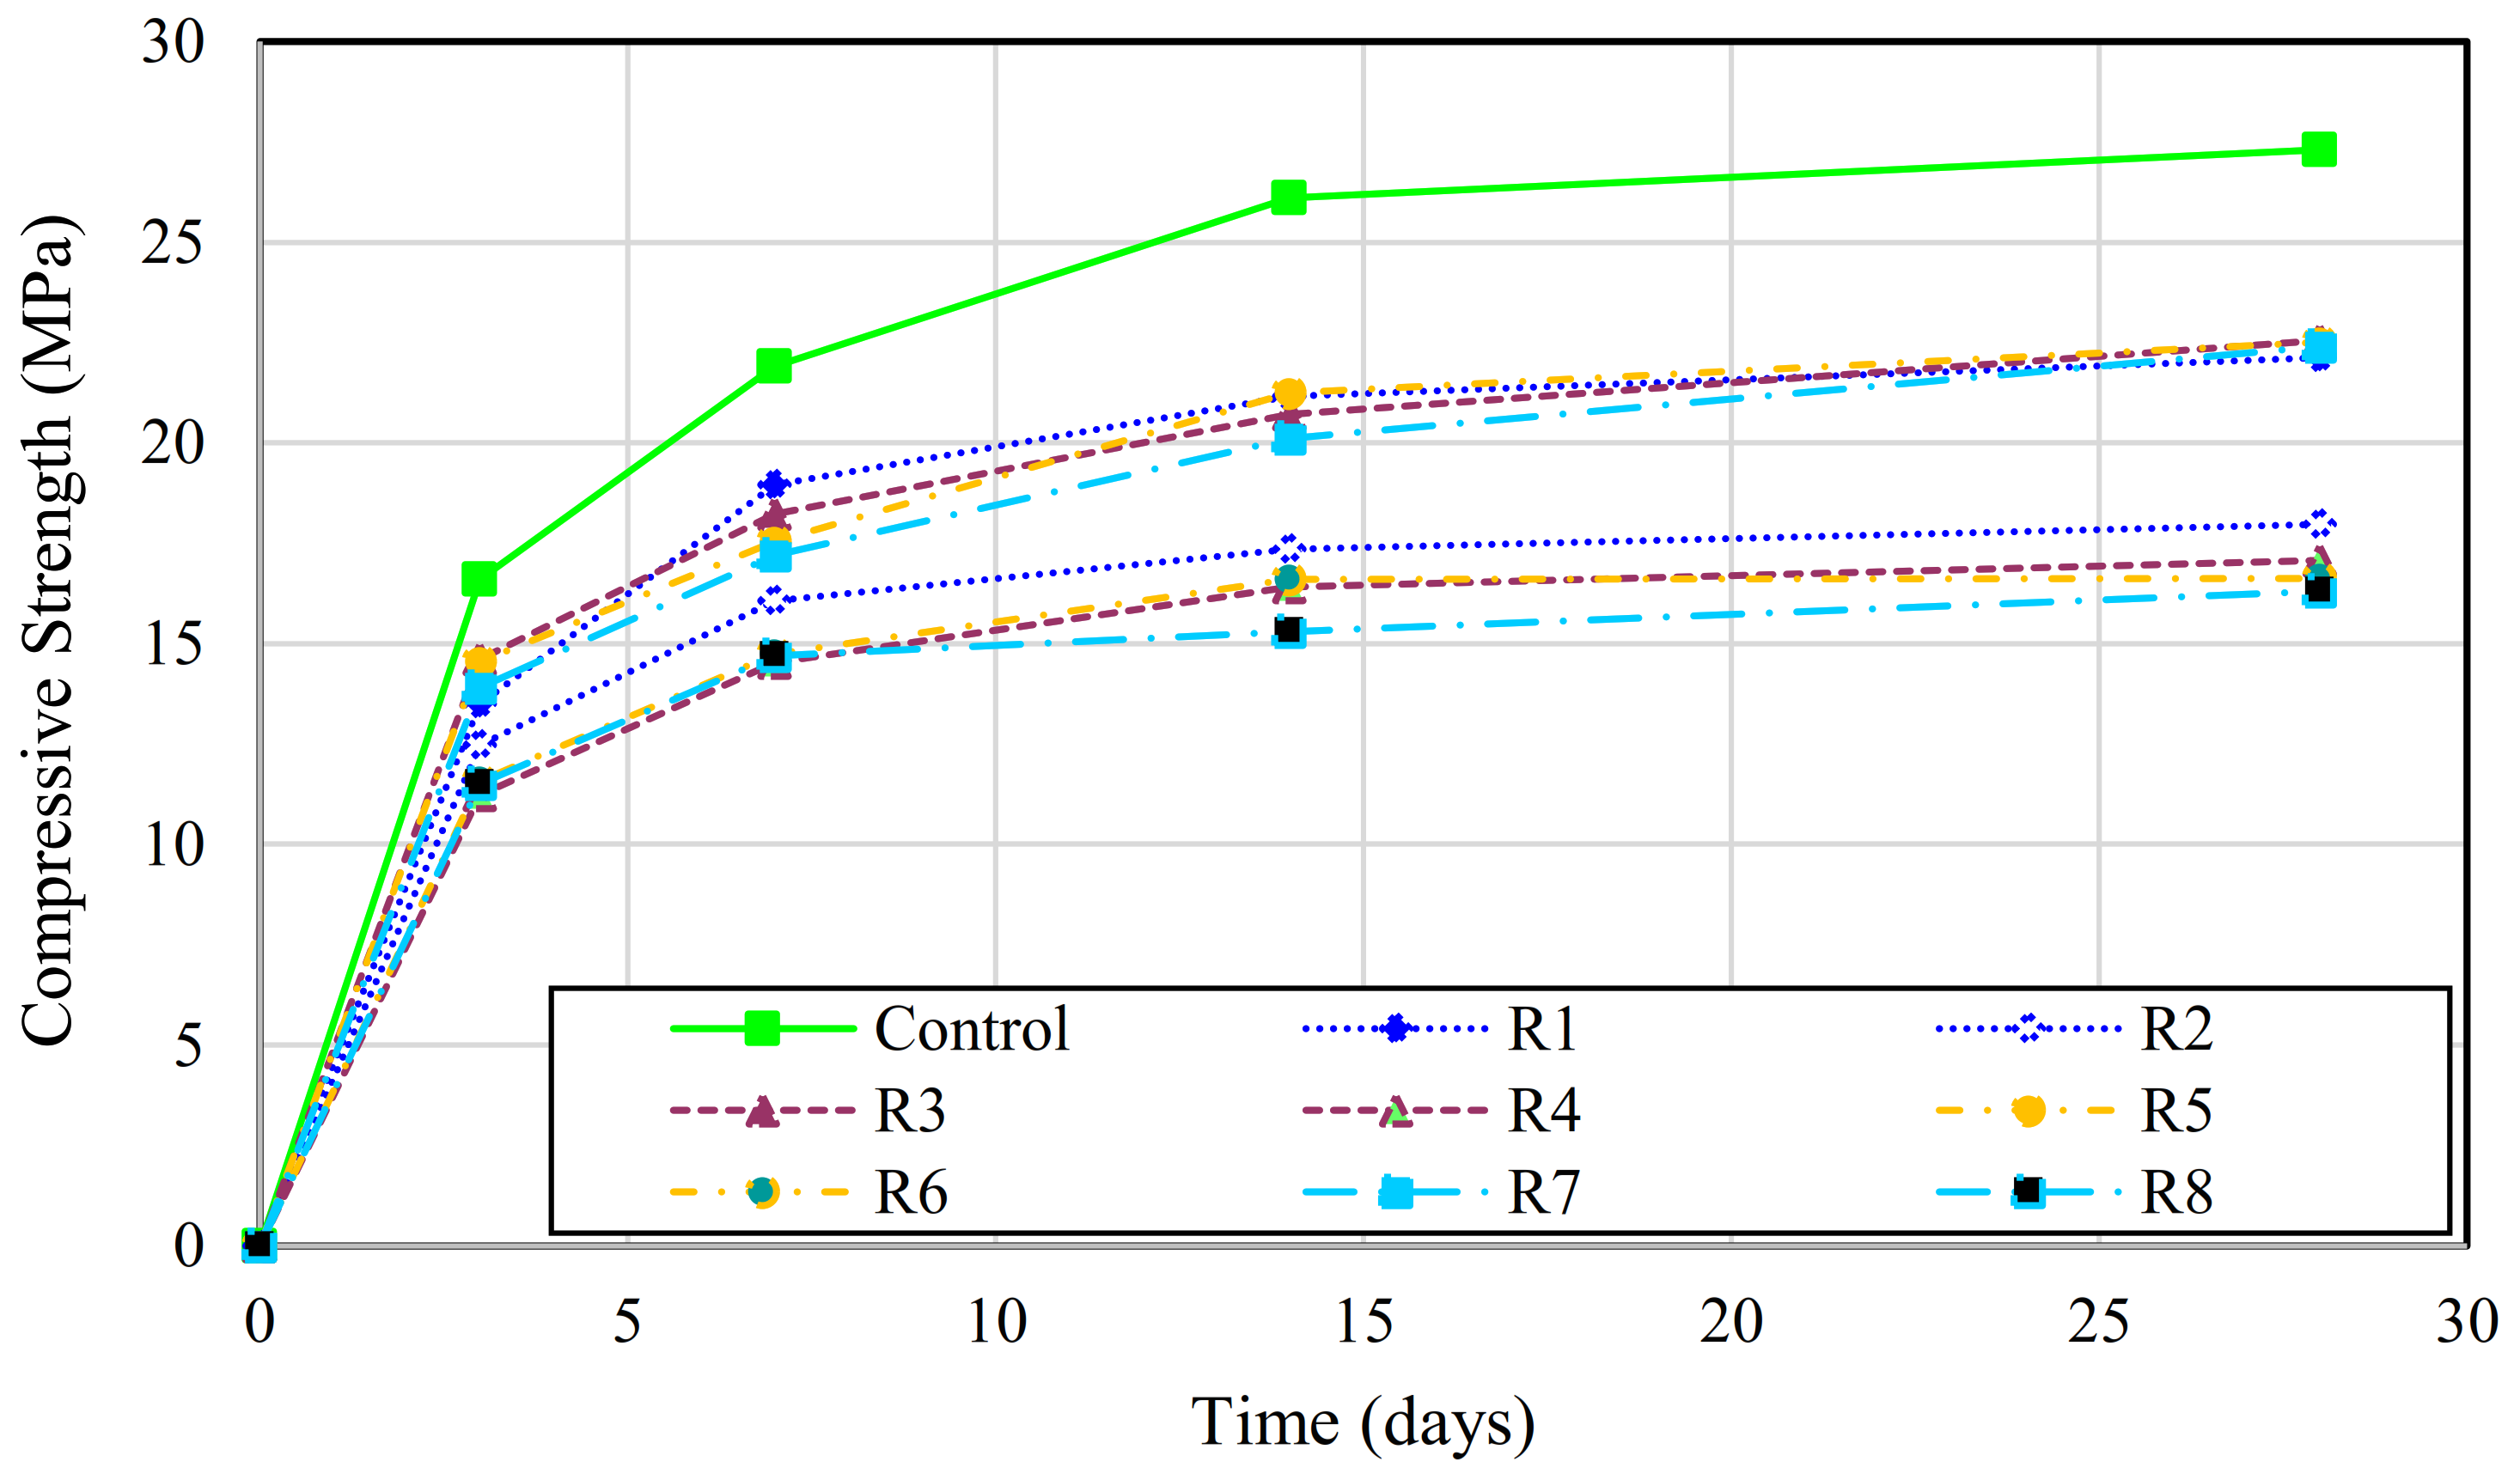
3.2.1. Compressive Strength

All compressive strength results for the different mixes are shown in Table 3 and Figure 7. As expected, the compressive strength continued to develop as the concrete age increased for all the concrete mixes. Comparing the MRPC mixes, maximum compressive strength of 22.6 MPa was achieved by R3. A methodical reduction in the compressive strength in all plastic concrete mixes was observed when increasing the replacement percentage of mixed plastic where the highest reduction recorded by R8 and significantly weakened the concrete by 40.3%. Jacob-Vaillancourt and Sorelli [4] attributed this reduction to several reasons including the presence of plastic concrete stress concentration zones favouring damage propagation, weakness of interfacial transition zone (ITZ) and increasing of air voids as a result of the plastic presence. Other researchers related the weakness of the concrete to the density reduction [30]. Comparing the results of this study with a previous study by the same authors [31] reveals that adding two different mixed plastic types at 10% replacement (PET + HDPE or PET + PP) doubled the compressive strength reduction percentage by 19% and 17.2%, respectively, compared to the compressive strength mix with PET 10% alone, which decreased only by 8.8%. While no significant differences were noticed when comparing the addition of the other two types of plastic individually (HDPE and PP) or with each other in the two replacement ratios 10% and 20%. Surprisingly, results show that all mixes, included two types of plastic with a replacement ratio of 10%, resulted in very close values. Again, the same trend was found for a 20% ratio. The compressive strengths of R7 which contains three plastic types with a 15% replacement ratio and R8 which contains three types with 30% were almost equal to the mixes with two types with 10% and 20% replacements, respectively. Thus, it is better to incorporate three types at a 15% replacement ratio if we are going to take into account the disposing of larger quantities of mixed plastic. It is worth noting that the compressive strength value of any mix containing mixed plastic types is the resultant of load acted on the constituent and on adhesive strength between the constituent and other cement paste. Thus, the plastic type is set to become a vital factor during testing since the characteristics of each plastic type specify its behaviour. Each type of plastic adheres to the cement paste differently and reacts to the load during testing according to its chemical and physical characteristics. All three plastic types are flexible plastic and under compressive load, they cooperate to compensate for the reduction in the strength caused by the weakest types. Still, it is worth noting that the strength variability between different plastic types and the cement at the ITZ may encourage brittle failure with time.

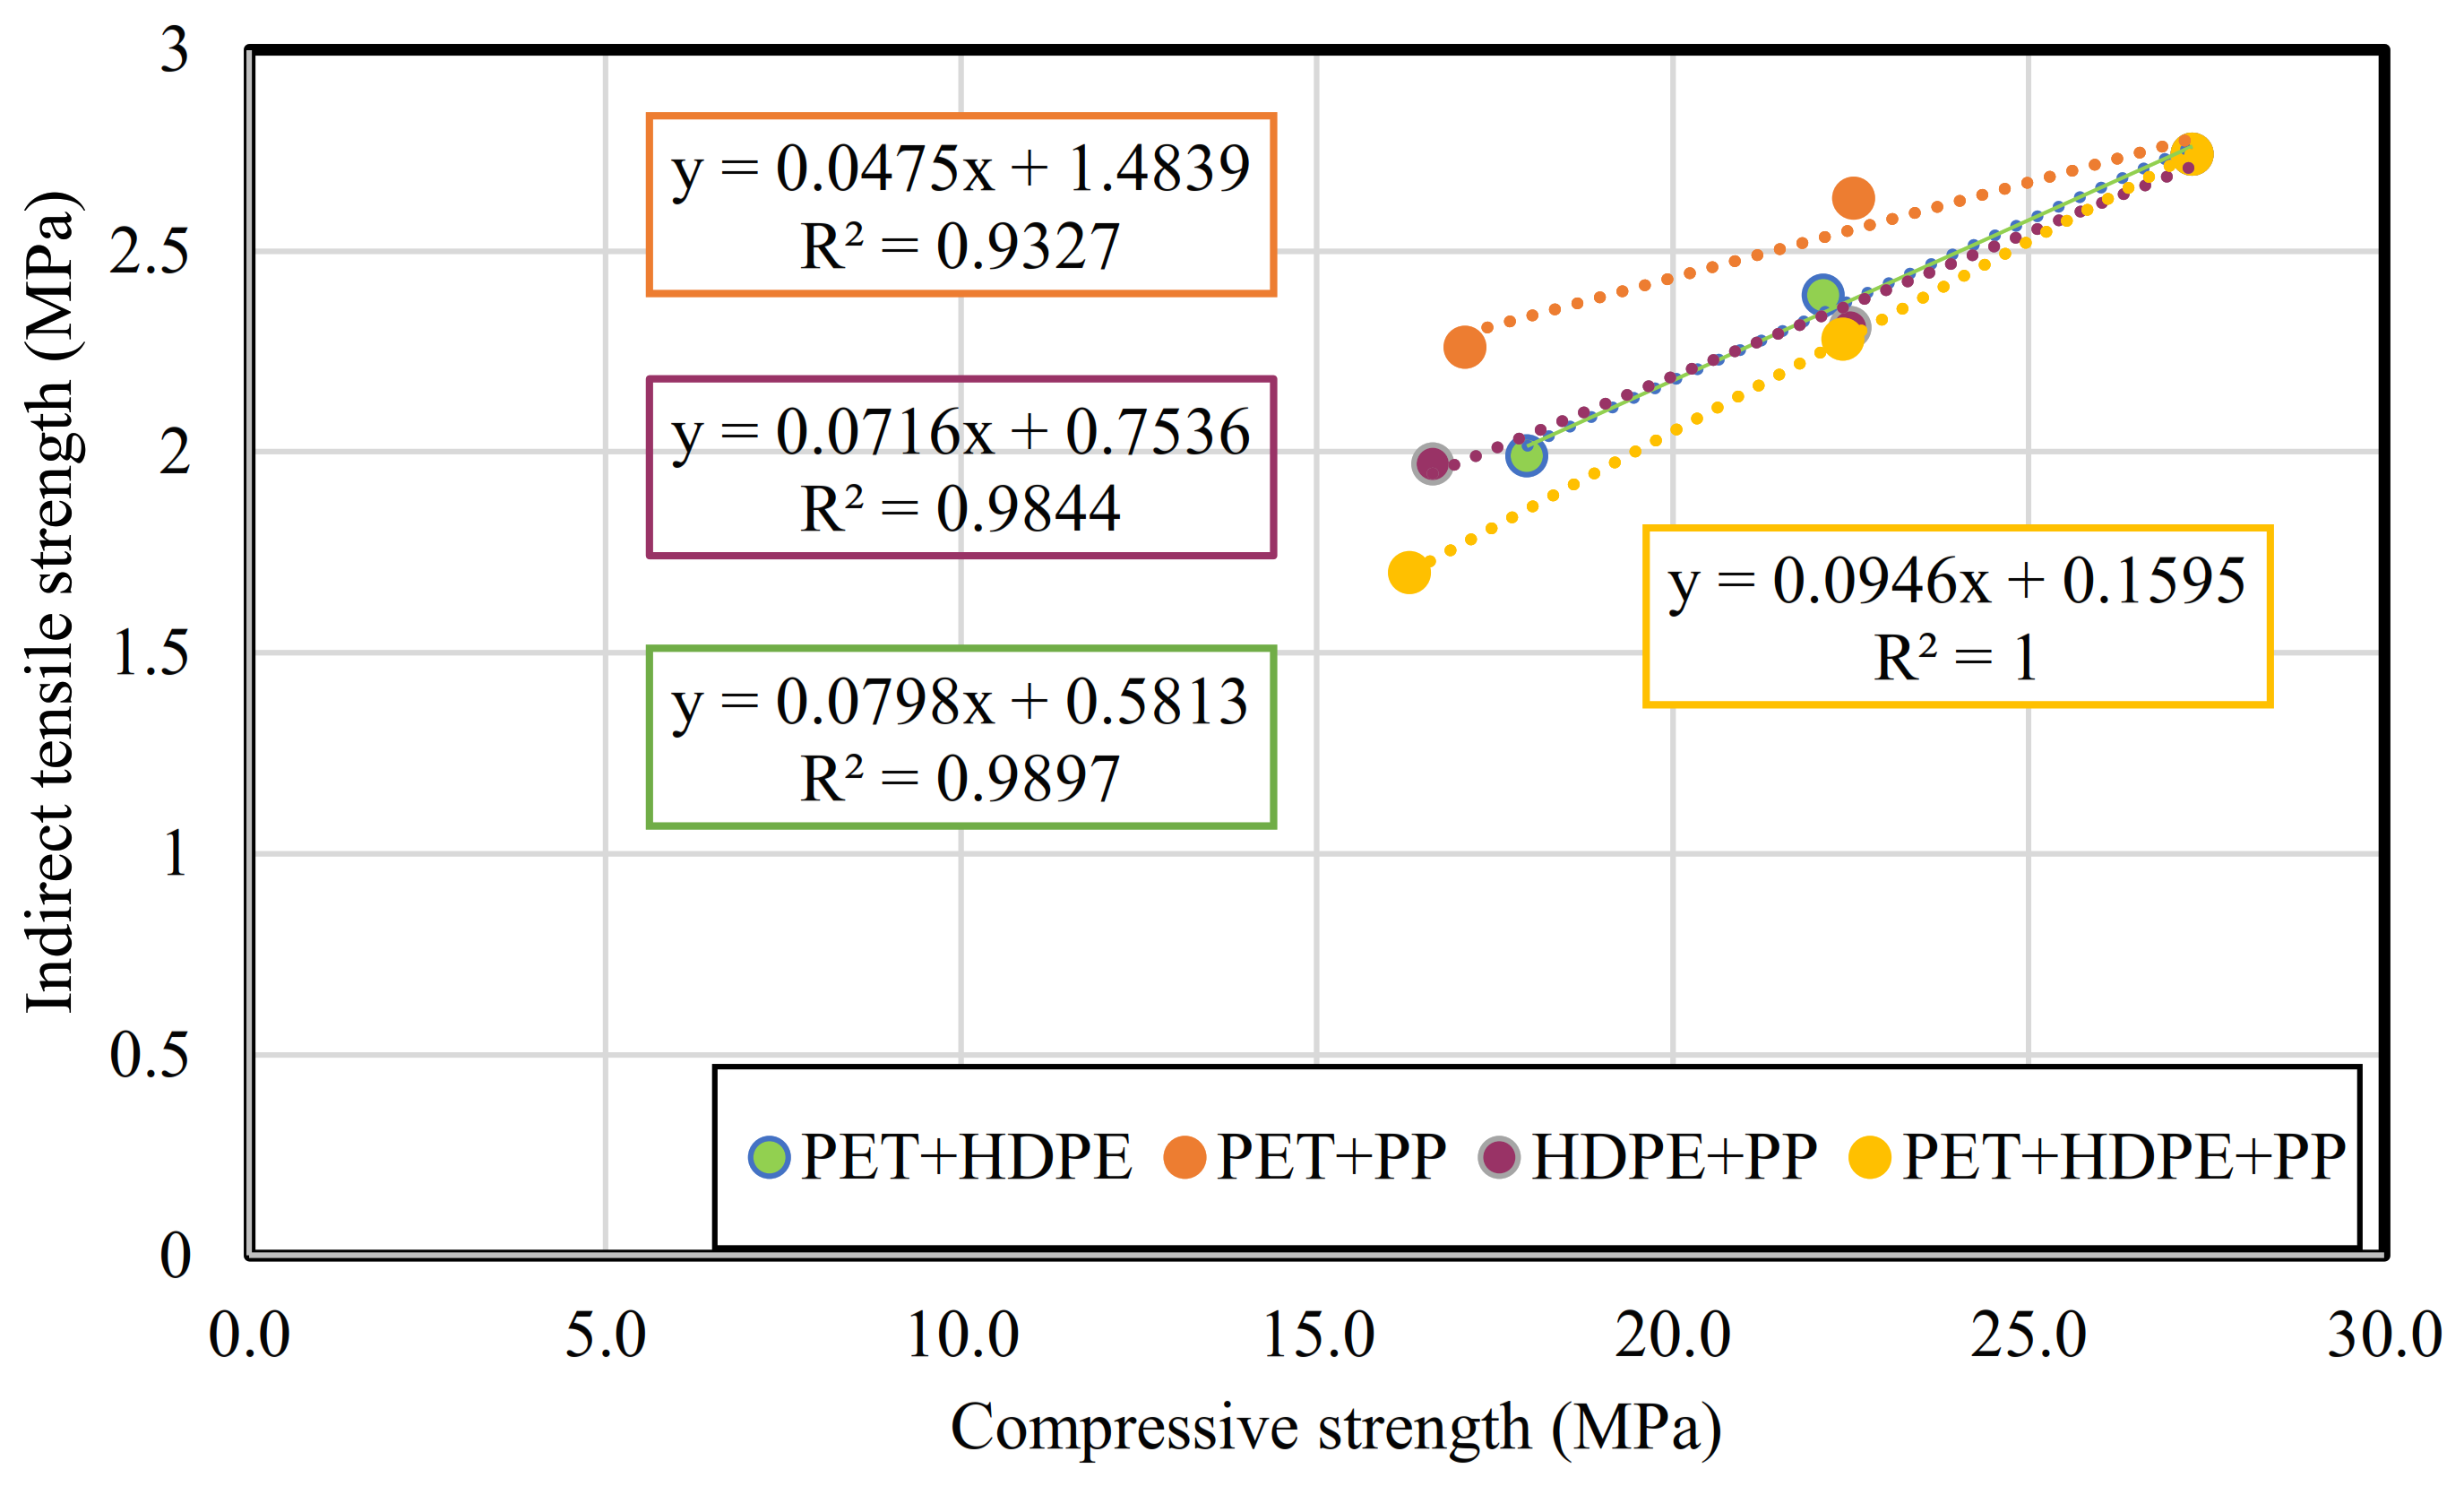
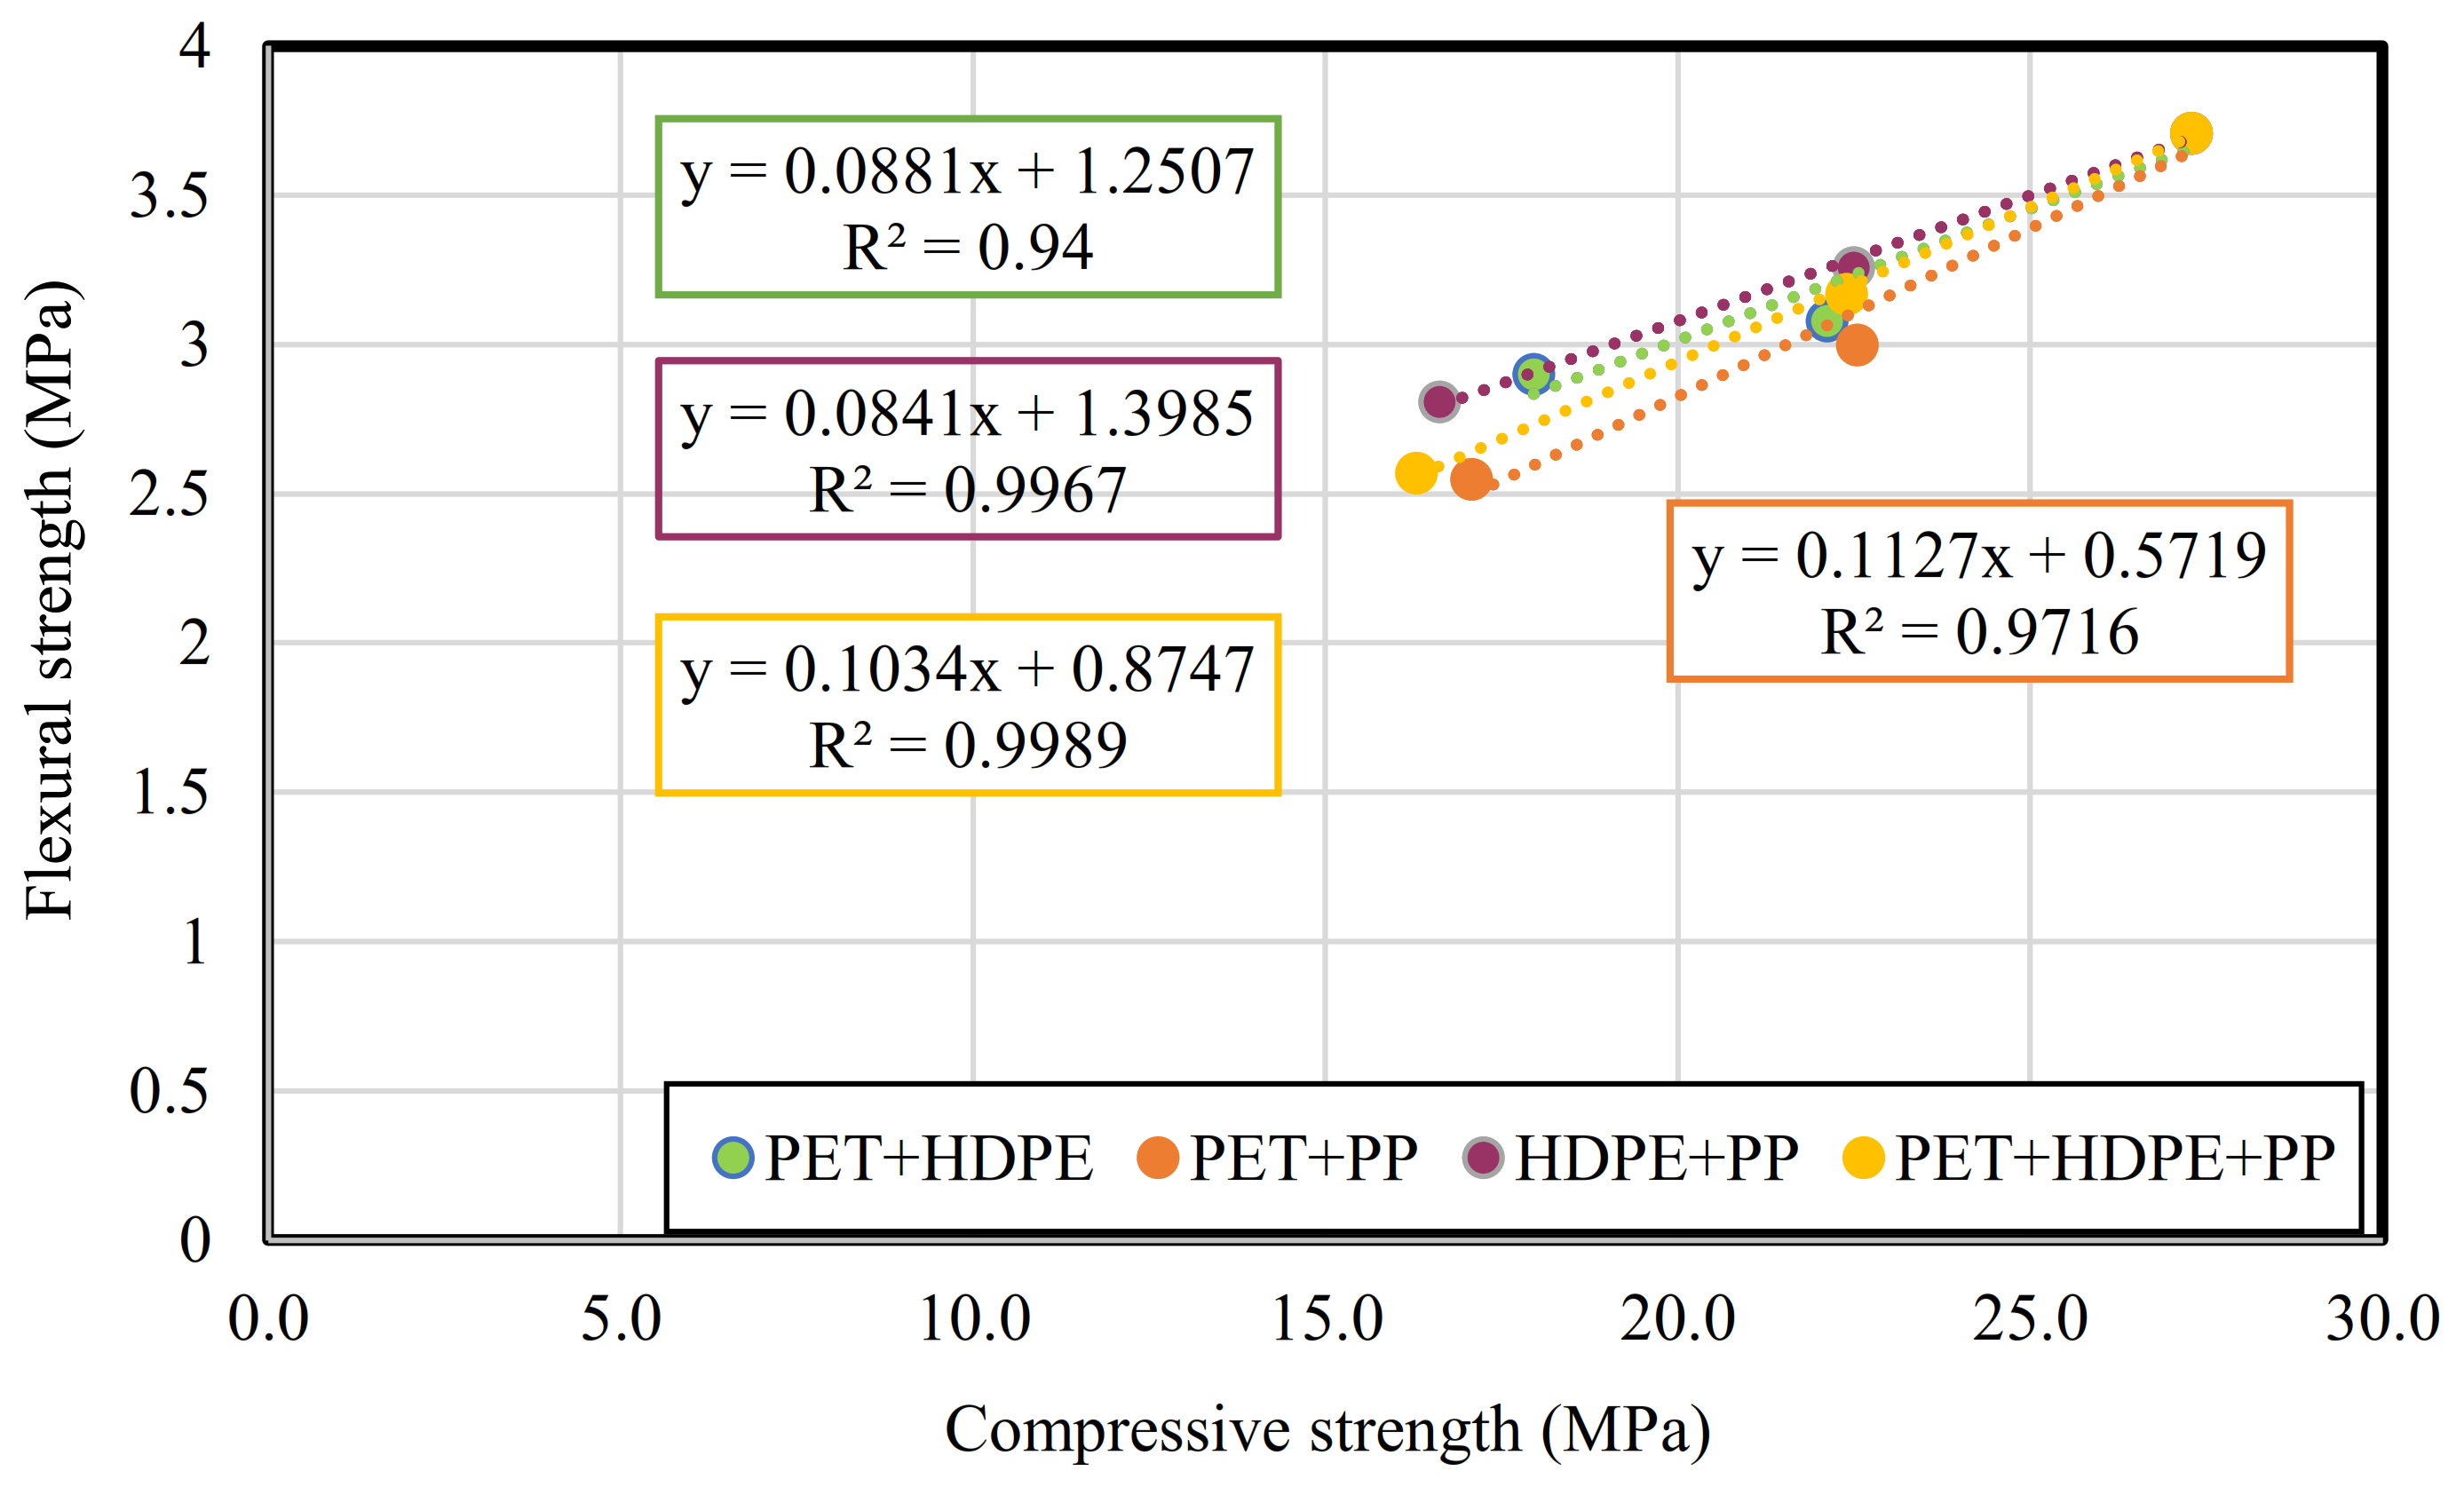
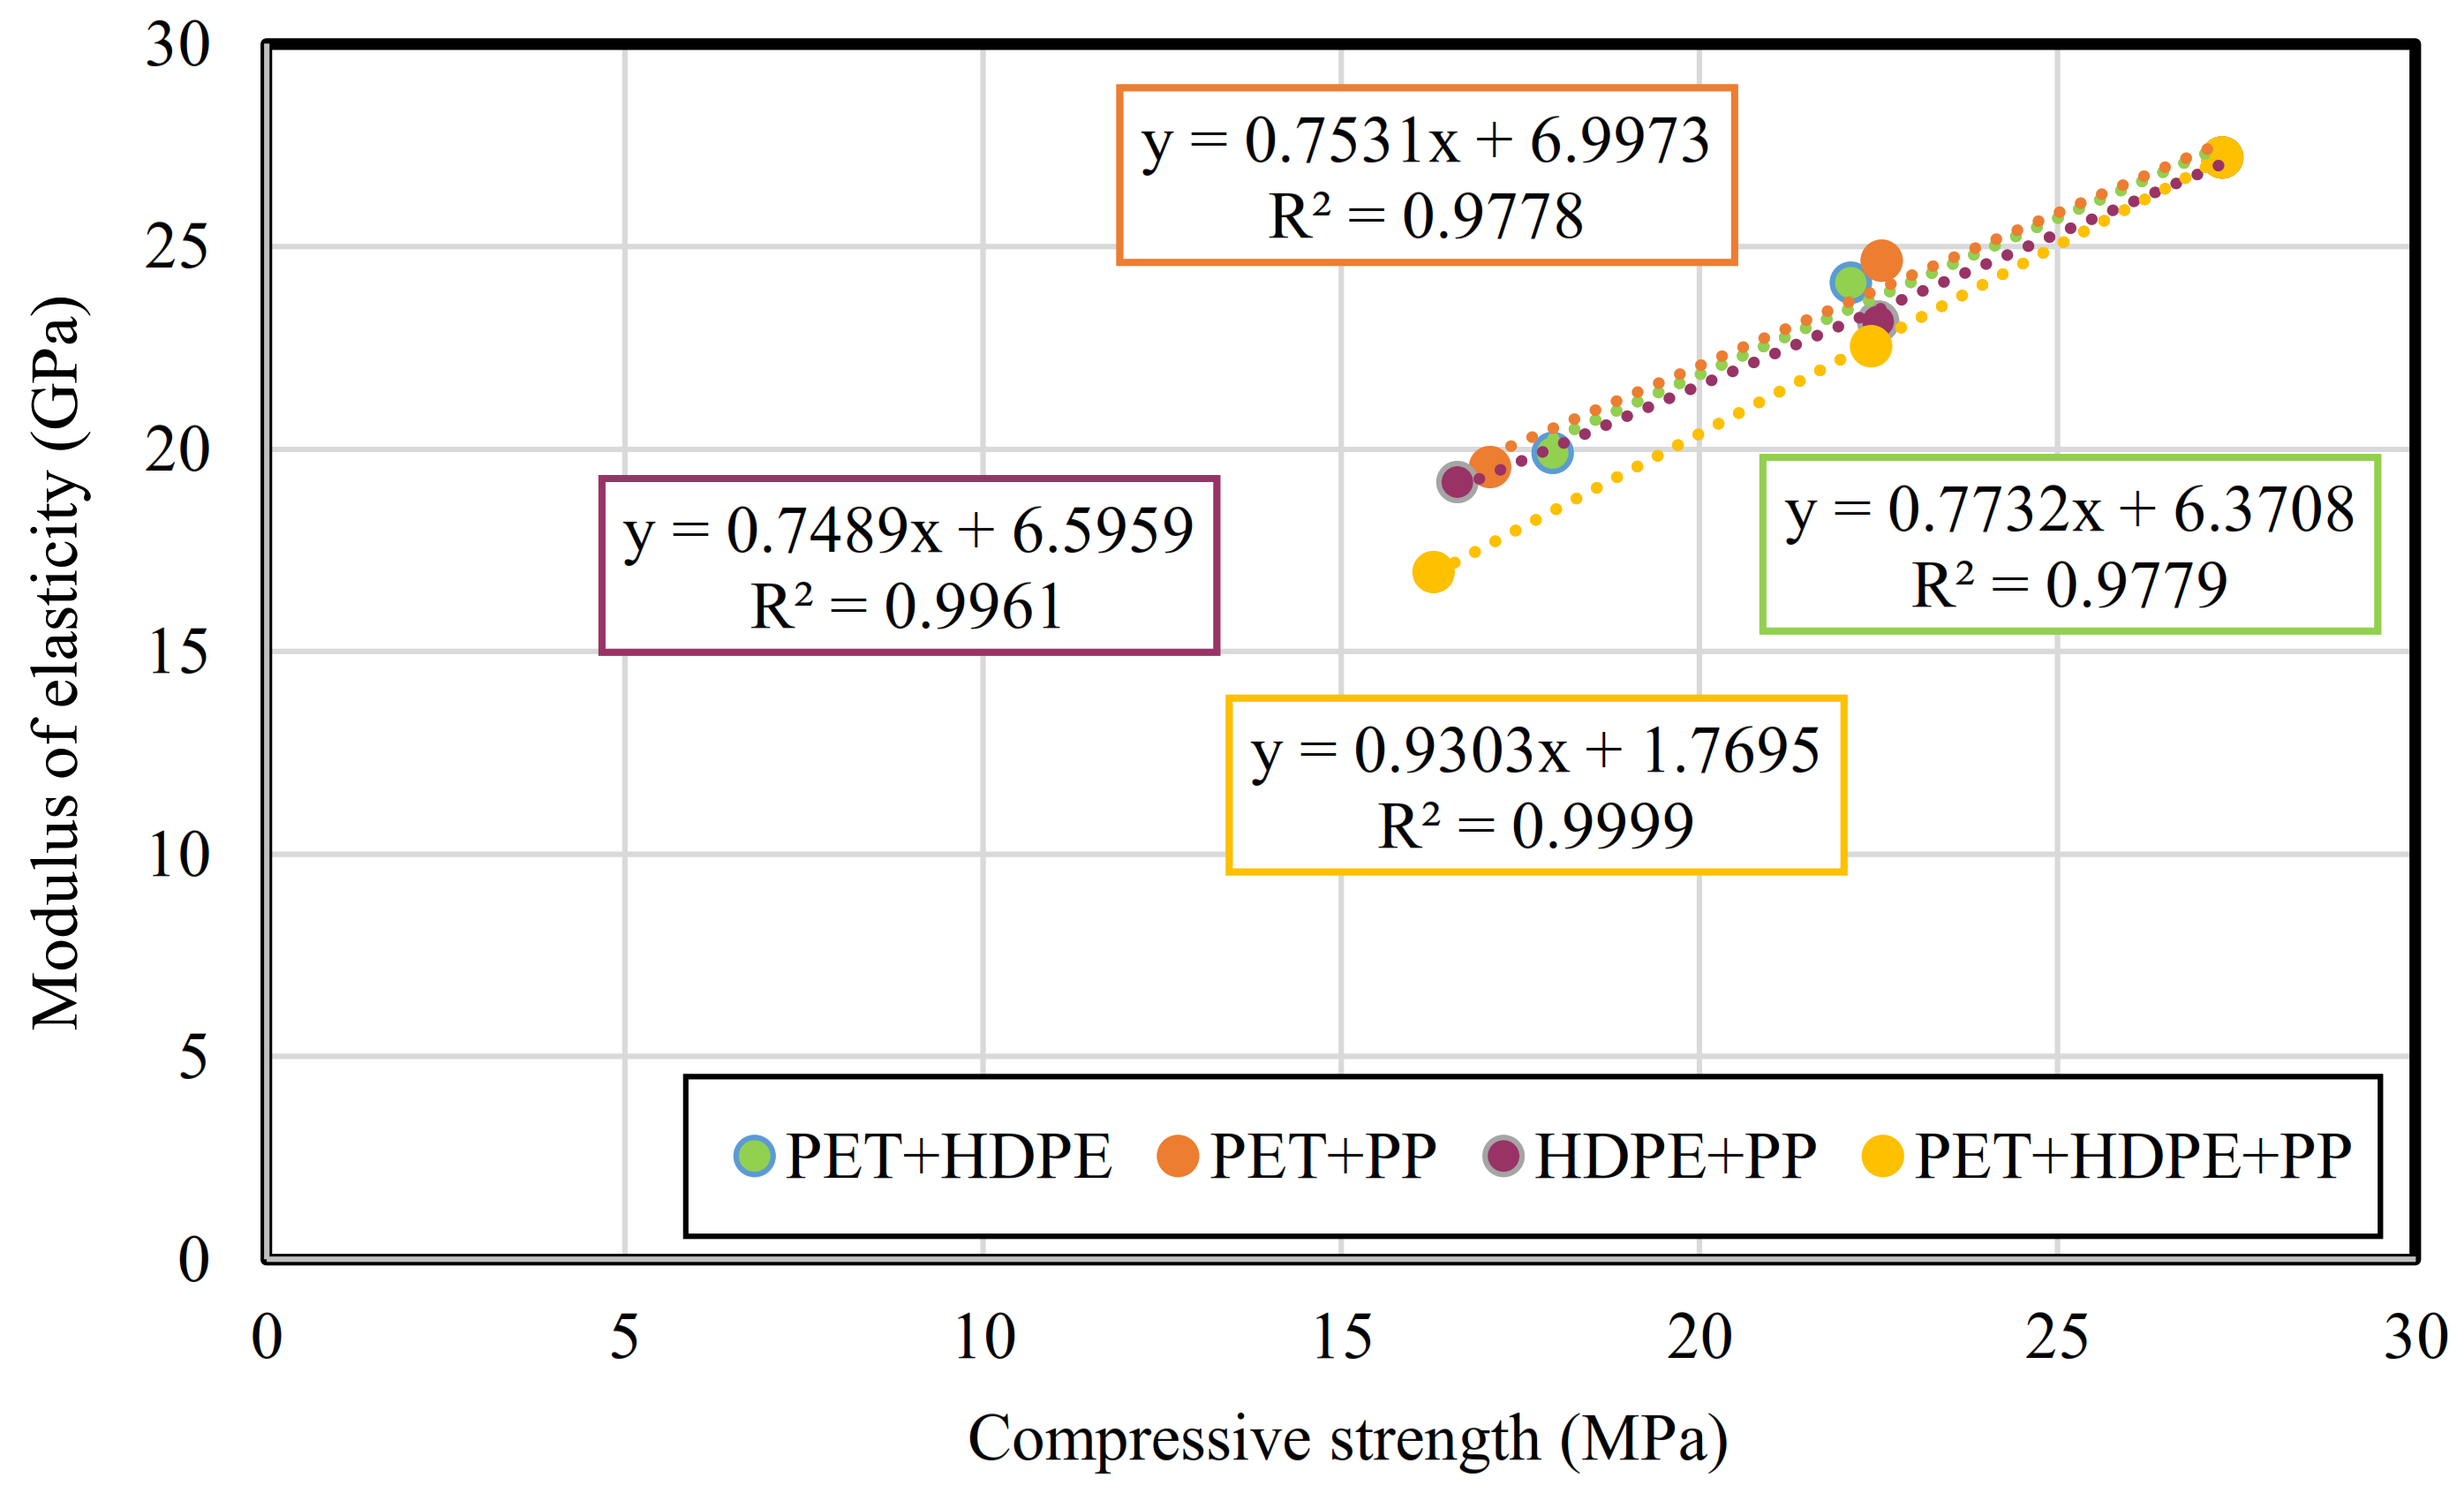
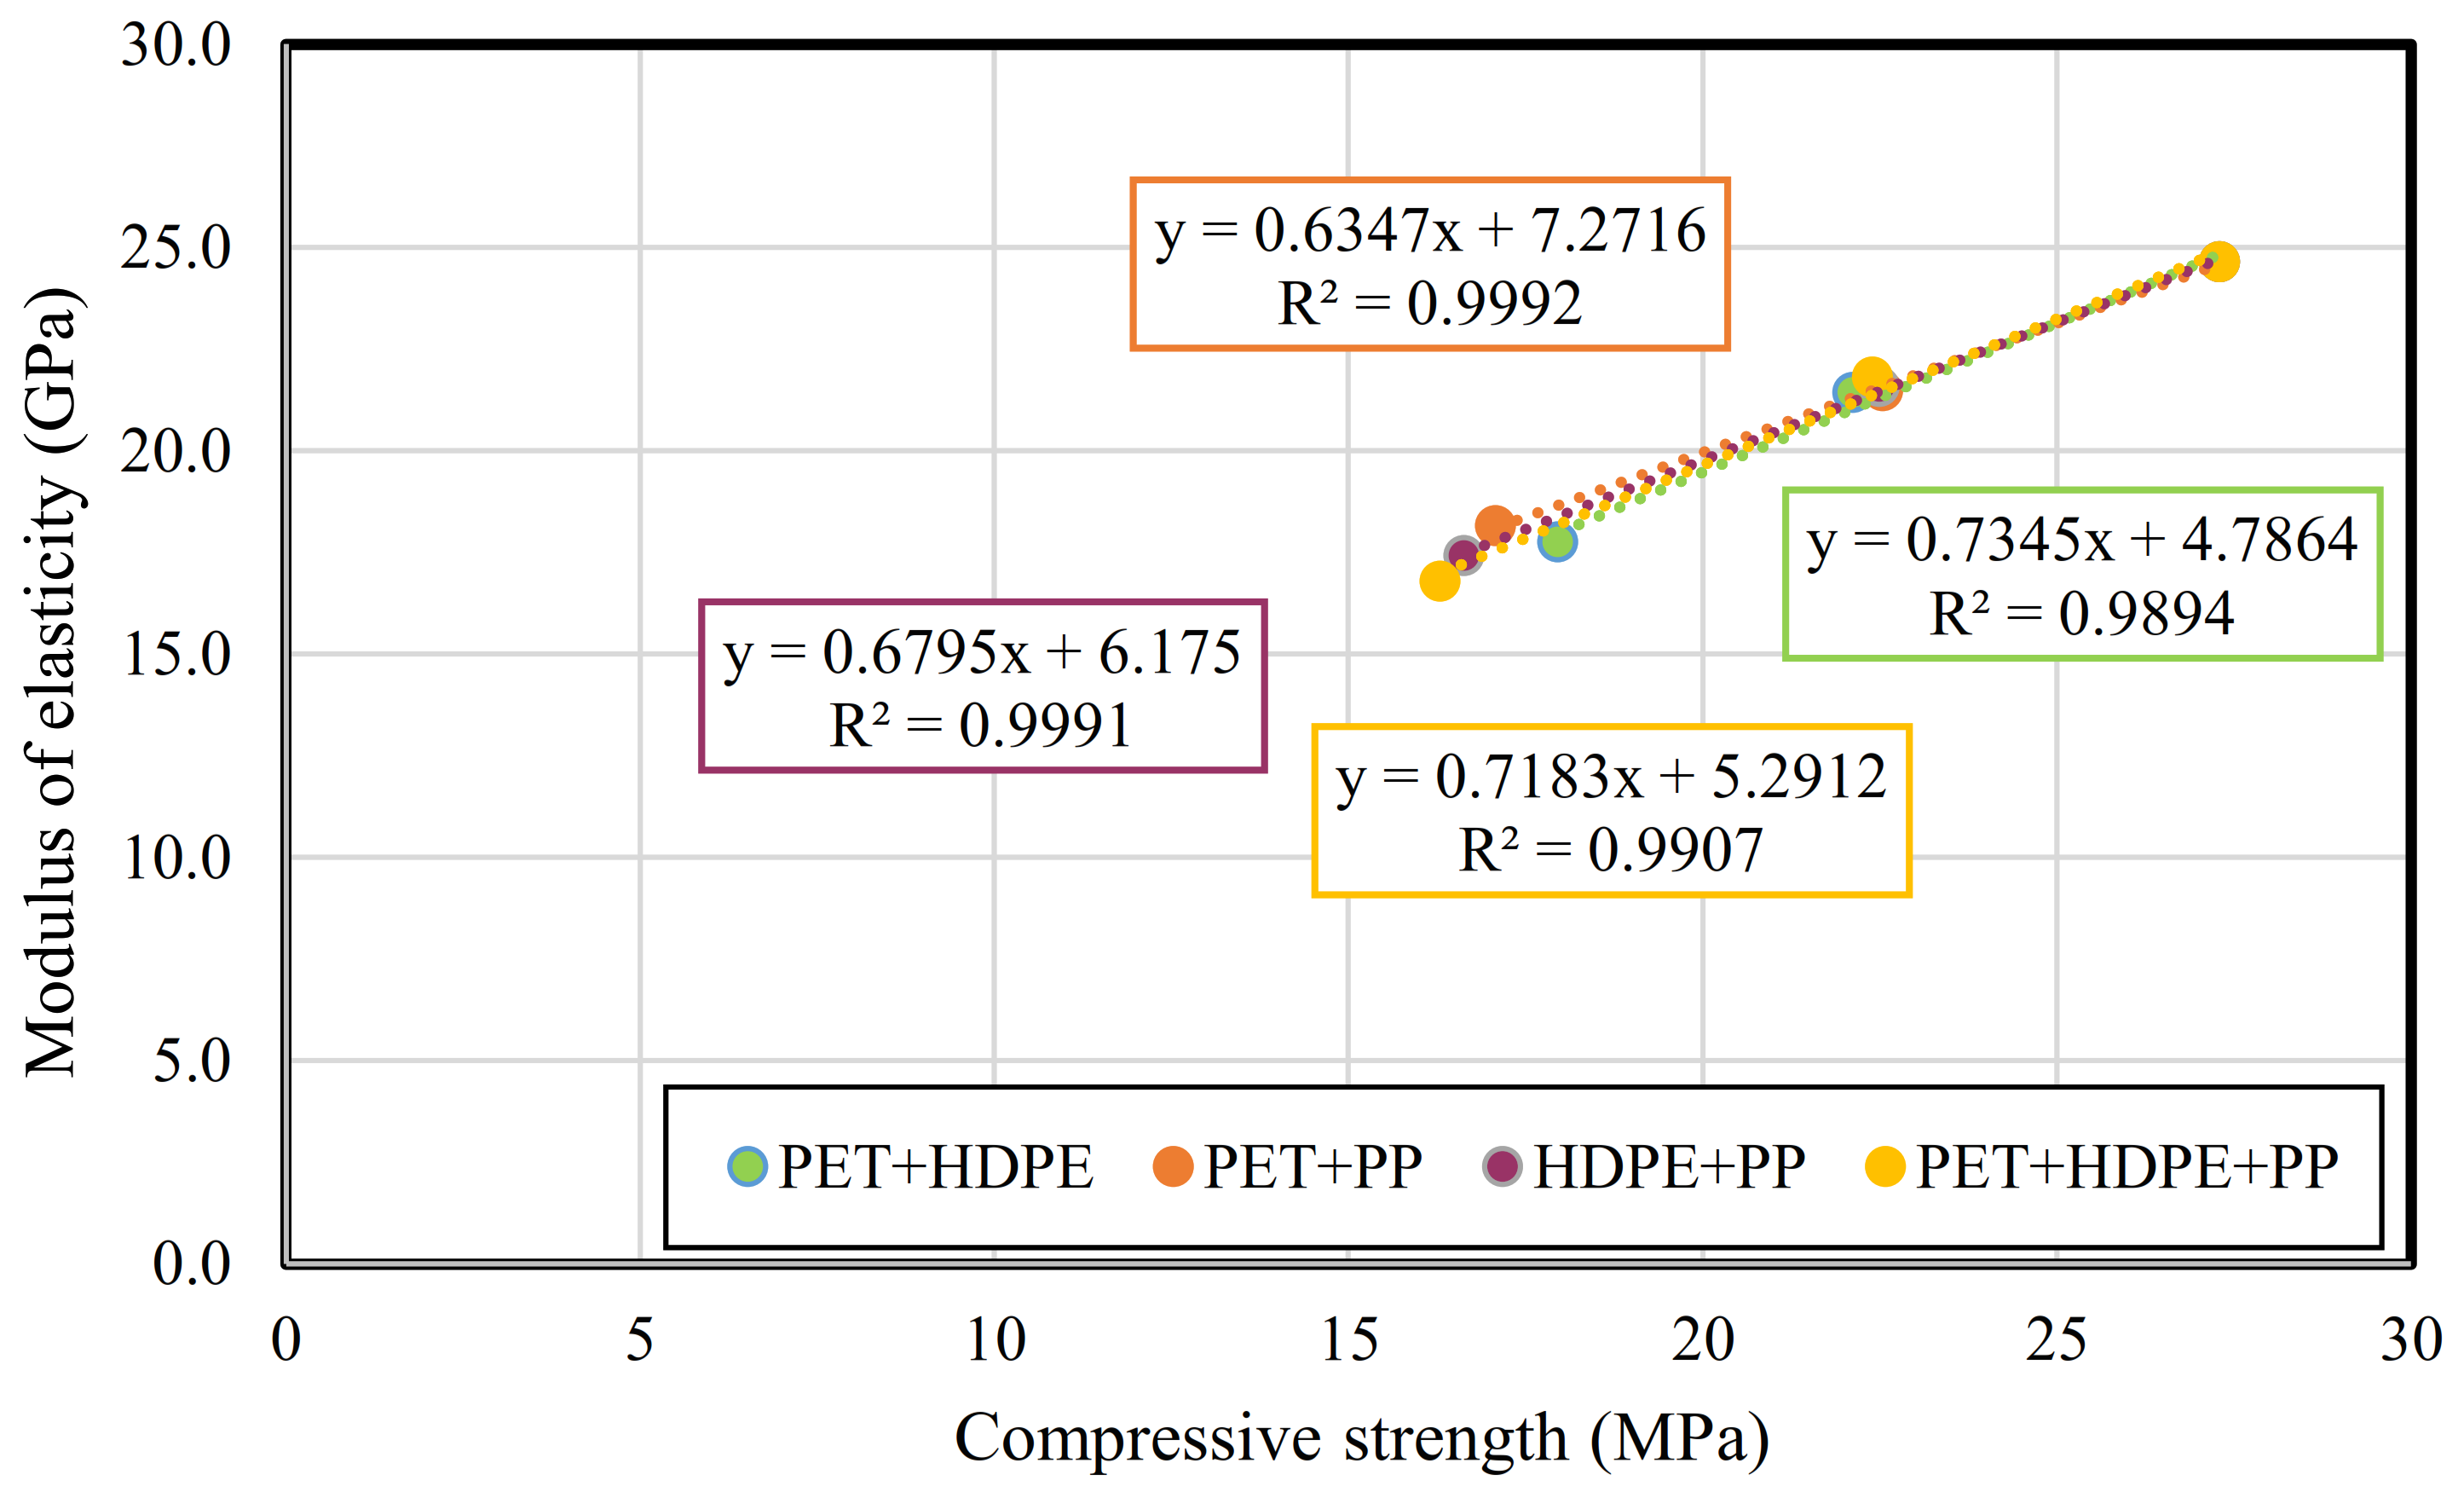
3.2.2. Indirect Tensile and Flexural Strengths and Modulus of Elasticity

Indirect tensile and flexural strengths and modulus of elasticity results at 28 days are presented in Table 4. Indirect tensile strength results show that the inclusion of shredded mixed plastic type waste aggregate reduced the 28-day average values of the tensile strength of concrete. These findings are in line with the result of [7]. The inclusion of two types of plastic waste at a 10% replacement ratio (R1, R3 and R5 mixes) decreased the indirect tensile strength by 12.8%, 4.0% and 15.7%, respectively. R7 mix with three plastic types and 15% replacement behaved very similarly to mixes with two types and 10% replacement (R1 and R5) and decreased by 16.8%. Also, the tensile strength values tended to decrease with increasing plastic content up to 20% in R2, R4 and R6 by 27.4%, 17.5% and 28.1%, respectively compared to the control mix. A maximum decrease (38%) was achieved by R8 with three types and 30% plastic waste.
As observed during the testing, the plastic concrete mixes exhibited a ductile failure mode, the specimens did not separate into two parts after cracking and remained attached by the plastic aggregate bridging. The bridging of cracks by plastic aggregate was reported by authors who used only one type of plastic [32]. Inspecting the specimens after failure revealed that the plastic aggregate did not split, and the crack moved away from them. On the other hand, the control specimen was crushed into two parts in a brittle way.
In general, flexural strength values followed a trend very similar to that of compressive strength. It was observed that increasing the replacement ratio of mixed plastic waste decreased the values of the flexural strength. Among all plastic concrete mixes, R5 generally had the highest flexural strength with a decreasing percentage of 12.1% compared to the control mix. For two plastic types with 10% replacement (R1, R3 and R5) and the three types with a 15% ratio (R7), the values of flexural strength were close. At the same time, mix R8 with three plastic types and a 30% ratio behaved very similarly to mixes with two types and 20% ratios. The reasons behind these results may be explained on the basis of differences in mechanical characters between plastic types. This means that weakening in one type is hindered by the others. In general, and in spite of differences in the experimental details with other authors who used mixed plastic types, the obtained results are also in agreement with the findings of [8], however careful attention must be paid in comparing our findings to the previous studies.
As it can be seen, the influence of different combinations of plastic aggregate on elastic modulus was similar to that on the compressive strength, indirect tensile strength and flexural strength. The results of elastic modulus of R1, R3 and R5 are very close. This provides confirmatory evidence that the mixes with two different plastic types and 10% plastic replacement ratio behaved very similarly in terms of strength regardless of the plastic type. Along a similar line, R2, R4 and R6 at 20% replacement ratio behaved alike and the percentages of decreasing were not more than 29.5%. The obtained results are also in agreement with the findings of [4] even though better values of modulus of elasticity were found by using 20% of three types of plastic in the current study. In all plastic concrete mixes, values of elastic modulus decreased as replacement ratios increased. A lower value of modulus of elasticity was achieved by R8, which contains three plastic types and 30% replacement by a percentage of decrease by 37.6%. Our discussion rests on the fact that the modulus of elasticity of aggregate strongly affects the concrete strength. Unfortunately, plastic has a lower modulus of elasticity than that of natural aggregate.
Figure 8, Figure 9 and Figure 10 presented the relationship between the compressive strength and other tested mechanical properties including indirect tensile strength, flexural strength and modulus of elasticity to put more emphasis on the positively correlated properties. It indicates strong relationships between the tested properties with R2 not less than 0.93.

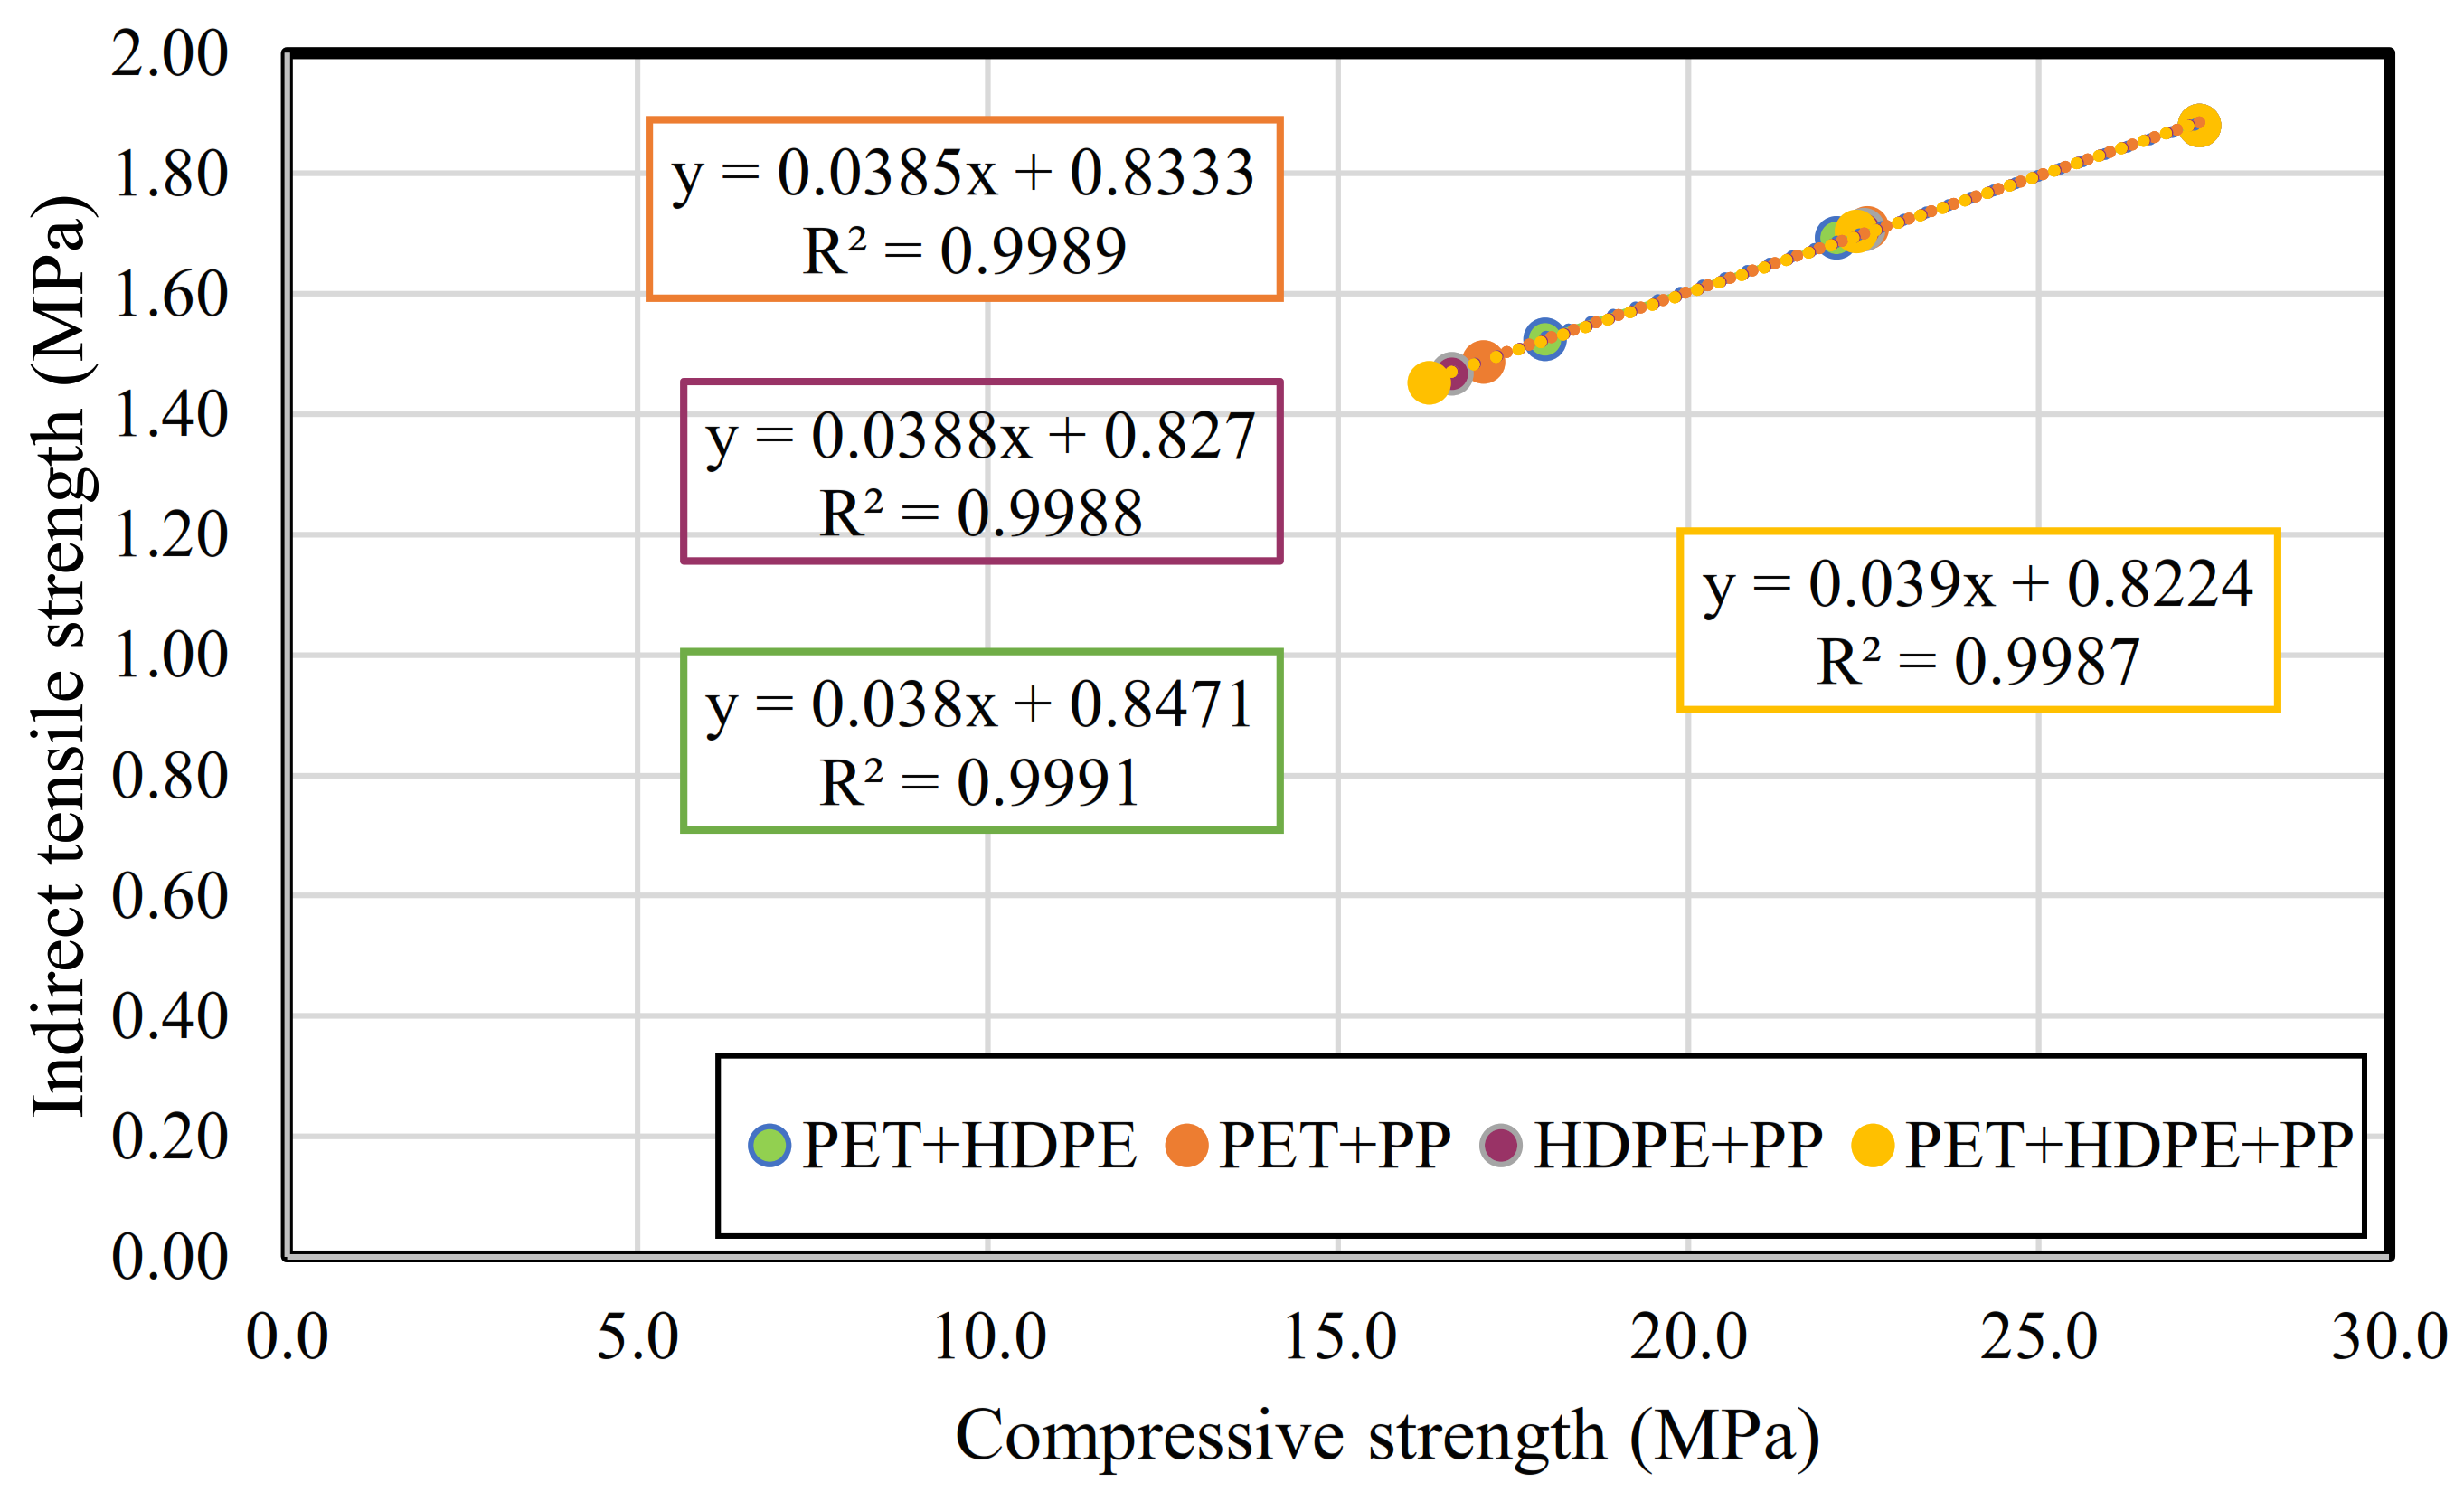
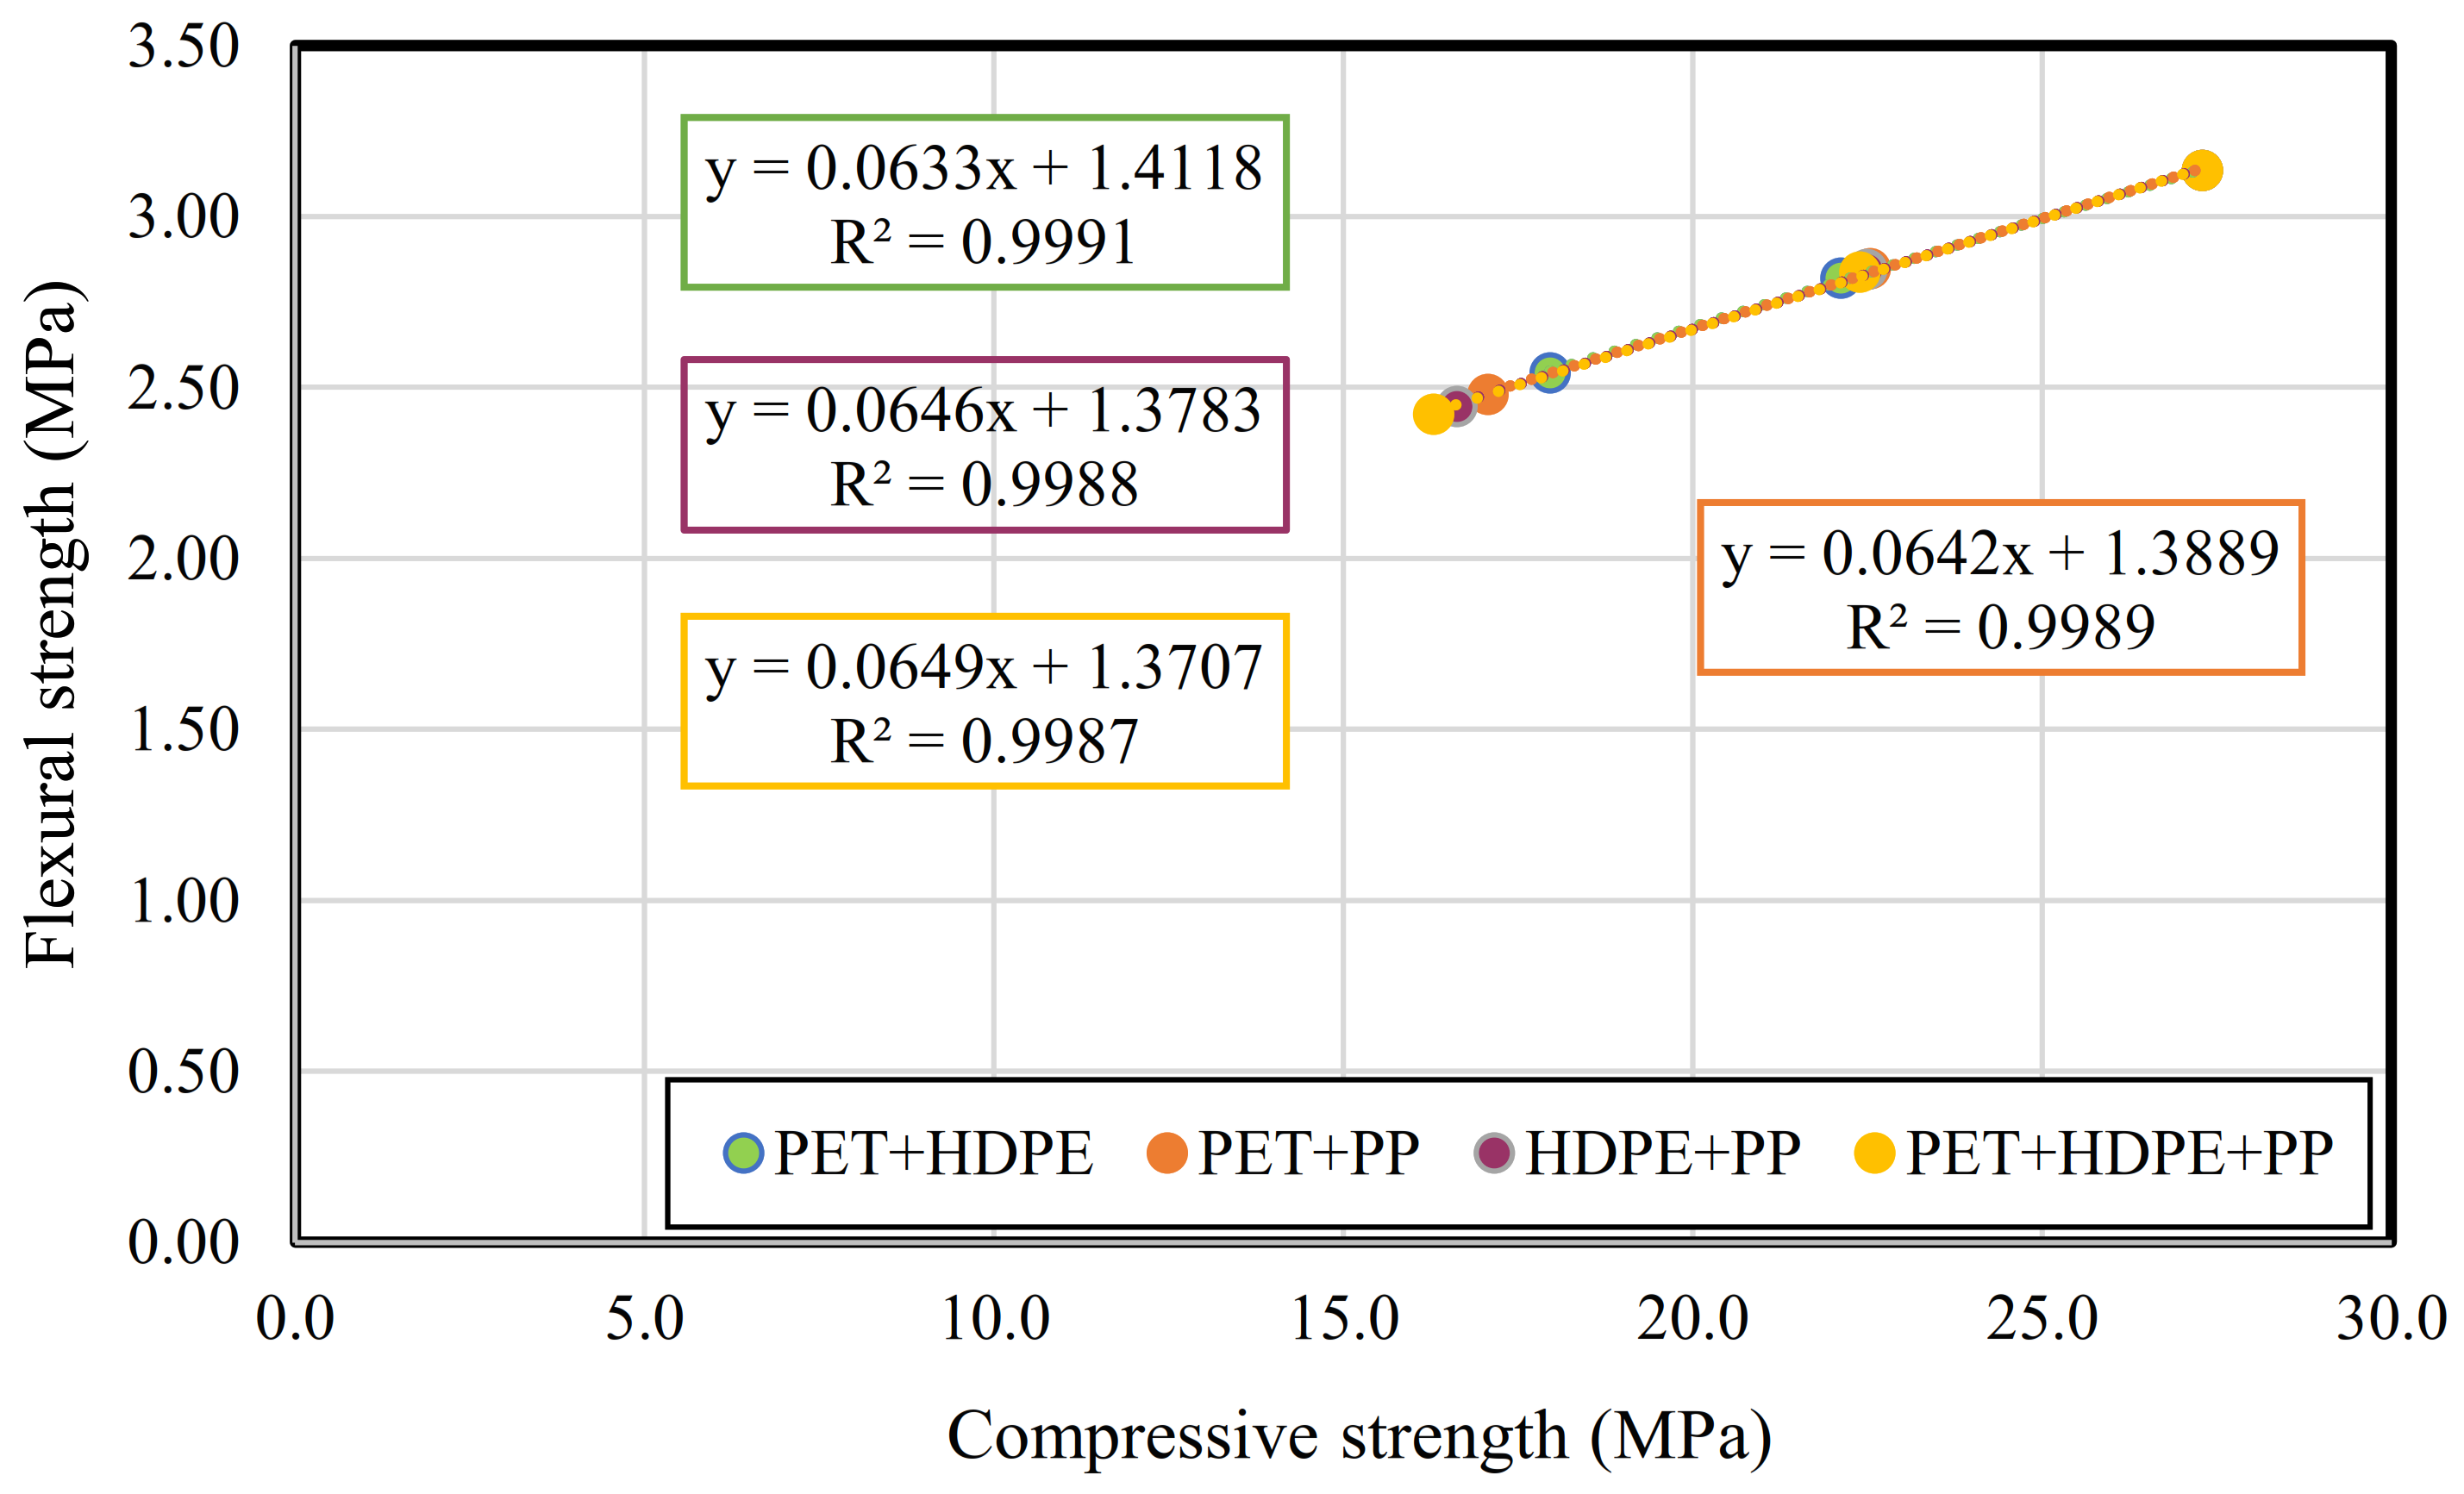
3.2.3. Comparison between Testing Results and AS 3600 Code Predictions

Figure 11, Figure 12 and Figure 13 present the relationship between the tested compressive strength ( f c ) and the predicted results of AS 3600 of other mechanical properties like the indirect tensile strength ( f c t ), flexural strength ( f c t . f ) and modulus of elasticity ( E c ).
The predicted results for indirect tensile and flexural strengths and modulus of elasticity were obtained by using the Australian Standard AS 3600 by the Equations (1)–(3) (Table 4):
f c t = 0.36 f c
f c t . f = 0.6 f c
E c = ρ 1.5 0.043 f c m i × 10 3
Based on comparing the differences in the results, it is clear that the experimental results are higher than the predicted ones in all mechanical properties. In addition, the values of R2 are almost similar, although they are slightly higher in the predicted results. Therefore, the existing equations for normal concrete could be applied to MRPC.

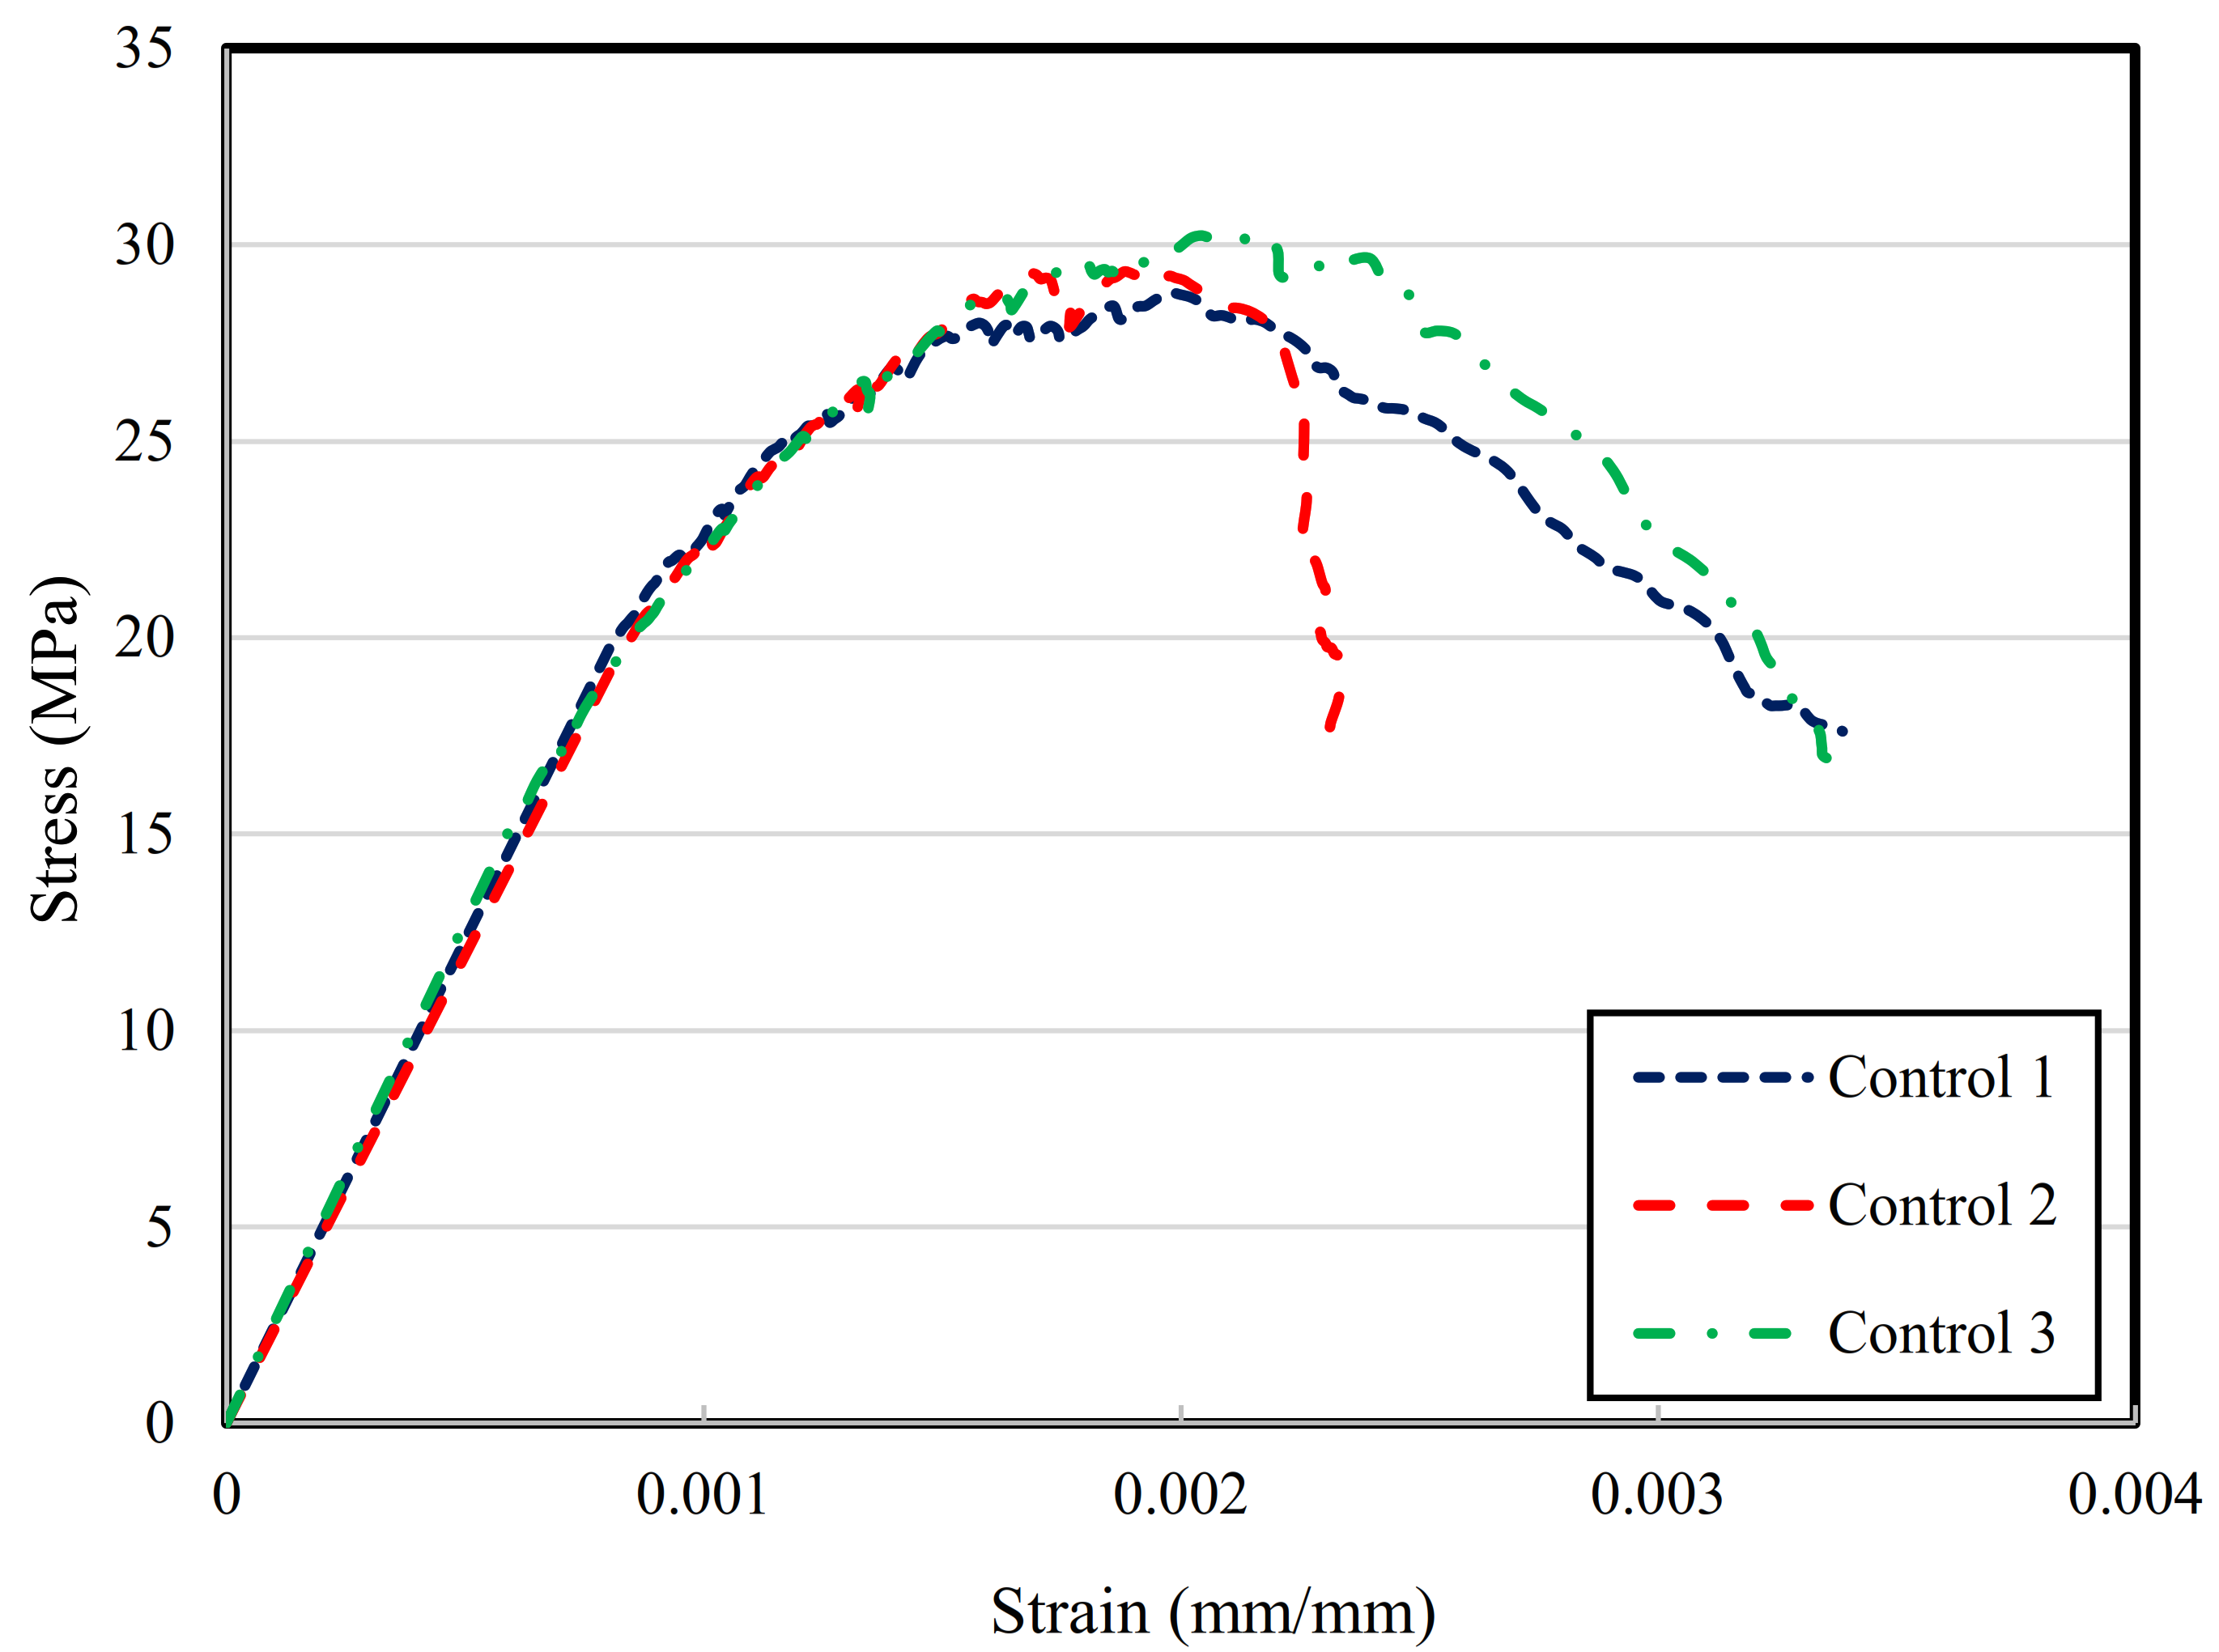
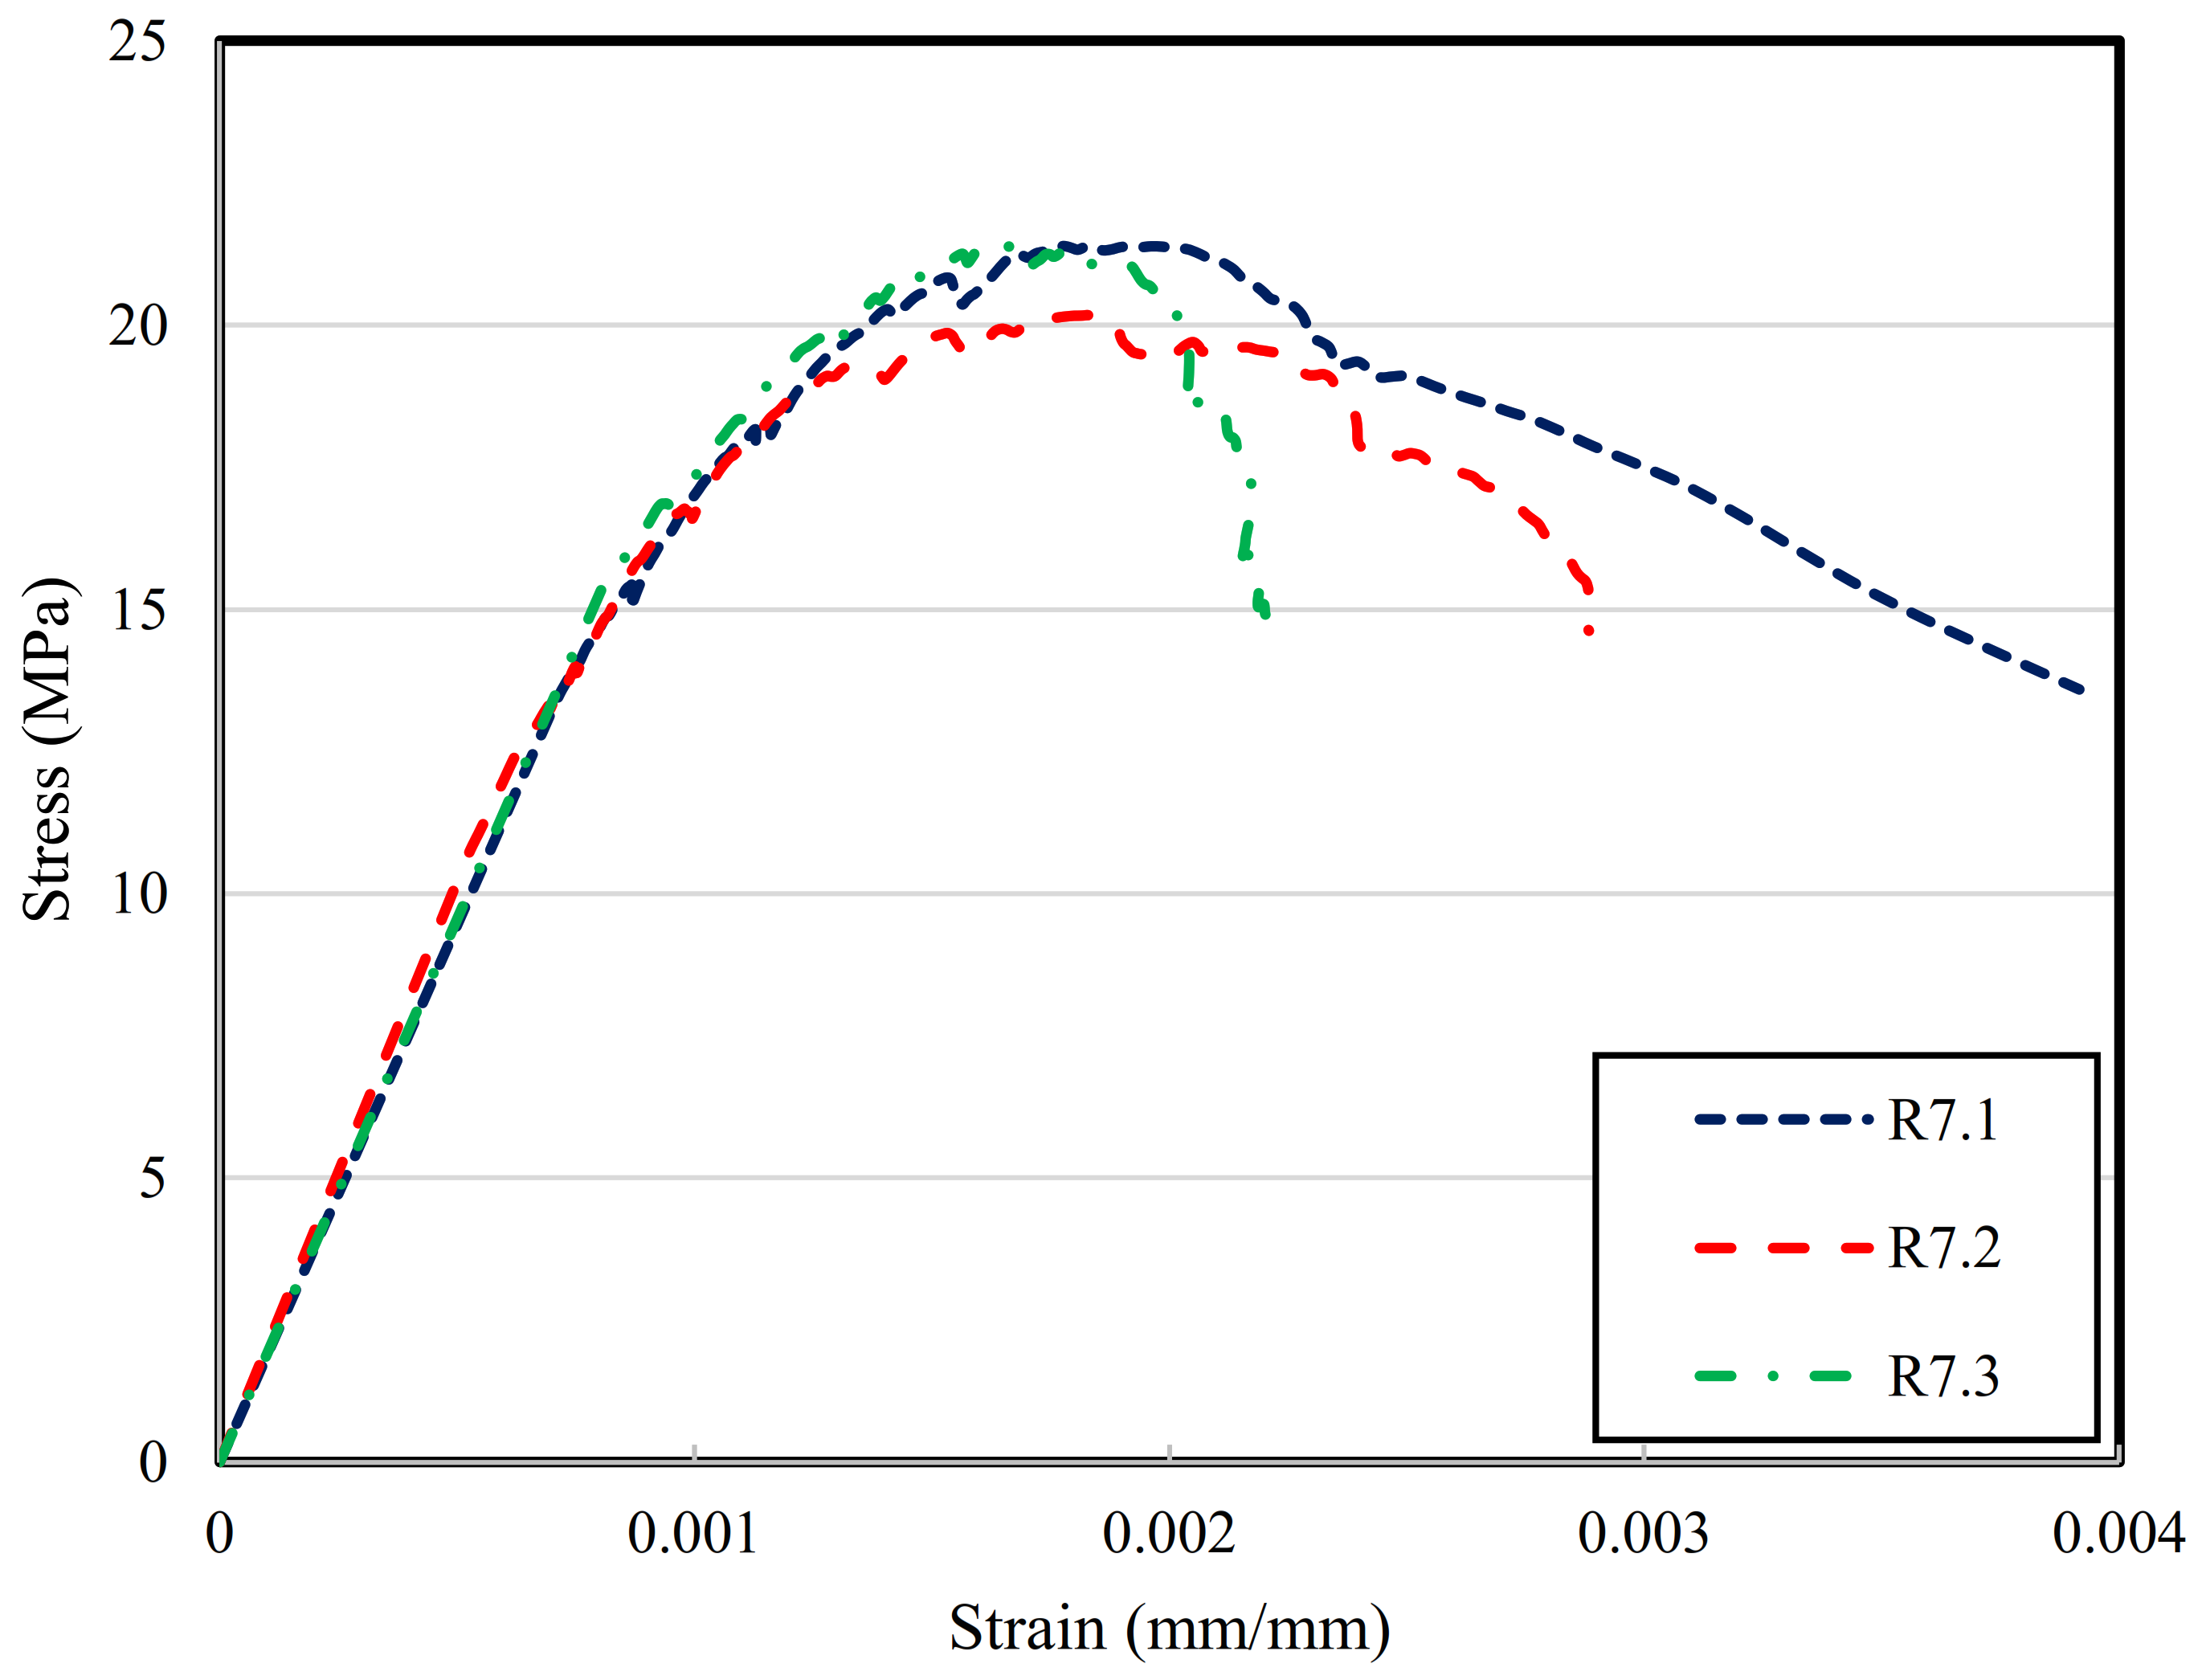
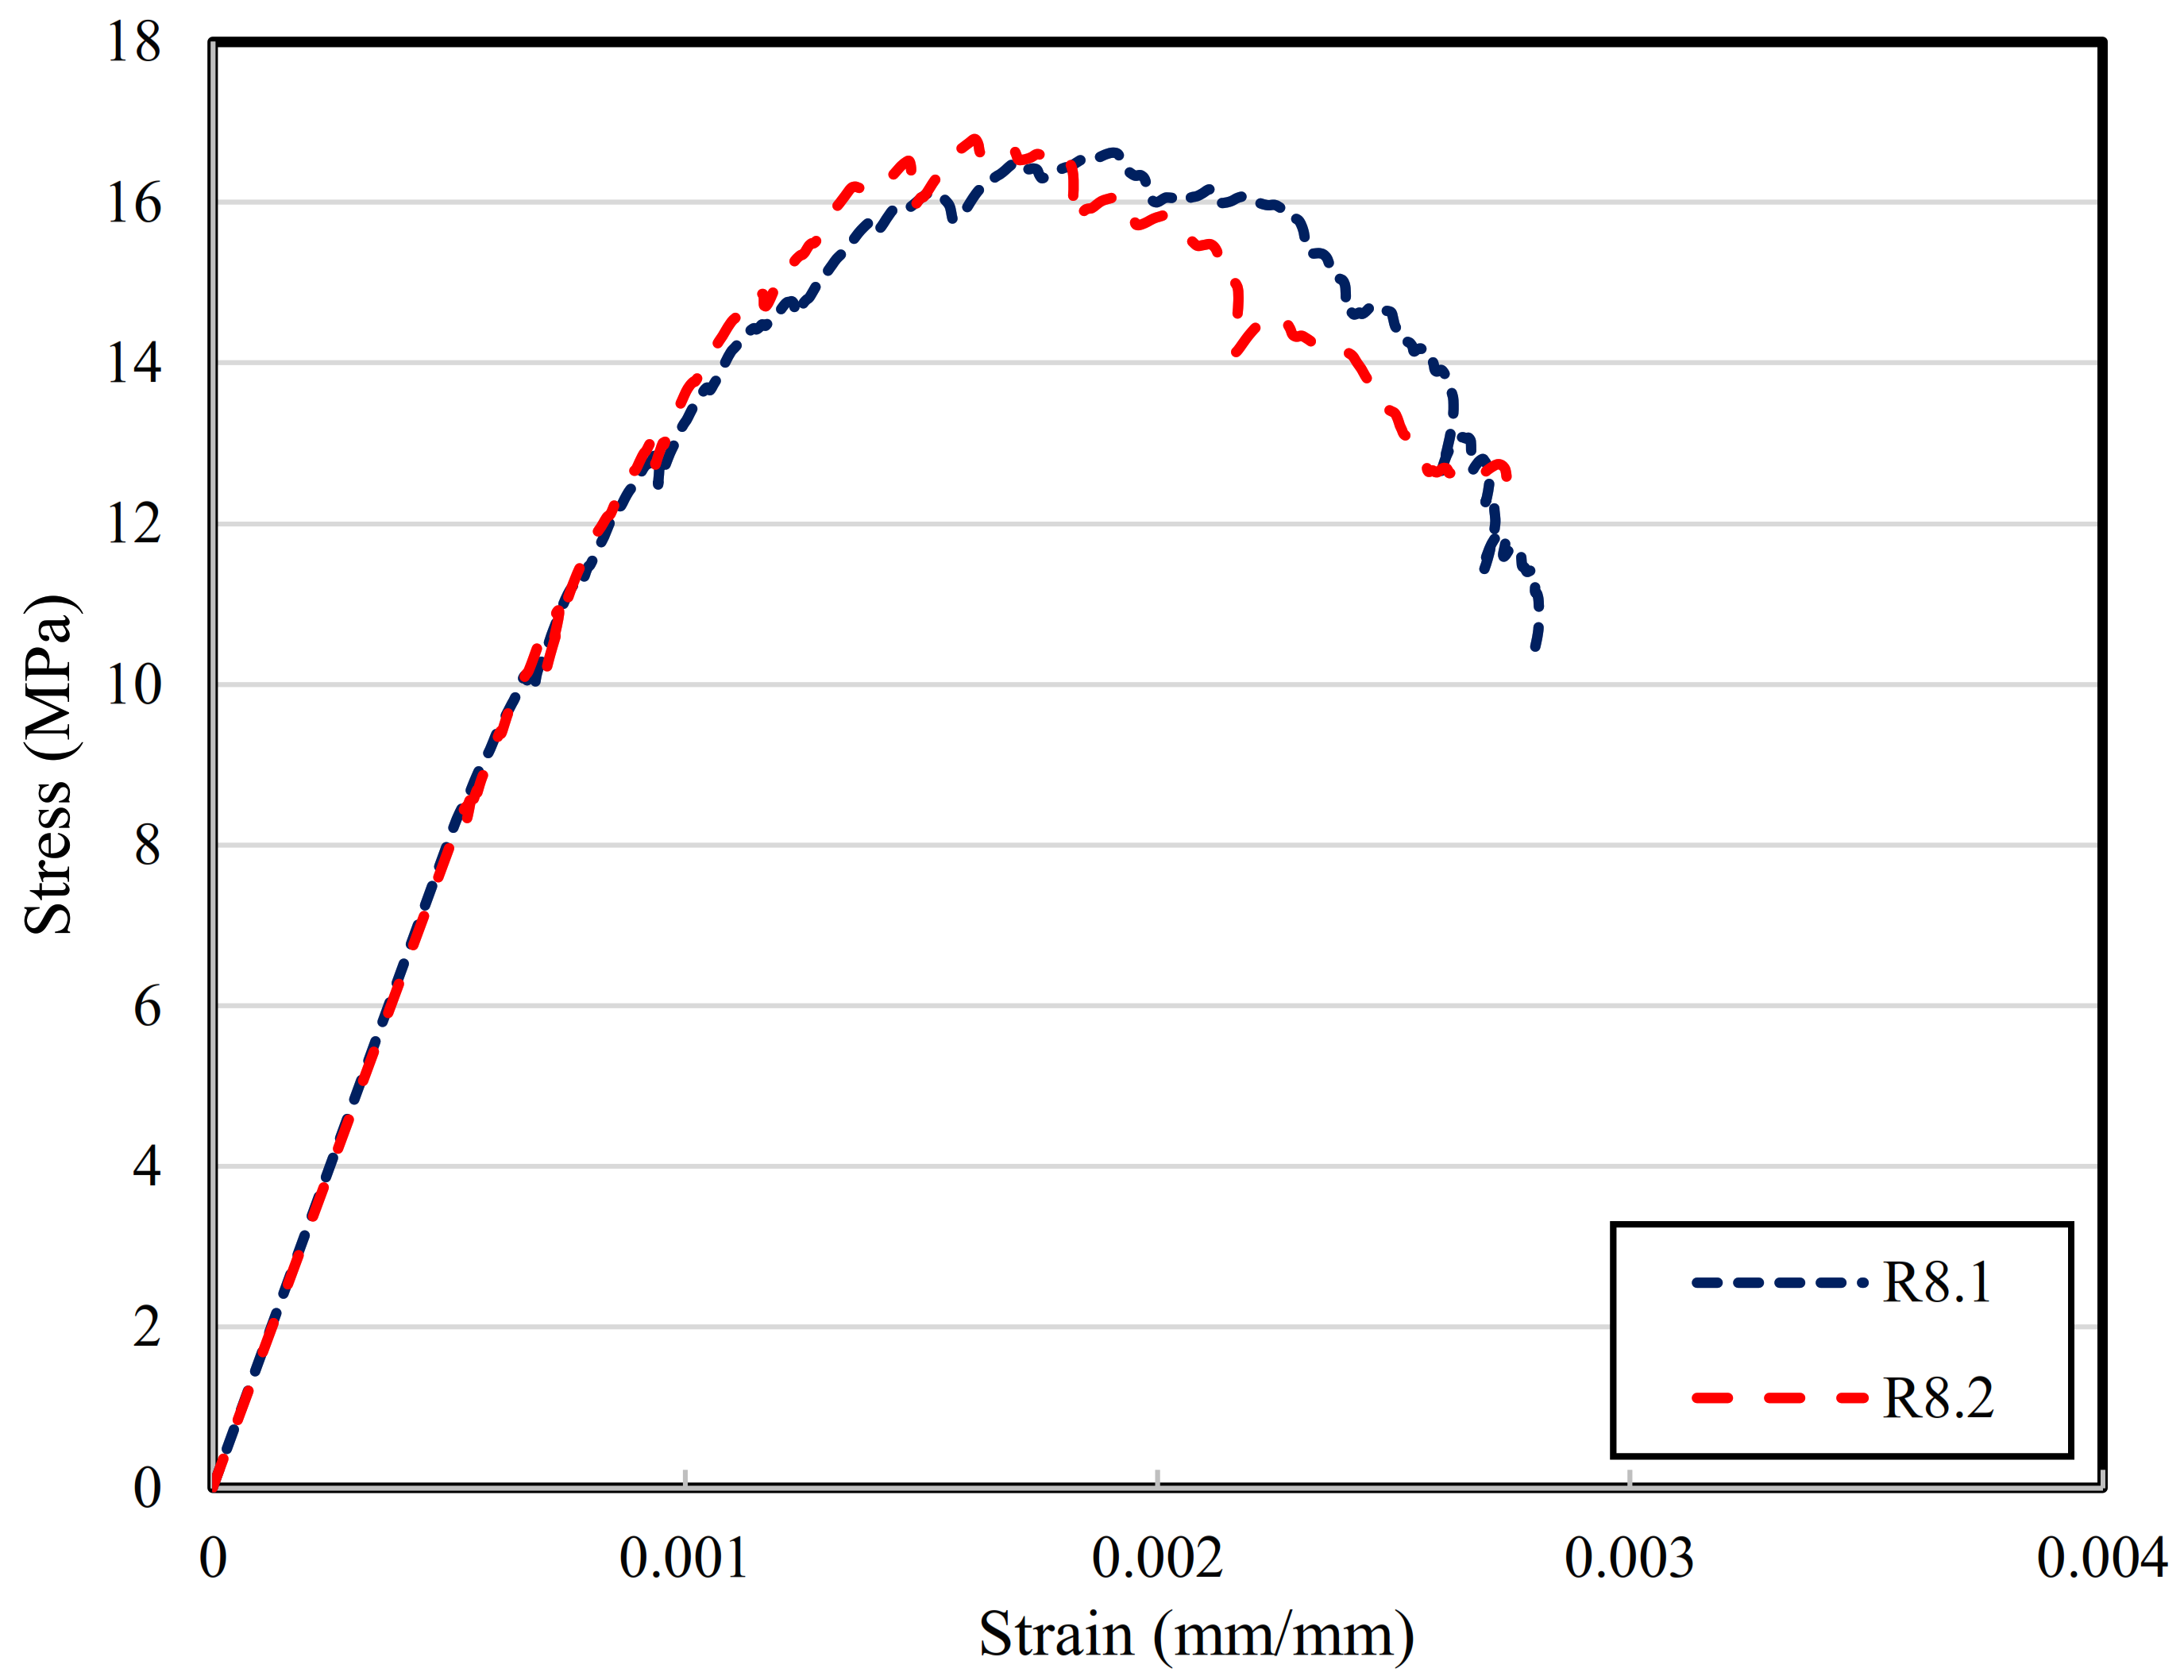
3.2.4. Stress-Strain Curve

The axial compressive stress-strain behaviour was measured for the control, R7 and R8 mixes. The curves of the three tested individual samples for each mix and their averages were used for analysis as shown in Figure 14, Figure 15, Figure 16 and Figure 17. In Figure 14, Figure 15 and Figure 16, it is observed that all the samples of the tested mixes have the same orientation by starting the curve with linear behaviour and increased until achieved the peak stress. Figure 17 shows a decrease in the compressive strength when increasing the percentage of replacement ratios, while the axial strain at peak stress ( ε c ) shows a different behaviour since it decreased by 6% in R7 at 15% replacement and R8 showed less of a decrease than R7 which was 3.3% at 30% replacement. From another point of view, considering the ultimate strain of concrete ( ε c u ) at 80% of the concrete strength, the ε c u of 15% replacement (R7) increased by 8.1% while it decreased by 1.2% at 30% of replacement. This indicated that R7 has a higher deformation capacity but at 30% replacement R8 exhibited a lower deformation capacity as the replacement increased. In spite of the differences of plastic type and percentage of replacement, R7 at 15% replacement exhibited the same trend which was described by the authors of [4] who stated that the plastic concrete with lower strength exhibited less brittle behaviour. R8 at 30% replacement showed similar behaviour to the control.

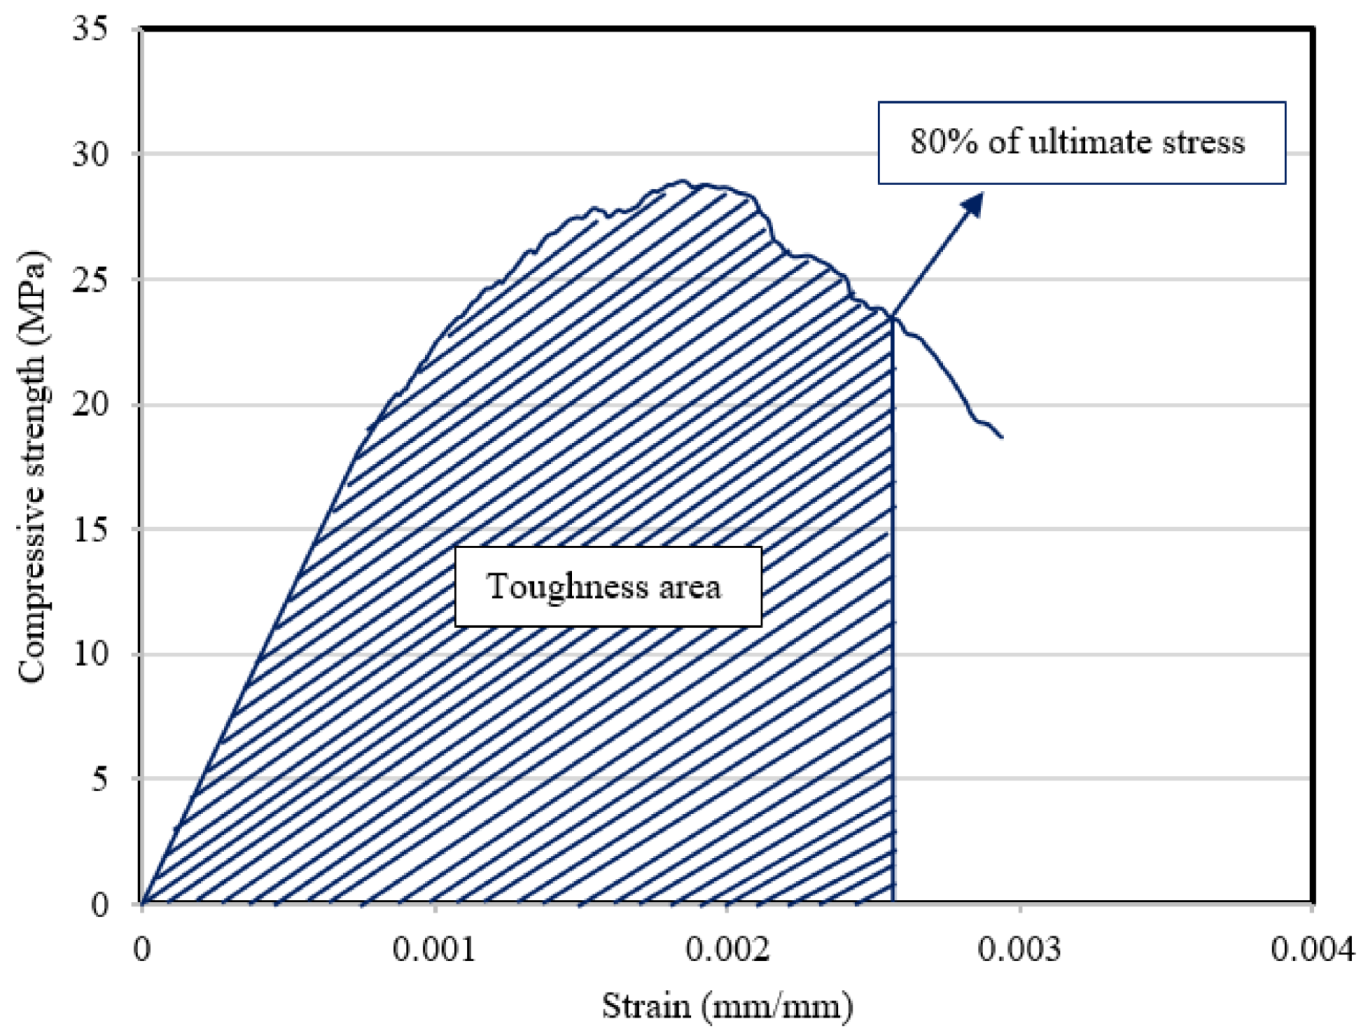
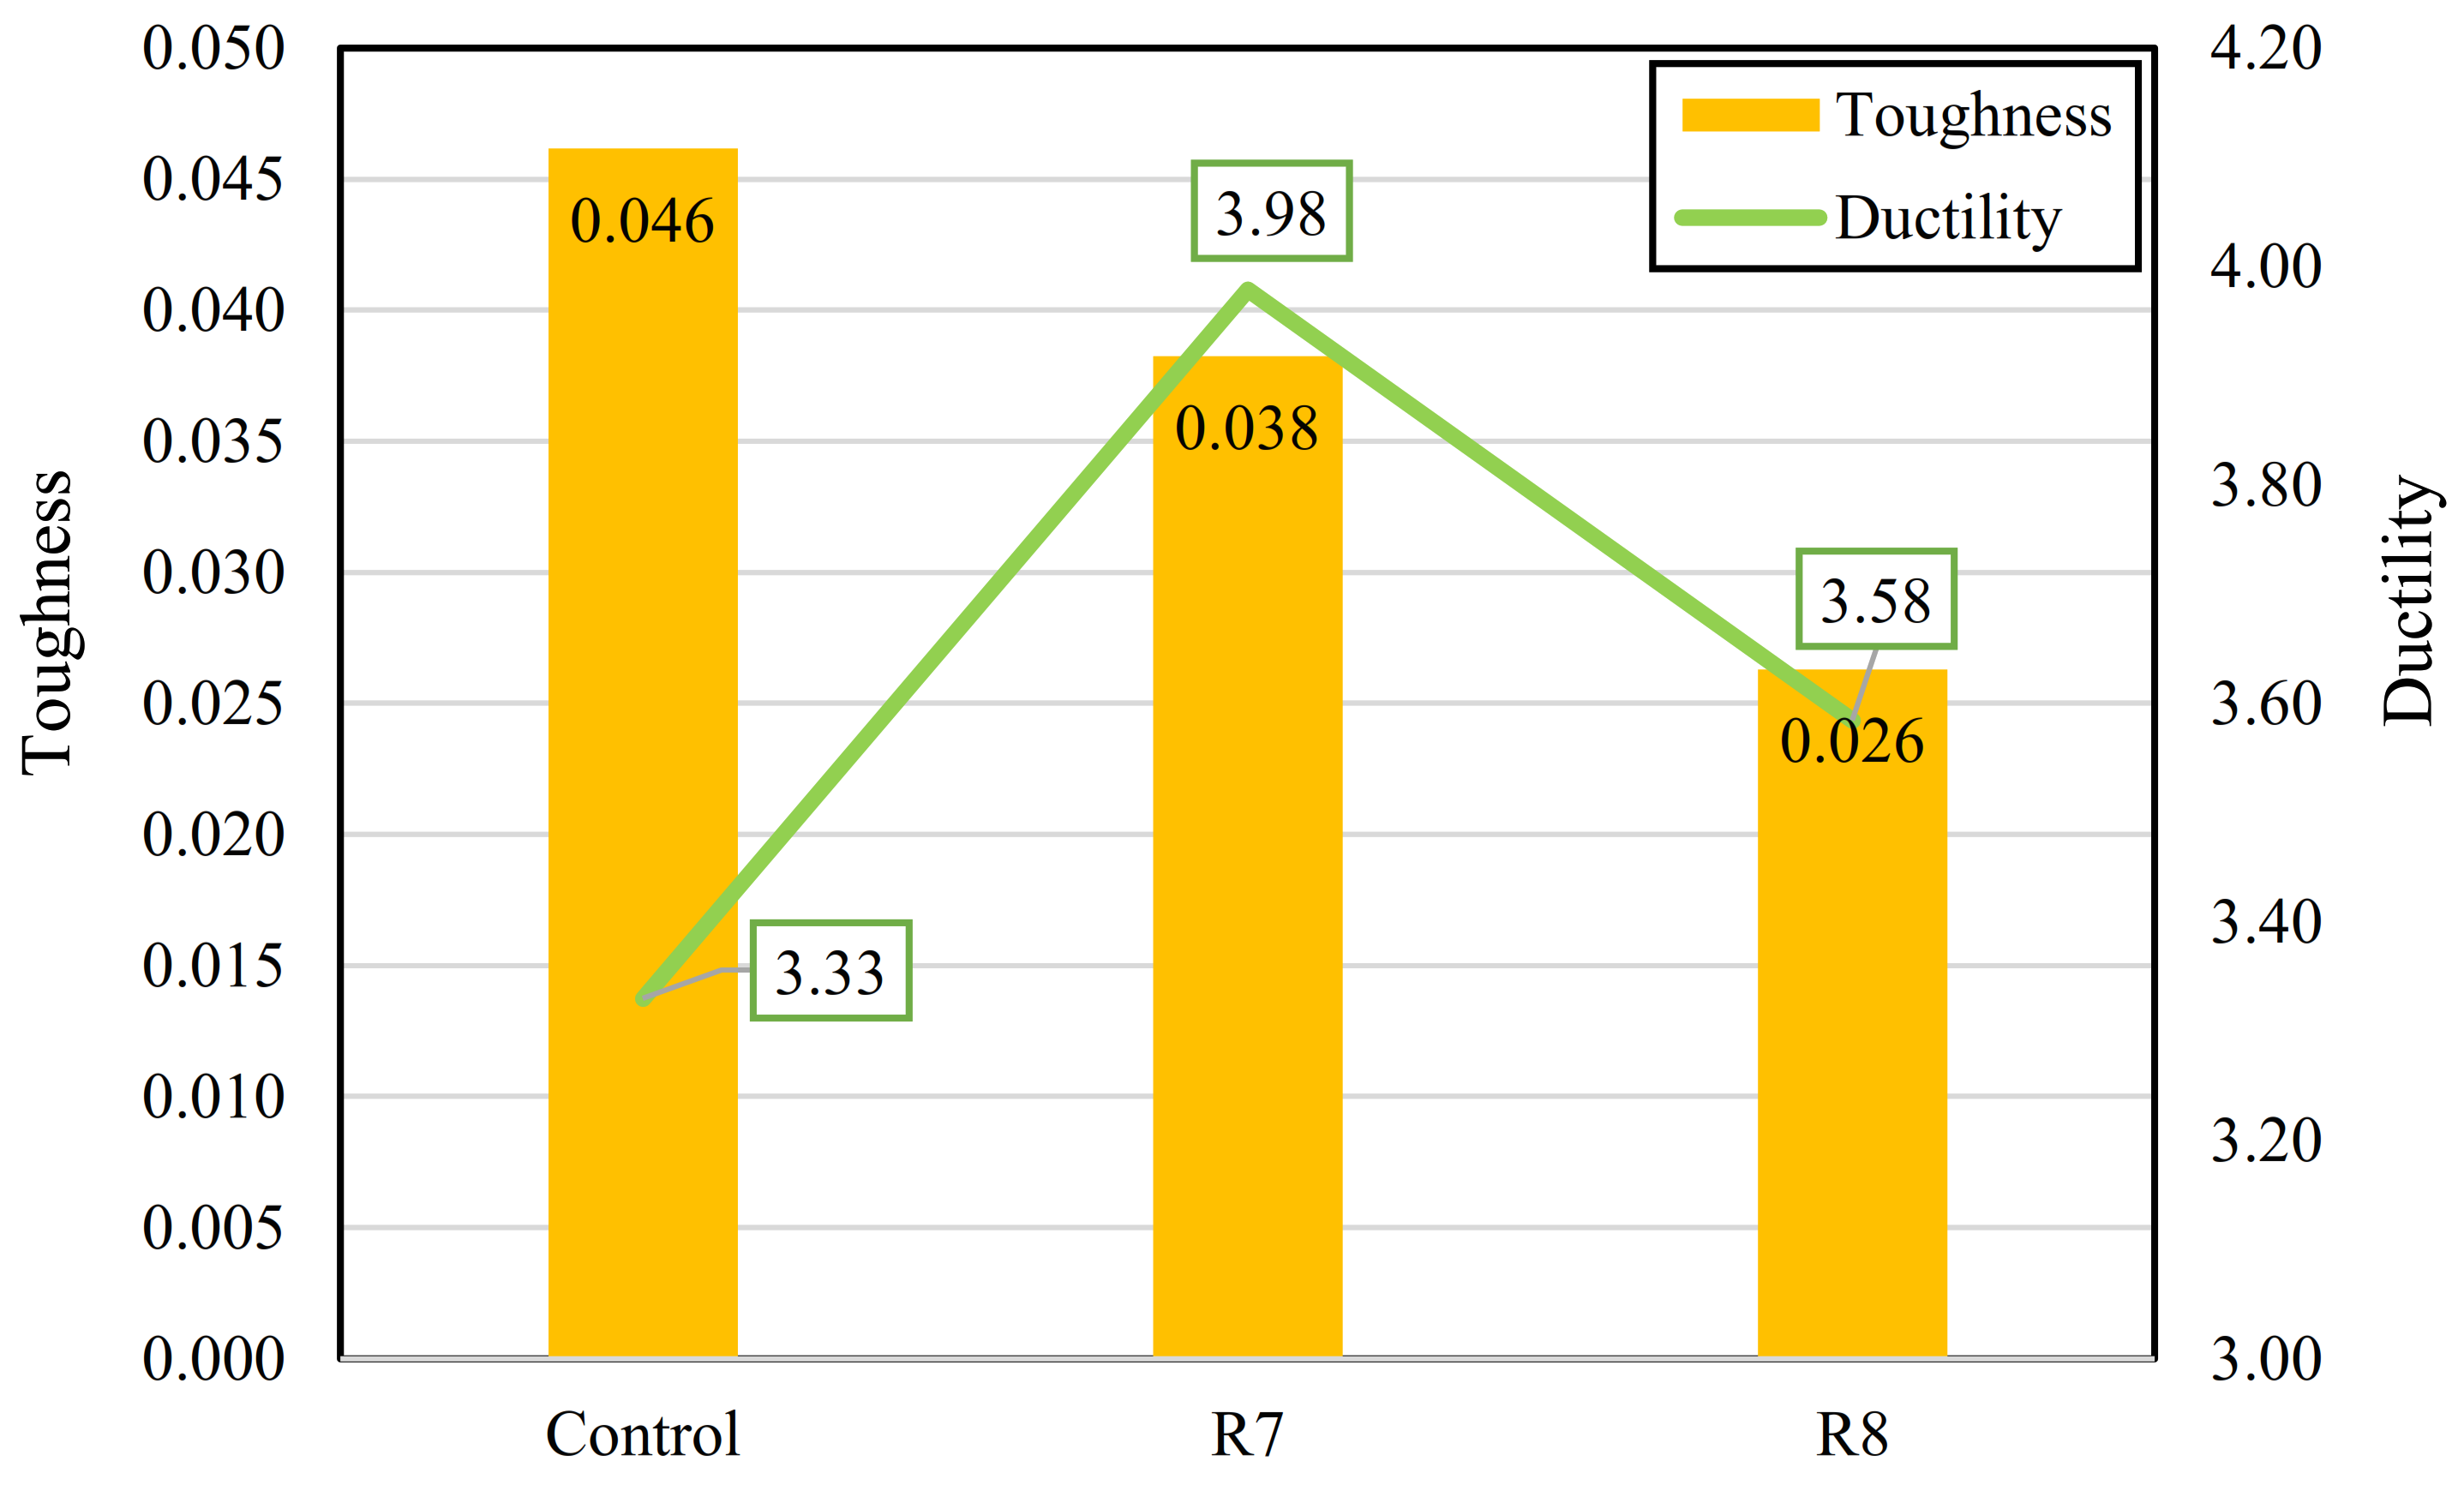
3.2.5. Toughness and Ductility

The toughness of concrete specimens is calculated as the area under the stress-strain curves up to the ultimate strain as shown in Figure 18. Figure 19 shows the values of toughness and ductility for the corresponding mixes. It indicated a decrease in the toughness by 17.4% and 43.5% for R7 and R8, respectively compared to the control mix. The reduction of toughness is attributed to the stress reduction of plastic concrete. The ductility values were calculated as the ratio of ultimate strain at 80% of the ultimate stress to the yield strain at 0.65 of the ultimate stress as recommended by [33]. In general, R7 and R8 showed better ductility values by 19.5% and 7.5% compared to the control mix. This indicates that the MRPCs are comparable to that of conventional concrete.

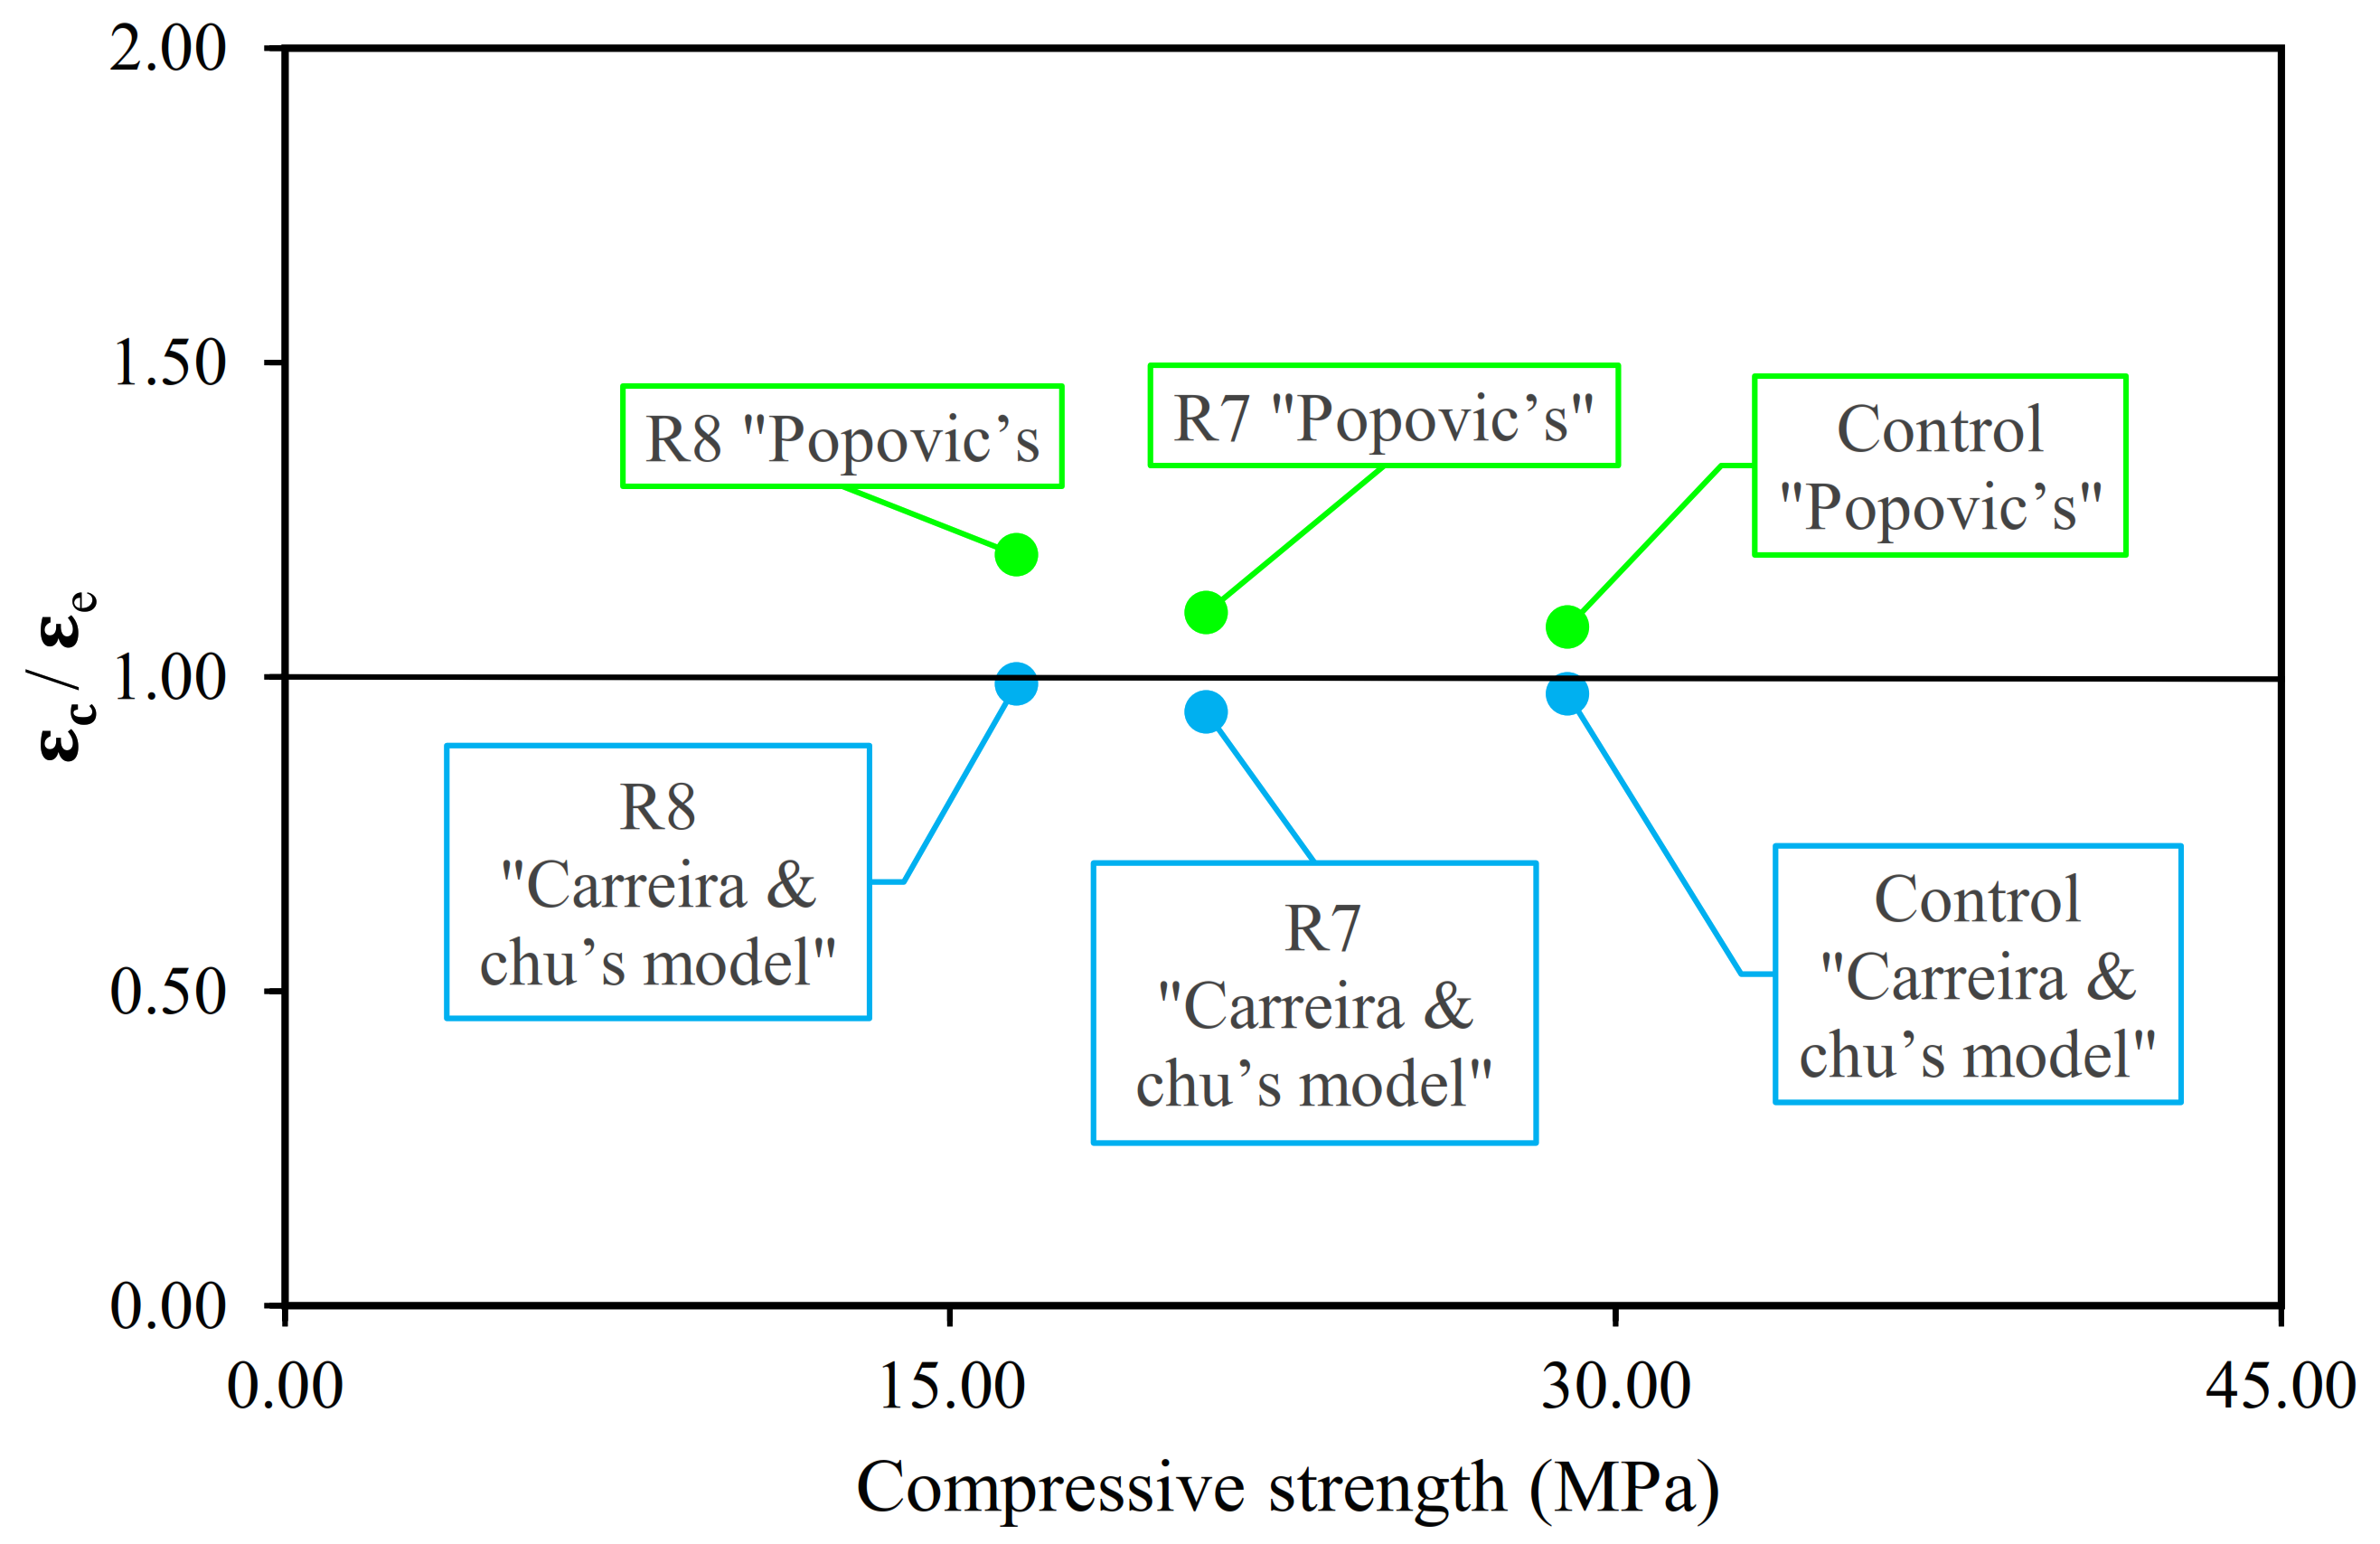
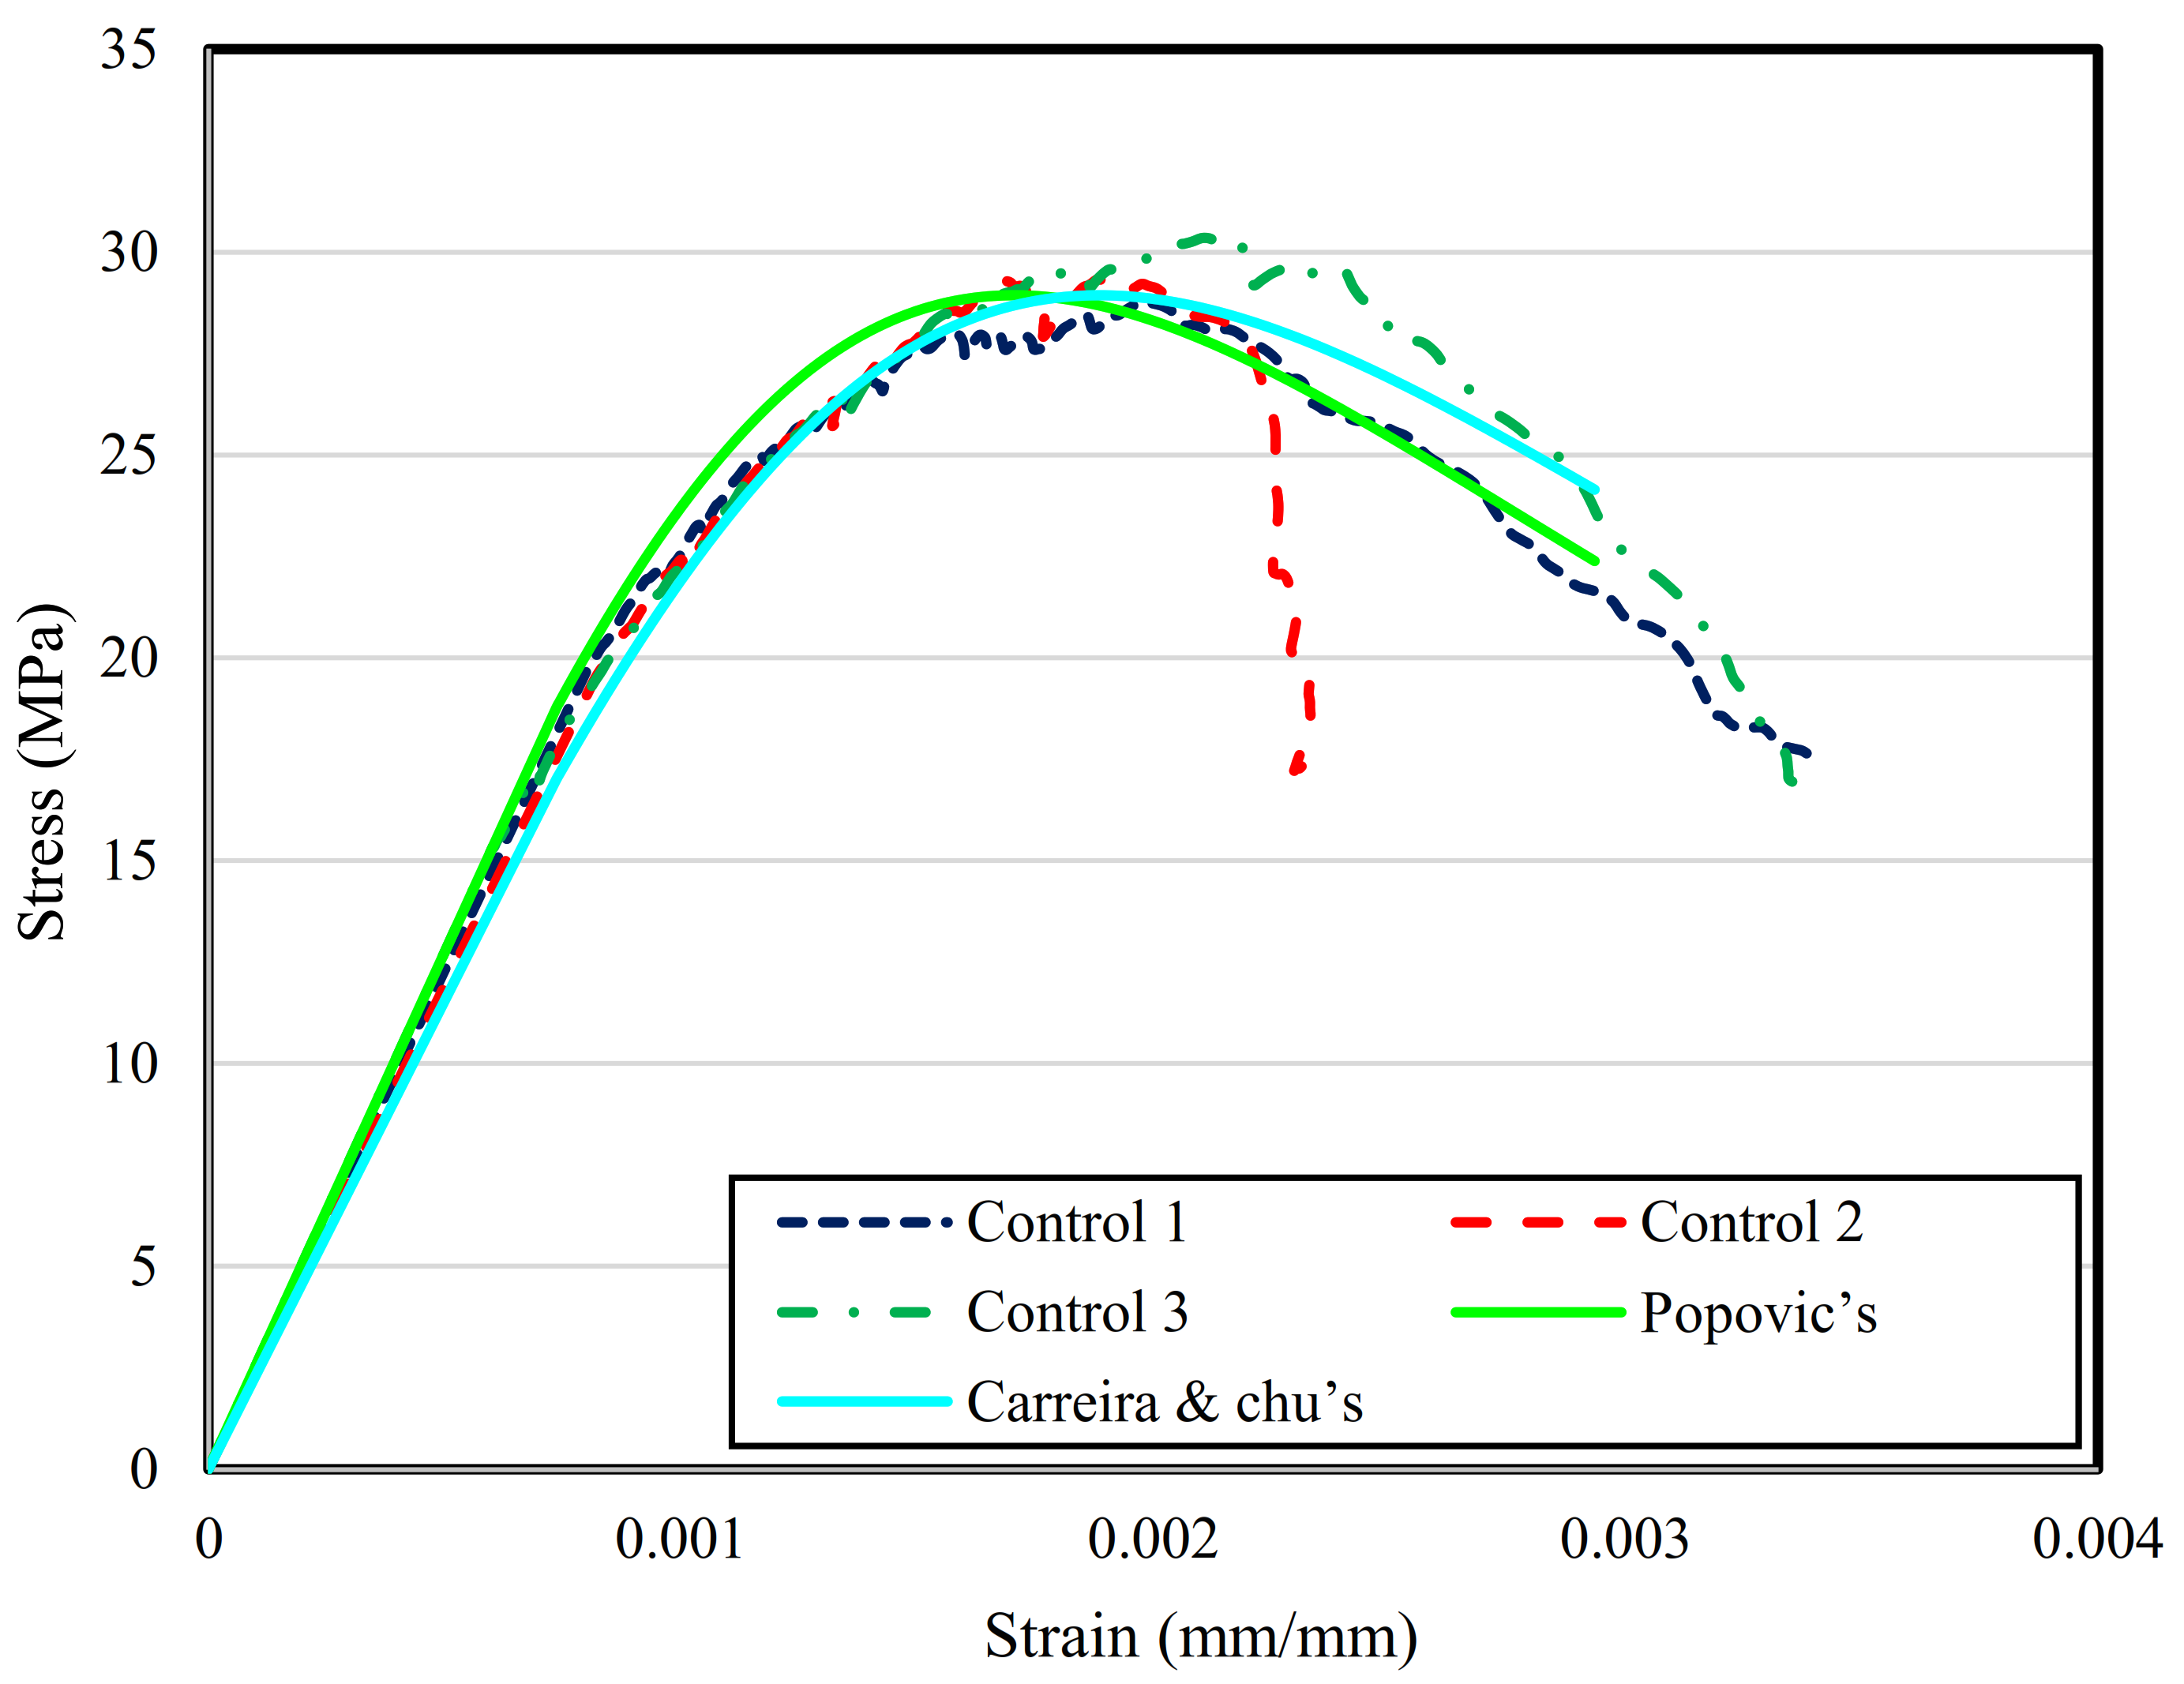
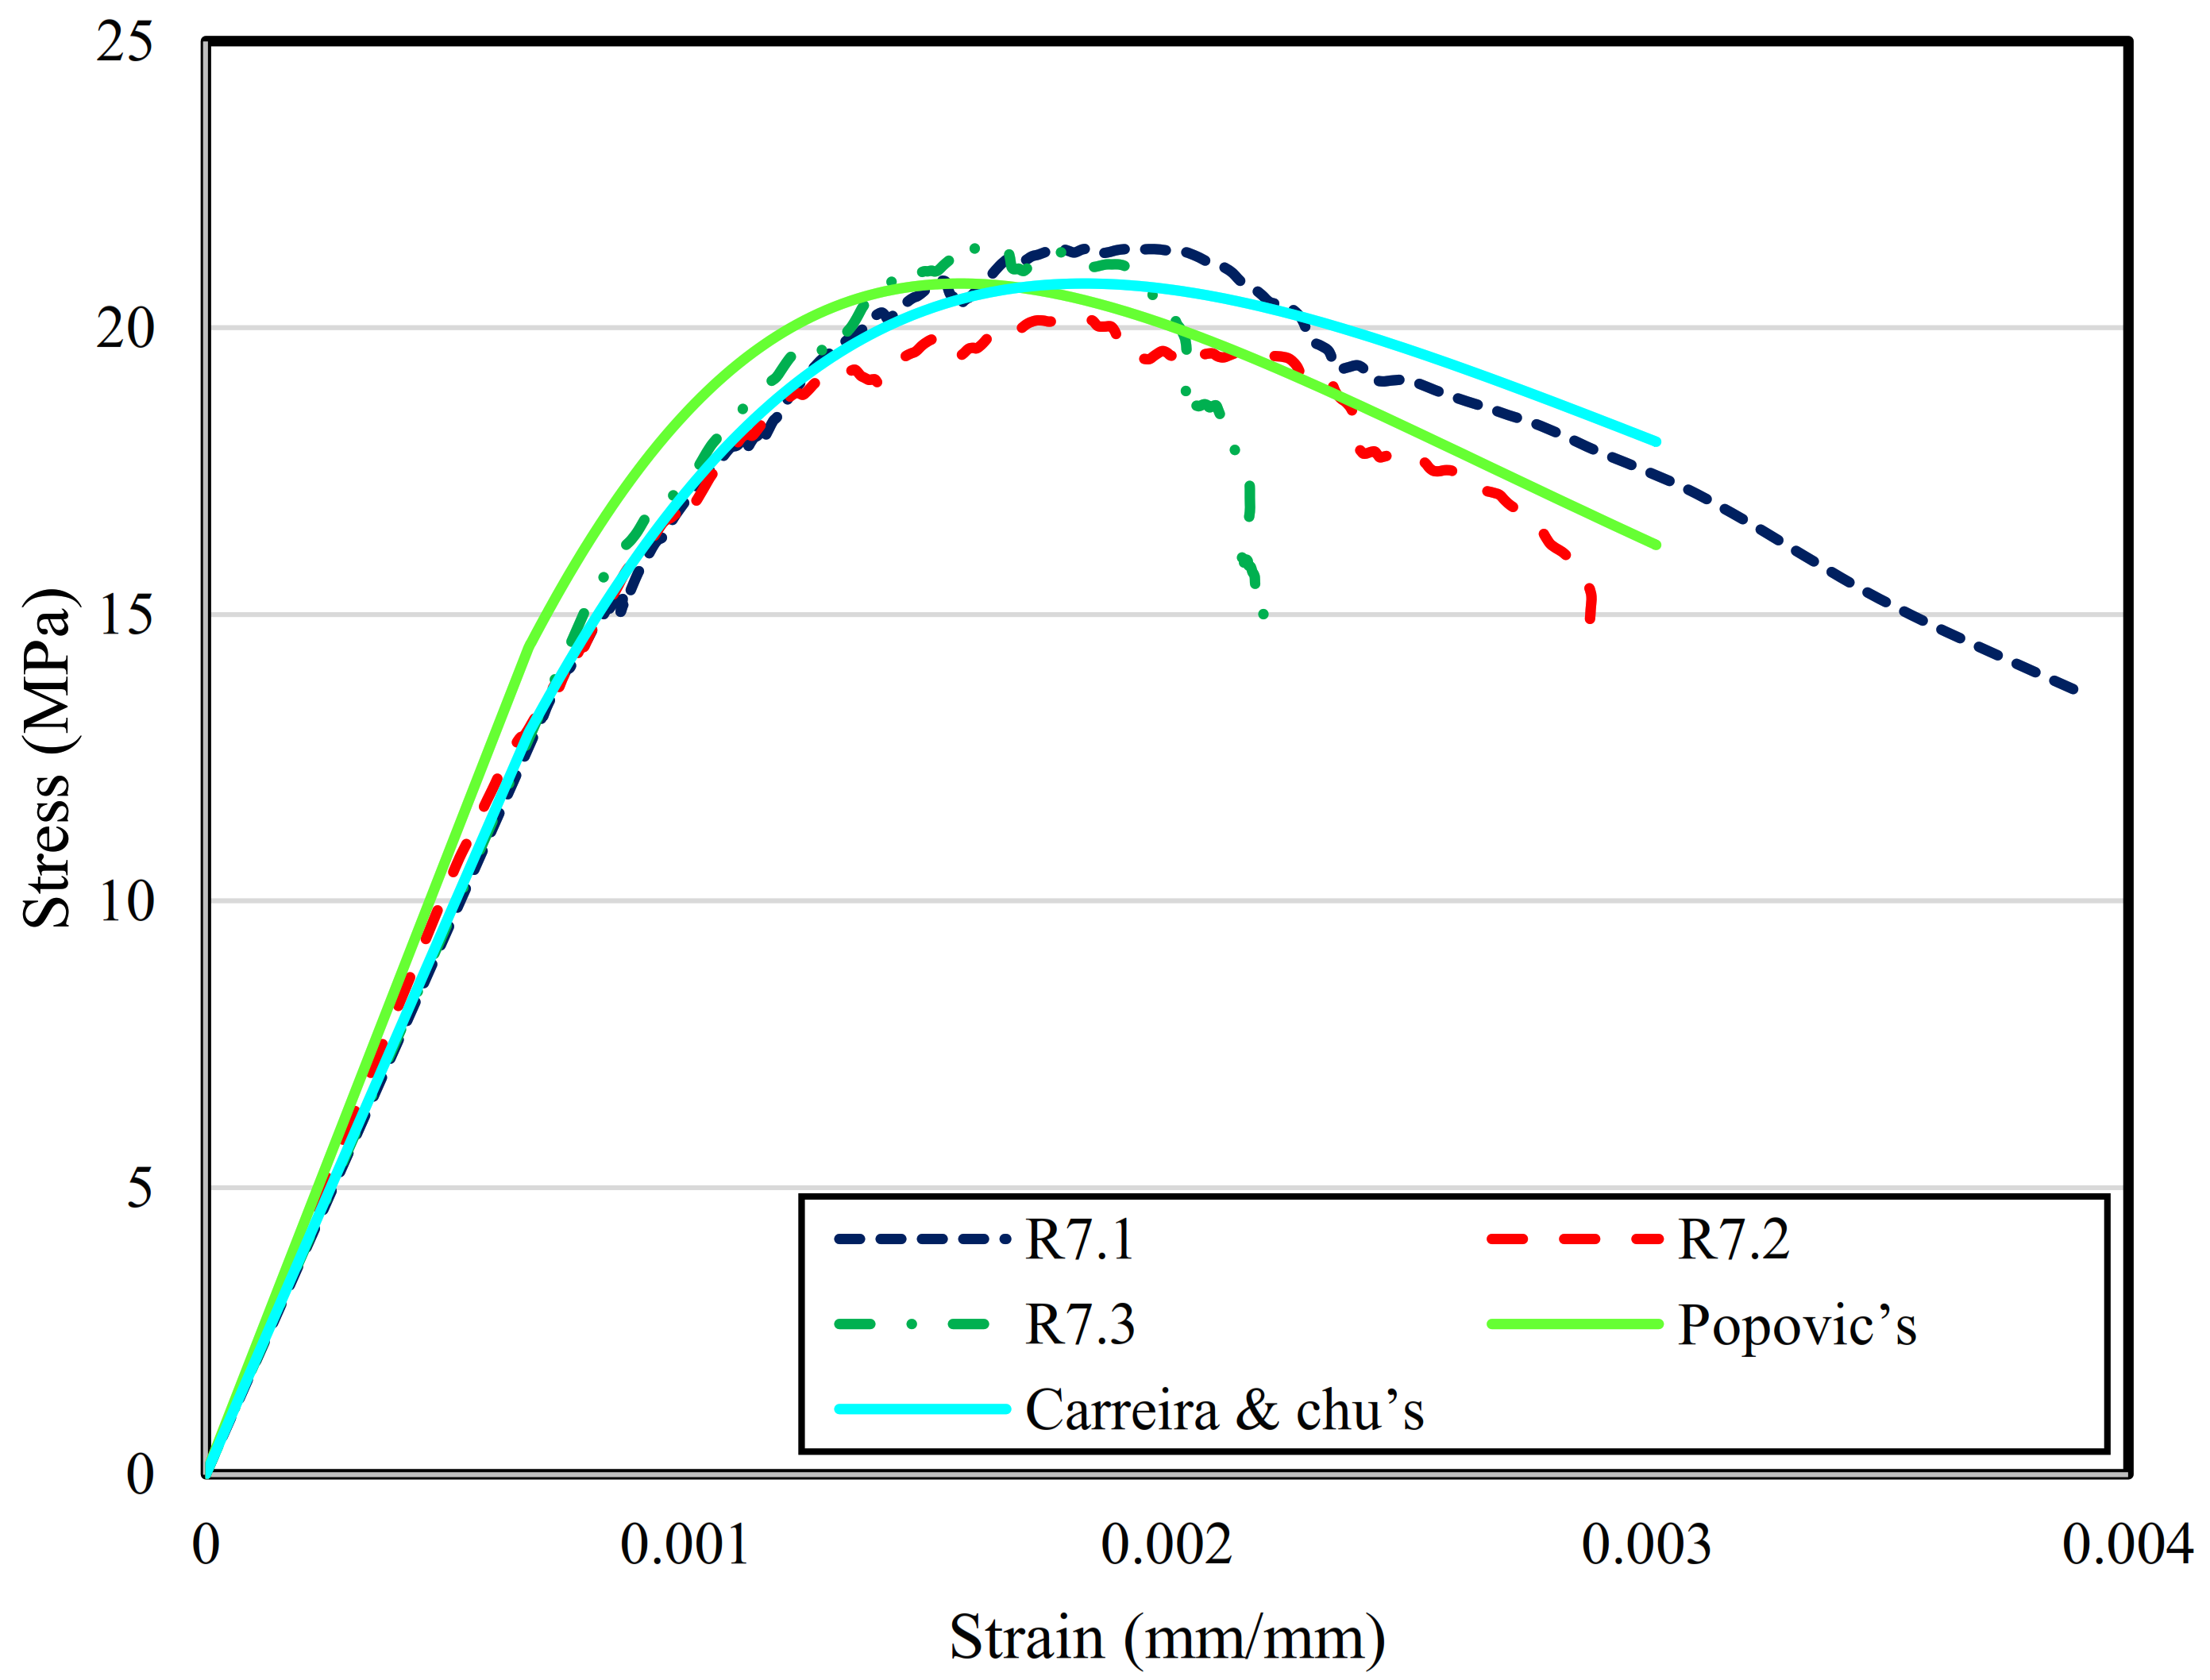
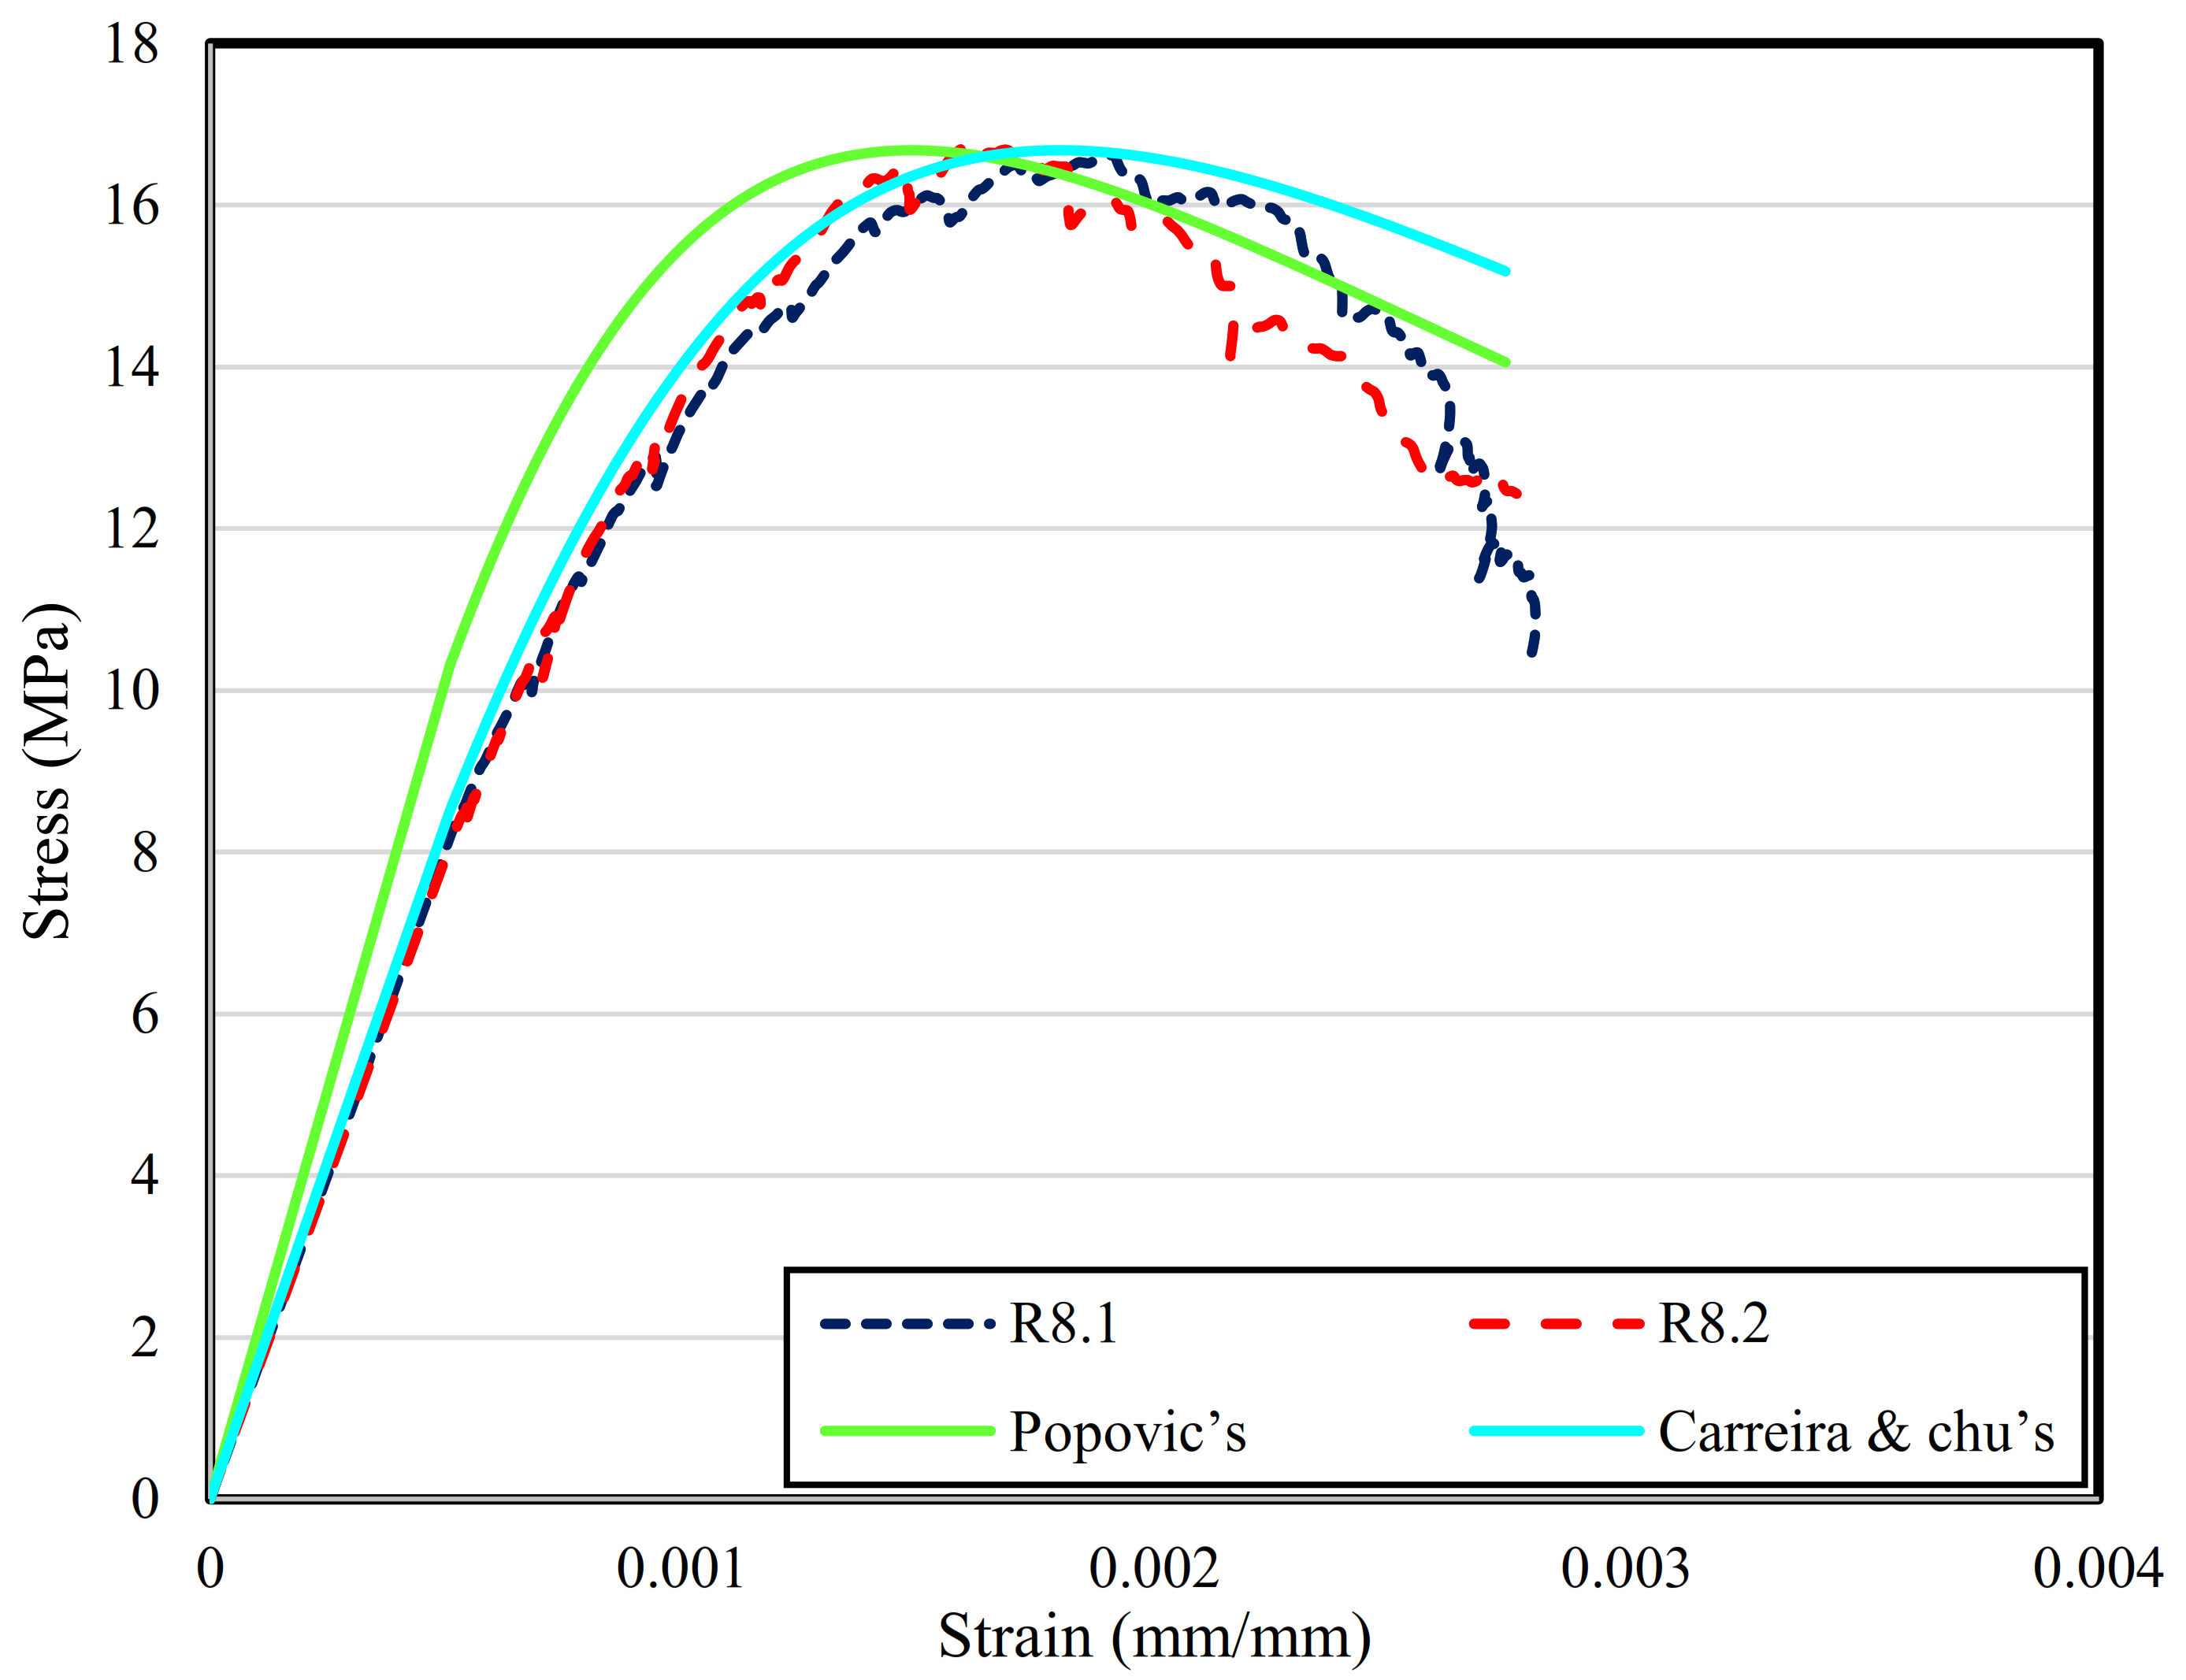
3.2.6. Stress-Strain Curves Comparison with Existing Constitutive Model

To evaluate the accuracy of the current expressions in predicting the stress-strain behaviour of concrete with mixed plastics, the stress-strain curves of the experimental results were compared with two existing popular models, namely, Popovic’s model [34] (Equations (4)–(6)) and Carreira and Chu’s model [35] (Equations (7)–(10)).
σ = f c β ( ε ε 0 ) / [ β 1 + ( ε ε 0 ) β ]
β = 1 + 0.058 f c
ε 0 = 735 f c 0.25 × 10 6
σ = f c β ( ε ε 0 ) / [ β 1 + ( ε ε 0 ) β ]
β = 1 / 1 f c . / ( ε 0 E i t )  
E i t = 0.0736 ρ 1.51 f c 0.3
ε 0 = 1680 + 7.1 f c × 10 6
To confirm the validity of the two existing constitutive models, all the parameters were kept as in the original formula. To evaluate the accuracy of the two proposed models, the ratio of the average measured axial strain at peak stress ( ε c )   versus the predicted values ( ε e ) for the three mixes (control, R7 and R8) are shown in Figure 20. The values of ε c / ε e in Popovic’s model are 1.08, 1.10 and 1.19 for the control, R7 and R8, respectively while for Carreira and Chu’s model they are 0.97, 0.95 and 0.99, respectively. It is observed from Figure 20 that Carreira and Chu’s model is more accurate than Popovic’s model but less conservative.
Figure 20, Figure 21, Figure 22 and Figure 23 show the comparison of the tested stress-strain curve with the existing constitutive models for the corresponding mixes. It appears that Carreira and Chu’s model fits the tested stress-strain curves well. Hence, Carreira and Chu’s model could be used for MRPC and there is no need to develop a new model.

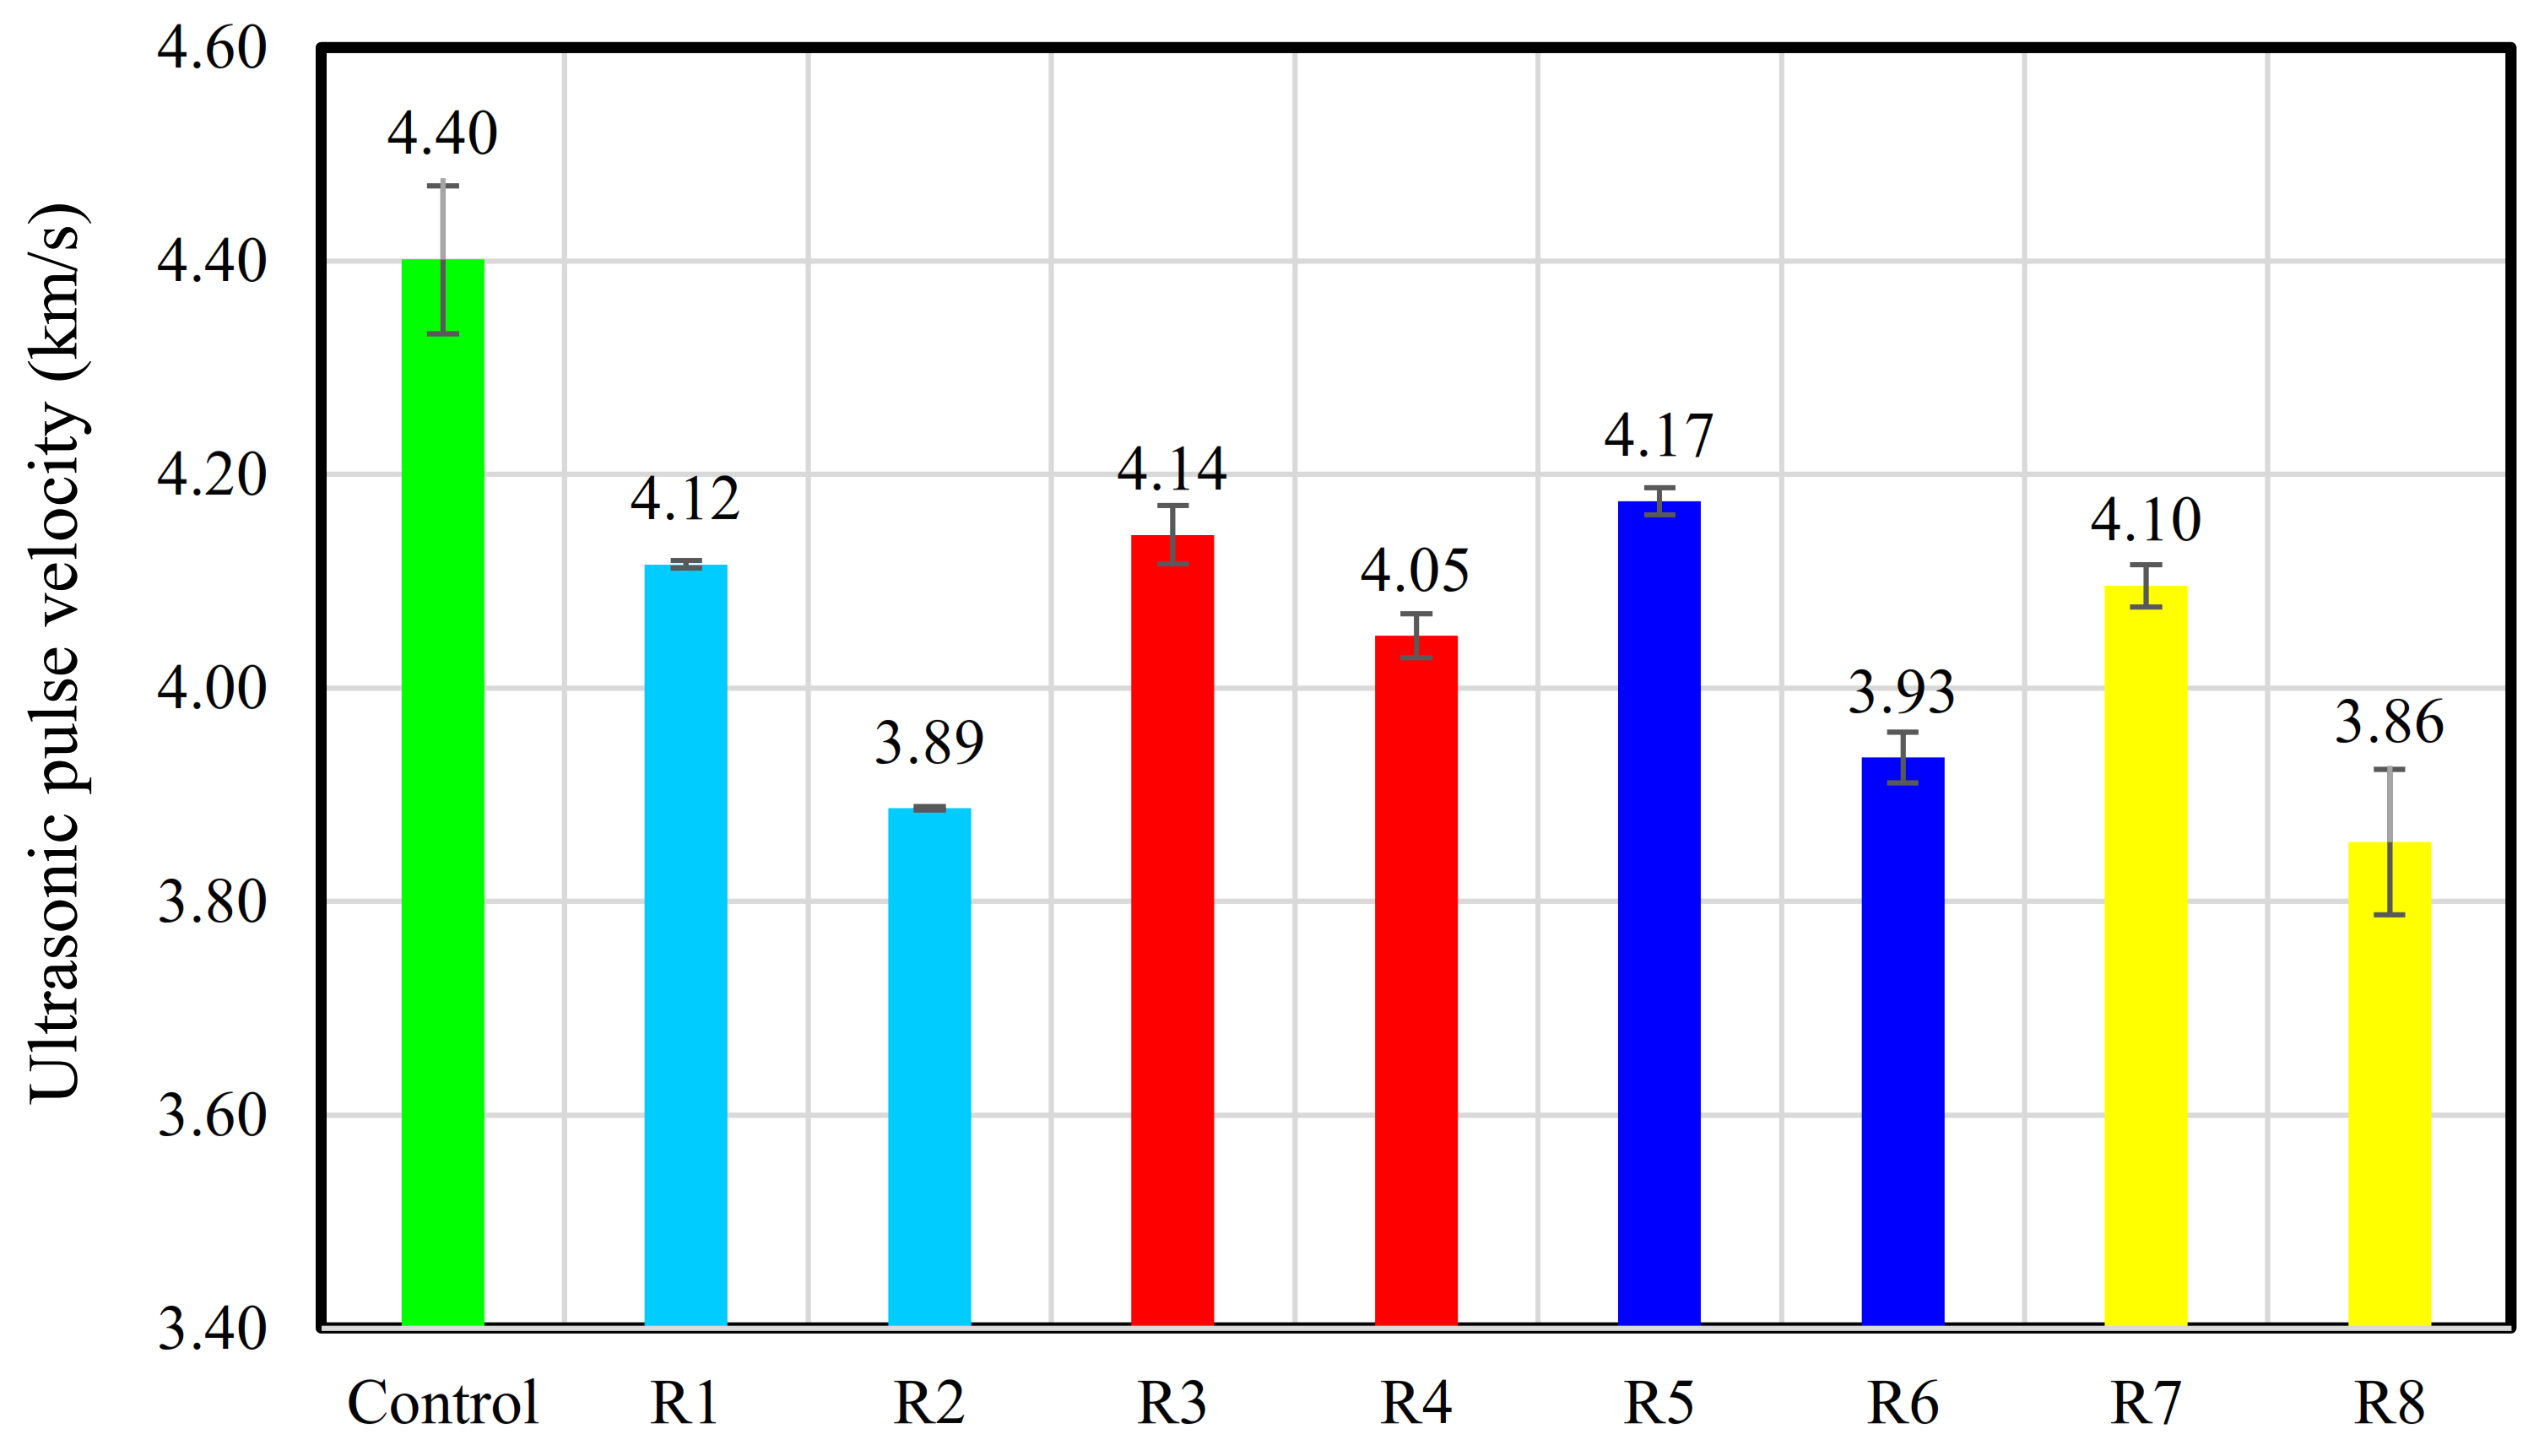
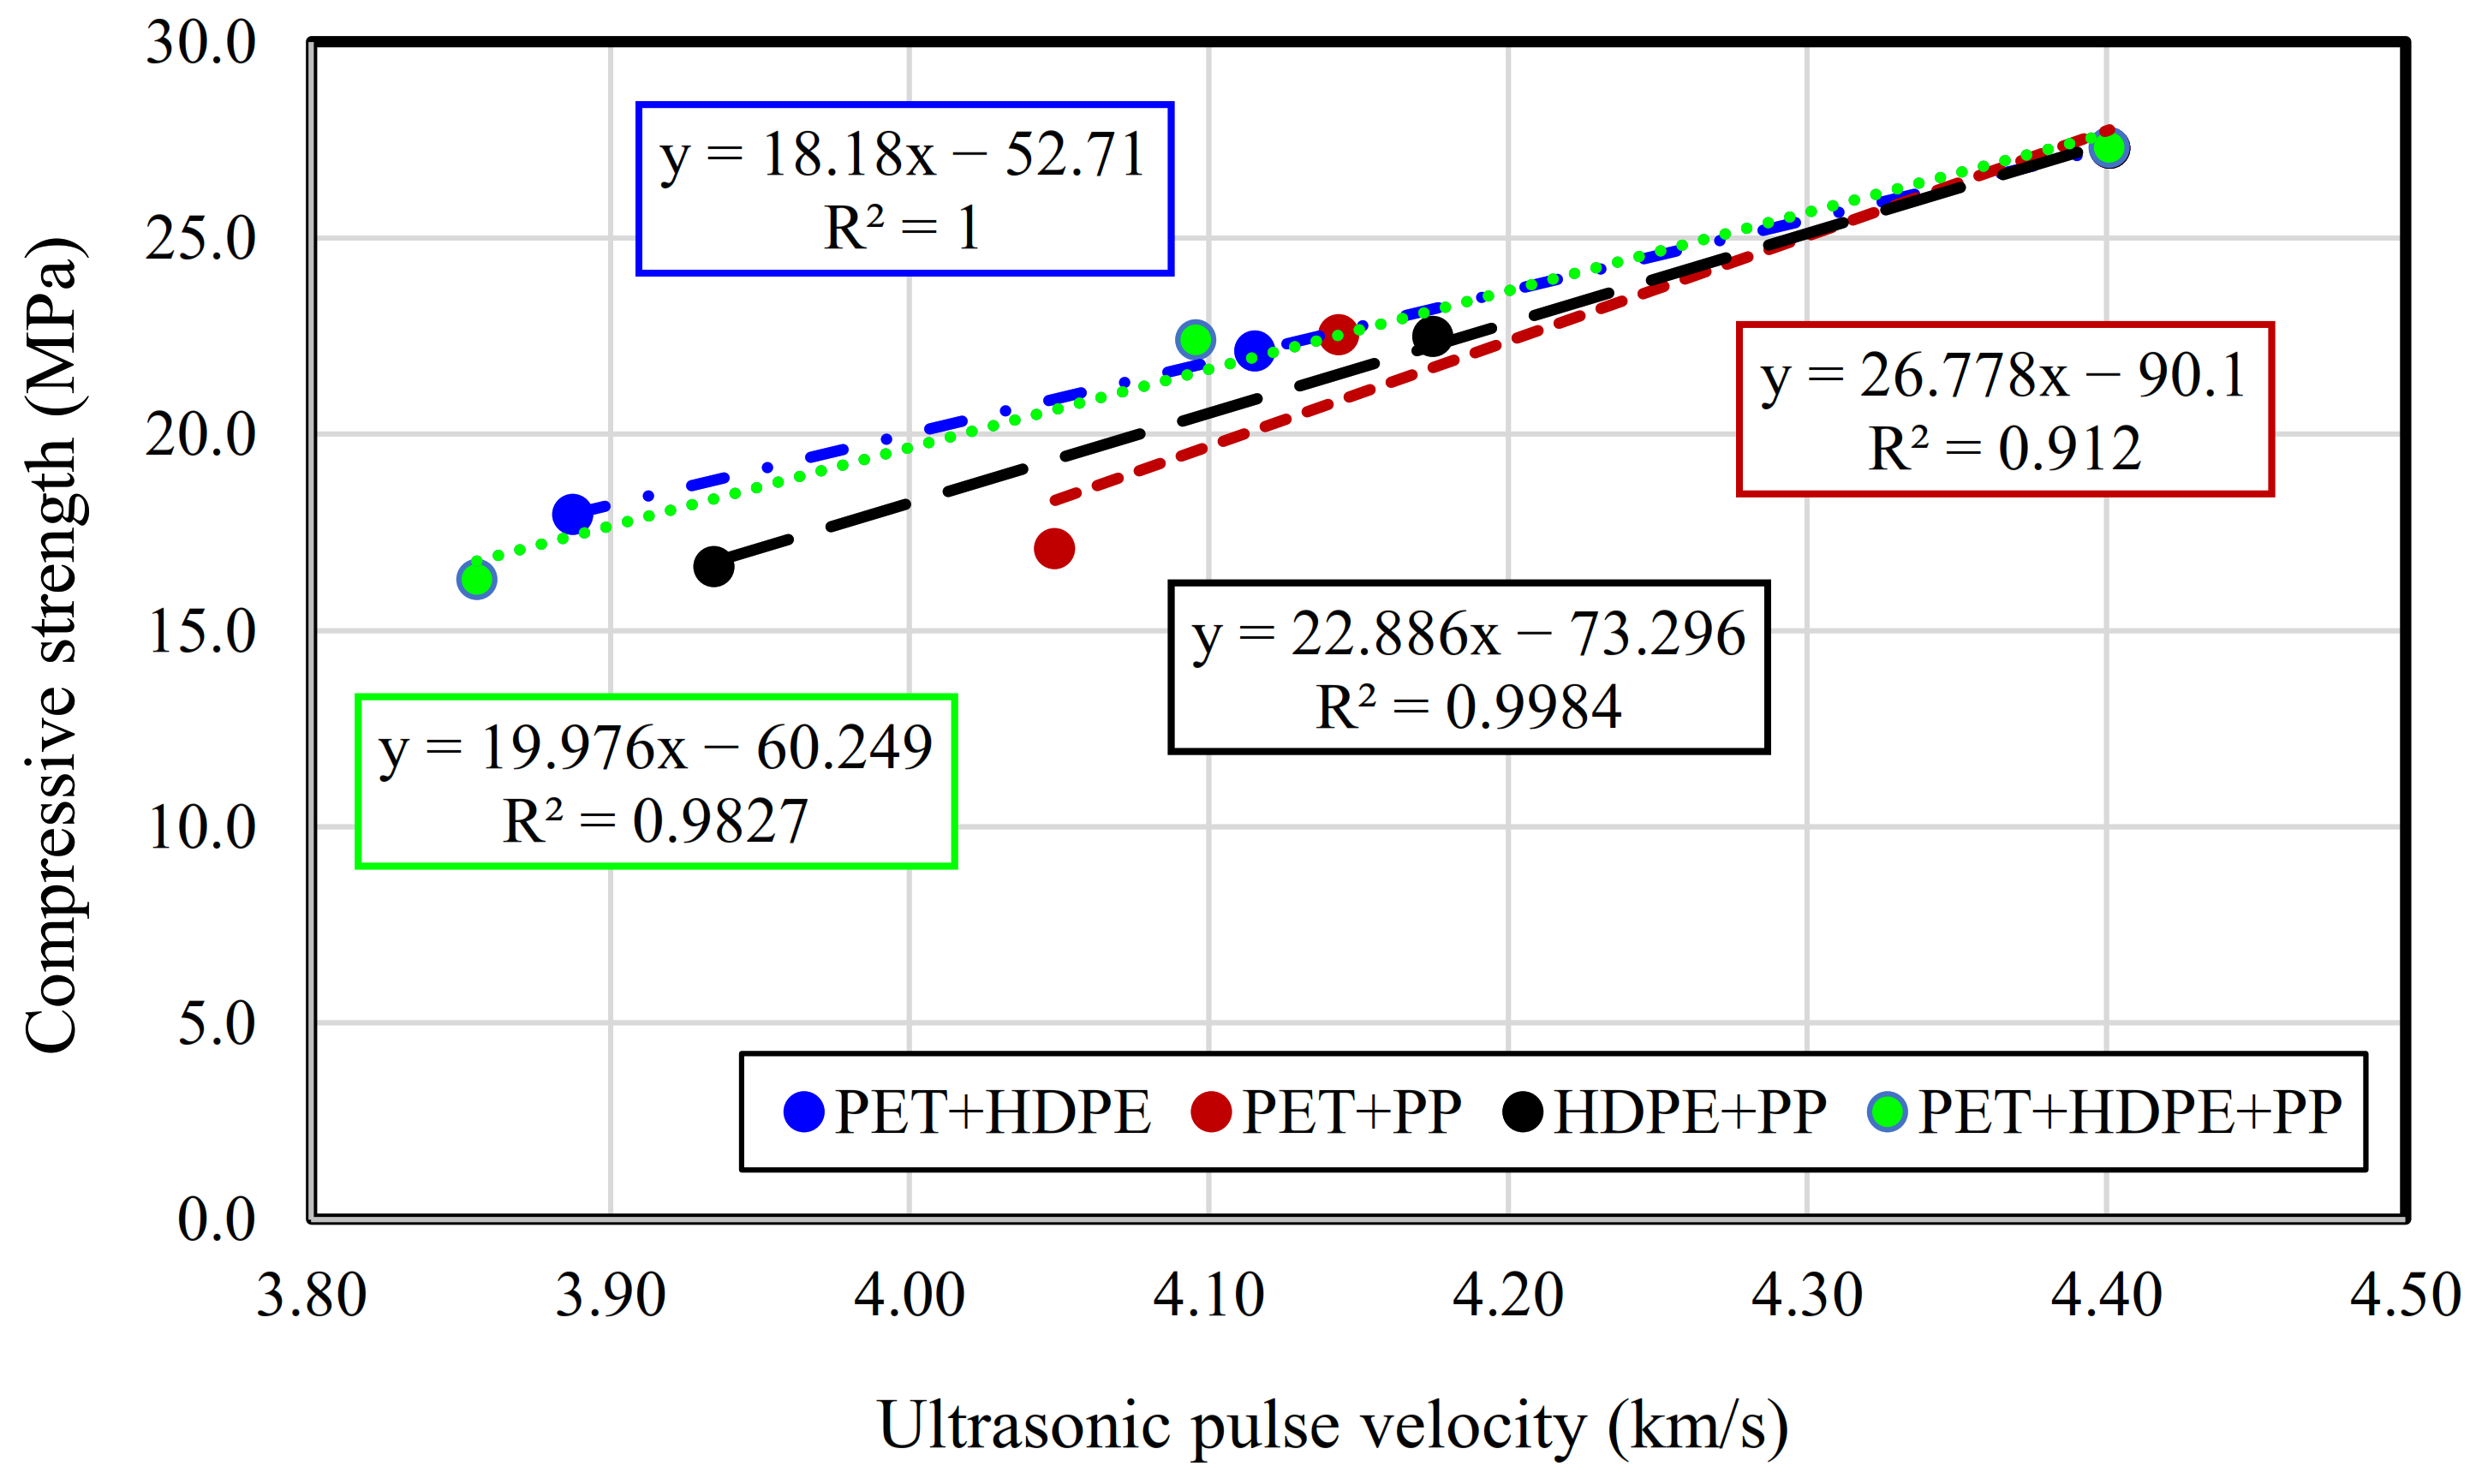
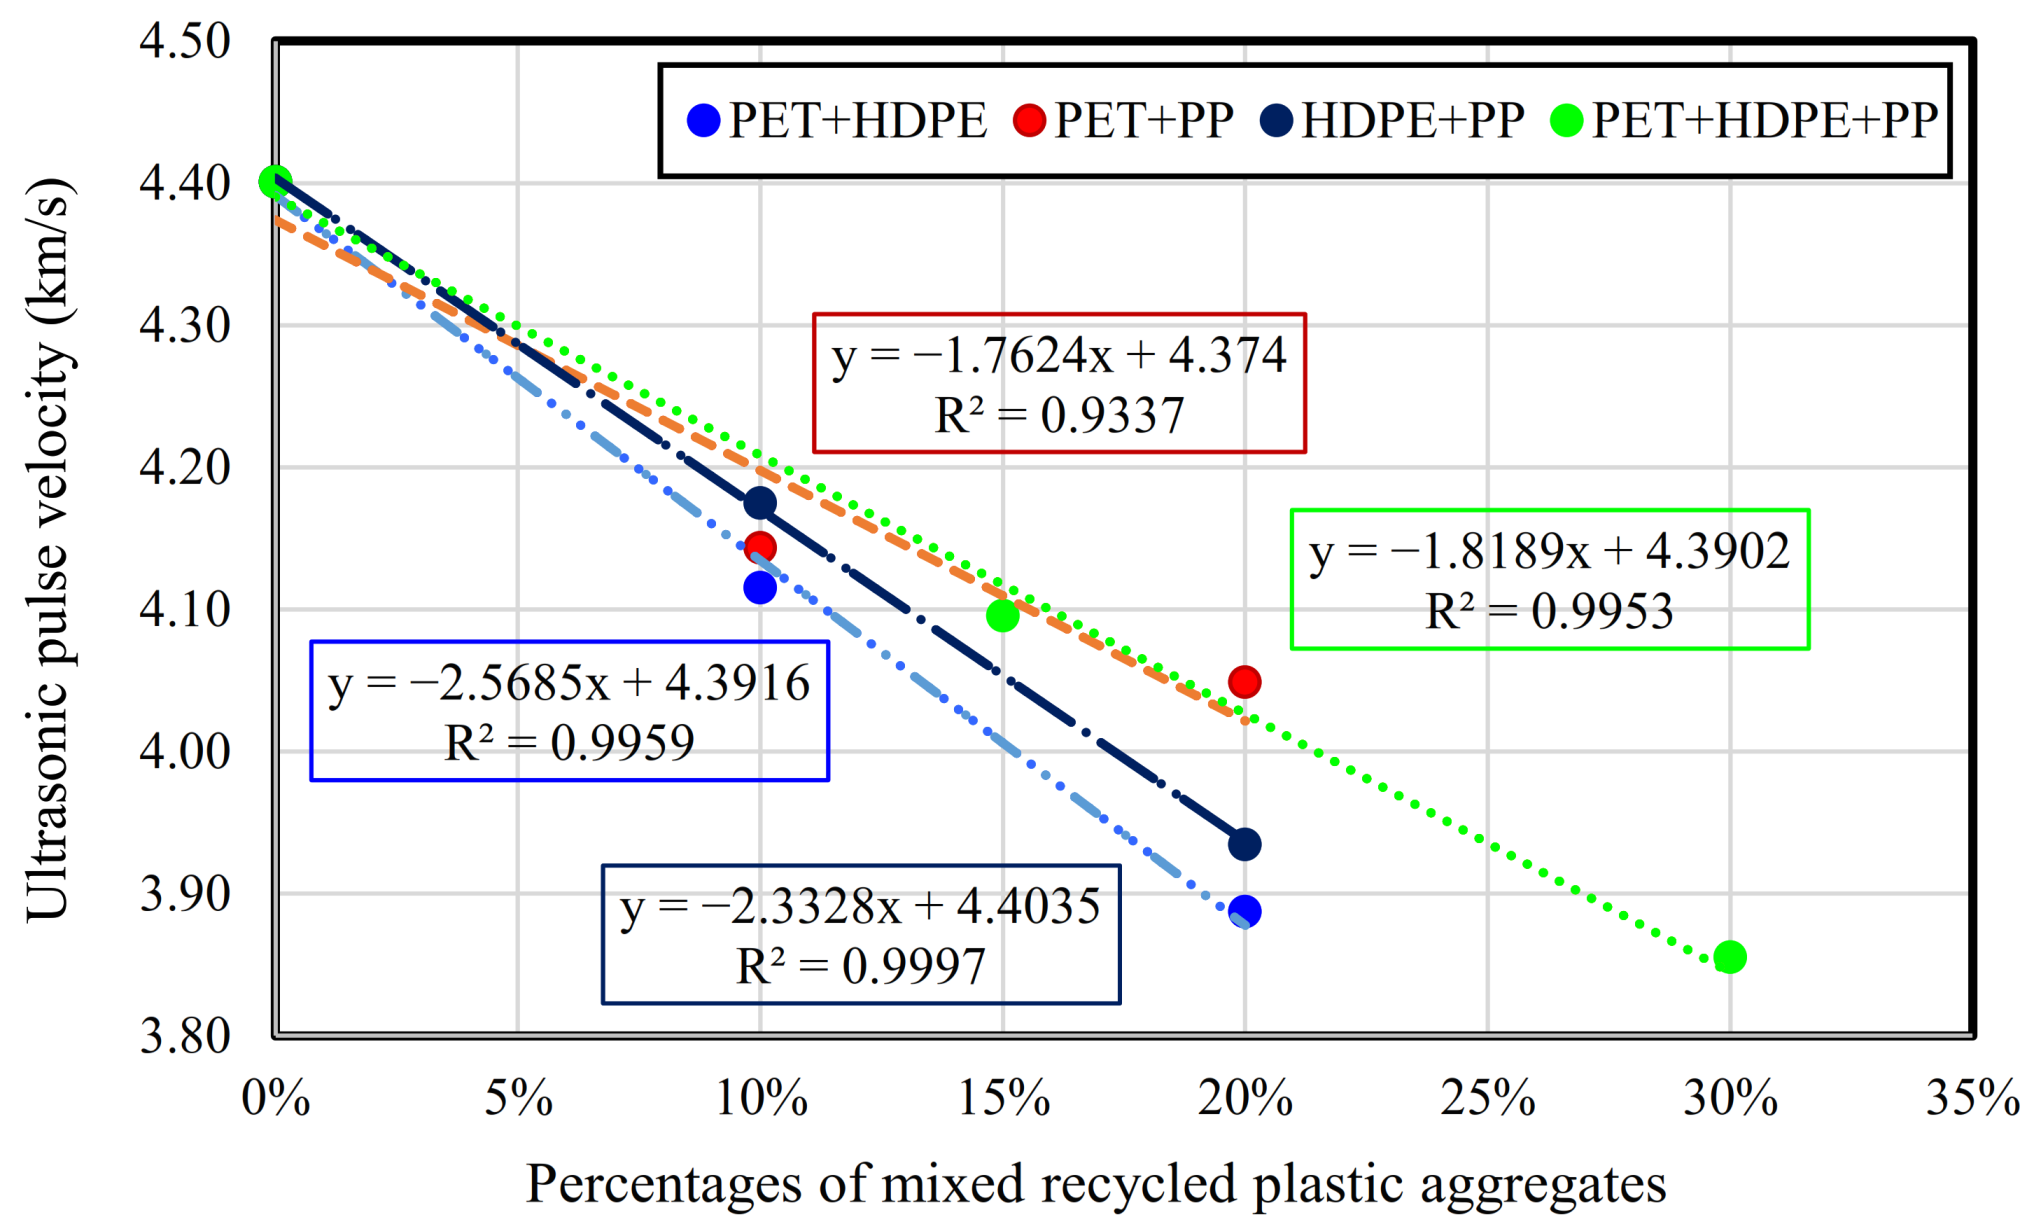
3.2.7. Ultrasonic Pulse Velocity (UPV)

Figure 24 presents the UPV results of all the mixes. It reveals that the UPV of the control concrete was higher than the concrete containing mixed plastic aggregates. This is consistent with previous studies which showed that further increase of PET contents decreased the velocity of the wave by disturbing the ultrasonic wave propagation [36]. Others reported that the lower density of plastic [37] and higher porosity [38] in concrete incorporating plastic were the reasons for the reduction of UPV. No significant difference was observed for mixes with two plastic type combinations and 10% replacement (R1, R3 and R5). Part of the differences may be due to the variations in the air content. Both HDPE and PP are polyolefin polymer types, but each had different physical and chemical properties. The ultrasonic waves transmitted differently in different materials according to their acoustic impedance. This confirmed that the UPV of MRPC was less than the UPV of conventional concrete. On the other hand, the presence of more than one type of plastics helped in attenuating the signal as it travelled in several media of different densities.
As a result of the increase in the replacement ratios, UPV of mix R7 was less than R1, R3 and R5 by 0.5%, 1.15% and 1.9%, respectively. R8 mix with three types and 30% replacement has the least UPV value. In the current study, the UPV is affected by more than one factor such as the variability of air content and heterogeneity of plastic materials. Figure 25 displays a linear relationship between compressive strength and UPV values. It shows that there is a strong correlation since the least R2 was 0.91. Furthermore, the relationship between the percentage of replacement and UPV is shown in Figure 26. It indicates a strong correlation for all mixes. No previous study was conducted on the UPV of MRPC.

4. Concluding Remarks

In an attempt to widen the knowledge on the effect of adding mixed types of recycled plastic waste as a partial replacement of coarse aggregate, a series of physical and mechanical tests were carried out. The following is a summary of the main findings:
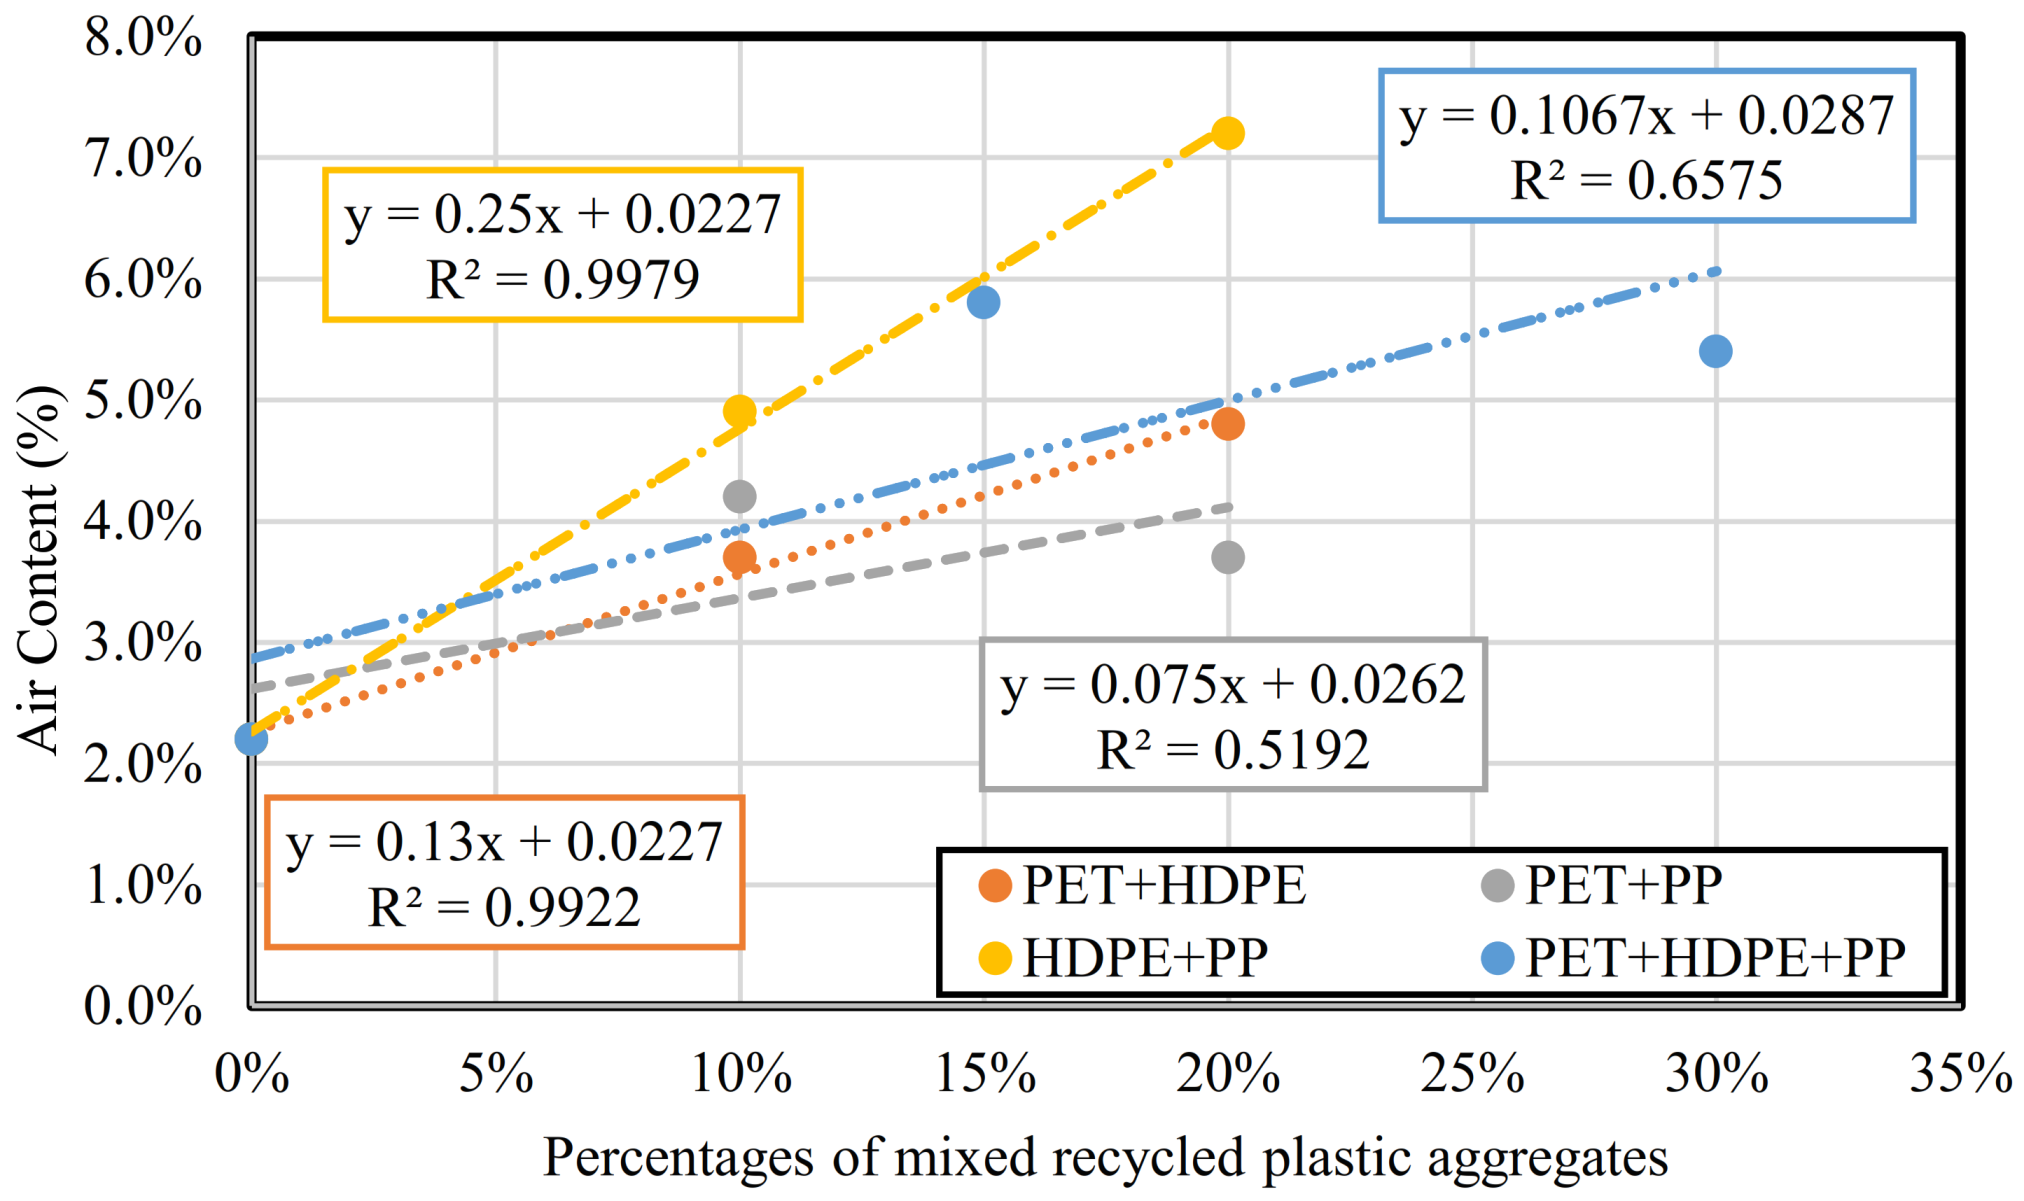
  • Mixed recycled plastic waste tends to reduce the workability of the concrete regardless of the replacement ratios. At a low replacement ratio, the use of different combinations of the three plastic types does not alter the result of workability. In addition, the fresh density decreased in all MRPC mixes as a result of the lower density of plastics. The air content increased with the increase of the plastic replacement ratios in most mixes and appeared to be related to the quality of the plastics.
  • The analysis of mechanical testing results clearly indicated that increasing the plastic replacement ratio, as a variable, is more influential than the types of plastics used in the mixes.
  • Improvement in failure behaviour is one of the encouraging characters of MRPC. MRPC had less brittle behaviour compared to the control mix. The results also showed that a 15% replacement ratio resulted in higher values of ductility compared to a 30% replacement ratio.
  • Carreira and Chu’s model is more accurate than Popovic’s model in predicting the stress-strain behaviour for concrete with mixed recycled plastic.
  • For further study, combinations of other types of recycled plastic should be investigated as the ultimate aim of the study is not to separate plastic wastes when mixing them into concrete, thus decreasing the cost and time of processing.
The findings of this research will provide guidance to the concrete industry concerning the potential implementation of unsorted mixed plastic as aggregates in the production of concrete for certain applications. Using mixed recycled plastic as a partial replacement of natural aggregate in concrete is a promising step towards a sustainable waste management process since it does not require detailed filtering for different types of plastic and decreases the volume of unsorted mixed plastic in the recycling plants.

Author Contributions

M.A.-S.: Data curation, Formal analysis, Investigation, Methodology, Validation, Writing—original draft. Y.Z.: Conceptualization, Methodology, Project administration, Supervision, Writing—review and editing. R.H.: Supervision, Writing—review and editing. M.E.: Methodology, Supervision, Writing—review and editing. M.M.R.: Supervision, Writing—review and editing. P.L.: Conceptualization, Supervision, Writing—review and editing. All authors have read and agreed to the published version of the manuscript.

Funding

This research received no external funding.

Institutional Review Board Statement

Not applicable.

Informed Consent Statement

Not applicable.

Data Availability Statement

The data presented in this study are available on request from the corresponding author. The data are not publicly available due to university data management policy.

Acknowledgments

The authors would like to acknowledge the University of South Australia for providing laboratory support, the City of Salisbury for support and RPA Recycling Plastics Australia PTY LTD for plastics supply. The authors also acknowledge the contributions of Nobuyuki Kawashima and Honours’ student Gabriel McKenna-Lieschke who assisted in the experimental work reported in this paper. Thanks are also due to Adelaide Brighton Cement Pty. Ltd. for supplying cement and Master Builders Solutions (BASF) for providing superplasticizer.

Conflicts of Interest

The authors declare no conflict of interest.

Abbreviations

ρThe density of concrete
fcmiIn situ compressive strength
βA material parameter that depends on the shape of the curve
EitThe initial tangential modulus
εStrain of concrete caused by the axial stress
ε0Concrete strain at the ultimate stress is calculated according to Equations (3) and (7) to correspond with the current experimental results

References

  1. O’Farrell, K. 2018–19 Australian Plastics Recycling Survey. March 2020. Available online: https://www.environment.gov.au/protection/waste/publications/australian-plastics-recycling-survey-report-2018-19 (accessed on 2 December 2020).
  2. Meza, A.; Pujadas, P.; Meza, L.M.; Pardo-Bosch, F.; López-Carreño, R.D. Mechanical Optimization of Concrete with Recycled PET Fibres Based on a Statistical-Experimental Study. Materials 2021, 14, 240. [Google Scholar] [CrossRef] [PubMed]
  3. Nematzadeh, M.; Shahmansouri, A.A.; Fakoor, M. Post-fire compressive strength of recycled PET aggregate concrete reinforced with steel fibers: Optimization and prediction via RSM and GEP. Constr. Build. Mater. 2020, 252, 119057. [Google Scholar] [CrossRef]
  4. Jacob-Vaillancourt, C.; Sorelli, L. Characterization of concrete composites with recycled plastic aggregates from post-consumer material streams. Constr. Build. Mater. 2018, 182, 561–572. [Google Scholar] [CrossRef]
  5. Colangelo, F.; Farina, I. Lightweight concrete with polyolefins as aggregates. In Use of Recycled Plastics in Eco-Efficient Concrete, 1st ed.; Pacheco-Torgal, F., Khatib, J., Colangelo, F., Tuladhar, R., Eds.; Elsevier: Amsterdam, The Netherlands, 2019; pp. 167–187. [Google Scholar]
  6. Elzafraney, M.; Soroushian, P.; Deru, M. Development of energy-efficient concrete buildings using recycled plastic aggregates. J. Archit. Eng. 2005, 11, 122–130. [Google Scholar] [CrossRef]
  7. Mohammadinia, A.; Wong, Y.C.; Arulrajah, A.; Horpibulsuk, S. Strength evaluation of utilizing recycled plastic waste and recycled crushed glass in concrete footpaths. Constr. Build. Mater. 2019, 197, 489–496. [Google Scholar] [CrossRef]
  8. Li, D.; Kaewunruen, S. Mechanical properties of concrete with recycled composite and plastic aggregates. Int. J. GEOMATE 2019, 17, 231–238. [Google Scholar] [CrossRef]
  9. Standards Australia. General Purpose and Blended Cements, AS 3972; Standards Australia Limited: Sydney, Australia, 2010. [Google Scholar]
  10. Standards Australia. Methods for Sampling and Testing Aggregates–Particle Density and Water Absorption of Coarse Aggregate–Weighing-in-Water Method, AS1141.6.1; Standards Australia Limited: Sydney, Australia, 2000. [Google Scholar]
  11. Standards Australia. Particle Density and Water Absorption of Fine Aggregate, AS 1141.5; Standards Australia Limited: Sydney, Australia, 2000. [Google Scholar]
  12. ASTM D792. Standard Test Methods for Density and Specific Gravity (Relative Density) of Plastics by Displacement; ASTM International: West Conshohocken, PA, USA, 2013. [Google Scholar]
  13. Standards Australia. Methods for Sampling and Testing Aggregates, Method 11.1: Particle Size Distribution–Sieving Method, AS 1141.11.1; Standards Australia Limited: Sydney, Australia, 2009. [Google Scholar]
  14. Standards Australia. Methods of Testing Concrete, Preparation of Concrete Mixes in the Laboratory AS 1012.2; Standards Australia Limited: Sydney, Australia, 2014. [Google Scholar]
  15. Standards Australia. Methods of Testing Concrete, Method for Making and Curing Concrete—Compression and Indirect Tensile Test Specimens, AS 1012.8.1; Standards Australia Limited: Sydney, Australia, 2014. [Google Scholar]
  16. Standards Australia. Methods of Testing Concrete, Determination of Properties Related to the Consistency of Concrete—Slump Test, AS 1012.3.1; Standards Australia Limited: Sydney, Australia, 2014. [Google Scholar]
  17. Standards Australia. Methods of Testing Concrete, Method 4.2: Determination of Air Content of Freshly Mixed Concrete—Measuring Reduction in Air Pressure in Chamber Above Concrete, AS 1012.4.2; Standards Australia Limited: Sydney, Australia, 2014. [Google Scholar]
  18. Australian Standard. Methods of Testing Concrete, Determination of Mass per Unit Volume of Hardned Concrete, As 1012.12.1; Standards Australia Limited: Sydney, Australia, 1998. [Google Scholar]
  19. Standards Australia. Methods of Testing Concrete, Method 9: Compressive Strength Tests—Concrete, Mortar and Grout Specimens, AS 1012.9; Standards Australia Limited: Sydney, Australia, 2014. [Google Scholar]
  20. Standards Australia. Methods of Testing Concrete—Determination of Indirect Tensile Strength of Concrete Cylinders (Brasil or Splitting Test), AS 1012.10; Standards Australia Limited: Sydney, Australia, 2000. [Google Scholar]
  21. Standards Australia. Methods of Testing Concrete, Method 11: Determination of the Modulus of Rupture, AS 1012.11; Standards Australia Limited: Sydney, Australia, 2000. [Google Scholar]
  22. Standards Australia. Methods of Testing Concrete—Determination of the Static Chord Modulus of Elasticity and Poisson’s Ratio of Concrete Specimens, AS 1012.17; Standards Australia Limited: Sydney, Australia, 1997. [Google Scholar]
  23. ASTM C597. Standard Test Method for Pulse Velocity through Concrete; ASTM International: West Conshohocken, PA, USA, 2016. [Google Scholar]
  24. Haghighatnejad, N.; Mousavi, S.Y.; Khaleghi, S.J.; Tabarsa, A.; Yousefi, S. Properties of recycled PVC aggregate concrete under different curing conditions. Constr. Build. Mater. 2016, 126, 943–950. [Google Scholar] [CrossRef]
  25. Omnexus. Flexural Modulus (Stiffness) of Plastic. Available online: https://omnexus.specialchem.com/polymer-properties/properties/stiffness (accessed on 2 December 2020).
  26. Mohammed, A.A.; Mohammed, I.I.; Mohammed, S.A. Some properties of concrete with plastic aggregate derived from shredded PVC sheets. Constr. Build. Mater. 2019, 201, 232–245. [Google Scholar] [CrossRef]
  27. Standards Australia. Concrete Structures, AS 3600; Standards Australia Limited: Sydney, Australia, 2018. [Google Scholar]
  28. Petrie, E.M. Adhesive Bonding of Polyolefin. Polyurethane 2013, 38, 85. [Google Scholar]
  29. Polifka, W. Conventional and LSE Bonding Solutions for TPO Materials; ASI-Adhesives and Sealants Industry: Troy, MI, USA, 2012; Available online: https://www.adhesivesmag.com/articles/91151-conventional-and-lse-bonding-solutions-for-tpo-materials (accessed on 2 December 2020).
  30. Saikia, N.; Brito, J.D. Waste polyethylene terephthalate as an aggregate in concrete. Mater. Res. 2013, 16, 341–350. [Google Scholar] [CrossRef] [Green Version]
  31. Abu-Saleem, M.; Zhuge, Y.; Hassanli, R.; Ellis, M.; Rahman, M.; Levett, P. Evaluation of concrete performance with different types of recycled plastic waste for kerb application. Constr. Build. Mater. 2021, 293, 123477. [Google Scholar] [CrossRef]
  32. Kumar, K.S.; Baskar, K. Recycling of E-plastic waste as a construction material in developing countries. J. Mater. Cycles Waste Manag. 2015, 17, 718–724. [Google Scholar] [CrossRef]
  33. Youssf, O.; Hassanli, R.; Mills, J. Mechanical performance of FRP-confined and unconfined crumb rubber concrete containing high rubber content. J. Build. Eng. 2017, 11, 115–126. [Google Scholar] [CrossRef]
  34. Popovics, S. A numerical approach to the complete stress-strain curve of concrete. Cem. Concr. Res. 1973, 3, 583–599. [Google Scholar] [CrossRef]
  35. Carreira, D.J.; Chu, K.-H. Stress-strain relationship for plain concrete in compression. ACI J. Proc. 1985, 82, 797–804. [Google Scholar]
  36. Marzouk, O.Y.; Dheilly, R.; Queneudec, M. Valorization of post-consumer waste plastic in cementitious concrete composites. Waste Manag. 2007, 27, 310–318. [Google Scholar] [CrossRef] [PubMed]
  37. Akçaözoğlu, S.; Akçaözoğlu, K.; Atis, C. Thermal conductivity, compressive strength and ultrasonic wave velocity of cementitious composite containing waste PET lightweight aggregate (WPLA). Compos. Part B Eng. 2013, 45, 721–726. [Google Scholar] [CrossRef]
  38. Rahmani, E.; Dehestani, M.; Beygi, M.H.A.; Allahyari, H.; Nikbin, I.M. On the mechanical properties of concrete containing waste PET particles. Constr. Build. Mater. 2013, 47, 1302–1308. [Google Scholar] [CrossRef]
Figure 1. Three types of plastic shredded plastic waste aggregates.
Jcs 05 00146 g001
Figure 2. Particle size distribution of natural and plastic aggregates.
Jcs 05 00146 g002
Figure 3. (a) Baldwin compression machine; (b) Stress-strain curve testing set-up.
Jcs 05 00146 g003
Figure 4. Variation of fresh density with mixed recycled replacement percentages.
Jcs 05 00146 g004
Figure 5. Scanning electron microscope image of plastic surface.
Jcs 05 00146 g005
Figure 6. Variation of air content with mixed plastic replacement percentages.
Jcs 05 00146 g006
Figure 8. The relationship between the compressive and indirect tensile strengths.
Jcs 05 00146 g008
Figure 9. The relationship between the compressive and flexural strengths.
Jcs 05 00146 g009
Figure 10. The relationship between the compressive strength and modulus of elasticity.
Jcs 05 00146 g010
Figure 11. The relationship between the compressive and the predicted indirect tensile strengths.
Jcs 05 00146 g011
Figure 12. The relationship between the compressive and the predicted flexural strengths.
Jcs 05 00146 g012
Figure 13. The relationship between the compressive and the predicted modulus of elasticity.
Jcs 05 00146 g013
Figure 14. Stress-strain relationship of control specimens.
Jcs 05 00146 g014
Figure 15. Stress-strain relationship of R7 specimens.
Jcs 05 00146 g015
Figure 16. Stress-strain relationship of R8 specimens.
Jcs 05 00146 g016
Figure 17. Comparison of the average stress-strain curves.
Jcs 05 00146 g017
Figure 18. The calculated toughness area under stress-strain curve.
Jcs 05 00146 g018
Figure 19. Toughness and ductility values for the control, R7 and R8 mixes.
Jcs 05 00146 g019
Figure 20. Comparison of measured axial strain ( ε c )   at peak stress with model predictions ( ε e ) .
Jcs 05 00146 g020
Figure 21. Comparison of stress-strain curves of control mix with existing constitutive models.
Jcs 05 00146 g021
Figure 22. Comparison of stress-strain curves of R7 mix with existing constitutive models.
Jcs 05 00146 g022
Figure 23. Comparison of stress-strain curves of R8 mix with existing constitutive models.
Jcs 05 00146 g023
Figure 24. Variation of ultrasonic pulse velocity with different combinations of recycled plastic aggregates.
Jcs 05 00146 g024
Figure 25. The relationship between the compressive strength and UPV.
Jcs 05 00146 g025
Figure 26. The relationship between the percentage of replacement and UPV.
Jcs 05 00146 g026
Figure 7. Compressive strength of concrete mixes.
Jcs 05 00146 g007
Table 1. Mix proportions for cement mixes.
MixMix IDRc (%) 1Mix Quantities (kg/m3)
CementWaterFineCoarsePlasticSP 2
PETHDPEPP
ControlControl-320.2241.5886.3858.5---1.8
PET5% + HDPE5%R110320.2241.5886.3772.6519.3415.1-1.8
PET10% + HDPE10%R220320.2241.5886.3686.838.6830.19-1.8
PET5% + PP5%R310320.2241.5886.3772.6519.34-14.311.8
PET10% + PP10%R420320.2241.5886.3686.838.68-28.611.8
HDPE5% + PP5%R510320.2241.5886.3772.65-15.114.311.8
HDPE10% + PP10%R620320.2241.5886.3686.8-30.1928.611.8
PET5% + HDPE5% + PP5%R715320.2241.5886.3729.7319.3415.114.311.8
PET10% + HDPE10% + PP10%R830320.2241.5886.3600.9538.6830.1928.611.8
1 Rc: Percentage of coarse aggregate replaced by mixed plastic (by volume). 2 SP: Superplasticizer.
Table 2. Physical properties of fresh concrete and hardened density at 28 days.
Mix IDSlump (mm)Fresh Density (kg/m3)Hardened Density
(kg/m3)
Air Content
(%)
Control1172306.52292.22.2%
R11312237.32240.23.7%
R21002161.82117.04.8%
R31352229.52228.34.2%
R41072195.72185.93.7%
R51282199.72237.64.9%
R61212105.32144.87.2%
R71192175.32257.05.8%
R8862101.72108.05.4%
Table 3. Compressive strength test results.
Mix IDCompressive Strength
3 Days7 Days14 Days28 Days
MPaSDMPaSDMPaSDMPaSD
Control16.60.7521.90.7926.10.4927.31.07
R113.51.3219.00.4621.20.6522.11.37
R212.50.4516.10.5217.40.9218.00.81
R314.60.6918.21.1720.70.4922.60.55
R411.20.3014.50.2816.40.6817.10.33
R514.50.5617.61.5021.30.4622.50.68
R611.61.0014.70.1916.60.6216.60.18
R713.90.4217.21.7020.11.2022.40.37
R811.50.4914.70.1415.31.3116.30.18
SD: Standard deviation.
Table 4. Experimental and predicted values of indirect tensile and flexural strengths and modulus of elasticity.
Mix IDIndirect Tensile Strength (MPa)Flexural Strength (MPa)Modulus of Elasticity (GPa)
ExperimentalAS 3600ExperimentalAS 3600ExperimentalAS 3600
MPaSDMPaSDGPaSD
Control2.740.121.883.710.213.1327.200.8324.7
R12.390.041.693.080.212.8224.100.6521.4
R21.990.111.532.900.202.5419.910.6817.8
R32.630.141.713.000.272.8524.650.6021.5
R42.260.081.492.550.232.4819.551.2618.2
R52.310.061.713.260.222.8523.160.5021.6
R61.970.051.472.810.112.4519.180.5917.4
R72.280.091.703.170.222.8422.550.9521.8
R81.700.171.452.570.222.4216.961.6716.8
SD: Standard deviation.
Publisher’s Note: MDPI stays neutral with regard to jurisdictional claims in published maps and institutional affiliations.

