Development of Scaffolds with Adjusted Stiffness for Mimicking Disease-Related Alterations of Liver Rigidity

 , and
, and
Abstract
:1. Introduction
2. Materials and Methods
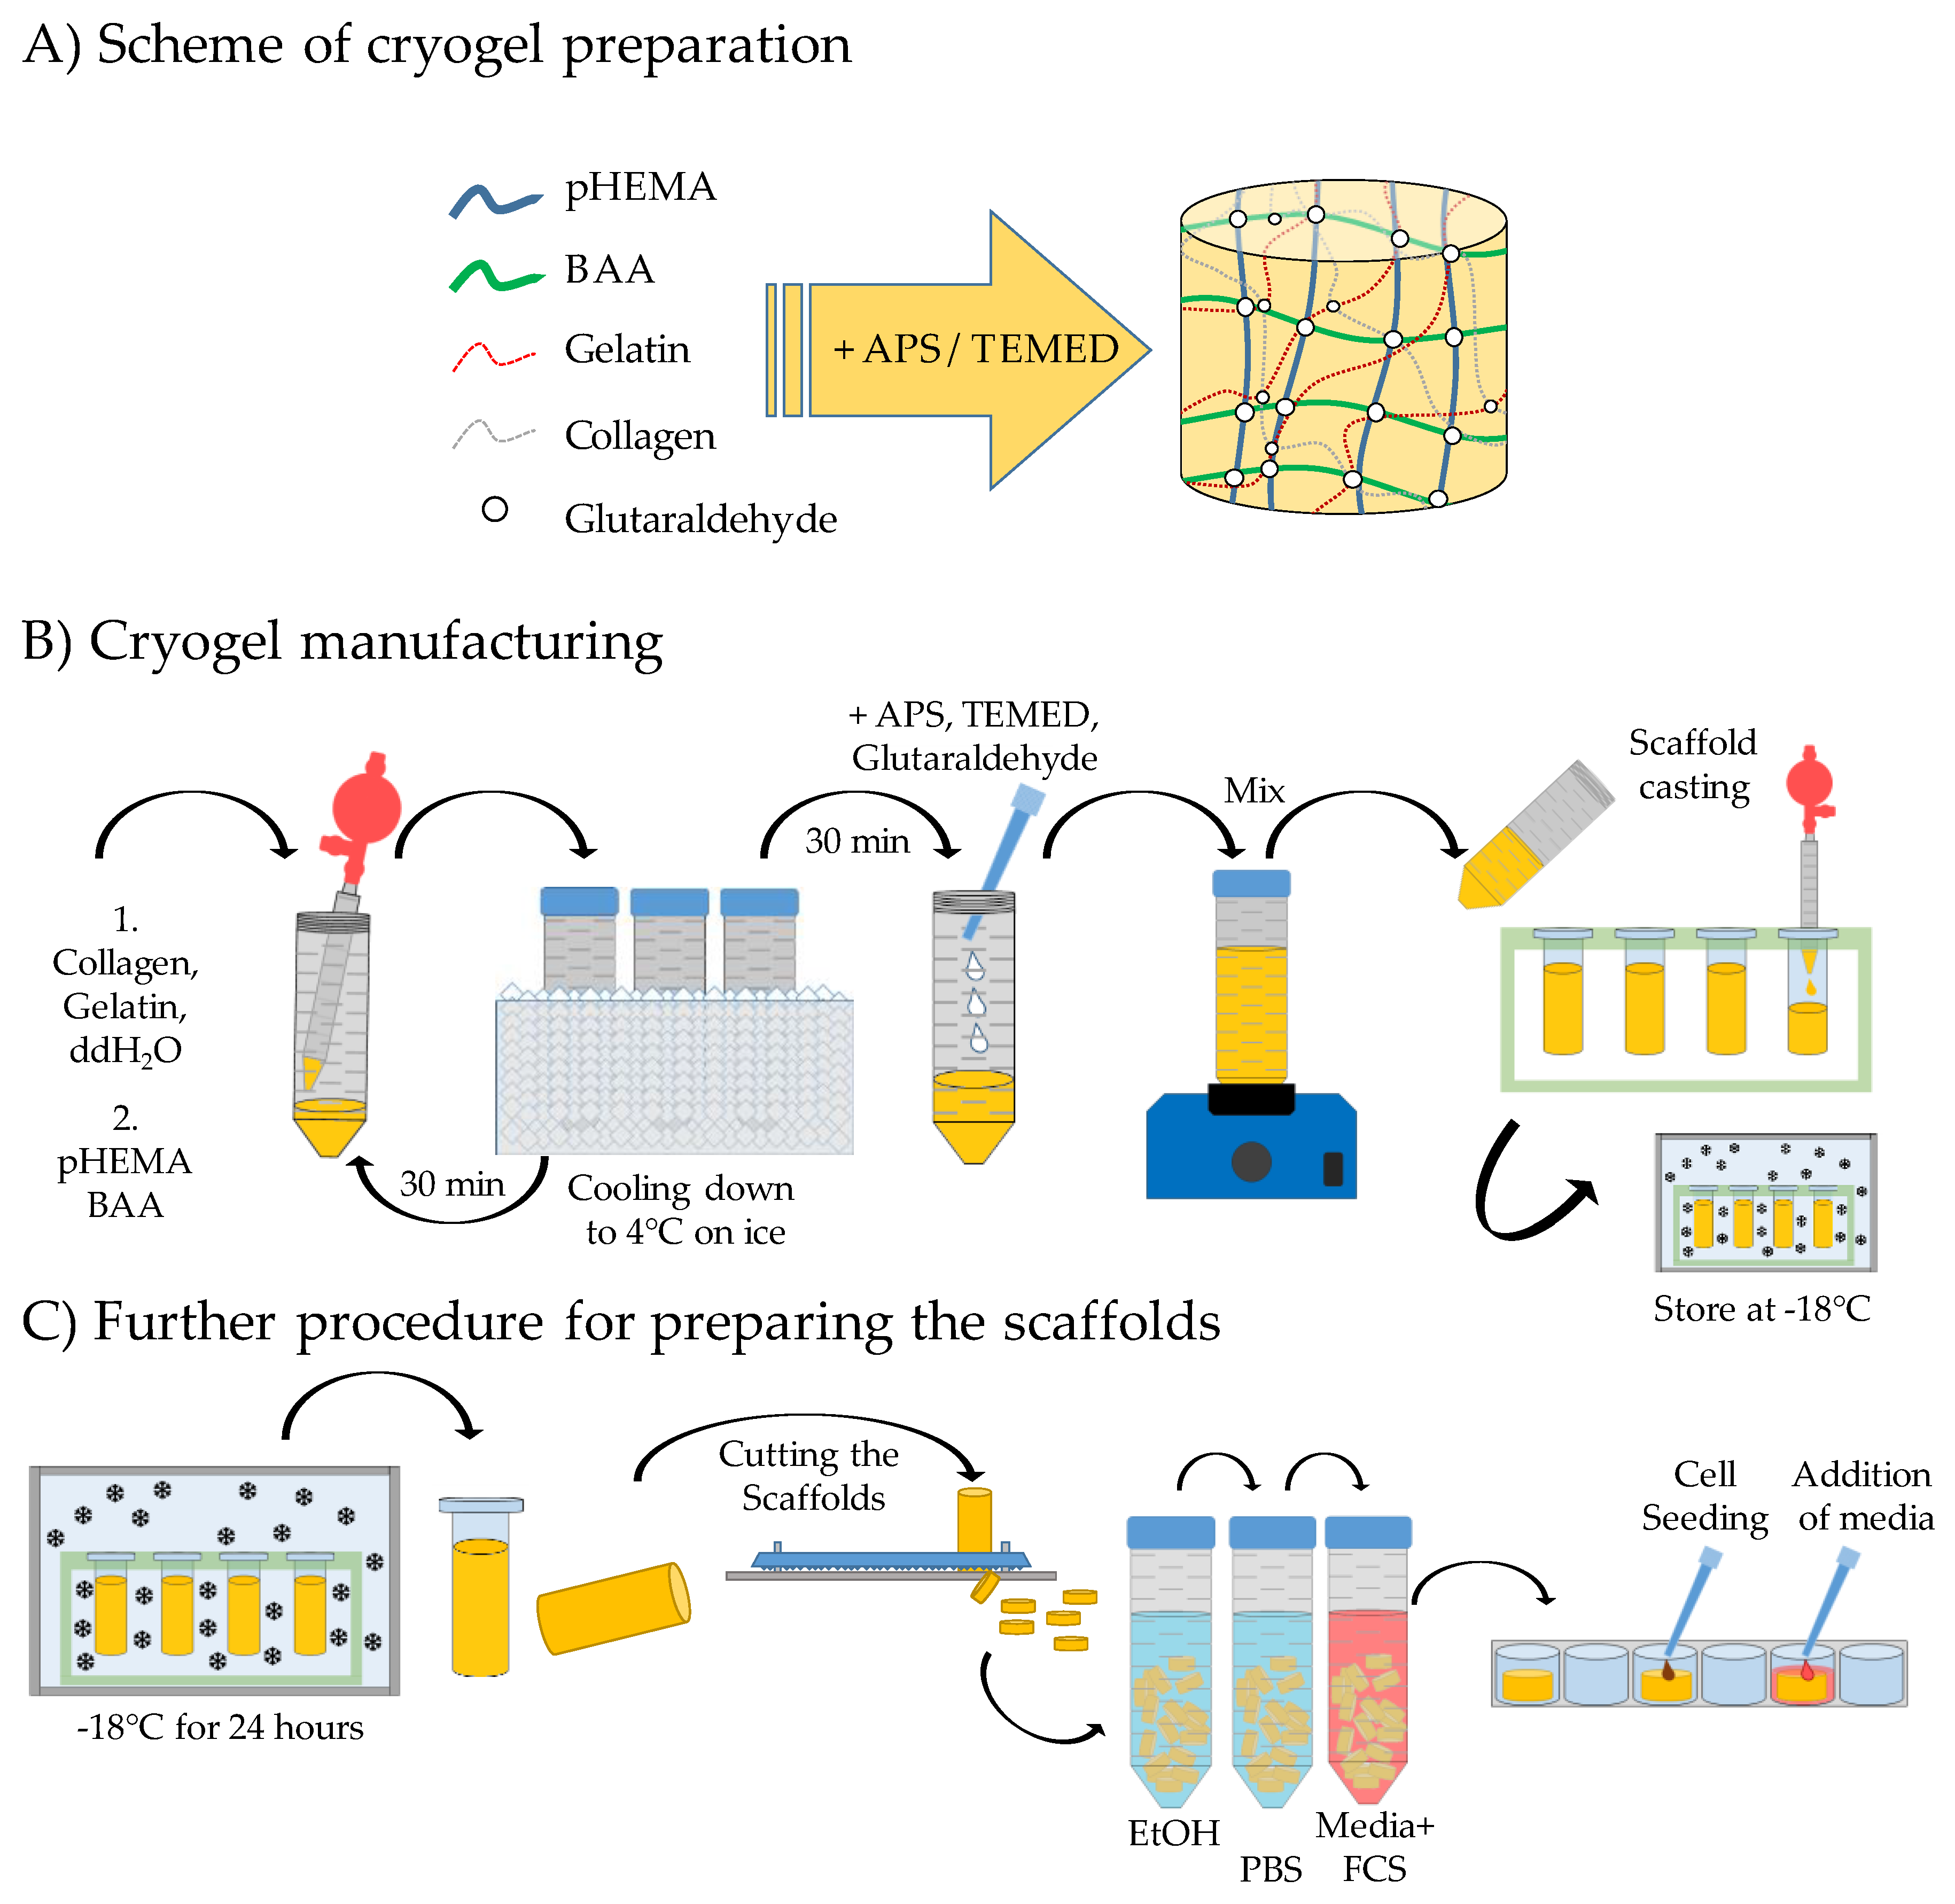
2.1. Production of the Different pHEMA Based Scaffolds
2.2. Scaffold Characterization
2.2.1. Pore Size
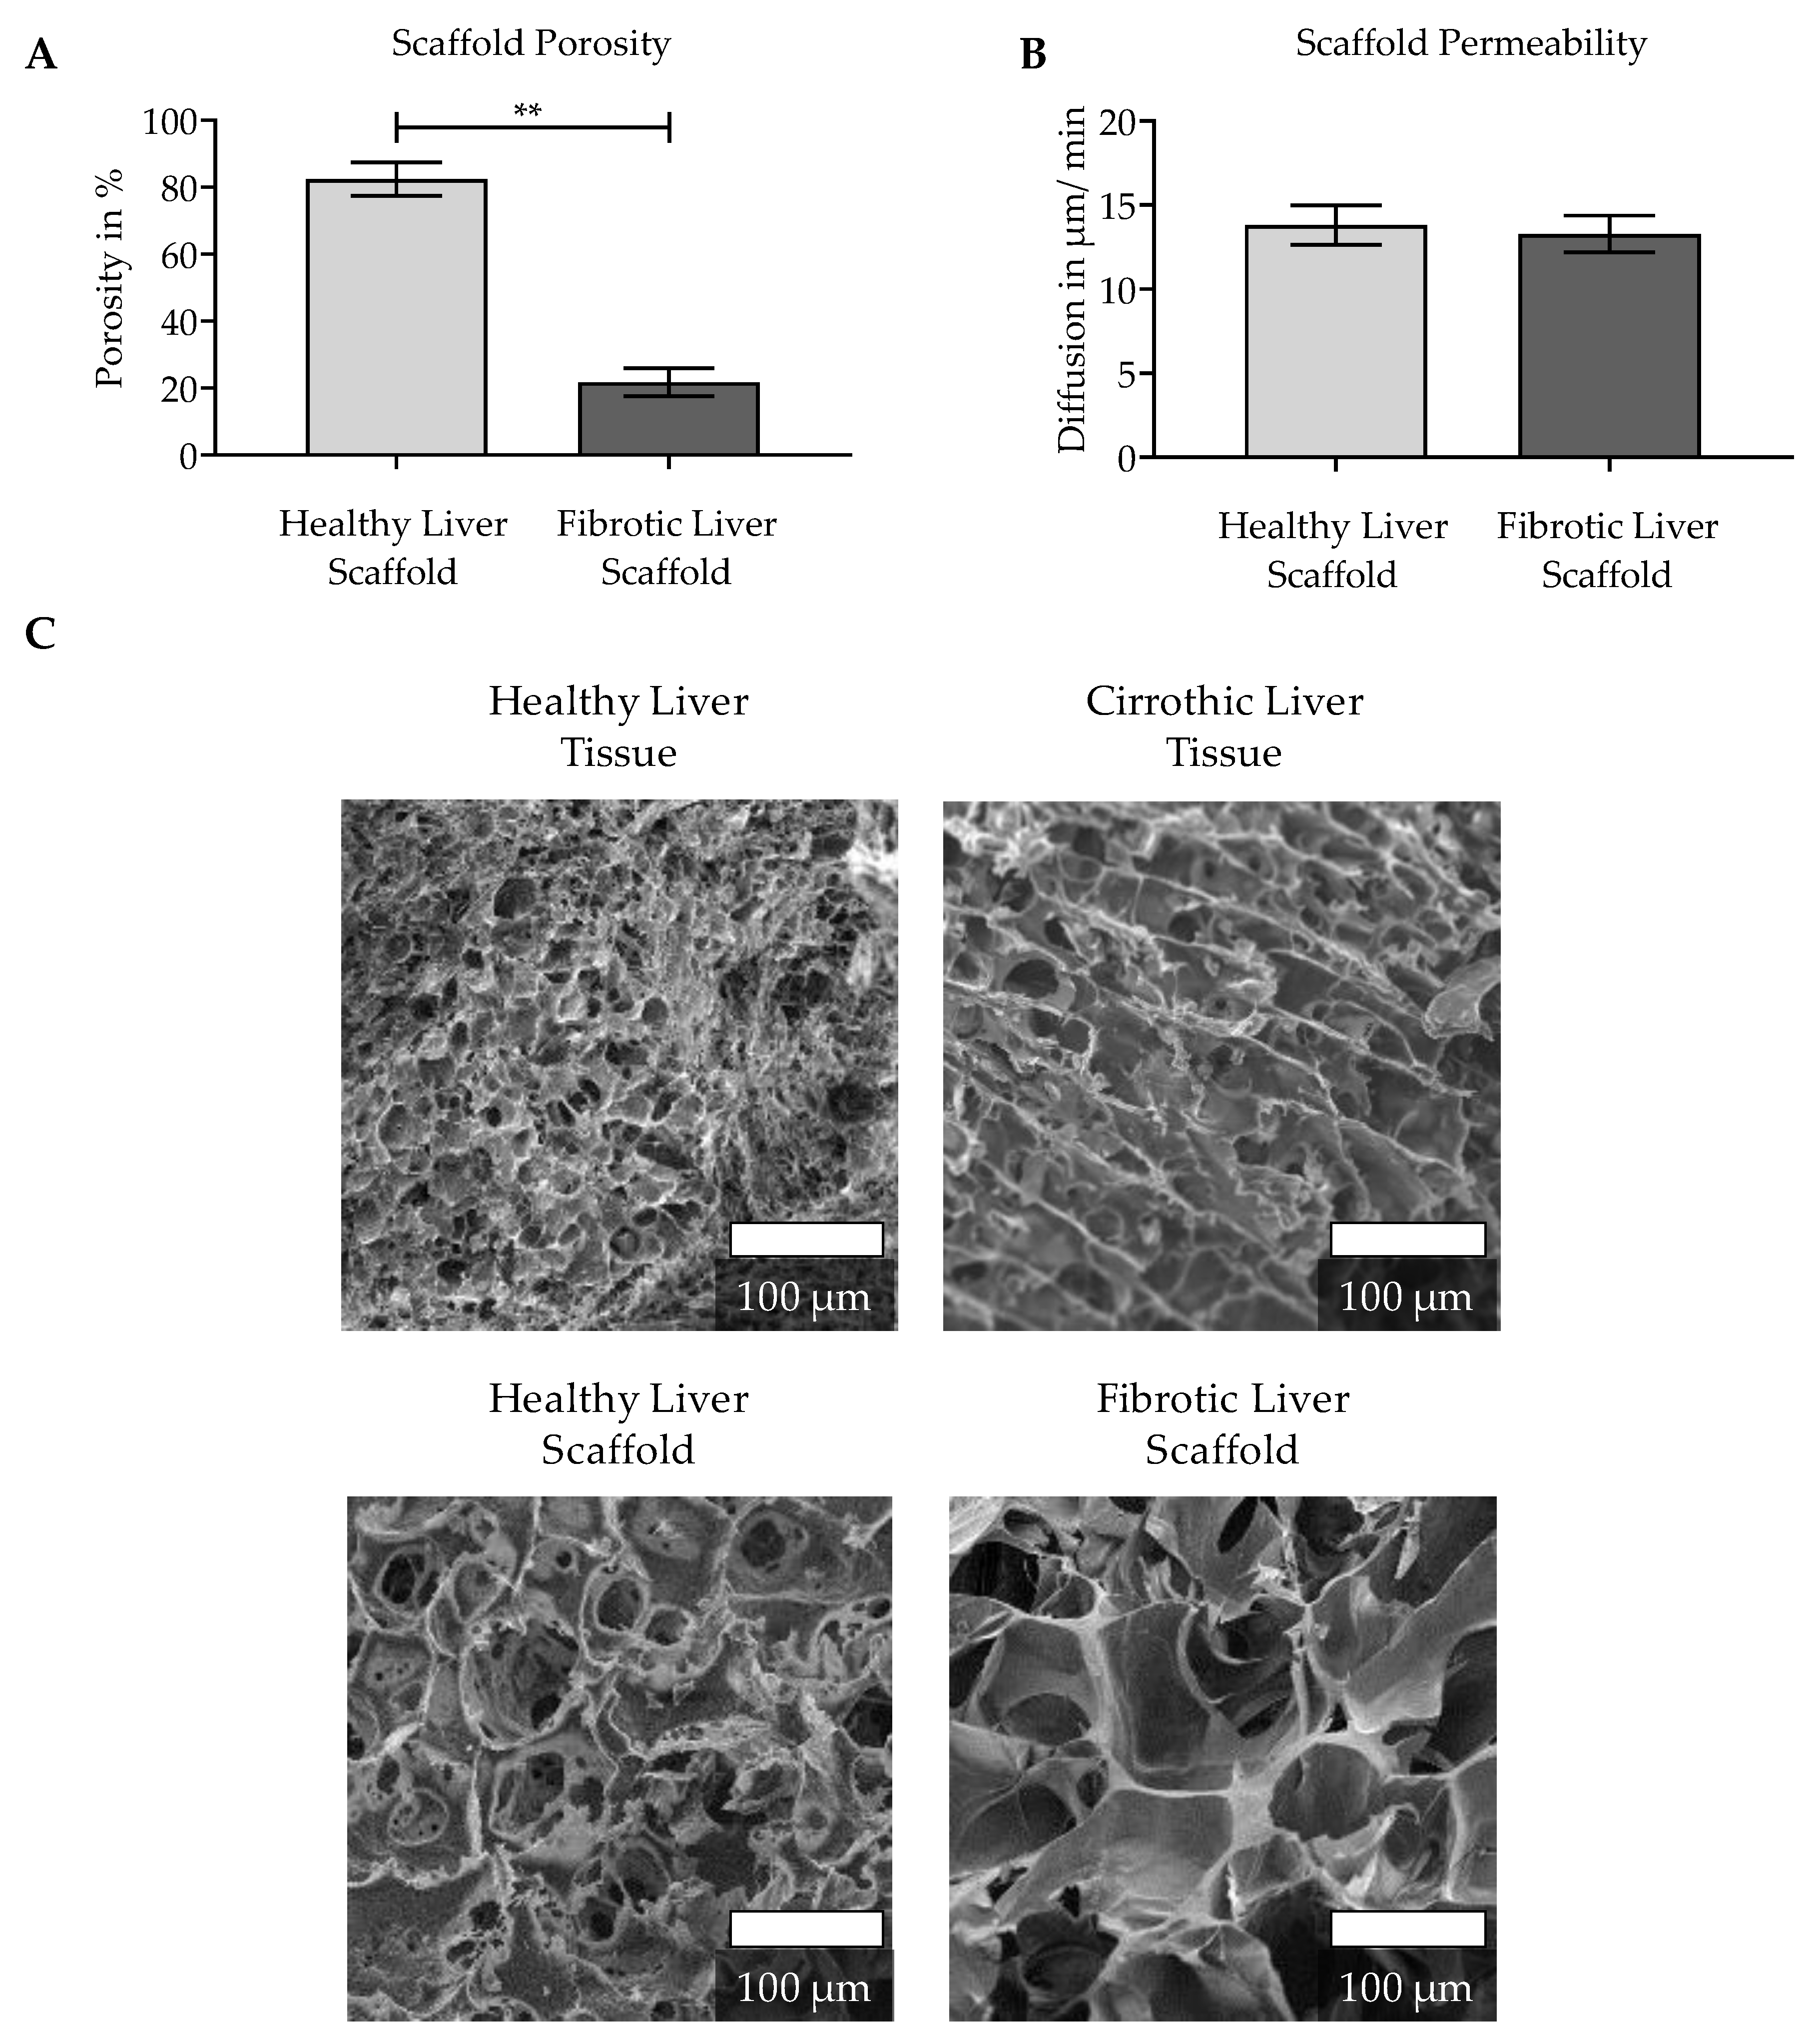
2.2.2. Porosity
2.2.3. Scaffold Permeability
2.2.4. Water Uptake Rate and Swelling Ratio
2.2.5. Matrix Stiffness
2.3. Scanning Electron Microscope (SEM) Images
2.3.1. Sample Preparation for the SEM Images
2.3.2. Preparation of the SEM Images
2.4. Culture of HepG2 Cells and Seeding of the Cells on the Scaffold
2.5. Measurement of Mitochondrial Activity with Resazurin
2.6. Staining of the Cells with Calcein-AM and Hoechst
2.7. Effect of Scaffold Pre-Incubation
2.7.1. Increasing Cell Attachment by Pre-Incubation of Scaffolds
2.7.2. Length of Pre-incubation of Scaffolds with Culture Medium
2.8. Metabolic Tests of the Cells on the Scaffolds
2.8.1. Urea Measurement
2.8.2. Measurement of Phase I/II Activities
2.9. Statistical Analysis
3. Results
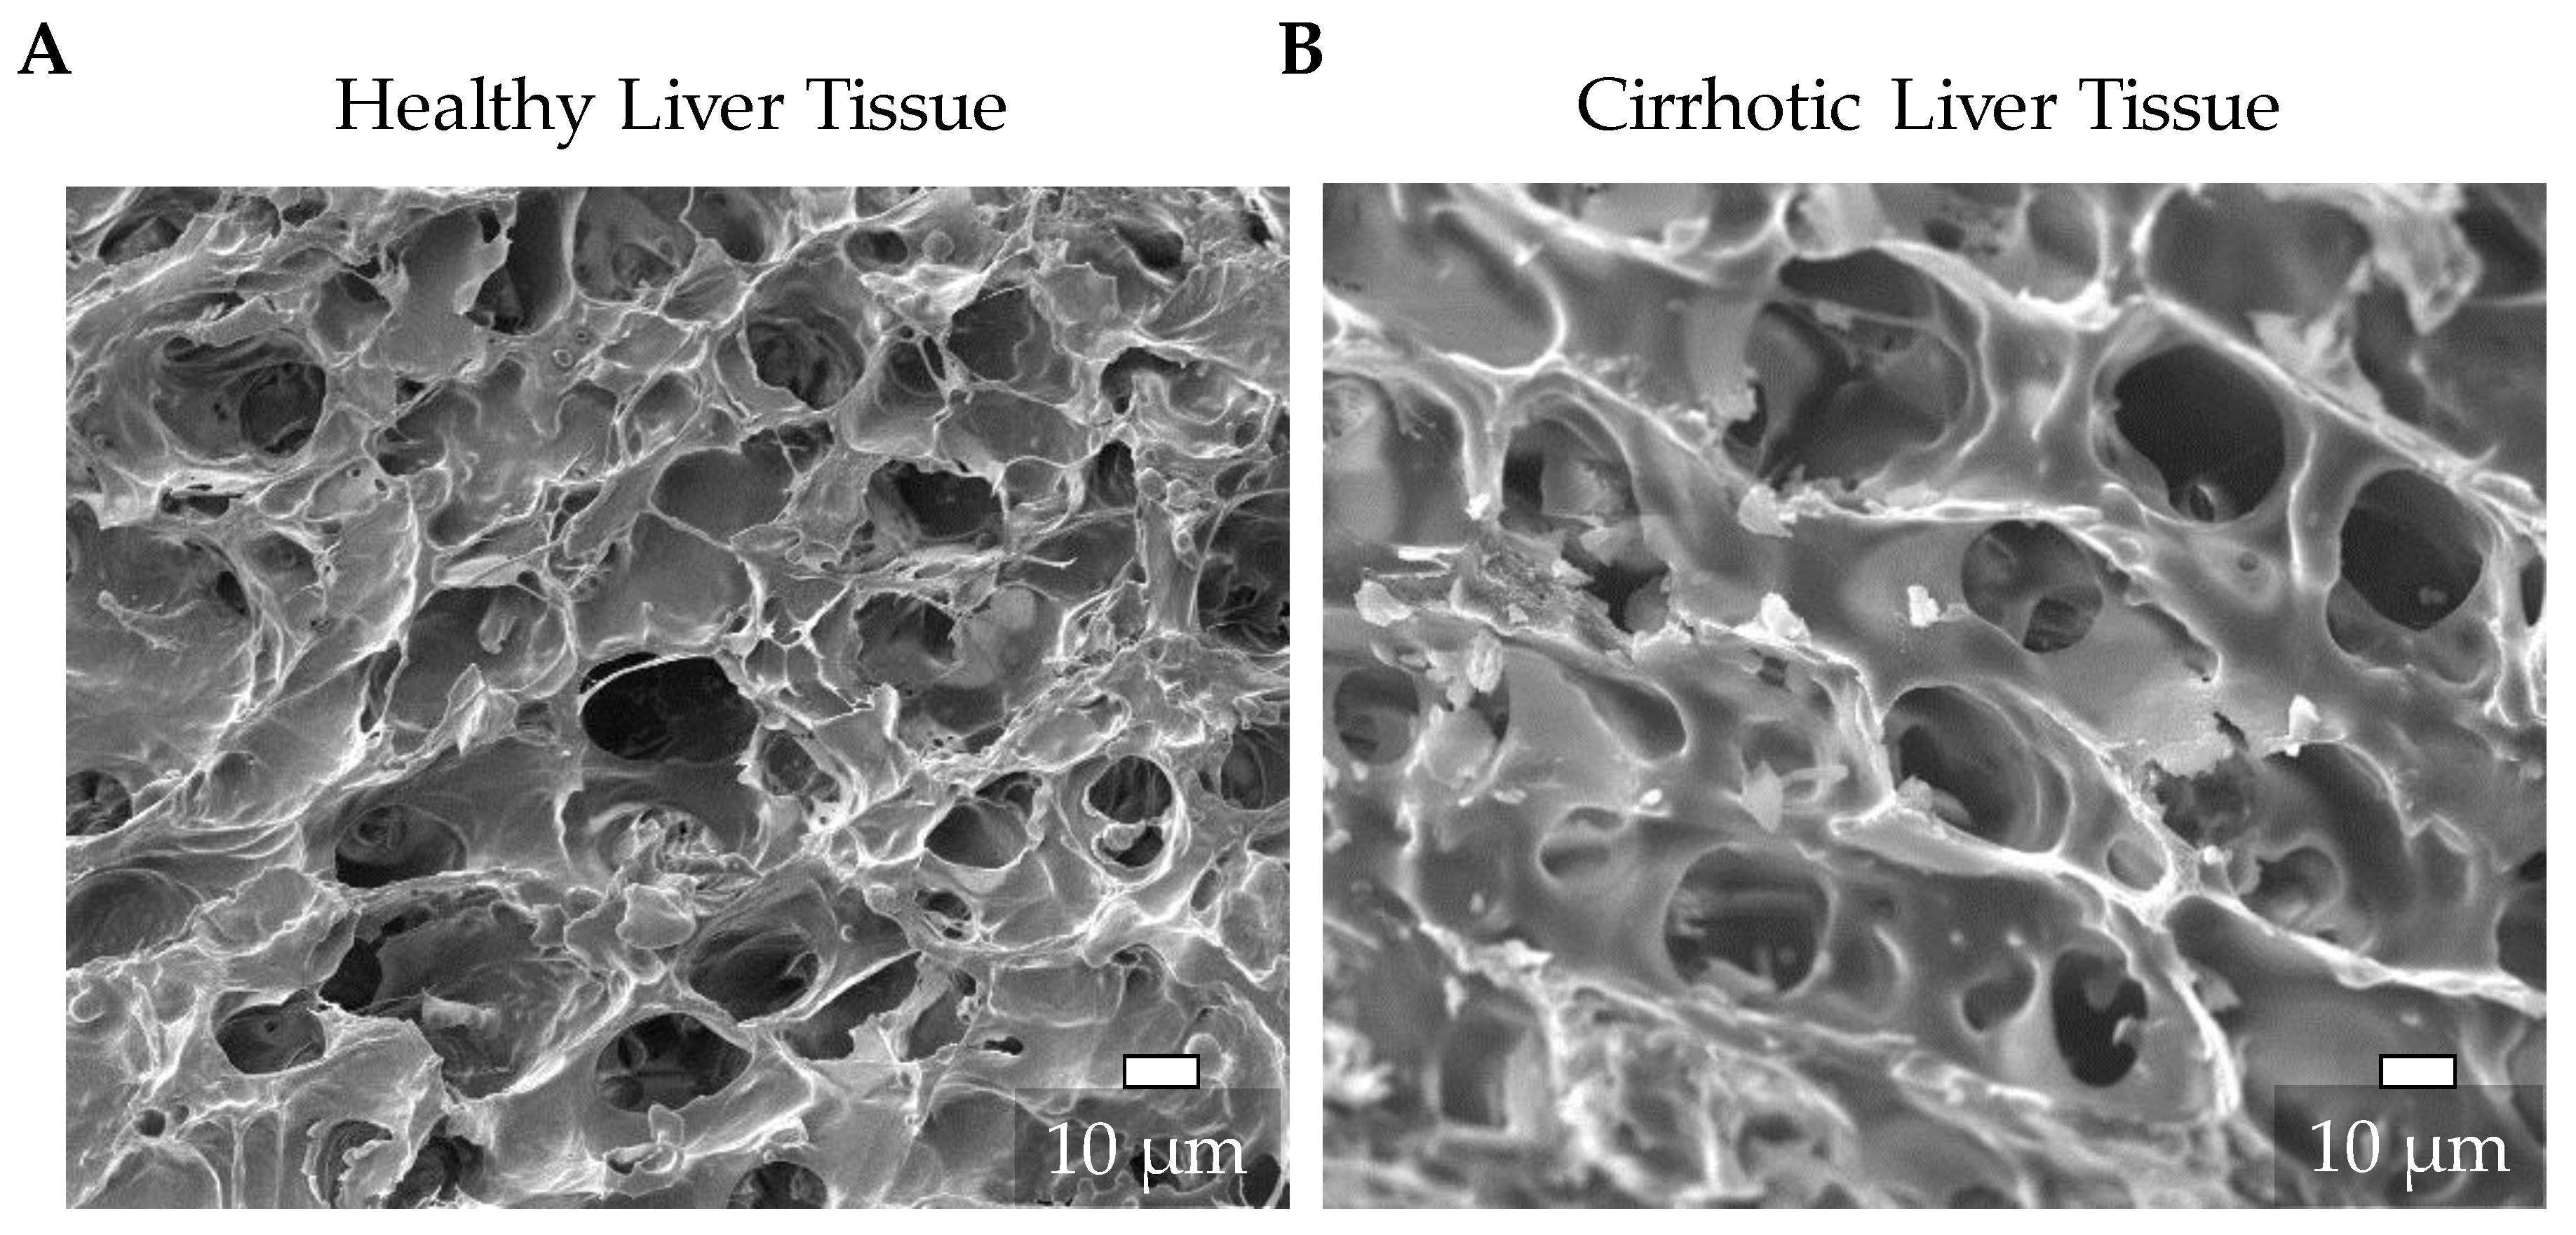
3.1. Characterization of the Natural ECM of Healthy and Cirrhotic Liver Tissue
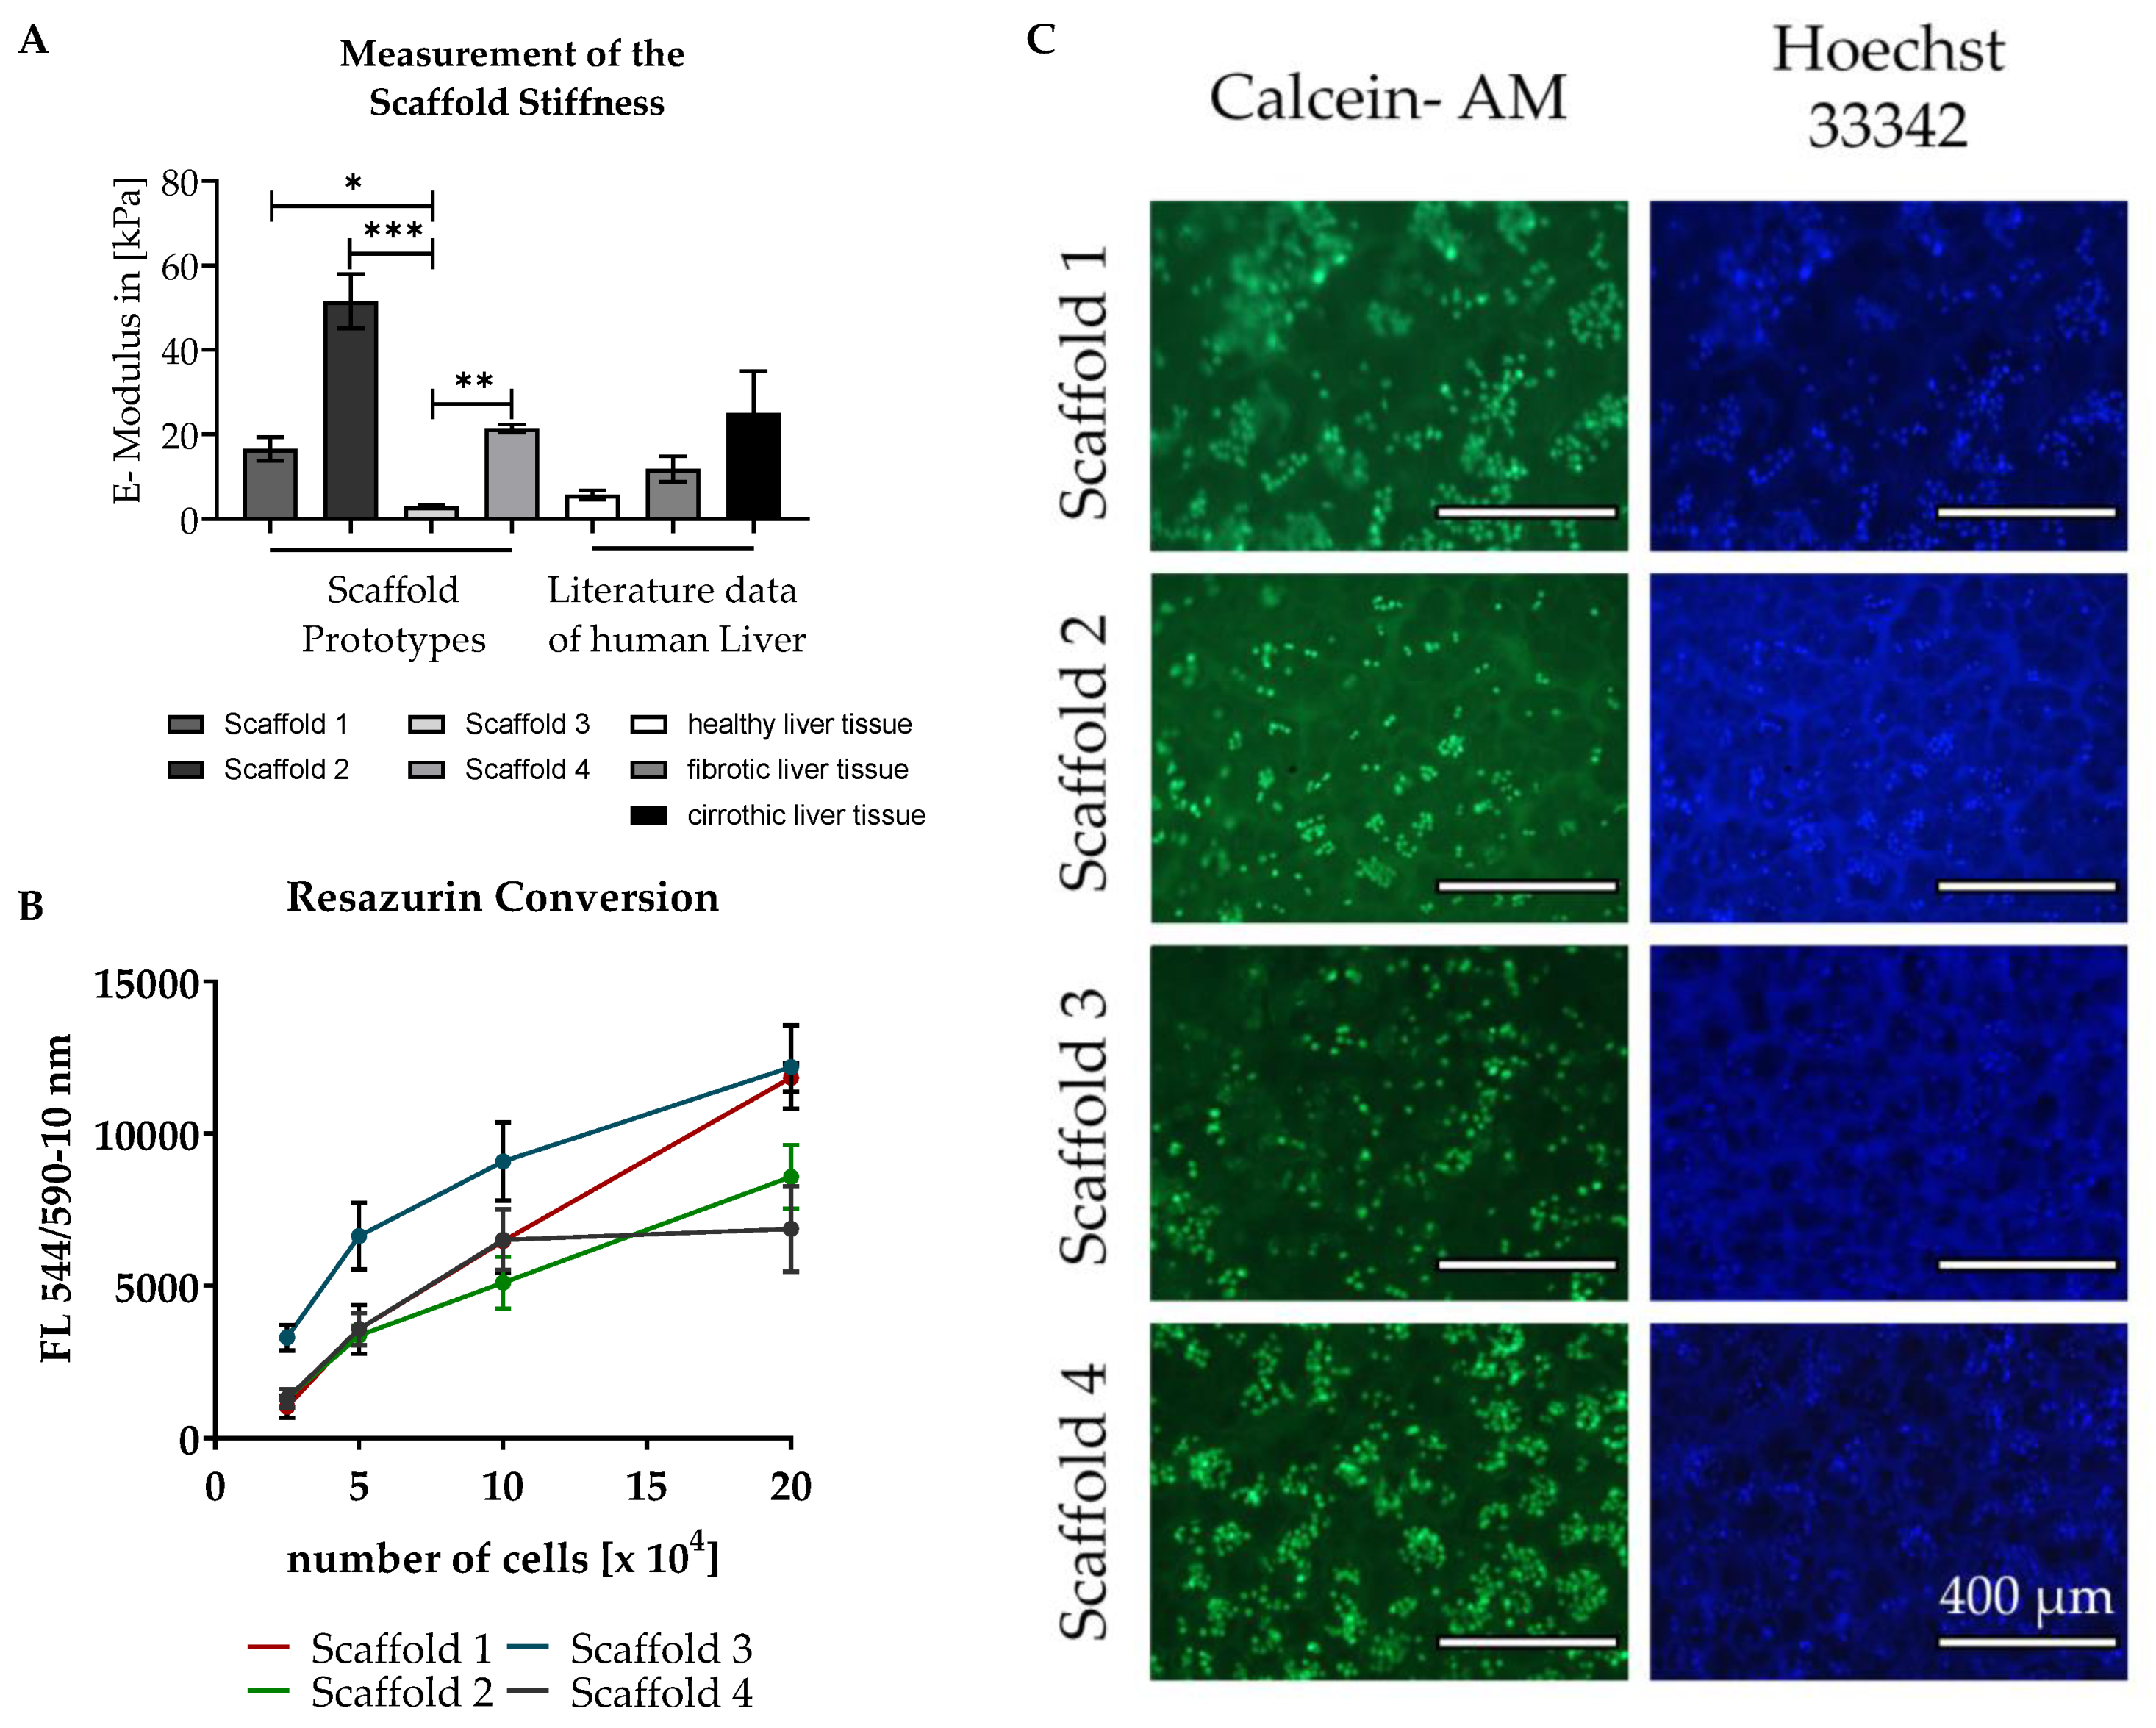
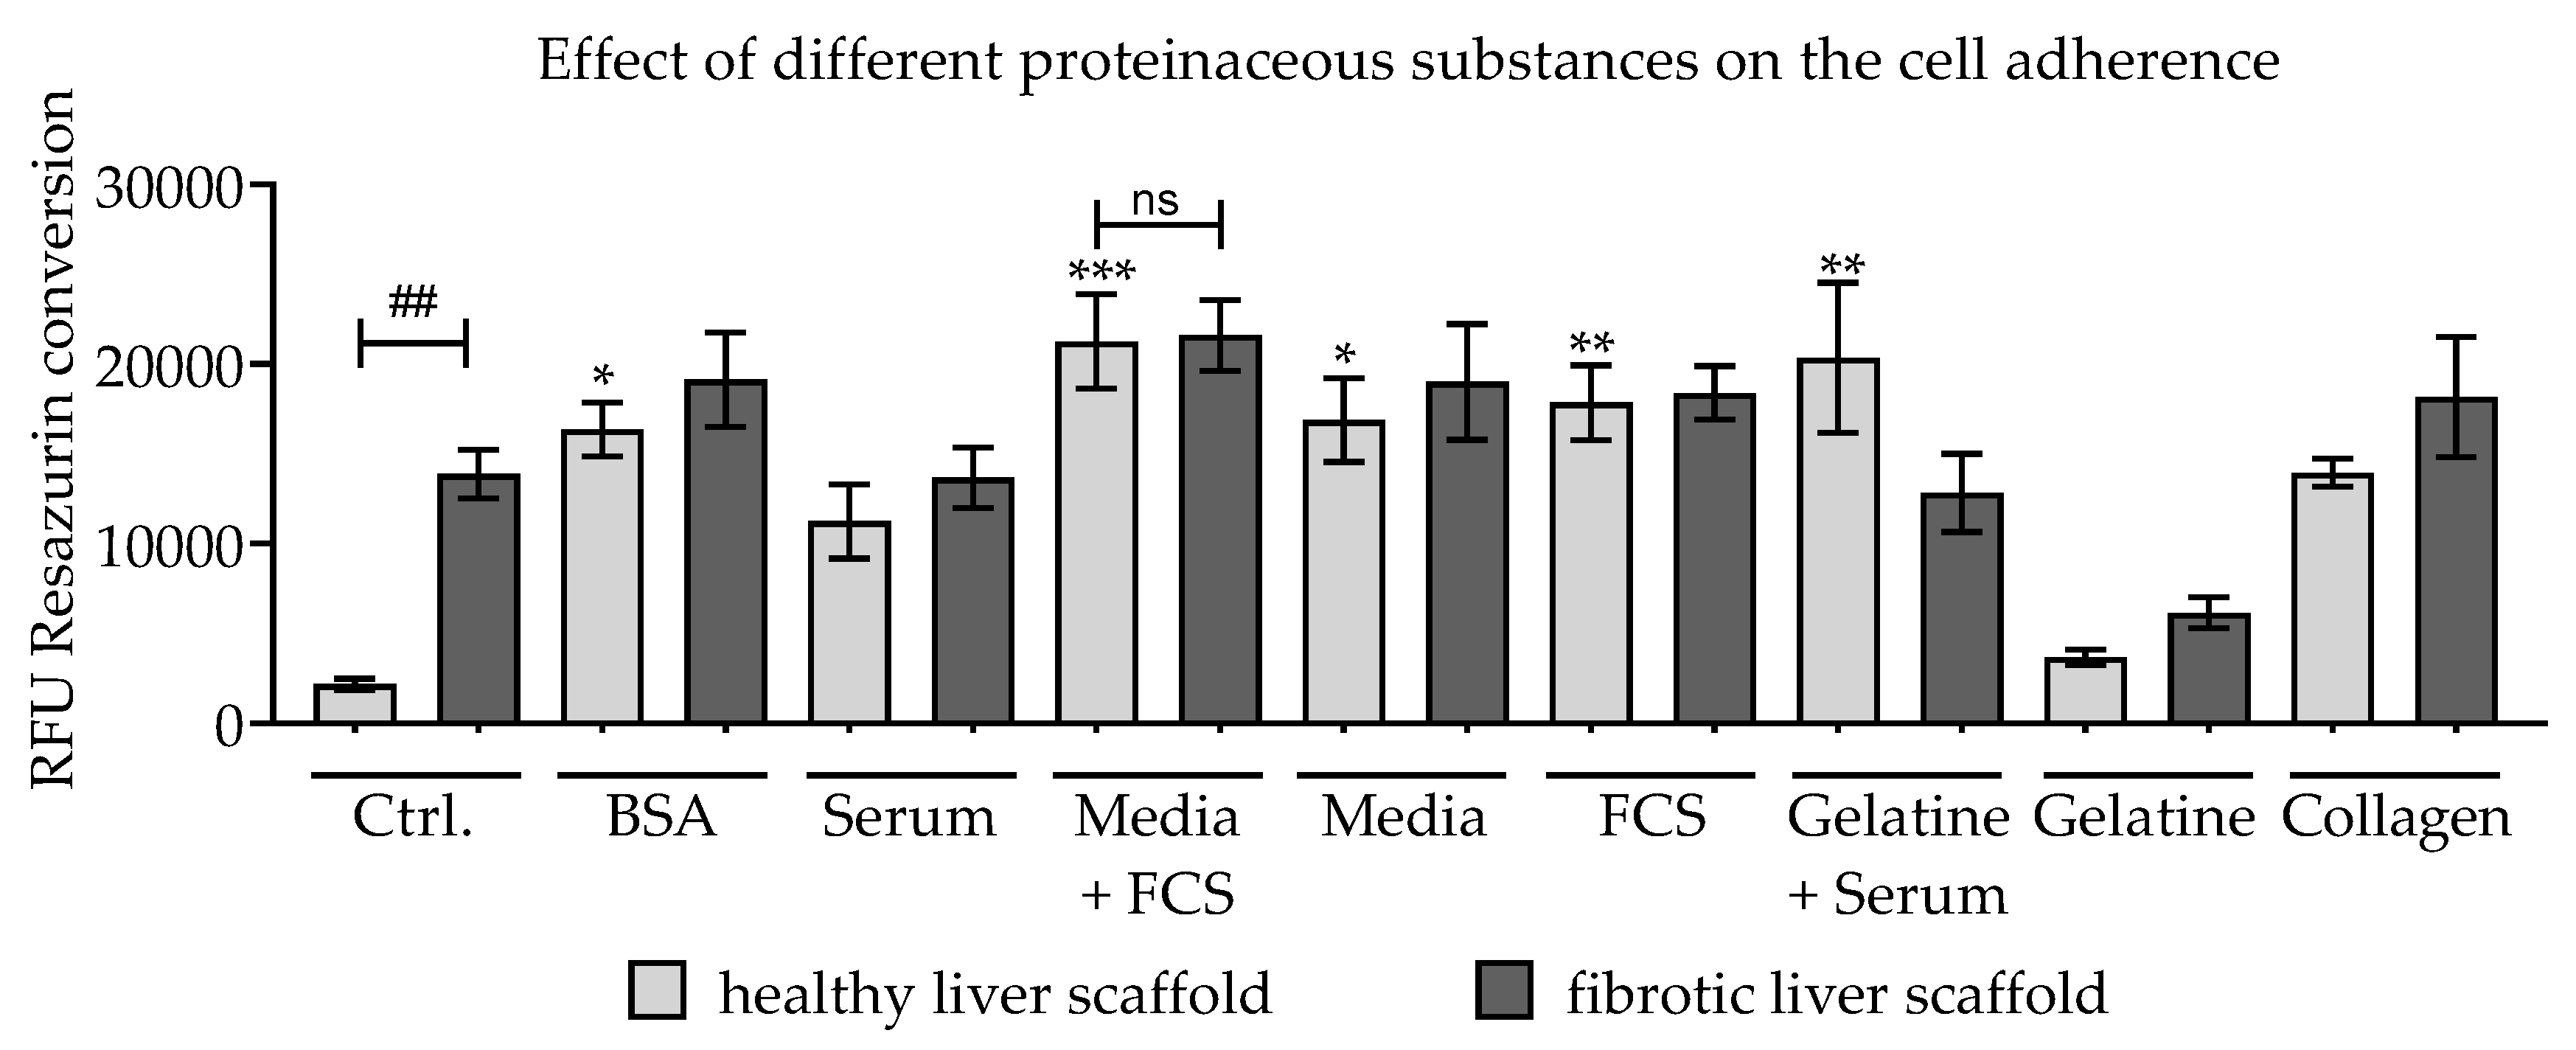
3.2. Testing of Different Scaffolds for the Cultivation of Liver Cells
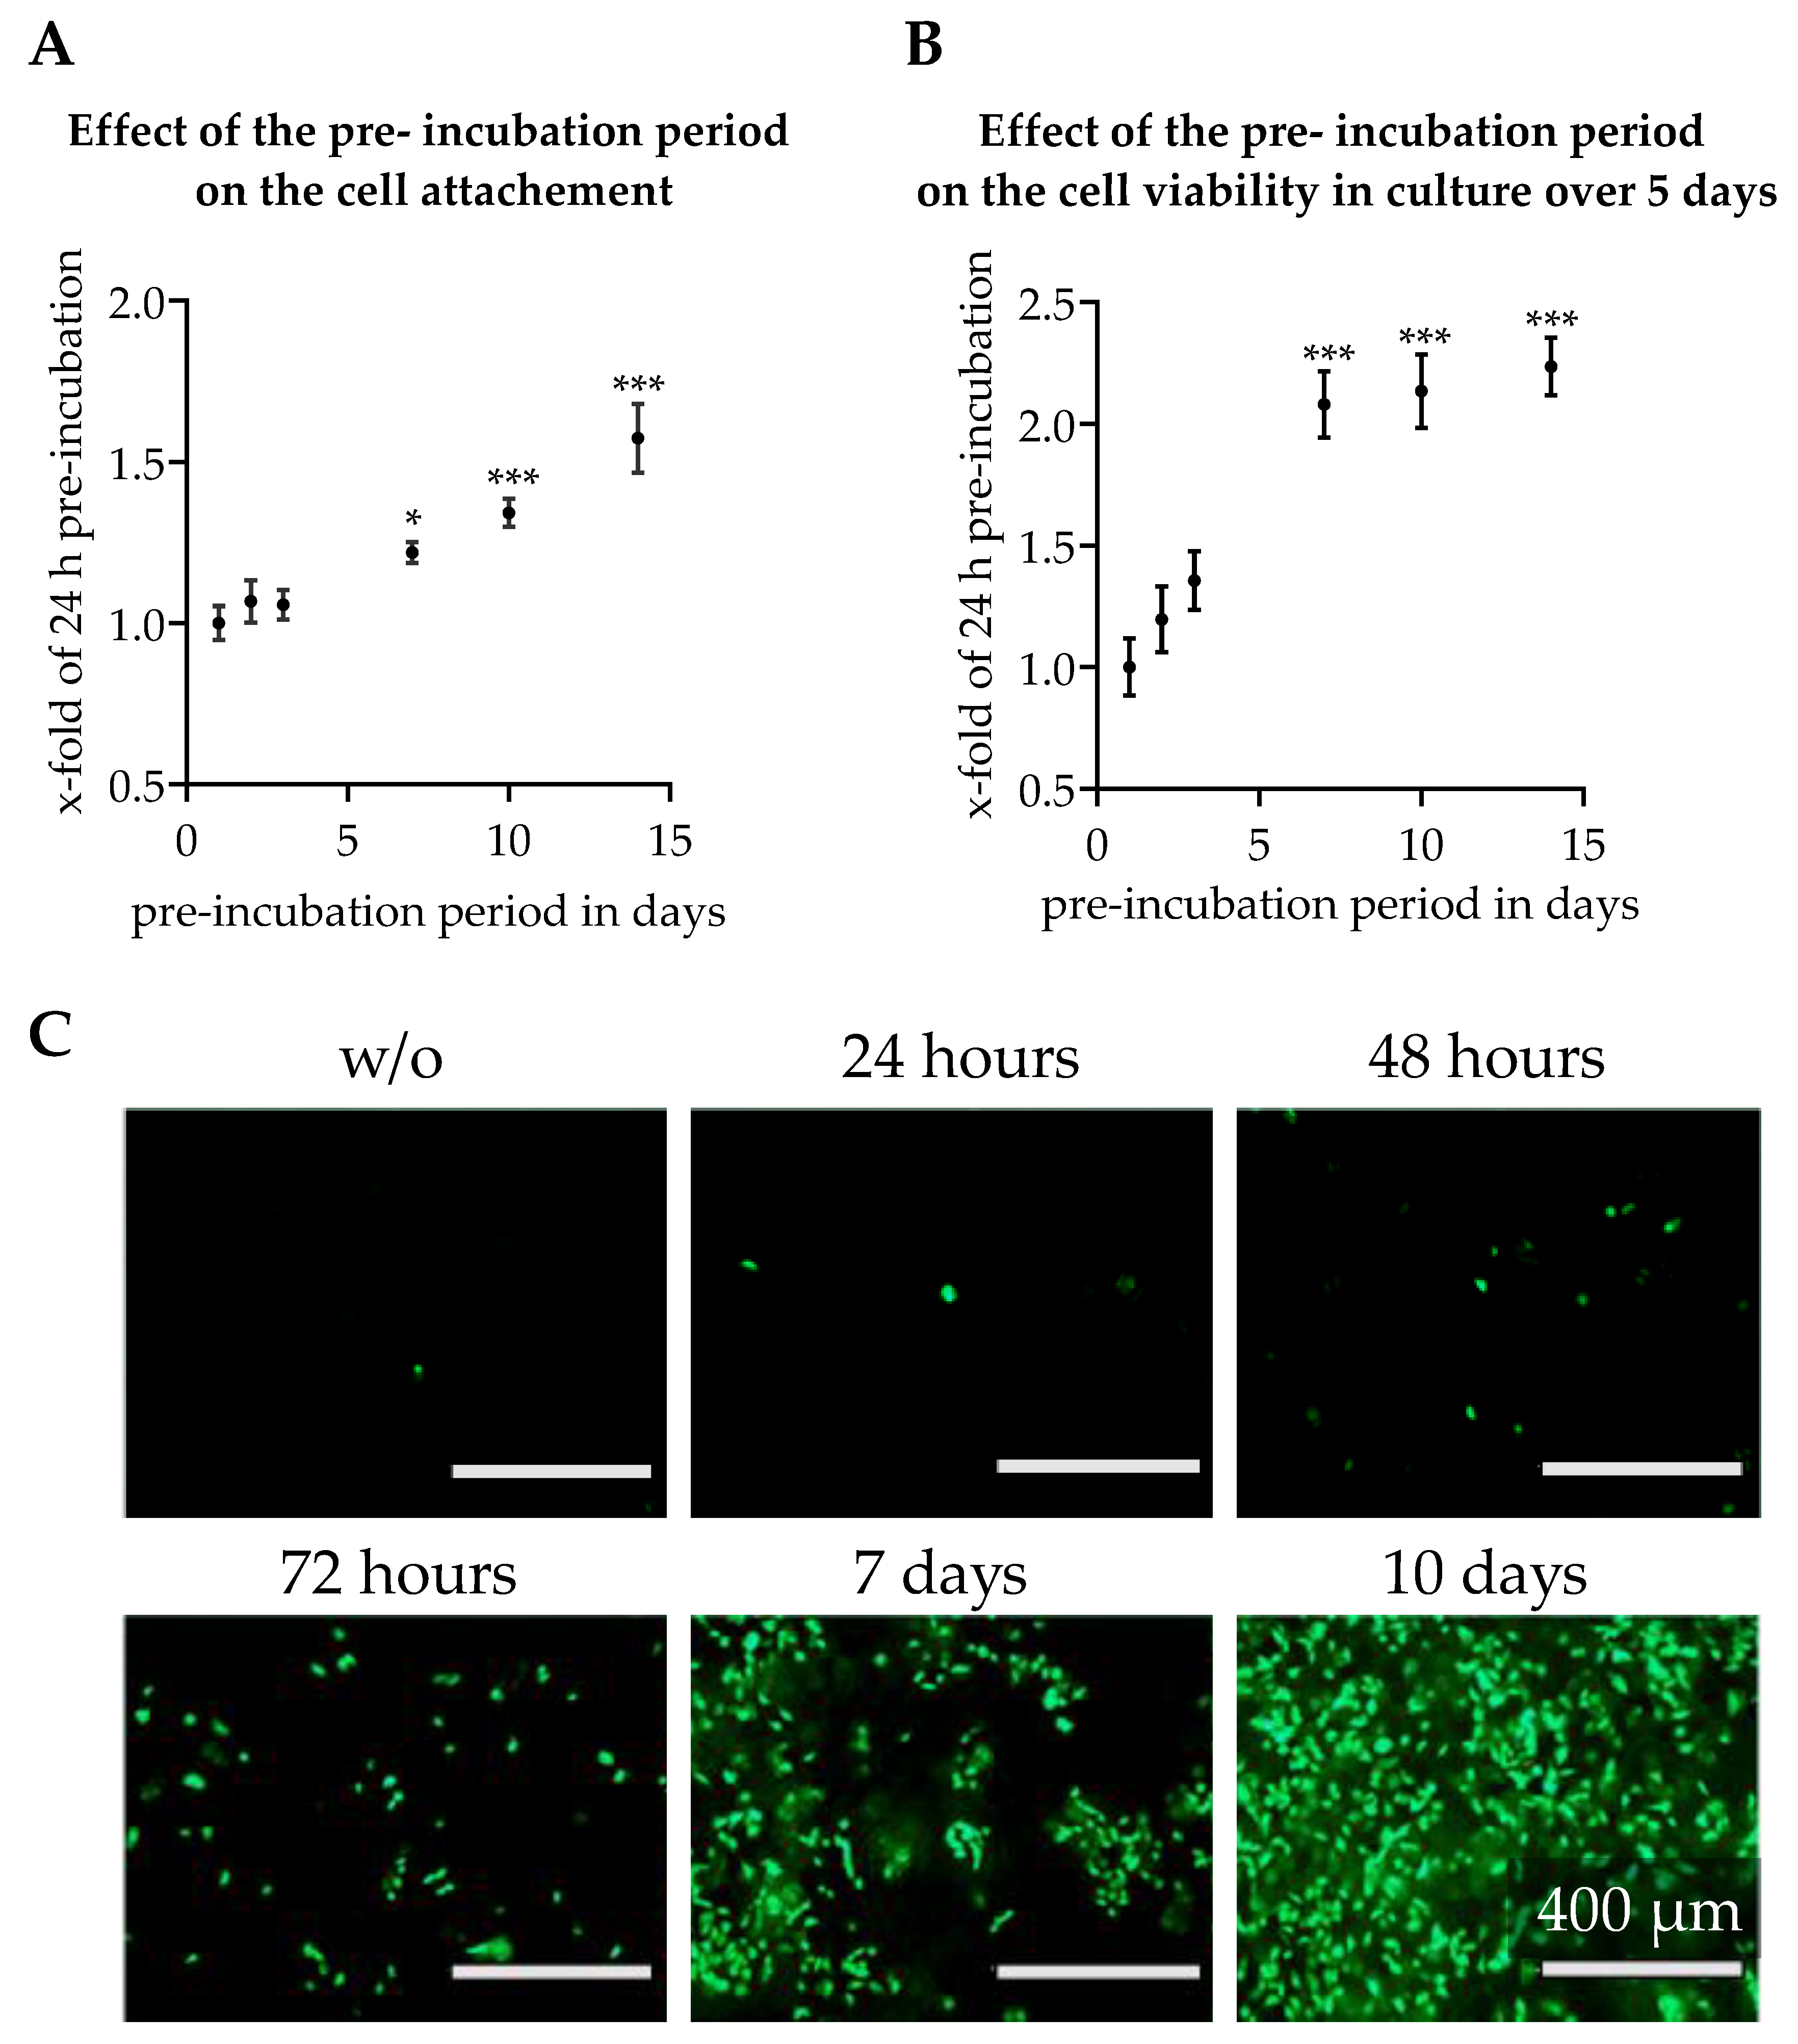
3.3. Effect of Scaffold Pre-incubation on Cell Adherence and Their Viability During the Culture
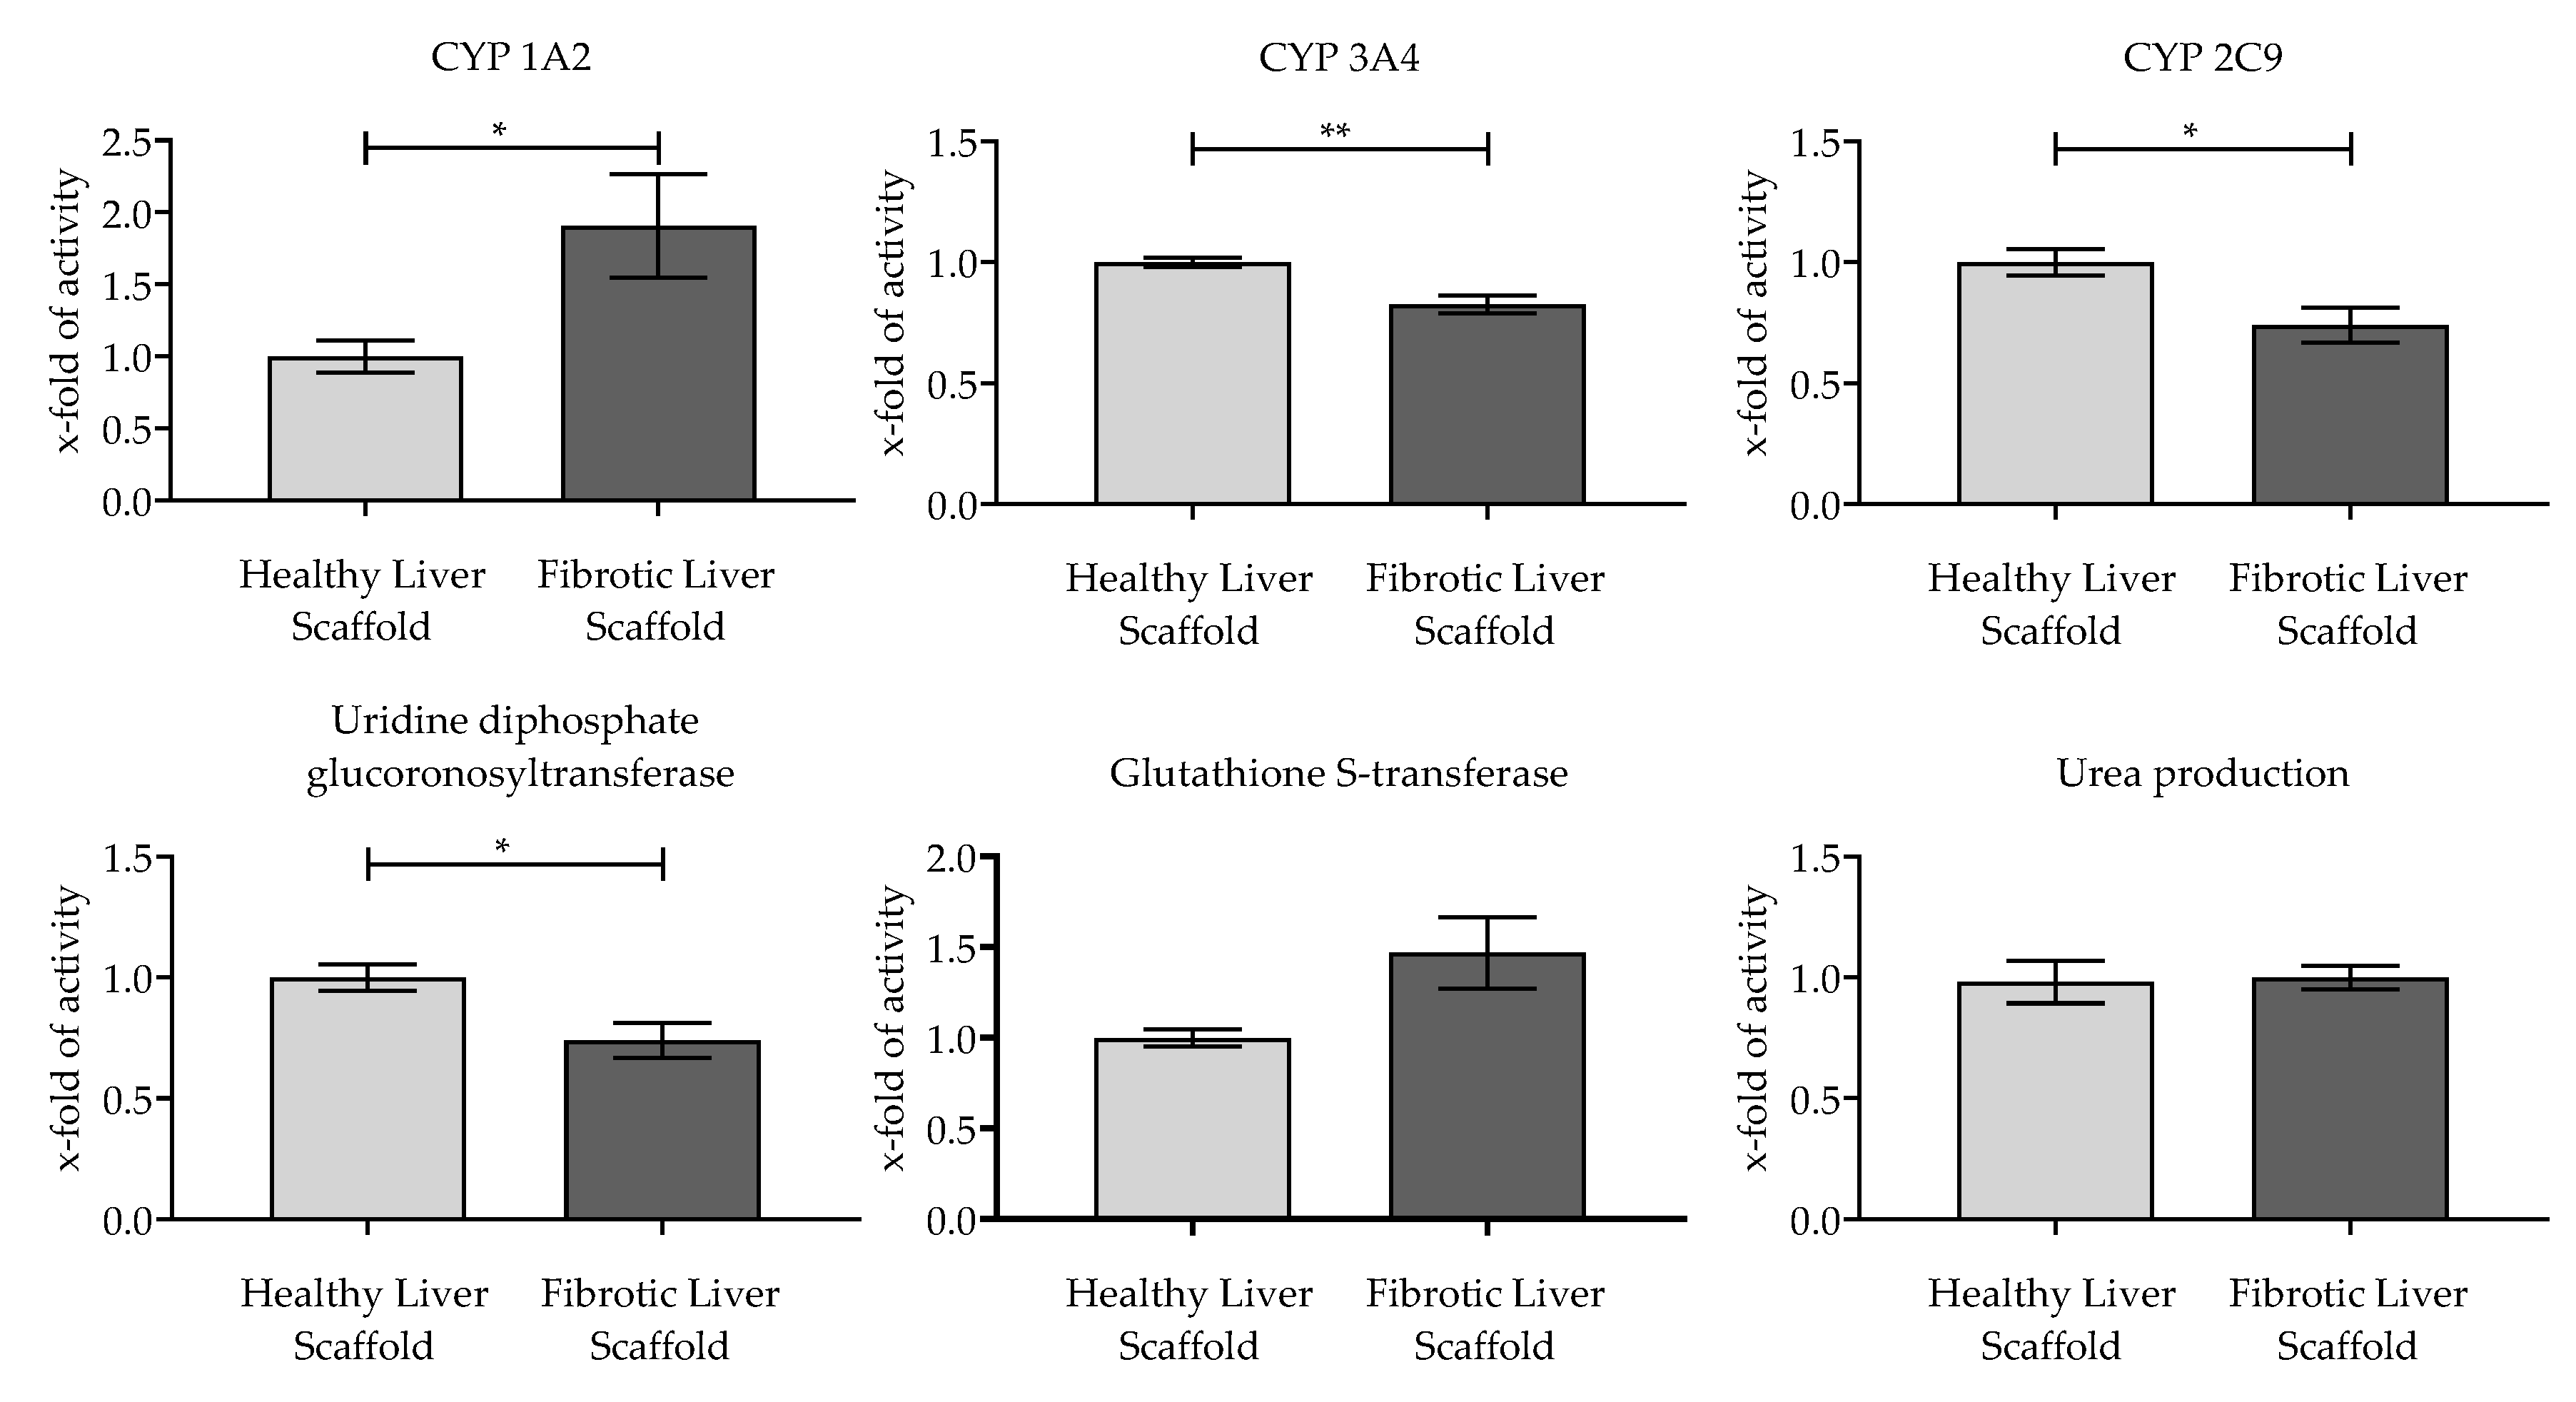
3.4. Evaluation of the Functionality of Hepatic Cells Plated on the Scaffolds
4. Discussion
5. Conclusions
Supplementary Materials
Author Contributions
Funding
Acknowledgments
Conflicts of Interest
Abbreviations
| APS | Ammonium persulfate |
| BAA | Bisacrylamide |
| CYP | Cytochrome P450 |
| DMEM | Dulbecco’s Modified Eagle’s Medium |
| ECM | Extracellular matrix |
| FCS | Fetal calf serum |
| GFP | Green fluorescent protein |
| GST | Glutathione S-transferase |
| PBS | Phosphate-buffered saline |
| pHEMA | Poly(2-hydroxyethyl methacrylate) |
| RGD | Proteins that contain Arg-Gly-Asp (RGD) |
| SEM | Scanning electron microscope |
| SRB | Sulforhodamine B |
| TEMED | Tetramethylethylenediamine |
| UGT | Uridine diphosphate-glucuronyltransferase |
References
- Ware, B.R.; Khetani, S.R. Engineered liver platforms for different phases of drug development. Trends Biotechnol. 2017, 35, 172–183. [Google Scholar] [CrossRef] [Green Version]
- Martignoni, M.; Groothuis, G.M.; de Kanter, R. Species differences between mouse, rat, dog, monkey and human cyp-mediated drug metabolism, inhibition and induction. Expert Opin. Drug Metab. Toxicol. 2006, 2, 875–894. [Google Scholar] [CrossRef]
- Soldatow, V.Y.; Lecluyse, E.L.; Griffith, L.G.; Rusyn, I. In vitro models for liver toxicity testing. Toxicol. Res. 2013, 2, 23–39. [Google Scholar] [CrossRef] [PubMed] [Green Version]
- Godoy, P.; Hewitt, N.J.; Albrecht, U.; Andersen, M.E.; Ansari, N.; Bhattacharya, S.; Bode, J.G.; Bolleyn, J.; Borner, C.; Bottger, J.; et al. Recent advances in 2D and 3D in vitro systems using primary hepatocytes, alternative hepatocyte sources and non-parenchymal liver cells and their use in investigating mechanisms of hepatotoxicity, cell signaling and adme. Arch. Toxicol. 2013, 87, 1315–1530. [Google Scholar] [CrossRef] [PubMed] [Green Version]
- Richert, L.; Liguori, M.J.; Abadie, C.; Heyd, B.; Mantion, G.; Halkic, N.; Waring, J.F. Gene expression in human hepatocytes in suspension after isolation is similar to the liver of origin, is not affected by hepatocyte cold storage and cryopreservation, but is strongly changed after hepatocyte plating. Drug Metab. Dispos. Biol. Fate Chem. 2006, 34, 870–879. [Google Scholar] [CrossRef] [PubMed] [Green Version]
- Ruoß, M.; Vosough, M.; Königsrainer, A.; Nadalin, S.; Wagner, S.; Sajadian, S.; Huber, D.; Heydari, Z.; Ehnert, S.; Hengstler, J.G.; et al. Towards improved hepatocyte cultures: Progress and limitations. Food Chem. Toxicol. 2020, 111188. [Google Scholar] [CrossRef]
- Donato, M.T.; Tolosa, L.; Gomez-Lechon, M.J. Culture and functional characterization of human hepatoma HepG2 cells. Methods Mol. Biol. 2015, 1250, 77–93. [Google Scholar]
- Burkhardt, B.; Martinez-Sanchez, J.J.; Bachmann, A.; Ladurner, R.; Nüssler, A.K. Long-term culture of primary hepatocytes: New matrices and microfluidic devices. Hepatol. Int. 2014, 8, 14–22. [Google Scholar] [CrossRef]
- Ramaiahgari, S.C.; den Braver, M.W.; Herpers, B.; Terpstra, V.; Commandeur, J.N.M.; van de Water, B.; Price, L.S. A 3D in vitro model of differentiated HepG2 cell spheroids with improved liver-like properties for repeated dose high-throughput toxicity studies. Arch. Toxicol. 2014, 88, 1083–1095. [Google Scholar] [CrossRef]
- Gailhouste, L.; Liew, L.C.; Yasukawa, K.; Hagiwara, K.; Iwazaki, N.; Yamada, Y.; Hatada, I.; Ochiya, T. Epigenetic reprogramming of human hepatoma cells: A low-cost option for drug metabolism assessment. Cell. Mol. Gastroenterol. Hepatol. 2018, 5, 454–457.e451. [Google Scholar] [CrossRef] [Green Version]
- Natarajan, V.; Berglund, E.J.; Chen, D.X.; Kidambi, S. Substrate stiffness regulates primary hepatocyte functions. RSC Adv. 2015, 5, 80956–80966. [Google Scholar] [CrossRef]
- Bachmann, A.; Moll, M.; Gottwald, E.; Nies, C.; Zantl, R.; Wagner, H.; Burkhardt, B.; Sanchez, J.J.; Ladurner, R.; Thasler, W.; et al. 3D cultivation techniques for primary human hepatocytes. Microarrays 2015, 4, 64–83. [Google Scholar] [CrossRef] [PubMed]
- Bale, S.S.; Golberg, I.; Jindal, R.; McCarty, W.J.; Luitje, M.; Hegde, M.; Bhushan, A.; Usta, O.B.; Yarmush, M.L. Long-term coculture strategies for primary hepatocytes and liver sinusoidal endothelial cells. Tissue Eng. Part C Methods 2015, 21, 413–422. [Google Scholar] [CrossRef] [PubMed] [Green Version]
- Sudhakaran, P.R. Hepatocyte-matrix interaction. Proc. Indian Acad. Sci. Chem. Sci. 1999, 111, 331. [Google Scholar]
- Jain, E.; Damania, A.; Kumar, A. Biomaterials for liver tissue engineering. Hepatol. Int. 2014, 8, 185–197. [Google Scholar] [CrossRef] [PubMed]
- Ruoß, M.; Häussling, V.; Schügner, F.; Olde Damink, L.; Lee, S.; Ge, L.; Ehnert, S.; Nussler, A. A standardized collagen-based scaffold improves human hepatocyte shipment and allows metabolic studies over 10 days. Bioengineering 2018, 5, 86. [Google Scholar] [CrossRef] [Green Version]
- Engler, A.J.; Sen, S.; Sweeney, H.L.; Discher, D.E. Matrix elasticity directs stem cell lineage specification. Cell 2006, 126, 677–689. [Google Scholar] [CrossRef] [Green Version]
- Cozzolino, A.M.; Noce, V.; Battistelli, C.; Marchetti, A.; Grassi, G.; Cicchini, C.; Tripodi, M.; Amicone, L. Modulating the substrate stiffness to manipulate differentiation of resident liver stem cells and to improve the differentiation state of hepatocytes. Stem Cells Int. 2016, 2016. [Google Scholar] [CrossRef] [Green Version]
- Desai, S.S.; Tung, J.C.; Zhou, V.X.; Grenert, J.P.; Malato, Y.; Rezvani, M.; Español-Suñer, R.; Willenbring, H.; Weaver, V.M.; Chang, T.T. Physiological ranges of matrix rigidity modulate primary mouse hepatocyte function in part through hepatocyte nuclear factor 4 alpha. Hepatology 2016, 64, 261–275. [Google Scholar] [CrossRef] [Green Version]
- Theile, D.; Haefeli, W.E.; Seitz, H.K.; Millonig, G.; Weiss, J.; Mueller, S. Association of liver stiffness with hepatic expression of pharmacokinetically important genes in alcoholic liver disease. Alcohol. Clin. Exp. Res. 2013, 37 (Suppl. 1), E17–E22. [Google Scholar] [CrossRef]
- Wang, Y.; Kim, M.H.; Shirahama, H.; Lee, J.H.; Ng, S.S.; Glenn, J.S.; Cho, N.-J. Ecm proteins in a microporous scaffold influence hepatocyte morphology, function, and gene expression. Sci. Rep. 2016, 6, 37427. [Google Scholar] [CrossRef] [PubMed] [Green Version]
- Gerets, H.H.J.; Tilmant, K.; Gerin, B.; Chanteux, H.; Depelchin, B.O.; Dhalluin, S.; Atienzar, F.A. Characterization of primary human hepatocytes, HepG2 cells, and HepaRG cells at the mRNA level and CYP activity in response to inducers and their predictivity for the detection of human hepatotoxins. Cell Biol. Toxicol. 2012, 28, 69–87. [Google Scholar] [CrossRef] [PubMed] [Green Version]
- Ye, S.; Boeter, J.W.B.; Penning, L.C.; Spee, B.; Schneeberger, K. Hydrogels for liver tissue engineering. Bioengineering 2019, 6, 59. [Google Scholar] [CrossRef] [PubMed] [Green Version]
- Heydari, Z.; Najimi, M.; Mirzaei, H.; Shpichka, A.; Ruoss, M.; Farzaneh, Z.; Montazeri, L.; Piryaei, A.; Timashev, P.; Gramignoli, R. Tissue engineering in liver regenerative medicine: Insights into novel translational technologies. Cells 2020, 9, 304. [Google Scholar] [CrossRef] [Green Version]
- Knobeloch, D.; Ehnert, S.; Schyschka, L.; Büchler, P.; Schoenberg, M.; Kleeff, J.; Thasler, W.E.; Nussler, N.C.; Godoy, P.; Hengstler, J.; et al. Human hepatocytes: Isolation, culture, and quality procedures. In Human Cell Culture Protocols; Mitry, R.R., Hughes, R.D., Eds.; Humana Press: Totowa, NJ, USA, 2012; pp. 99–120. [Google Scholar]
- Fan, J.; Jia, X.; Huang, Y.; Fu, B.M.; Fan, Y. Greater scaffold permeability promotes growth of osteoblastic cells in a perfused bioreactor. J. Tissue Eng. Regen. Med. 2015, 9, E210–E218. [Google Scholar] [CrossRef]
- Kumari, J.; Kumar, A. Development of polymer based cryogel matrix for transportation and storage of mammalian cells. Sci. Rep. 2017, 7, 41551. [Google Scholar] [CrossRef]
- Chung, E.J.; Ju, H.W.; Park, H.J.; Park, C.H. Three-layered scaffolds for artificial esophagus using poly (varepsilon-caprolactone) nanofibers and silk fibroin: An experimental study in a rat model. J. Biomed. Mater. Res. Part A 2015, 103, 2057–2065. [Google Scholar] [CrossRef]
- Zhang, J.; Muirhead, B.; Dodd, M.; Liu, L.; Xu, F.; Mangiacotte, N.; Hoare, T.; Sheardown, H. An injectable hydrogel prepared using a peg/vitamin e copolymer facilitating aqueous-driven gelation. Biomacromolecules 2016, 17, 3648–3658. [Google Scholar] [CrossRef]
- Ruoß, M.; Kieber, V.; Rebholz, S.; Linnemann, C.; Rinderknecht, H.; Häussling, V.; Häcker, M.; Olde Damink, L.H.; Ehnert, S.; Nussler, A.K. Cell-type-specific quantification of a scaffold-based 3D liver co-culture. Methods Protoc. 2020, 3, 1. [Google Scholar] [CrossRef] [Green Version]
- Lin, J.; Schyschka, L.; Muhl-Benninghaus, R.; Neumann, J.; Hao, L.; Nussler, N.; Dooley, S.; Liu, L.; Stockle, U.; Nussler, A.K.; et al. Comparative analysis of phase I and II enzyme activities in 5 hepatic cell lines identifies Huh-7 and HCC-T cells with the highest potential to study drug metabolism. Arch. Toxicol. 2012, 86, 87–95. [Google Scholar] [CrossRef]
- Ruoß, M.; Damm, G.; Vosough, M.; Ehret, L.; Grom-Baumgarten, C.; Petkov, M.; Naddalin, S.; Ladurner, R.; Seehofer, D.; Nussler, A.; et al. Epigenetic modifications of the liver tumor cell line HepG2 increase their drug metabolic capacity. Int. J. Mol. Sci. 2019, 20, 347. [Google Scholar] [CrossRef] [PubMed] [Green Version]
- Seeliger, C.; Culmes, M.; Schyschka, L.; Yan, X.; Damm, G.; Wang, Z.; Kleeff, J.; Thasler, W.E.; Hengstler, J.; Stöckle, U.; et al. Decrease of global methylation improves significantly hepatic differentiation of ad-mscs: Possible future application for urea detoxification. Cell Transplant. 2013, 22, 119–131. [Google Scholar] [CrossRef] [PubMed]
- Ehnert, S.; Knobeloch, D.; Blankenstein, A.; Müller, A.; Böcker, U.; Gillen, S.; Friess, H.; Thasler, W.E.; Dooley, S.; Nussler, A.K. Neohepatocytes from alcoholics and controls express hepatocyte markers and display reduced fibrogenic TGF-β/smad3 signaling: Advantage for cell transplantation? Alcohol. Clin. Exp. Res. 2010, 34, 708–718. [Google Scholar] [CrossRef] [PubMed]
- Zanger, U.M.; Schwab, M. Cytochrome p450 enzymes in drug metabolism: Regulation of gene expression, enzyme activities, and impact of genetic variation. Pharmacol. Ther. 2013, 138, 103–141. [Google Scholar] [CrossRef]
- Wong, V.W.; Vergniol, J.; Wong, G.L.; Foucher, J.; Chan, H.L.; Le Bail, B.; Choi, P.C.; Kowo, M.; Chan, A.W.; Merrouche, W.; et al. Diagnosis of fibrosis and cirrhosis using liver stiffness measurement in nonalcoholic fatty liver disease. Hepatology 2010, 51, 454–462. [Google Scholar] [CrossRef]
- Mueller, S.; Seitz, H.K.; Rausch, V. Non-invasive diagnosis of alcoholic liver disease. World J. Gastroenterol. WJG 2014, 20, 14626. [Google Scholar] [CrossRef]
- Rodighiero, V. Effects of liver disease on pharmacokinetics. Clin. Pharmacokinet. 1999, 37, 399–431. [Google Scholar] [CrossRef]
- Liu, Y.; Meyer, C.; Xu, C.; Weng, H.; Hellerbrand, C.; ten Dijke, P.; Dooley, S. Animal models of chronic liver diseases. Am. J. Physiol. Gastrointest. Liver Physiol. 2012, 304, G449–G468. [Google Scholar] [CrossRef] [Green Version]
- Skardal, A.; Mack, D.; Atala, A.; Soker, S. Substrate elasticity controls cell proliferation, surface marker expression and motile phenotype in amniotic fluid-derived stem cells. J. Mech. Behav. Biomed. Mater. 2013, 17, 307–316. [Google Scholar] [CrossRef] [Green Version]
- Xing, Q.; Yates, K.; Vogt, C.; Qian, Z.; Frost, M.C.; Zhao, F. Increasing mechanical strength of gelatin hydrogels by divalent metal ion removal. Sci. Rep. 2014, 4, 4706. [Google Scholar] [CrossRef] [Green Version]
- Zhang, Z.; Li, G.; Shi, B. Physicochemical properties of collagen, gelatin and collagen hydrolysate derived from bovine limed split wastes. J. Soc. Leather Technol. Chem. 2006, 90, 23. [Google Scholar]
- Wissemann, K.W.; Jacobson, B.S. Pure gelatin microcarriers: Synthesis and use in cell attachment and growth of fibroblast and endothelial cells. In Vitro Cell. Dev. Biol. 1985, 21, 391–401. [Google Scholar] [CrossRef] [PubMed]
- Masugi, Y.; Abe, T.; Tsujikawa, H.; Effendi, K.; Hashiguchi, A.; Abe, M.; Imai, Y.; Hino, K.; Hige, S.; Kawanaka, M.; et al. Quantitative assessment of liver fibrosis reveals a nonlinear association with fibrosis stage in nonalcoholic fatty liver disease. Hepatol. Commun. 2017, 2, 58–68. [Google Scholar] [CrossRef] [PubMed] [Green Version]
- Bataller, R.; Brenner, D.A. Liver fibrosis. J. Clin. Investig. 2005, 115, 209–218. [Google Scholar] [CrossRef]
- Sacchi, M.; Bansal, R.; Rouwkema, J. Bioengineered 3d models to recapitulate tissue fibrosis. Trends Biotechnol. 2020. [Google Scholar] [CrossRef]
- Amirikia, M.; Shariatzadeh, S.M.A.; Jorsaraei, S.G.A.; Soleimani Mehranjani, M. Impact of pre-incubation time of silk fibroin scaffolds in culture medium on cell proliferation and attachment. Tissue Cell 2017, 49, 657–663. [Google Scholar] [CrossRef]
- Kumari, J.; Karande, A.A.; Kumar, A. Combined effect of cryogel matrix and temperature-reversible soluble–insoluble polymer for the development of in vitro human liver tissue. ACS Appl. Mater. Interfaces 2016, 8, 264–277. [Google Scholar] [CrossRef]
- Baltruskeviciene, E.; Kazbariene, B.; Badaras, R.; Bagdonaite, L.; Krikstaponiene, A.; Zdanavicius, L.; Aleknavicius, E.; Didziapetriene, J. Glutathione and glutathione s-transferase levels in patients with liver metastases of colorectal cancer and other hepatic disorders. Turk. J. Gastroenterol. 2016, 27, 336–341. [Google Scholar] [CrossRef] [Green Version]
- Dietrich, C.G.; Götze, O.; Geier, A. Molecular changes in hepatic metabolism and transport in cirrhosis and their functional importance. World J. Gastroenterol. 2016, 22, 72. [Google Scholar] [CrossRef]
- Jancova, P.; Anzenbacher, P.; Anzenbacherova, E. Phase ii drug metabolizing enzymes. Biomed. Pap. Med. Fac. Univ. Palacky Olomouc Czech Repub. 2010, 154, 103–116. [Google Scholar] [CrossRef] [Green Version]
- Kratochwil, N.A.; Meille, C.; Fowler, S.; Klammers, F.; Ekiciler, A.; Molitor, B.; Simon, S.; Walter, I.; McGinnis, C.; Walther, J.; et al. Metabolic profiling of human long-term liver models and hepatic clearance predictions from in vitro data using nonlinear mixed-effects modeling. AAPS J. 2017, 19, 534–550. [Google Scholar] [CrossRef] [PubMed]
- Zeilinger, K.; Freyer, N.; Damm, G.; Seehofer, D.; Knöspel, F. Cell sources for in vitro human liver cell culture models. Exp. Biol. Med. 2016, 241, 1684–1698. [Google Scholar] [CrossRef] [PubMed] [Green Version]
- Huettner, N.; Dargaville, T.R.; Forget, A. Discovering cell-adhesion peptides in tissue engineering: Beyond rgd. Trends Biotechnol. 2018, 36, 372–383. [Google Scholar] [CrossRef] [PubMed]
- Koyama, Y.; Brenner, D.A. Liver inflammation and fibrosis. J. Clin. Investig. 2017, 127, 55–64. [Google Scholar] [CrossRef] [PubMed]


| Substance Concentration | Scaffold 1 | Scaffold 2 | Scaffold 3 | Scaffold 4 |
|---|---|---|---|---|
| ddH2O | 5.78 mL | 3.78 mL | 7.11 mL | 5.03 mL |
| pHEMA 98% | 500 µL | 500 µL | 1 mL | 1 mL |
| BAA 2% | 250 µL | 250 µL | 170 µL | 10 µL |
| Gelatin 30% | 2 mL | 4 mL | 250 µL | 2 mL |
| Collagen 3.5 g/L | 1 mL | |||
| TEMED | 20 µL | |||
| APS 10% | 200 µL | |||
| Glutaraldehyde 25% | 250 µL | |||
| Magnitude | Loading Rate | Hold | Recovery | Rest | Repeats |
|---|---|---|---|---|---|
| 10.0% | 10%/100 s | 2 s | 10 s | 0 s | 1 |
| Substance | Concentration | Note |
|---|---|---|
| DMEM | 100% | Without additives |
| DMEM, FCS, P/S | 10% FCS, 1% P/S | 10,000 units penicillin and 10 mg streptomycin/mL |
| Collagen | 0.14 g/L in PBS | This concentration is usually used for plate coating [25] |
| Bovine serum albumin | 5% in PBS | - |
| Coldwater fish gelatin | 30% in ddH2O | - |
| Human serum | 100% | - |
| FCS | 100% | - |
| Gelatin, FCS | 50% FCS, 15% Gelatin, ddH2O | - |
| Enzyme | Substrate | C final in µM | Measured Product | Phase II Inhibitors | Measured Wavelength |
|---|---|---|---|---|---|
| CYP 1A2 | 7-Ethoxycoumarin | 25 | 7-Hydroxycoumarin | 1.5 mM Salicylamid, 2 mM Probenecid | 355/460 nm |
| CYP 3A4 | 7-Benzyloxy-4 (trifluoromethyl) coumarin | 5 | 7-Hydroxy-4 (trifluoromethyl) coumarin | 1.5 mM Salicylamid, 2 mM Probenecid | 355/520 nm |
| CYP 2C9 | Dibenzylfluorescein | 5 | Fluorescein | 10 µM Dicumarol | 485/520 nm |
| UGT 2B7 | 4-Methylumbelliferon | 6.25 | 4-Methylumbelliferon | - | 355/460 nm |
| GST | Monochlorobimane | 50 | Monochlorobimane- glutathione conjugate | - | 355/460 nm |
| Measured Parameter | Scaffold 1 | Scaffold 2 | Scaffold 3 | Scaffold 4 |
|---|---|---|---|---|
| Pore diameter (µm) | 115 ± 29 | 64 ± 13 | 85 ± 41 | 61 ± 41 |
| Water uptake (%) | 90.4 ± 1.6 | 83.9 ± 1.9 | 85.3 ± 4.4 | 83.4 ± 2.0 |
| Swelling ratio (%) | 965 ± 159 | 528 ± 72 | 641 ± 207 | 511 ± 74 |
© 2020 by the authors. Licensee MDPI, Basel, Switzerland. This article is an open access article distributed under the terms and conditions of the Creative Commons Attribution (CC BY) license (http://creativecommons.org/licenses/by/4.0/).
Share and Cite
Ruoß, M.; Rebholz, S.; Weimer, M.; Grom-Baumgarten, C.; Athanasopulu, K.; Kemkemer, R.; Käß, H.; Ehnert, S.; Nussler, A.K. Development of Scaffolds with Adjusted Stiffness for Mimicking Disease-Related Alterations of Liver Rigidity. J. Funct. Biomater. 2020, 11, 17. https://0-doi-org.brum.beds.ac.uk/10.3390/jfb11010017
Ruoß M, Rebholz S, Weimer M, Grom-Baumgarten C, Athanasopulu K, Kemkemer R, Käß H, Ehnert S, Nussler AK. Development of Scaffolds with Adjusted Stiffness for Mimicking Disease-Related Alterations of Liver Rigidity. Journal of Functional Biomaterials. 2020; 11(1):17. https://0-doi-org.brum.beds.ac.uk/10.3390/jfb11010017
Chicago/Turabian StyleRuoß, Marc, Silas Rebholz, Marina Weimer, Carl Grom-Baumgarten, Kiriaki Athanasopulu, Ralf Kemkemer, Hanno Käß, Sabrina Ehnert, and Andreas K. Nussler. 2020. "Development of Scaffolds with Adjusted Stiffness for Mimicking Disease-Related Alterations of Liver Rigidity" Journal of Functional Biomaterials 11, no. 1: 17. https://0-doi-org.brum.beds.ac.uk/10.3390/jfb11010017