Determination and Quantification of the Distribution of CN-NL Nanoparticles Encapsulating Glycyrrhetic Acid on Novel Textile Surfaces with Hyperspectral Imaging

 , and
, and
Abstract
:1. Introduction
2. Materials and Methods
2.1. Samples
2.2. NIR Hyperspectral Imaging System
2.3. Principal Component Analysis
2.4. Partial Least Square Regression
2.5. Software Tools
3. Results
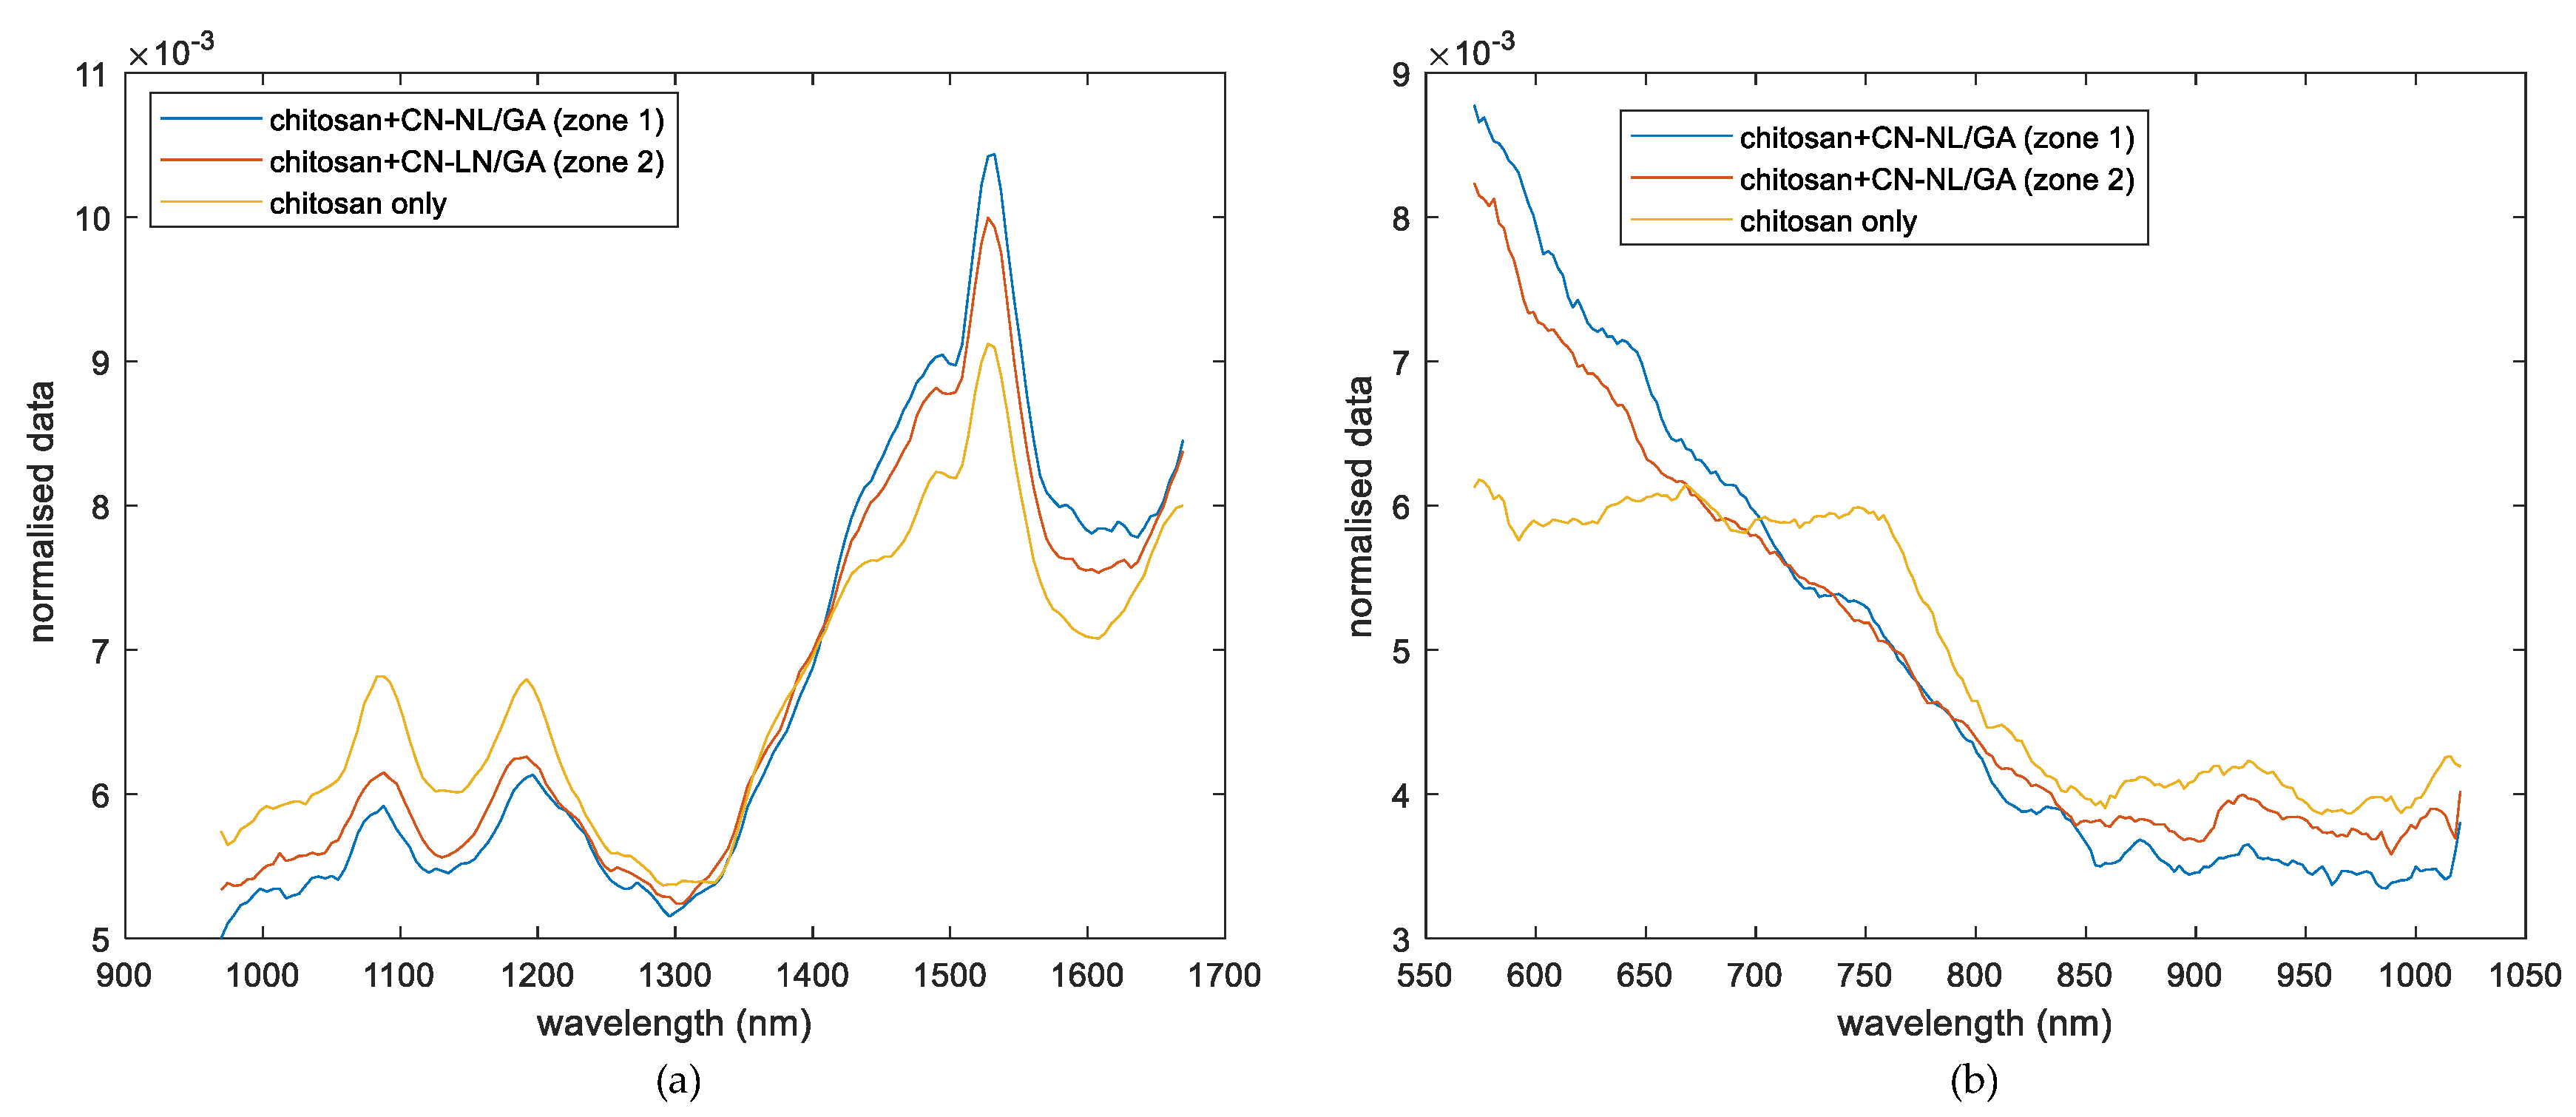
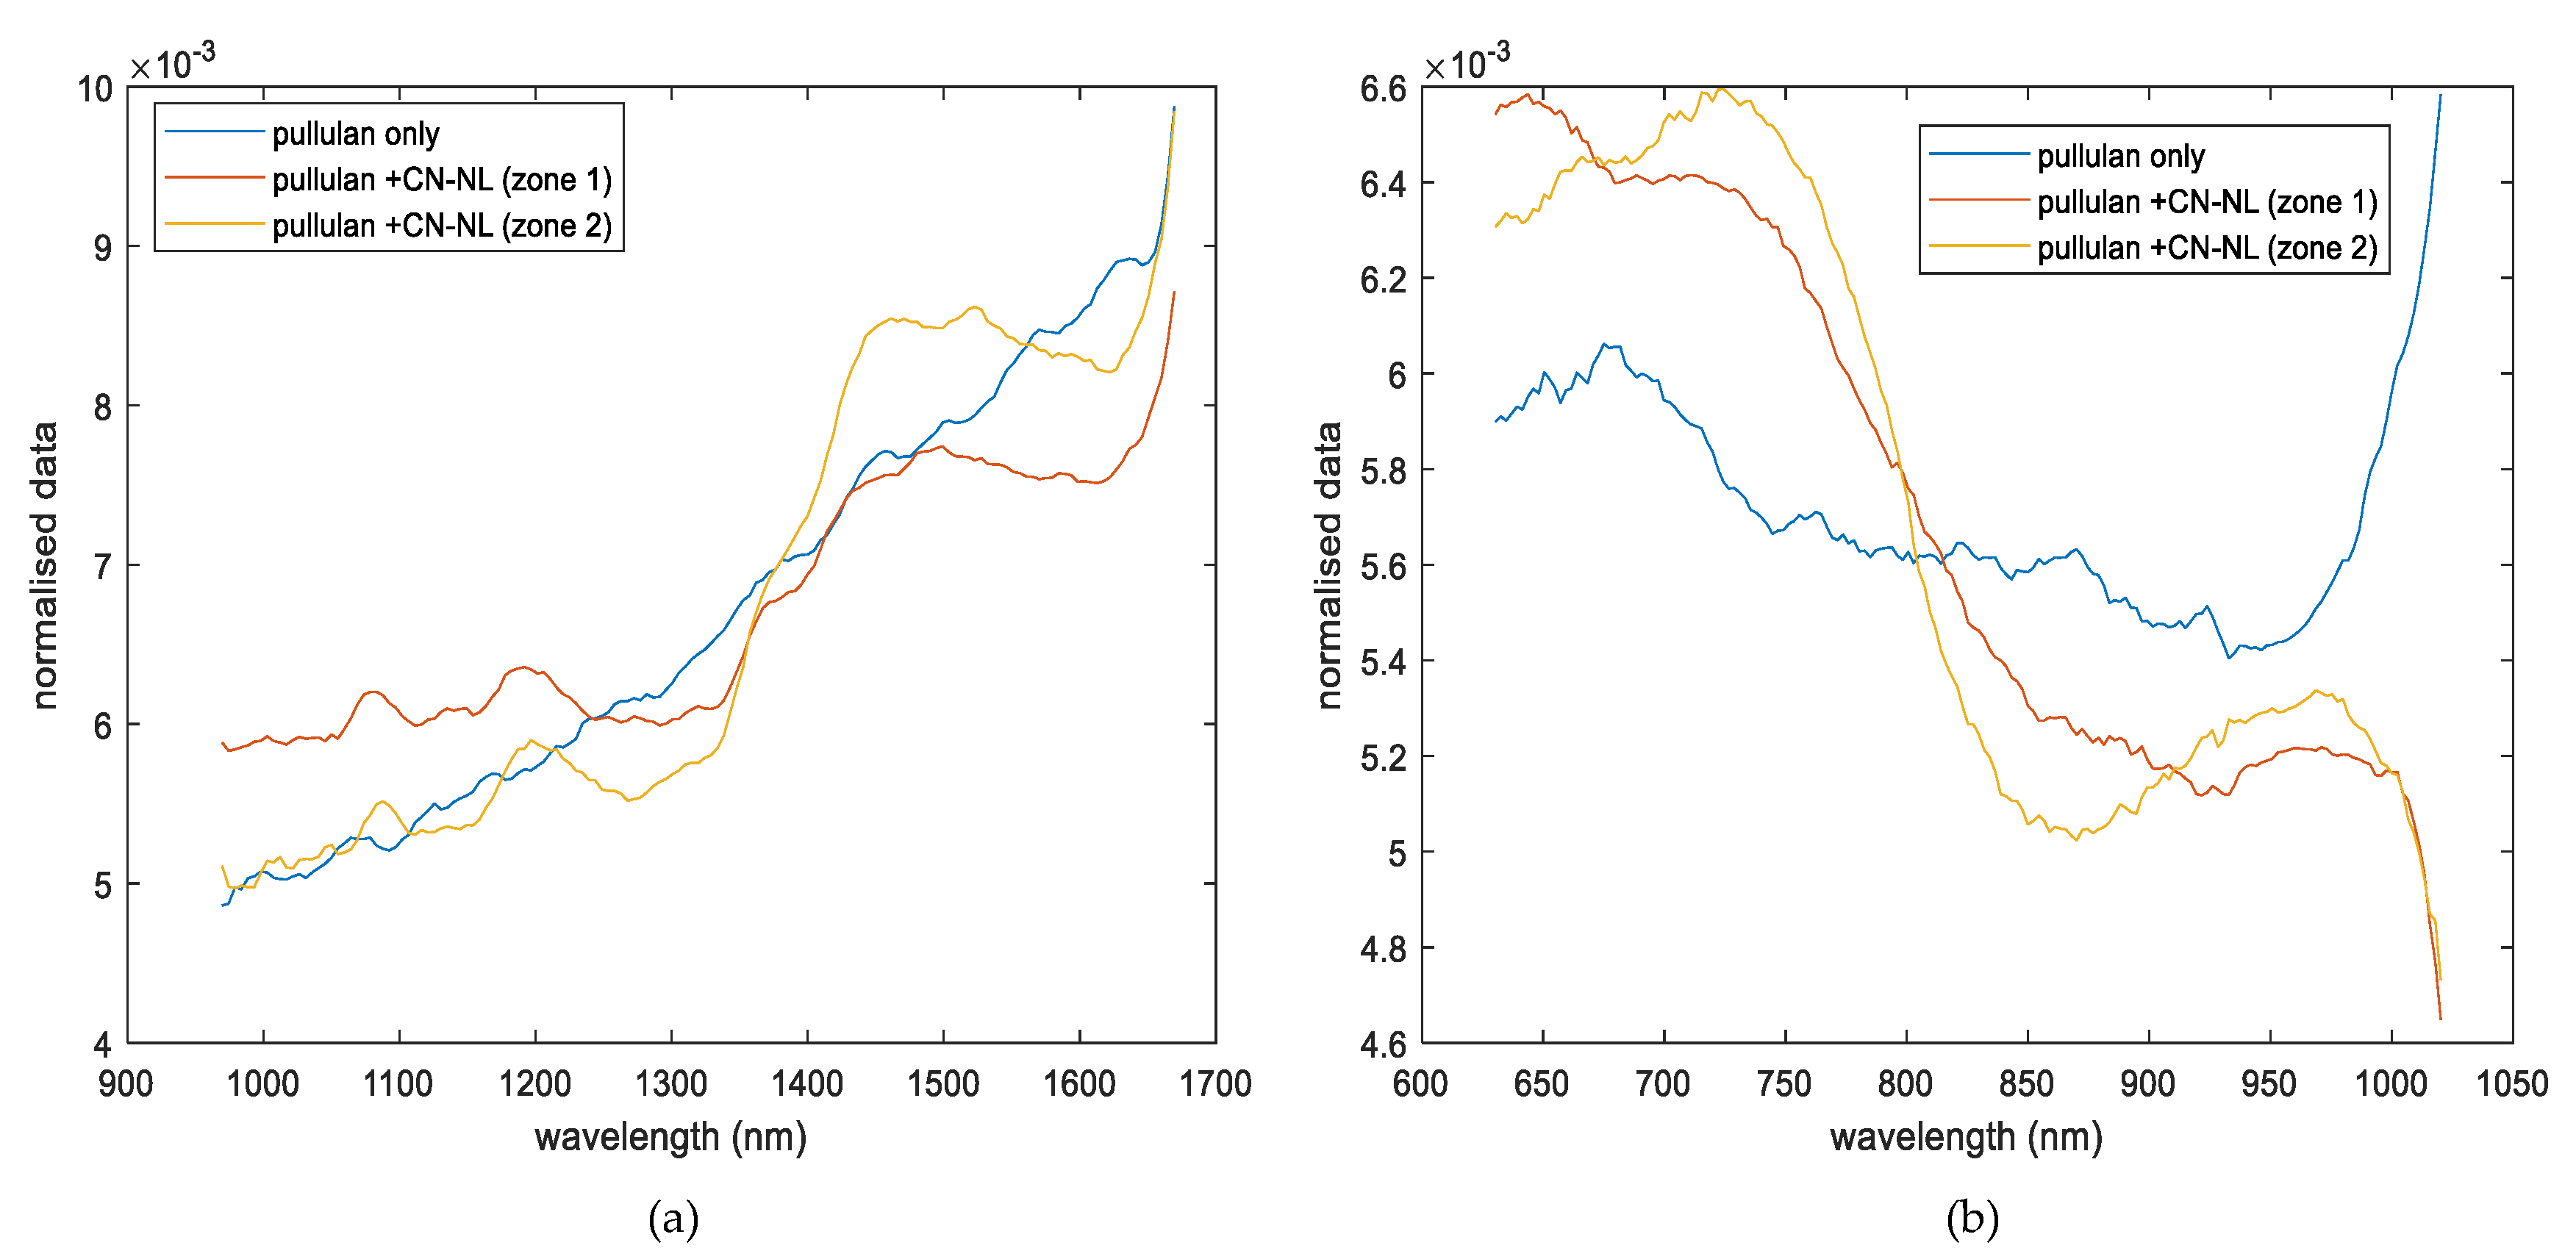
3.1. Spectroscopic Analysis
- Chitosan substrates impregnated with CN-NL/GA
- Pullulan substrates impregnated with CN-NL
3.2. Qualitative Distribution Analysis (PCA Method)
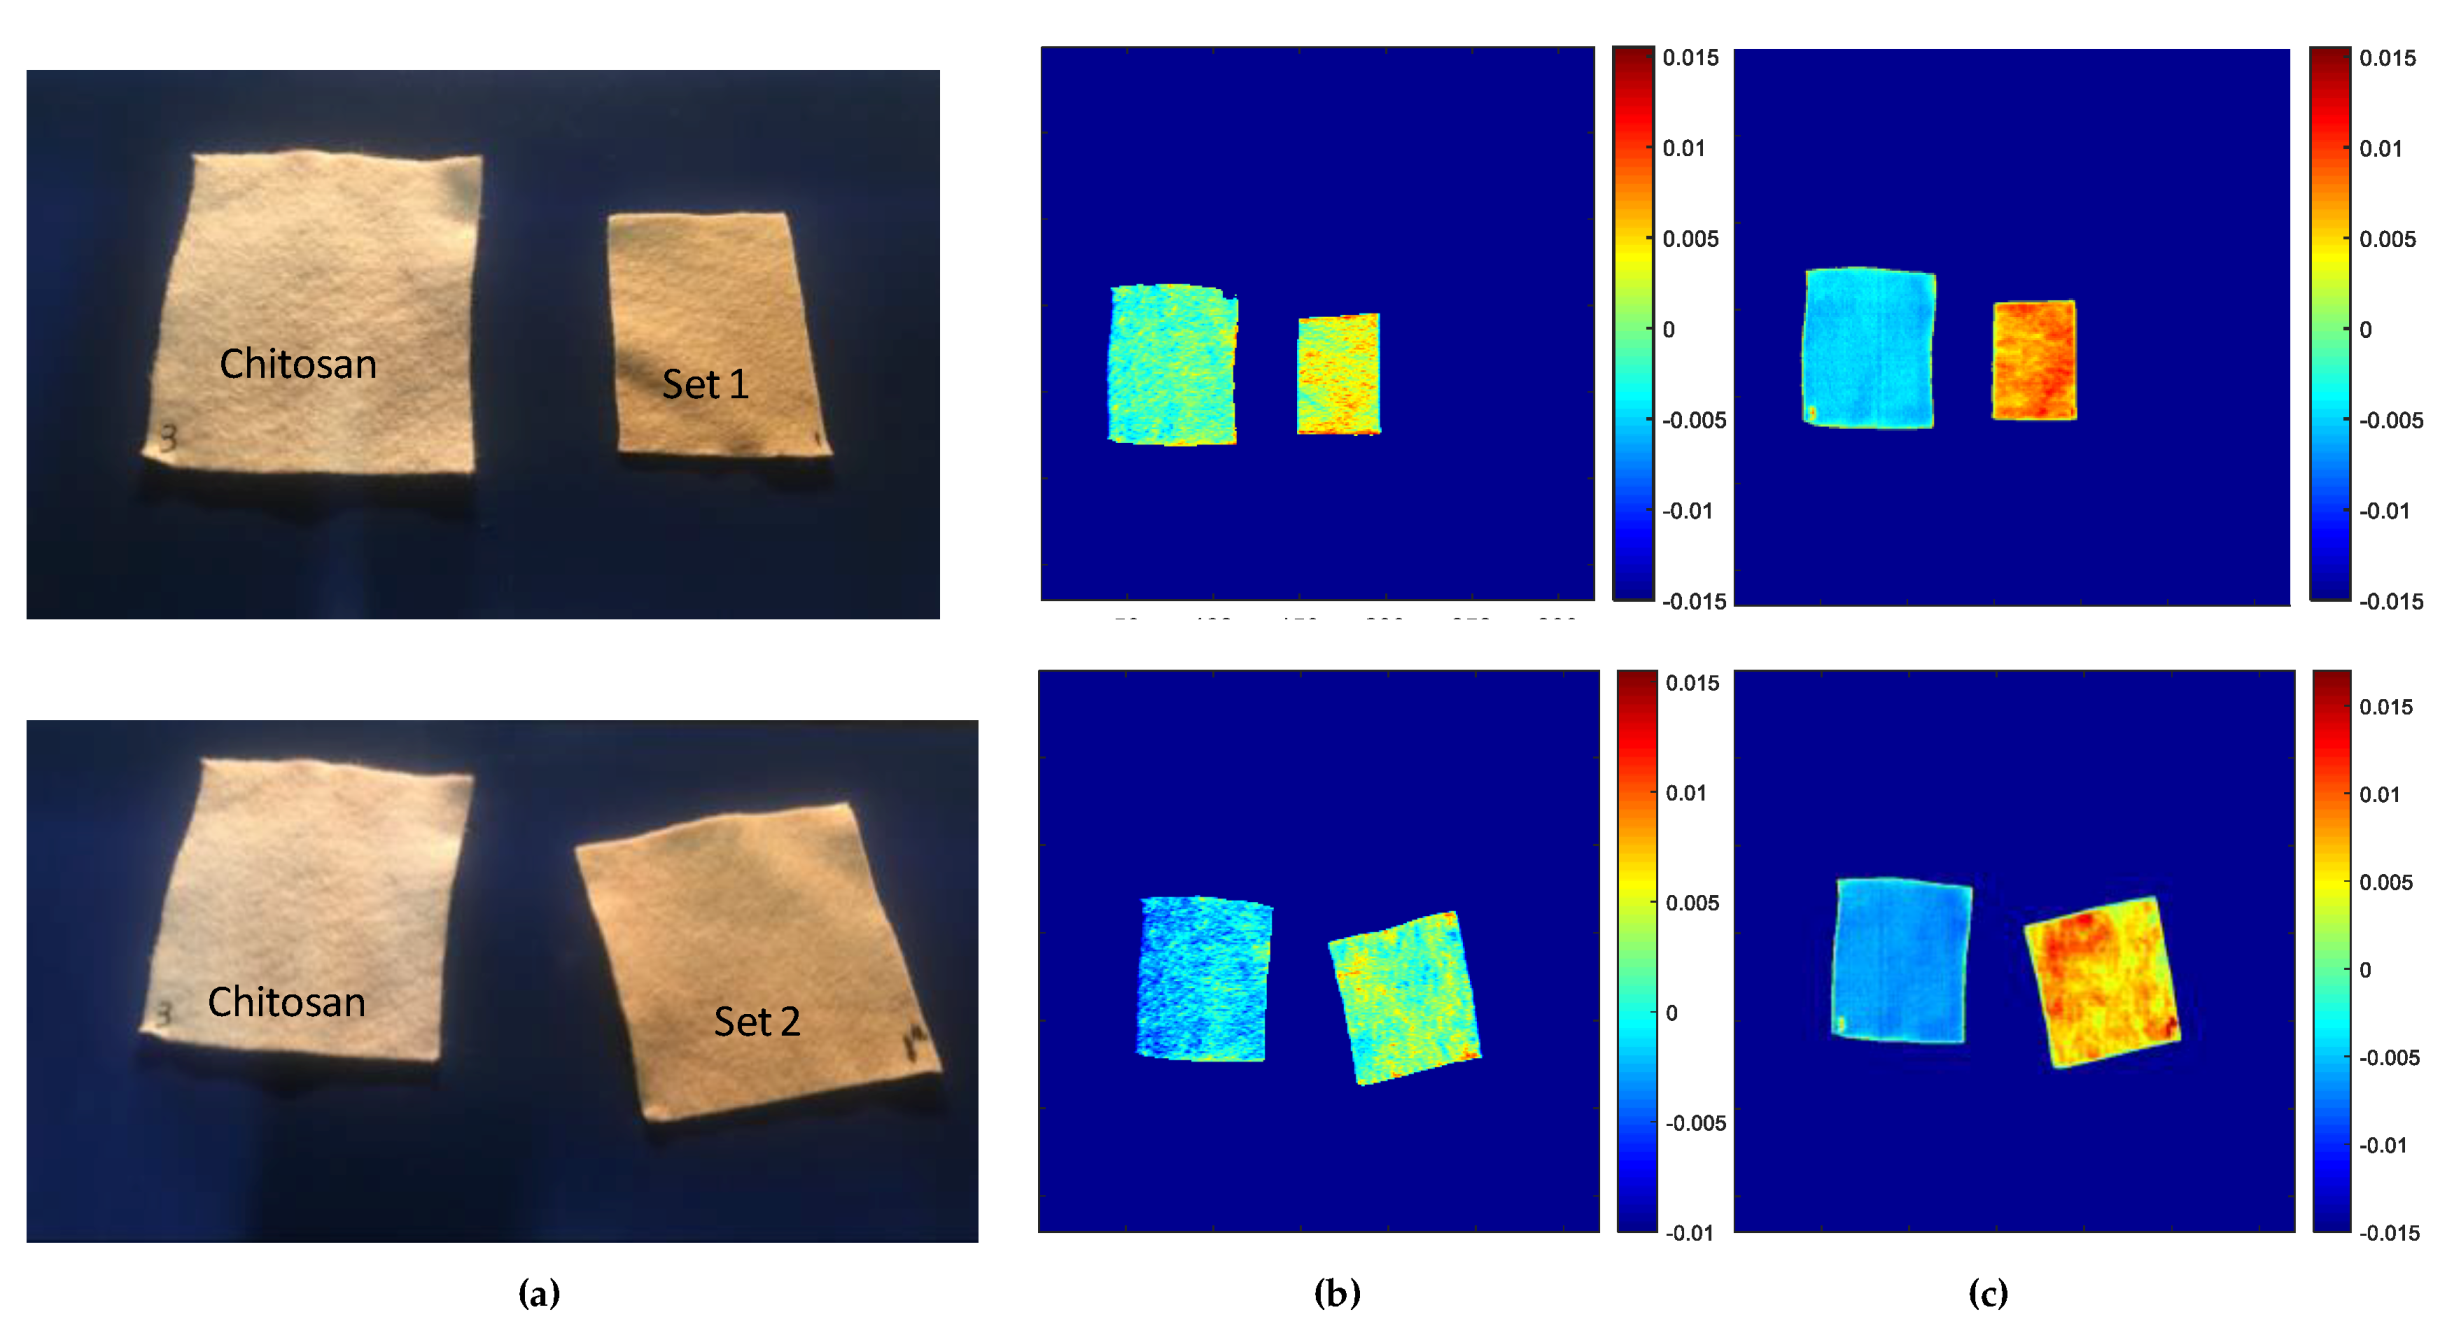
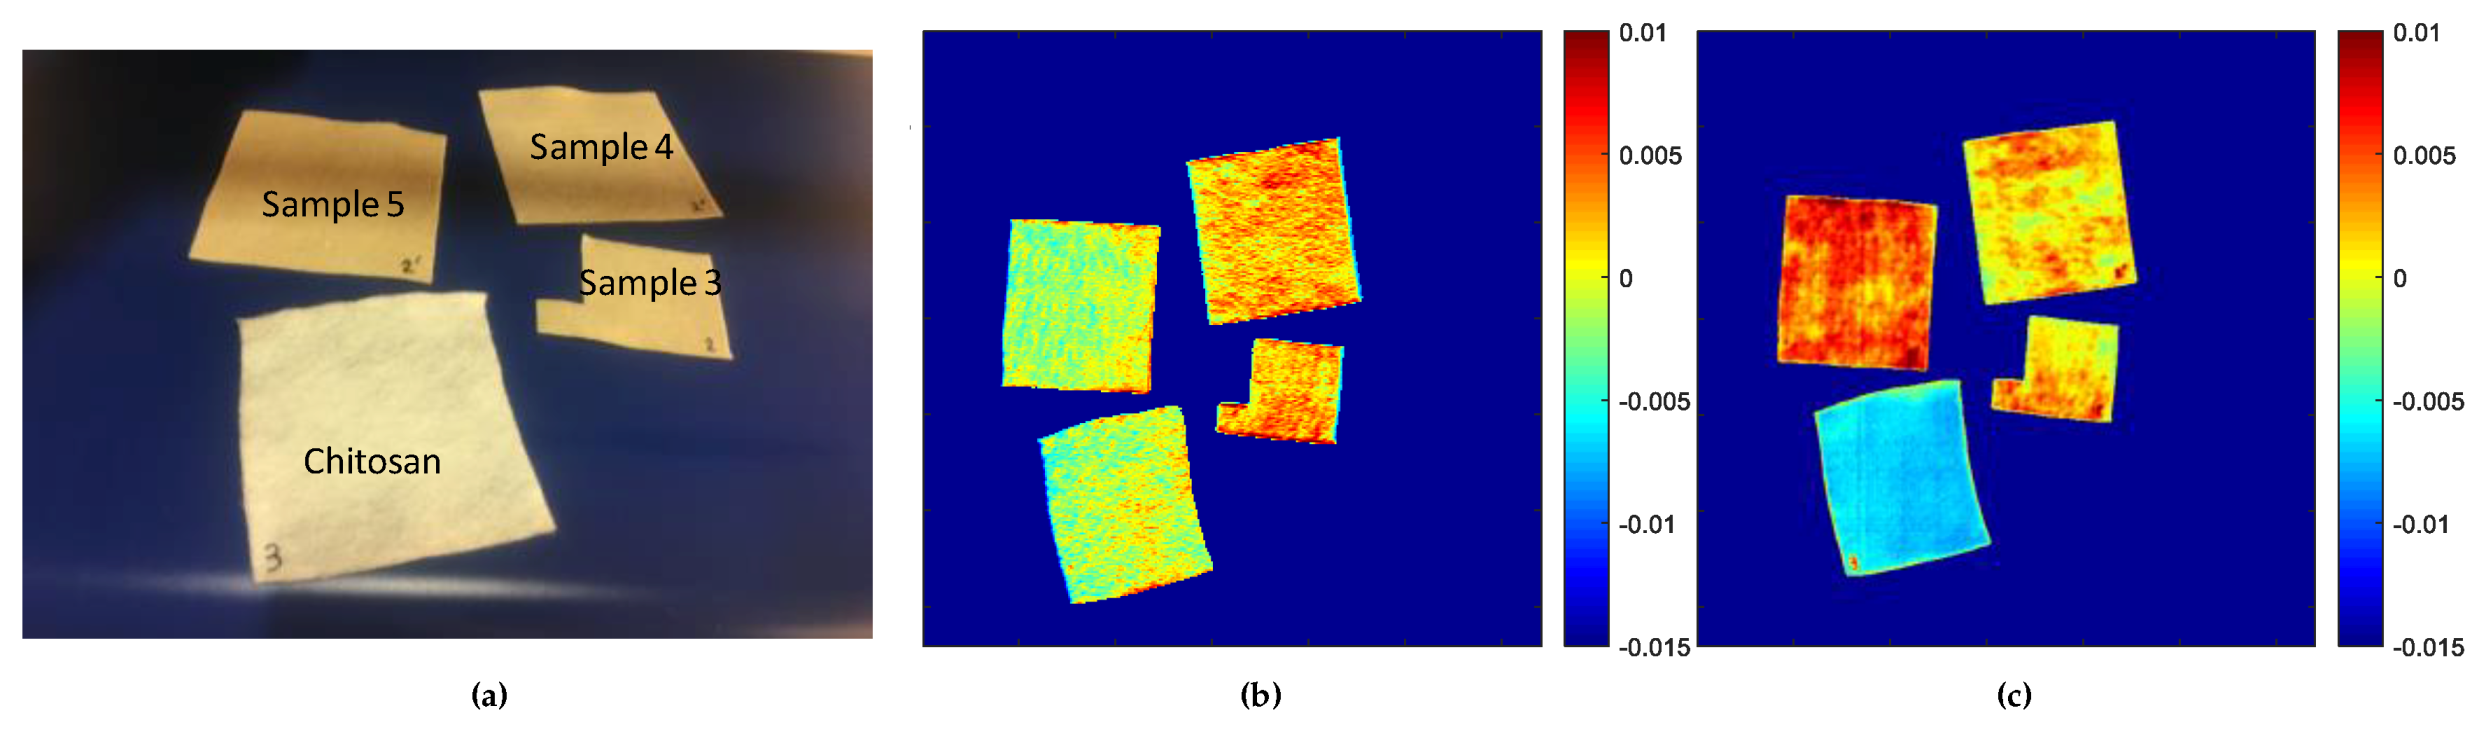
3.2.1. Evaluation of Chitosan Substrates
- Score Results
- Loading Results
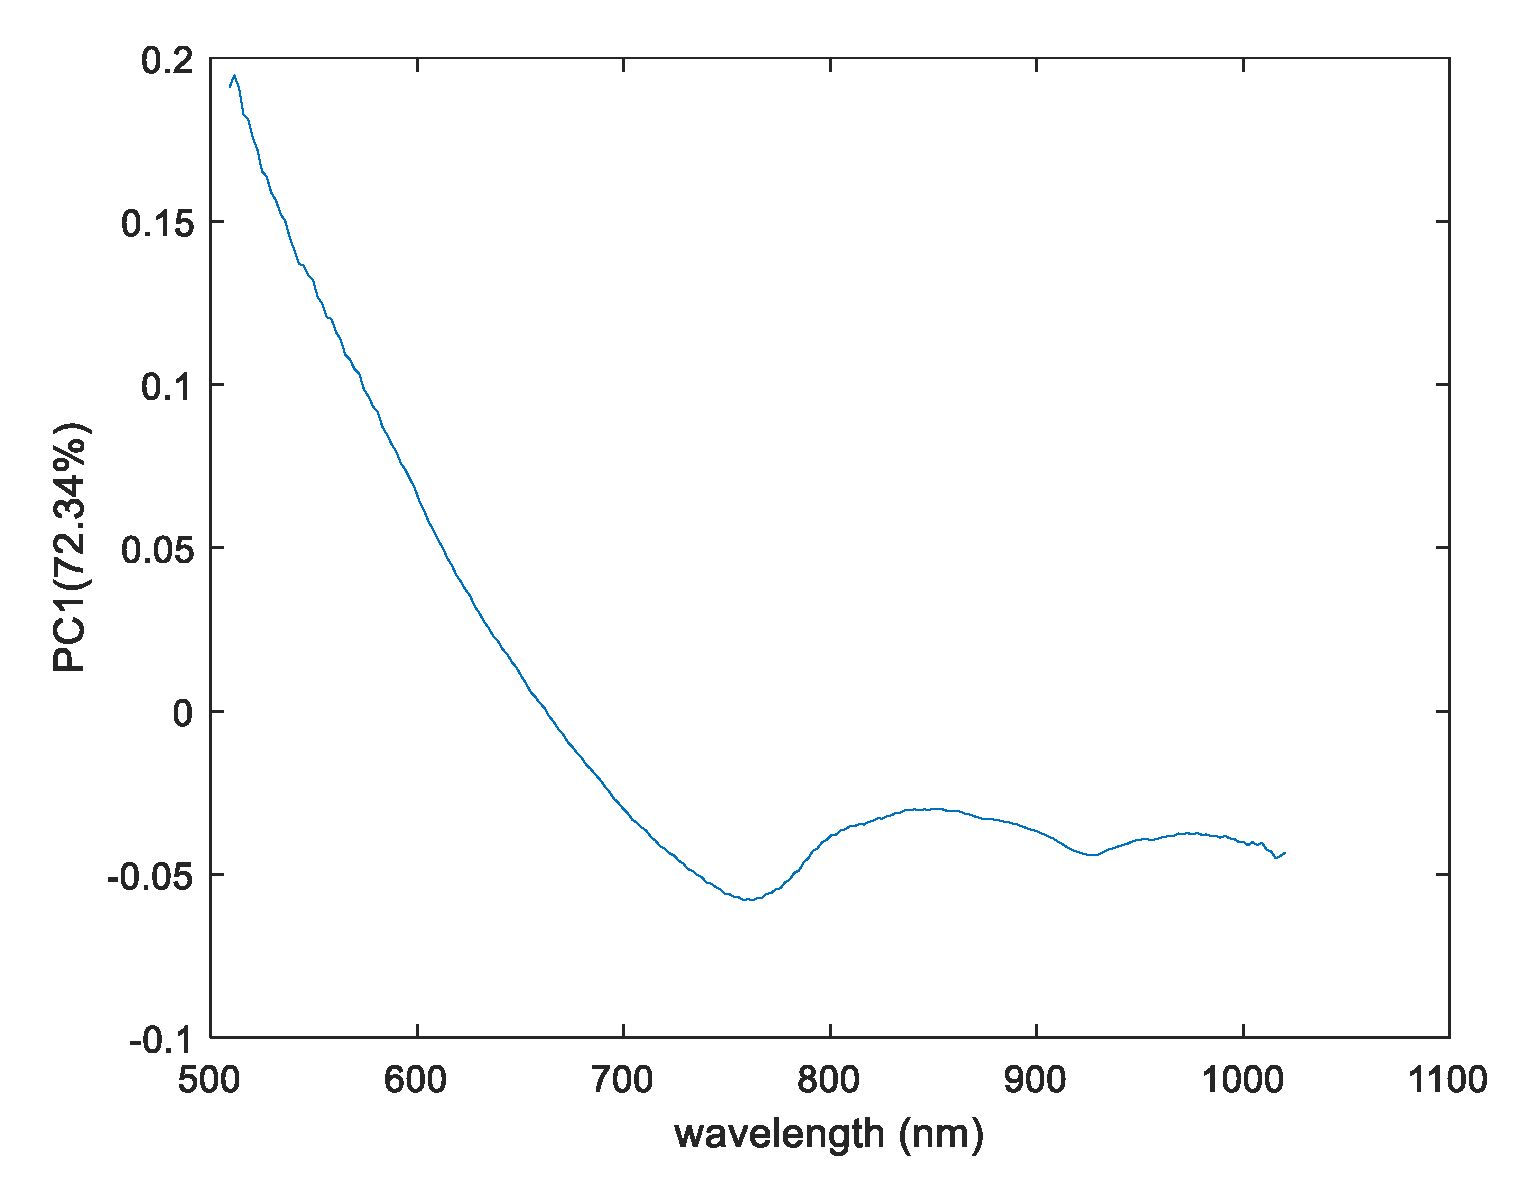
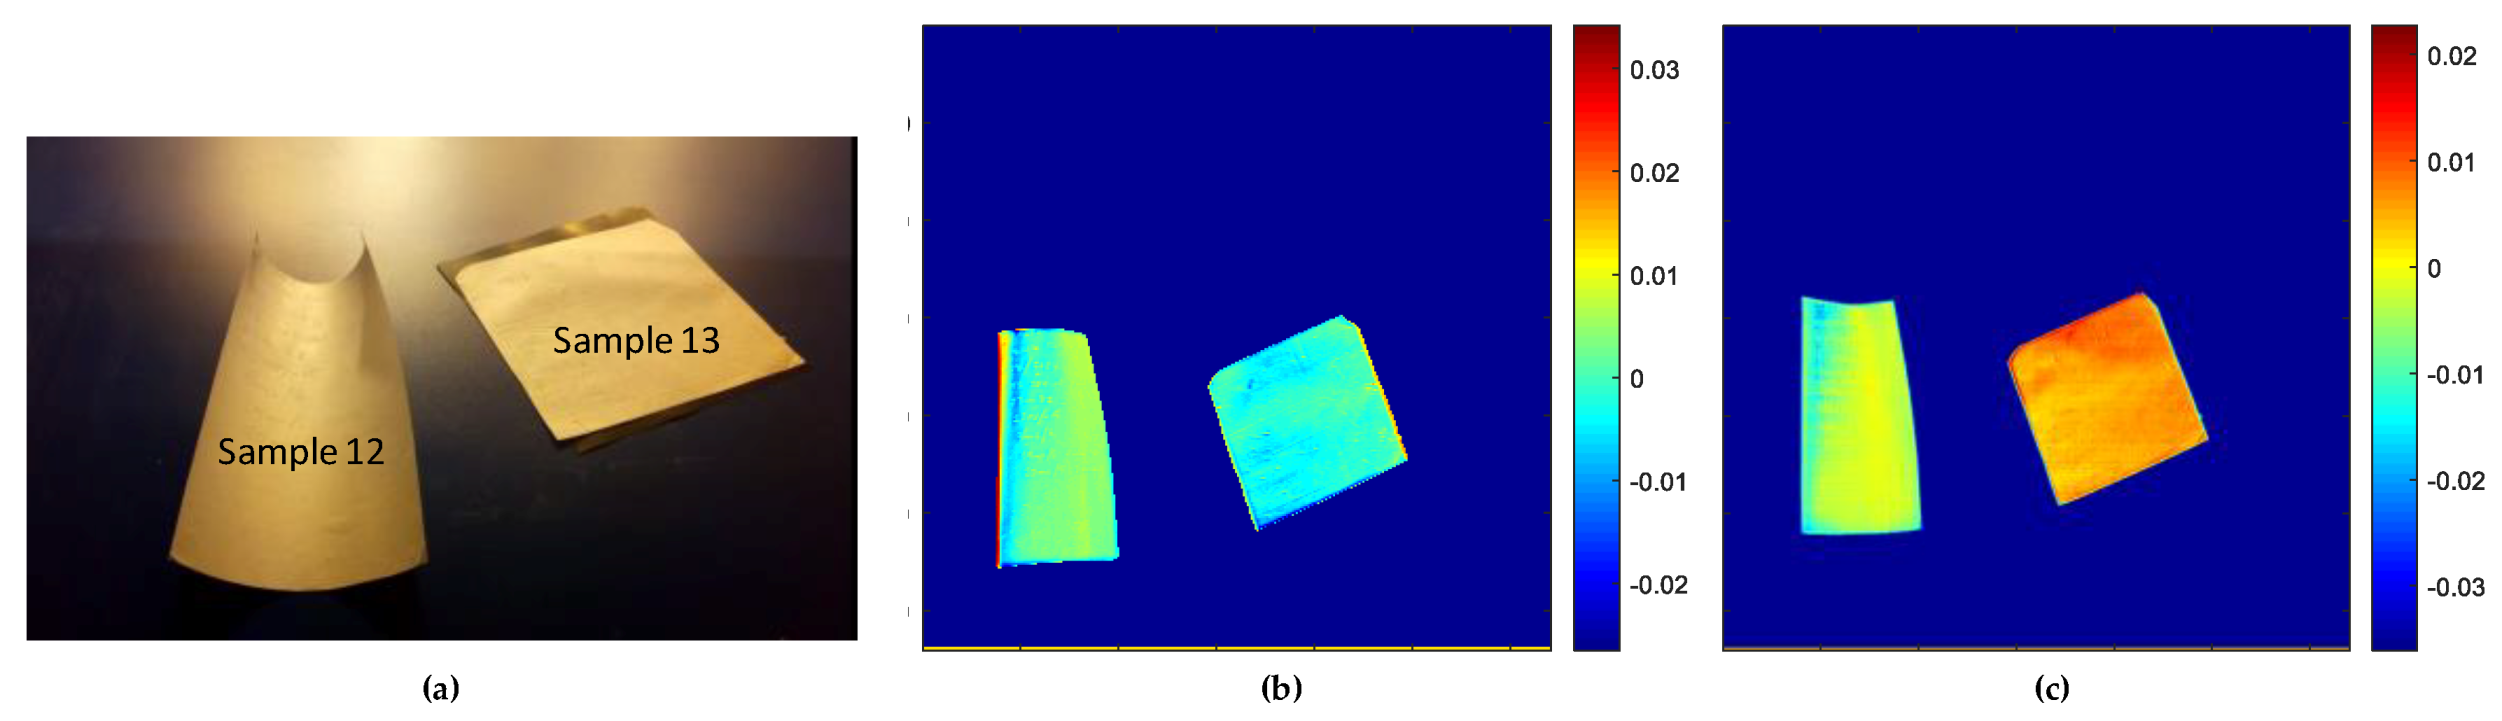
3.2.2. Evaluation of Pullulan Substrates
- Score Results
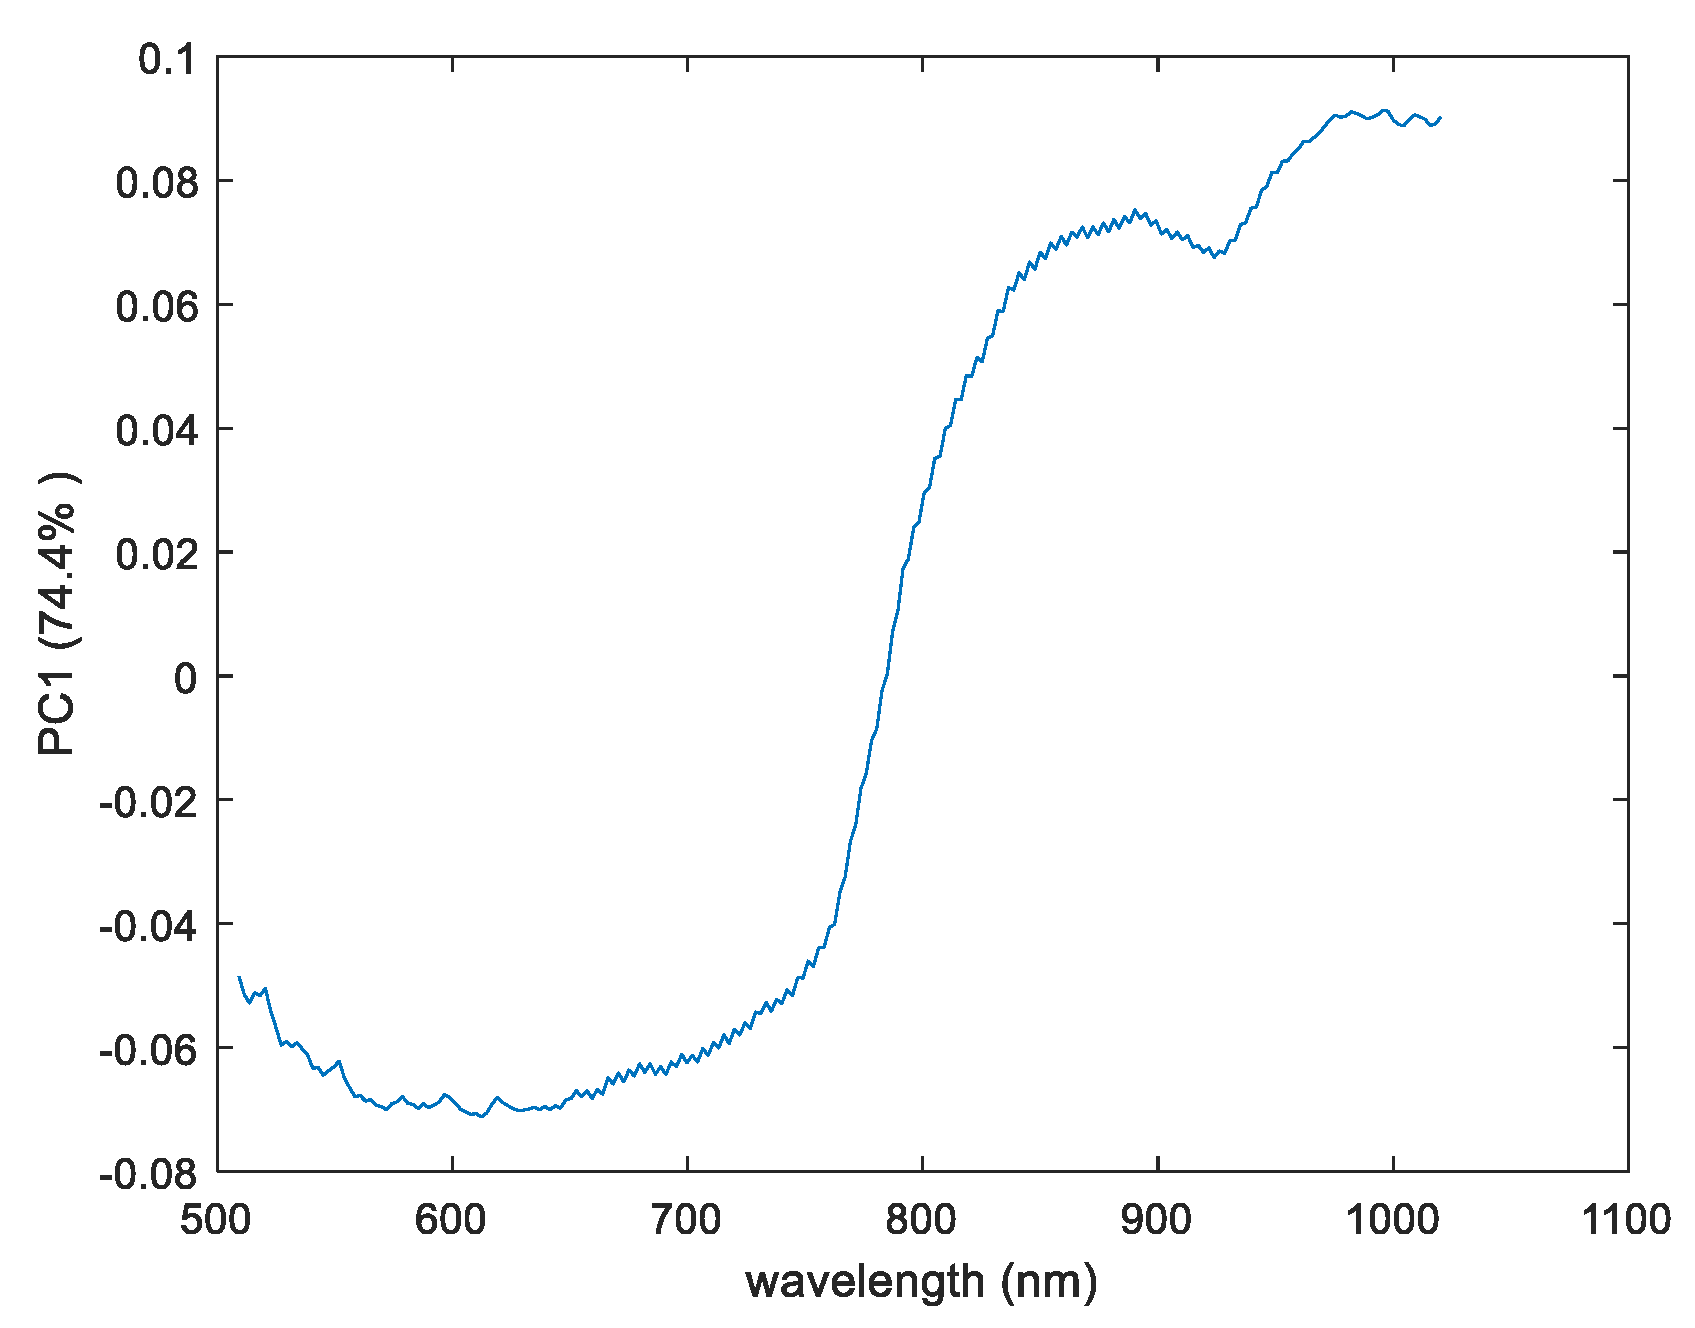
- Loadings Result
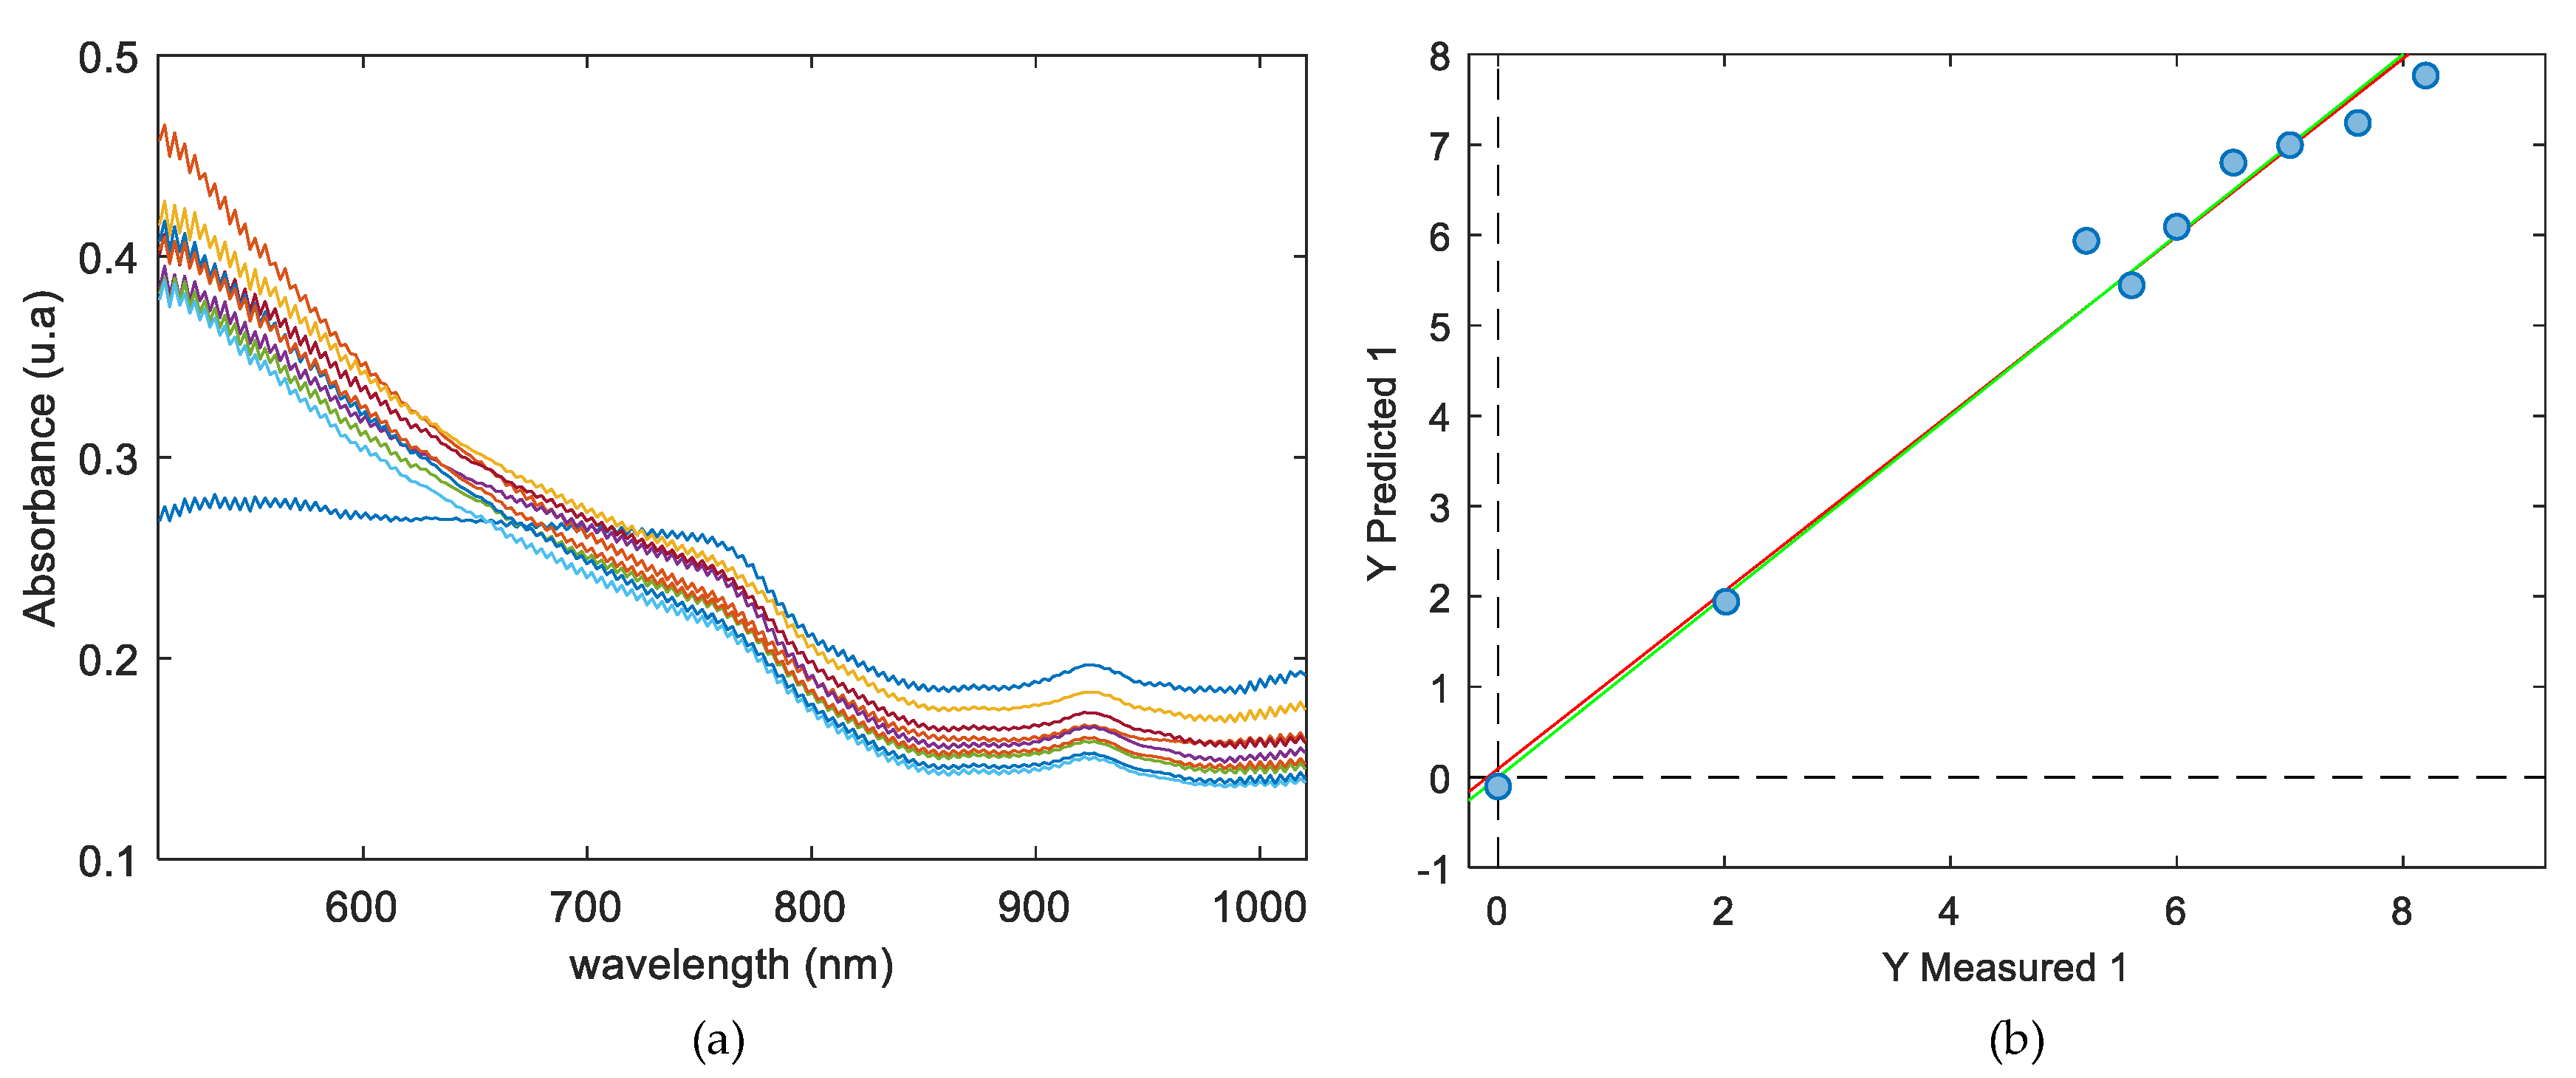
3.3. Quantitative Distribution Analysis (PCA Method)
4. Conclusions
5. Future Perspectives
Author Contributions
Funding
Acknowledgments
Conflicts of Interest
References
- Elieh-Ali-Komi, D.; Hamblin, M.R. Chitin and Chitosan: Production and Application of Versatile Biomedical Nanomaterials. Am. Math. Mon. 2004, 111, 915. [Google Scholar]
- Morganti, P.; Danti, S.; Coltelli, M.B. Chitin and lignin to produce biocompatible tissues. Res. Clin. Dermatol. 2018, 1, 5–11. [Google Scholar] [CrossRef]
- Danti, S.; Trombi, L.; Fusco, A.; Azimi, B.; Lazzeri, A.; Morganti, P.; Coltelli, M.-B. Chitin nanofibrils and nanolignin as functional agents in skin regeneration. Int. J. Mol. Sci. 2019, 20, 2669. [Google Scholar] [CrossRef] [Green Version]
- Sahana, T.G. Biopolymers: Applications in wound healing and skin tissue engineering. Mol. Biol. Rep. 2018, 45, 2857–2867. [Google Scholar] [CrossRef] [PubMed]
- Manley, M. Near-infrared spectroscopy and hyperspectral imaging: Non-destructive analysis of biological materials. Chem. Soc. Rev. 2014, 43, 8200–8214. [Google Scholar] [CrossRef] [Green Version]
- Cleve, E.; Bach, E.; Schollmeyer, E. Using chemometric methods and NIR spectrophotometry in the textile industry. Anal. Chim. Acta 2000, 420, 163–167. [Google Scholar] [CrossRef]
- Blanco, M.; Alcalá, M.; Planells, J.; Mulero, R. Quality control of cosmetic mixtures by NIR spectroscopy. Anal. Bioanal. Chem. 2007, 389, 1577–1583. [Google Scholar] [CrossRef]
- Lyon, R.C.; Lester, D.S.; Lewis, E.N.; Lee, E.; Lawrence, X.Y.; Jefferson, E.H.; Hussain, A.S. Near-Infrared Spectral Imaging for Quality Assurance of Pharma- ceutical Products: Analysis of Tablets to Assess Powder Blend Ho- mogeneity. AAPS PharmSciTech 2002, 3, 1–15. [Google Scholar] [CrossRef]
- Siche, R.; Vejarano, R.; Aredo, V.; Velasquez, L.; Saldaña, E.; Quevedo, R. Evaluation of Food Quality and Safety with Hyperspectral Imaging (HSI) Evaluation of Food Quality and Safety with Hyperspectral Imaging (HSI). Food Eng. Rev. 2016, 8, 306–322. [Google Scholar] [CrossRef]
- Plant, P. Hyperspectral Imaging for Mapping of Total Nitrogen Spatial Distribution in pepper plant. PLoS ONE 2014, 9, e116205. [Google Scholar]
- Nagaoka, T.; Kimura, Y. Quantitative cosmetic evaluation of long-lasting foundation using multispectral imaging. Ski. Res. Technol. 2019, 25, 318–324. [Google Scholar] [CrossRef]
- Ge, Y.; Atefi, A.; Zhang, H.; Miao, C.; Ramamurthy, R.K.; Sigmon, B.; Yang, J.; Schnable, J.C. High-throughput analysis of leaf physiological and chemical traits with VIS-NIR-SWIR spectroscopy: A case study with a maize diversity panel. Plant. Methods 2019, 15, 1–12. [Google Scholar] [CrossRef] [Green Version]
- Mäkelä, M.; Geladi, P. Hyperspectral near infrared imaging quantifies the heterogeneity of carbon materials. Sci. Rep. 2018, 8, 1–7. [Google Scholar] [CrossRef] [PubMed]
- Lambrechts, A.; Blanch-Perez-del-Notario, C. Hyperspectral Imaging for Textile Sorting and Recycling in Industry; 2016; Available online: http://www.resyntex.eu/images/downloads/HSI_2016_paper_final.pdf (accessed on 5 March 2020).
- Bureau, I. A Consumer Goods Product Comprising Chitin Nanofibrils, Lignin And A Polymer Or Co-Polymer Konsumgüterprodukt. U.S. Patent Application 14/854,121, 17 March 2016. [Google Scholar]
- Sarazyn, J. Method Of Preparation Of Chitin And Active Principle Complexes And Complexes Obtaned. U.S. Patent Application 14/111,886, 30 January 2014. [Google Scholar]
- Priyashantha, H.; Höjer, A.; Saedén, K.H.; Lundh, Å.; Johansson, M.; Bernes, G.; Geladi, P.; Hetta, M. Use of near-infrared hyperspectral (NIR-HS) imaging to visualize and model the maturity of long-ripening hard cheeses. J. Food Eng. 2020, 264, 109687. [Google Scholar] [CrossRef]
- Sacré, P.Y.; Lebrun, P.; Chavez, P.F.; De Bleye, C.; Netchacovitch, L.; Rozet, E.; Klinkenberg, R.; Ziemons, E. A new criterion to assess distributional homogeneity in hyperspectral images of solid pharmaceutical dosage forms. Anal. Chim. Acta 2014, 818, 7–14. [Google Scholar] [CrossRef] [PubMed] [Green Version]
- Yang, H.T.; Jiang, P. Scalable fabrication of superhydrophobic hierarchical colloidal arrays. J. Colloid Interface Sci. 2010, 352, 558–565. [Google Scholar] [CrossRef] [PubMed]
- Mitsutake, H.; Castro, S.R.; de Paula, E.; Poppi, R.J.; Rutledge, D.N.; Breitkreitz, M.C. Comparison of different chemometric methods to extract chemical and physical information from Raman images of homogeneous and heterogeneous semi-solid pharmaceutical formulations. Int. J. Pharm. 2018, 552, 119–129. [Google Scholar] [CrossRef]
- Suhandy, D.; Yulia, M. The Use of Partial Least Square Regression and Spectral Data in UV-Visible Region for Quantification of Adulteration in Indonesian Palm Civet Coffee. Int. J. Food Sci. 2017, 2017, 6274178. [Google Scholar] [CrossRef]
- Li, X.; Sun, C.; Zhou, B.; He, Y. Determination of Hemicellulose, Cellulose and Lignin in Moso Bamboo by Near Infrared Spectroscopy. Sci. Rep. 2015, 5, 17210. [Google Scholar] [CrossRef]
- Biniaś, W.; Biniaś, D. Application of ftnir spectroscopy for evaluation of the degree of deacetylation of chitosan fibres. Fibres Text. East. Eur. 2015, 23, 10–18. [Google Scholar]
- Cloutis, E.; Norman, L.; Cuddy, M.; Mann, P. Spectral reflectance (350-2500 nm) properties of historic artists’ pigments. II. Red-orange-yellow chromates, jarosites, organics, lead(-tin) oxides, sulphides, nitrites and antimonates. J. Near Infrared Spectrosc. 2016, 24, 119–140. [Google Scholar] [CrossRef]
- Hayem-Ghez, A.; Ravaud, E.; Boust, C.; Bastian, G.; Menu, M.; Brodie-Linder, N. Characterizing pigments with hyperspectral imaging variable false-color composites. Appl. Phys. A Mater. Sci. Process. 2015, 121, 939–947. [Google Scholar] [CrossRef]
- Elsoud, M.M.A.; el Kady, E.M. Current trends in fungal biosynthesis of chitin and chitosan. Bull. Natl. Res. Cent. 2019, 43, 1–12. [Google Scholar] [CrossRef] [Green Version]


| Substrates | Set of Samples | Number of Samples | Substrate Base + Active Compounds + Binders |
|---|---|---|---|
| Chitosan | Set 1 | Sample 1 | Chitosan + 2.68 g CN-NL/GA + 2% Silica |
| Set 2 | Sample 2 | Chitosan + 6 g CN-NL/GA + 2% Silica | |
| Set 3 | Sample 3 Samples 4 Sample 5 | Chitosan + 5 g (50% CN-NL/GA + 50% waxy bleached Shellac) + 2% Silica Chitosan + 5.4 g (50% CN-NL/GA + 50% waxy bleached Shellac) + 2% Silica Chitosan + 7 g (50% CN-NL/GA + 50% waxy bleached Shellac) + 2% Silica | |
| Set 4 | Sample 6 Sample 7 Sample 8 | Chitosan + 2.016 g (50% CN-NL/GA + 50% dewaxed bleached Shellac) + 2% silica Chitosan + 5.2 g (50% CN-NL/GA +50% dewaxed bleached Shellac) + 2% silica Chitosan + 5.6 g (50% CN-NL/GA + 50% dewaxed bleached Shellac) + 2% silica | |
| Set 5 | Sample 9 Sample 10 Sample 11 | Chitosan + 6.5 g (50% CN-NL/GA + 50% PEG) + 2% silica Chitosan + 7.6 g (50% CN-NL/GA + 50% PEG) + 2% silica Chitosan + 8.2 g (50% CN-NL/GA + 50% PEG) + 2% silica | |
| Pullulan | set 6 | Sample 12 Sample 13 | Pullulan + 8% CN-NL Pullulan only |
| Pretreatments | LVs | R2Cal | R2CV | RMSEC | RMSECV |
|---|---|---|---|---|---|
| non pretreatment | 3 | 0.721 | 0.278 | 1.335 | 2.435 |
| smoothing + normalize + mean centre | 3 | 0.973 | 0.743 | 0.418 | 1.485 |
| smoothing + SNV + mean centre | 3 | 0.977 | 0.624 | 0.384 | 4.820 |
| smoothing + baseline + mean centre | 3 | 0.983 | 0.857 | 0.333 | 0.993 |
© 2020 by the authors. Licensee MDPI, Basel, Switzerland. This article is an open access article distributed under the terms and conditions of the Creative Commons Attribution (CC BY) license (http://creativecommons.org/licenses/by/4.0/).
Share and Cite
A. Obisesan, K.; Neri, S.; Bugnicourt, E.; Campos, I.; Rodriguez-Turienzo, L. Determination and Quantification of the Distribution of CN-NL Nanoparticles Encapsulating Glycyrrhetic Acid on Novel Textile Surfaces with Hyperspectral Imaging. J. Funct. Biomater. 2020, 11, 32. https://0-doi-org.brum.beds.ac.uk/10.3390/jfb11020032
A. Obisesan K, Neri S, Bugnicourt E, Campos I, Rodriguez-Turienzo L. Determination and Quantification of the Distribution of CN-NL Nanoparticles Encapsulating Glycyrrhetic Acid on Novel Textile Surfaces with Hyperspectral Imaging. Journal of Functional Biomaterials. 2020; 11(2):32. https://0-doi-org.brum.beds.ac.uk/10.3390/jfb11020032
Chicago/Turabian StyleA. Obisesan, Kudirat, Simona Neri, Elodie Bugnicourt, Inmaculada Campos, and Laura Rodriguez-Turienzo. 2020. "Determination and Quantification of the Distribution of CN-NL Nanoparticles Encapsulating Glycyrrhetic Acid on Novel Textile Surfaces with Hyperspectral Imaging" Journal of Functional Biomaterials 11, no. 2: 32. https://0-doi-org.brum.beds.ac.uk/10.3390/jfb11020032