Article

Model-Based Design to Enhance Neotissue Formation in Additively Manufactured Calcium-Phosphate-Based Scaffolds

1
Biomechanics Research Unit, GIGA In Silico Medicine, University of Liège, 4000 Liège, Belgium
2
Prometheus, The R&D Division for Skeletal Tissue Engineering, KU Leuven, 3000 Leuven, Belgium
3
Department of Periodontology Oral Surgery and Implant Surgery, Faculty of Medicine, University Hospital of Liège, 4000 Liège, Belgium
4
Dental Biomaterials Research Unit, Faculty of Medicine, University of Liège, 4000 Liège, Belgium
5
Biomechanics Section, Department of Mechanical Engineering, KU Leuven, 3000 Leuven, Belgium
6
Department of Additive Manufacturing, Sirris Liège, 4100 Seraing, Belgium
7
Wishbone SA, 4400 Flemalle, Belgium
8
Faculty of Medicine, University of Namur, 5000 Namur, Belgium
*
Author to whom correspondence should be addressed.
These authors contributed equally to this work.
J. Funct. Biomater. 2023, 14(12), 563; https://0-doi-org.brum.beds.ac.uk/10.3390/jfb14120563
Submission received: 16 October 2023 / Revised: 19 November 2023 / Accepted: 30 November 2023 / Published: 3 December 2023
(This article belongs to the Section Synthesis of Biomaterials via Advanced Technologies)

Abstract

:
In biomaterial-based bone tissue engineering, optimizing scaffold structure and composition remains an active field of research. Additive manufacturing has enabled the production of custom designs in a variety of materials. This study aims to improve the design of calcium-phosphate-based additively manufactured scaffolds, the material of choice in oral bone regeneration, by using a combination of in silico and in vitro tools. Computer models are increasingly used to assist in design optimization by providing a rational way of merging different requirements into a single design. The starting point for this study was an in-house developed in silico model describing the in vitro formation of neotissue, i.e., cells and the extracellular matrix they produced. The level set method was applied to simulate the interface between the neotissue and the void space inside the scaffold pores. In order to calibrate the model, a custom disk-shaped scaffold was produced with prismatic canals of different geometries (circle, hexagon, square, triangle) and inner diameters (0.5 mm, 0.7 mm, 1 mm, 2 mm). The disks were produced with three biomaterials (hydroxyapatite, tricalcium phosphate, and a blend of both). After seeding with skeletal progenitor cells and a cell culture for up to 21 days, the extent of neotissue growth in the disks’ canals was analyzed using fluorescence microscopy. The results clearly demonstrated that in the presence of calcium-phosphate-based materials, the curvature-based growth principle was maintained. Bayesian optimization was used to determine the model parameters for the different biomaterials used. Subsequently, the calibrated model was used to predict neotissue growth in a 3D gyroid structure. The predicted results were in line with the experimentally obtained ones, demonstrating the potential of the calibrated model to be used as a tool in the design and optimization of 3D-printed calcium-phosphate-based biomaterials for bone regeneration.

1. Introduction

In recent years, bone regeneration strategies have advanced significantly in clinical practice. While autologous bone grafting remains a gold standard due to its minimal risk of immune rejection and disease transmission, it presents drawbacks, including donor site morbidity, a limited donor volume, and shaping difficulties [1,2]. Ideal bone regeneration materials necessitate osteogenesis, osteoconduction, and osteoinduction. Synthetic biomaterials are gaining attraction as bone scaffolds due to the absence of donor site morbidity and due to their favorable biocompatibility, biodegradability, and foreseeable immunological response [3,4,5,6]. Notably, porous scaffolds, particularly those composed of calcium phosphates (CaPs), play a pivotal role in bone tissue regeneration. CaPs, like hydroxyapatite (HAp) and tricalcium phosphate (TCP), exhibit similarities to bone’s inorganic composition (see review by Hou et al. [7]). With the use of additive manufacturing technologies (AMTs), patient-specific implants have become a (clinical) reality [8,9]. Their design is based on a range of considerations, including the printing technology, the material, and the macroscopic mechanical requirements [7]. The design of microscopic properties has typically been dominated by considerations of interconnectivity, porosity, and pore size. However, in recent years, local curvature has been shown to be an important factor in driving bone regeneration [10,11,12].
When optimizing scaffold designs, in silico modelling (i.e., the use of computer modelling and simulation) is a key approach to limiting the amount of in vivo testing required, in line with the 3Rs principle (reduce, refine, and replace animal tests), by selecting the most promising designs based on the predictions made by the model. A variety of models of bone regeneration in silico have been proposed in the literature, with most of them corroborated on the basis of historical or animal experiments. In addition, most of these models focus on regeneration without a support structure [13] or on a predefined shape [14,15,16] rather than using the model to select the optimal internal architecture of the structure. On the other hand, earlier approaches aiming for a more objective optimization often focused on optimizing the mechanical properties of the structure without taking into account internal form or biological requirements [17,18]. Due to the recent increase in attention for curvature-based biology in general [19], scaffold research has also turned to local curvature to optimize the internal design of bone substitutes to maximize neotissue formation [20,21,22,23,24,25,26]. In several cases, dedicated validation experiments have been performed, consisting mostly of in vitro cell culture experiments on titanium, hydroxyapatite, or polycaprolactone 2D and 2D+ substrates.
In this study, we aim to improve the design of calcium-phosphate-based additively manufactured scaffolds by using a combination of in silico and in vitro tools. We build on our prior work related to the curvature-based modeling of neotissue growth in additively manufactured titanium implants [22] in order to account for the effect of the use of active CaP-based biomaterials. To recalibrate the model, we have designed a dedicated in vitro experiment allowing us to evaluate the effect of pore shape and pore size on neotissue growth in scaffolds produced with HAp, TCP, and an HAp–TCP blend (biphasic calcium phosphate, BCP). After running a Bayesian optimization for the model recalibration, we test the predictive capacity of the model by performing a new neotissue formation experiment, both in silico and in vitro, in a 3D gyroid structure. The observed correspondence between the in vitro and in silico results is an indicator of the potential of the model to be used in the design and optimization of more complex 3D bone tissue engineering scaffolds.

2. Materials and Methods

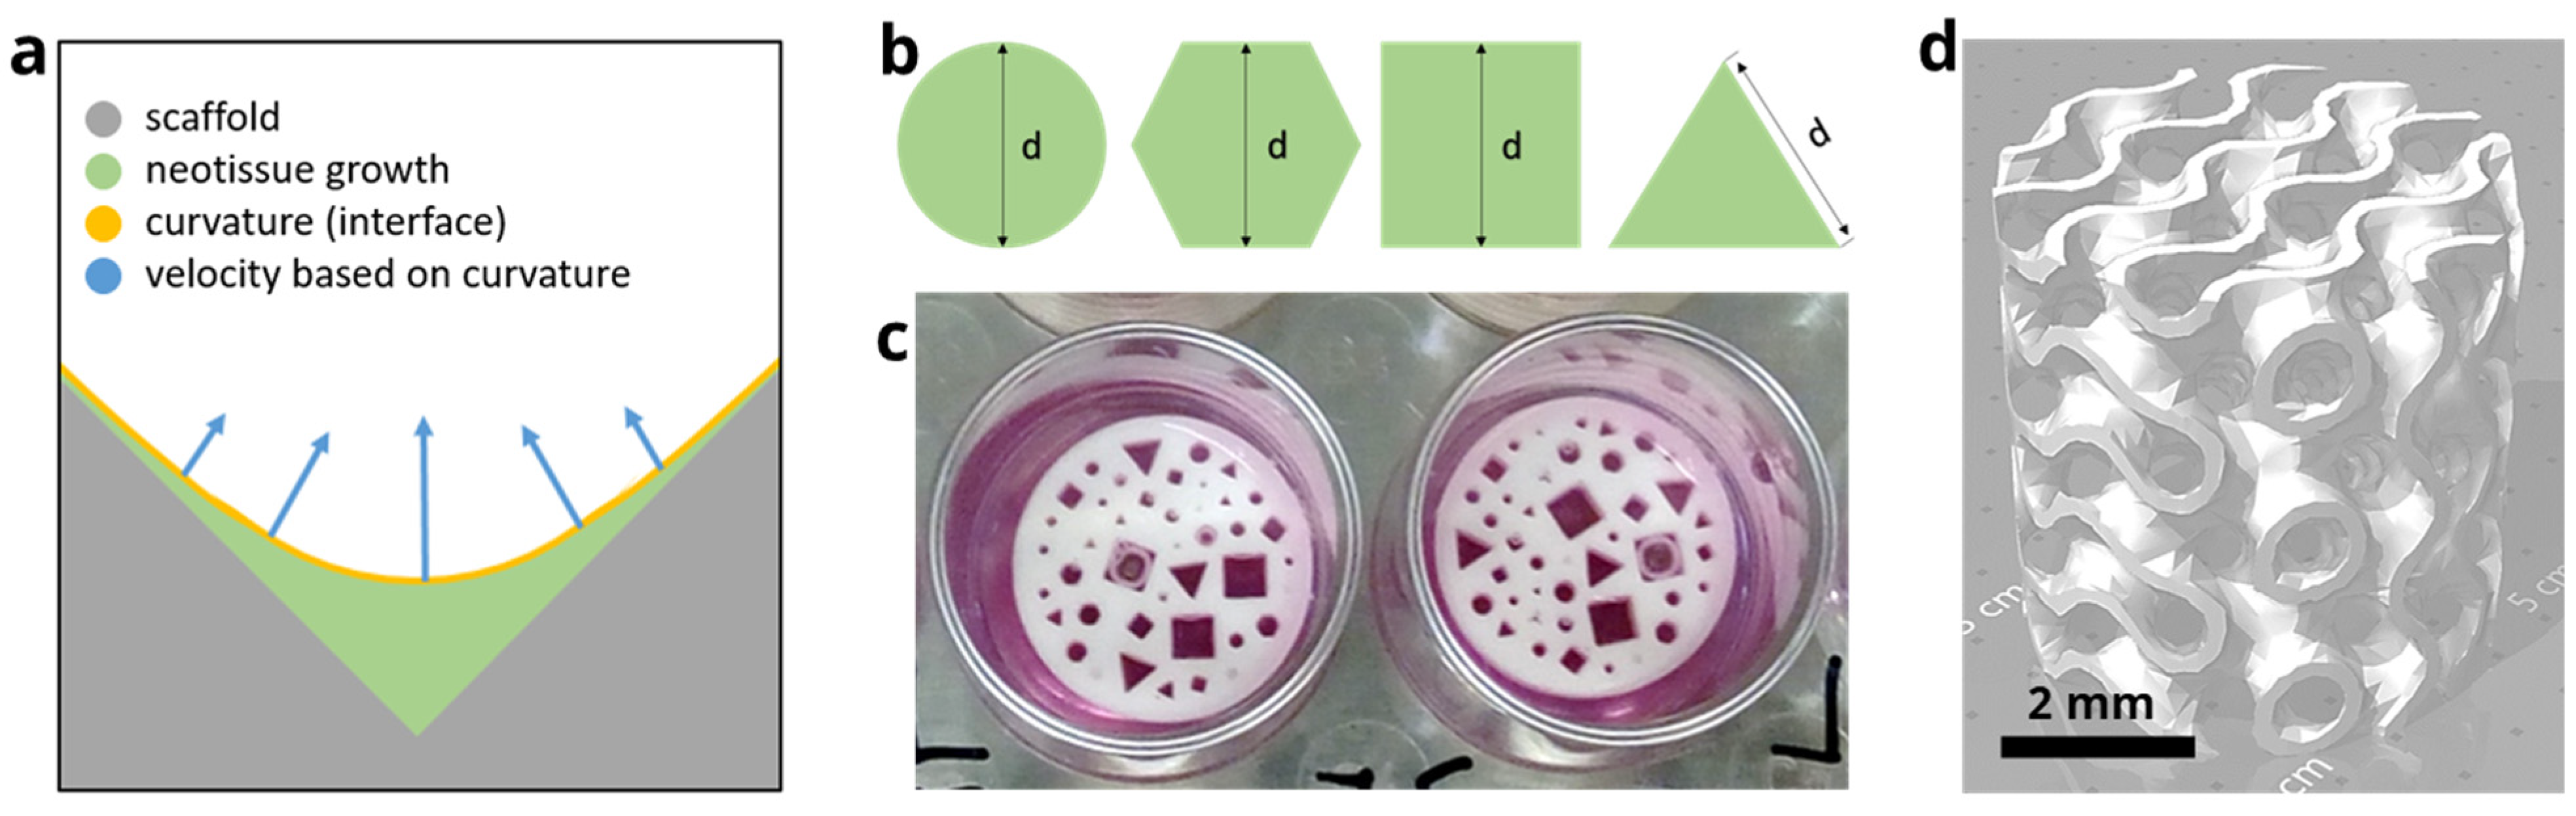
2.1. In Silico Model

This section describes the setup, implementation, and optimization of the in silico model for curvature-based neo-tissue growth applied to CaP-based biomaterials. The effect of the released ions is not considered explicitly in the developed model but instead is captured by the changes in the overall neotissue growth rate during the model calibration phase.

2.1.1. Level Set Method

The level set method (LSM) is a mathematical approach for tracking moving interfaces, in which the parameterization of curves and surfaces can be conveniently performed to study the change in the morphology and topology of objects [27]. We have previously used the LSM to implement curvature-based neotissue growth in titanium scaffolds [22], as, amongst other advantages, it can effectively be used to calculate the average curvature as a guiding factor for tissue growth simulations.
A signed distance function (φ) describes the distance of each node of the desired domain to the interface. The zero iso-surface determines the moving interface. In the current study, the interface divides the computational domain into two subdomains, neotissue, and void space, according to the following definition:
  φ > 0   i n   Ω n t φ < 0   i n   Ω v φ = 0   i n   Γ
with Ω denoting the domain of interest and Ωnt and Ωv denoting the neotissue and void space subdomains, respectively. The interface between Ωnt and Ωv is denoted by Γ. The LSM formalism for tracking the interface moving with the growth velocity, vG, can be expressed by the convection equation, describing how the level set function, φ, evolves in the entire domain, Ω, over time:
φ t + v G · φ = 0   i n   Ω
This equation is solved with a homogenous Neumann boundary condition ( φ / n = 0), with n being the normal to the computational domain, Ω. The calculation of the interface advection velocity, v G = V G n Γ (with n Γ = φ | φ | ), is related to the local mean curvature, κ ( κ = · n Γ ), of the neotissue interface (shown in Figure 1a).
V G = A   · g κ · n Γ g κ = κ ,     i f   κ > 0 0 ,     i f   κ 0
A is a parameter to control the curvature effect, determined from experimental data in a fitting procedure. The negative sign in the definition of g( κ ) comes from the fact that, according to our definition of φ , the normal, n Γ , points towards the neotissue, so growth has to be opposite φ .

2.1.2. Implementation of the Model

The curvature-based model was solved numerically using the finite element method, implemented in the open-source partial differential equation (PDE) solver FreeFEM (v4.6, Laboratoire Jacques-Louis Lions, Université Pierre et Marie Curie, Paris, France) [28]. The computational domain consisted of individual beams of 2 mm height and triangular, squared, hexagonal, or circular cross-sections of diameters 0.5 mm, 0.7 mm, 1 mm, and 2 mm (Figure 1). The geometries and their corresponding computational mesh were created using the SALOME platform (v9.8.0, Salome-platform.org, France) [29], and all the other pre-processing steps were performed in FreeFEM. The computational mesh was generated using a set of first-order tetrahedral elements, and the convergence was checked.
To initialize the LSM, an initial distance function, φ0, was defined in the domain Ω at the boundary of the scaffold. However, the level set function, φ, is not differentiable where the gradient is discontinuous, meaning that the normal, n Γ , and the curvature, κ, cannot be properly defined everywhere in the domain. A solution is to add a small numerical diffusion term to the expected direction, n Γ , and curvature, κ. The specific mathematical expression is as follows:
n Γ = φ | φ | + ε Δ n Γ κ = · n Γ + ε Δ κ
During the verification process, a comparison of images generated by different diffusion values showed that the smaller the value of ε, the greater the oscillation of the curvature calculation and the worse the smoothness of the boundary. Conversely, the larger the value of ε, the larger the influence of the numerical diffusion, generating erroneous results. In [22], the parameter ε was fixed at 1 × 10⁻⁴ based on a comparison between the numerical and analytical solutions. In the process of initializing the level set function φ, the open-source software mshdist (v1.0, by Charles Dapogny (Université Joseph Fourier) and Pascal Frey (Université Pierre et Marie Curie), France) [30] was used to avoid the level set distortion that the distance function in the model application may cause.
To reduce the computational cost, the method of characteristics can be used in FreeFEM [31]. This method reduces a partial differential equation (PDE) to a system of ordinary differential equations (ODE) along curves called characteristics. The resolution of these ODEs along those curves leads to the solution of the original PDE. To further improve the performance of the model and decrease the execution time of simulations, model parallelization was taken into account. Parallelization was considered for two main stages of the computation pipeline: assembling the matrices and solving the resulting linear system of equations. As part of a standard finite element computation, assembling the matrices requires extensive numerical integration on each element. This can be conducted in parallel by distributing elements among the available nodes. In this regard, a primary domain decomposition technique using the Message Passing Interface (MPI) was implemented to assign a subset of elements to each available computing node. After performing the integration, the results of all nodes are gathered to assemble the linear system of equations. In the current implementation, an MUMPS sparse direct solver (v5.5.1, Mumps Technologies SAS, Lyon, France) [32] was used to solve the linear system. The post-processing of the results was carried out using ParaView (v5.11, Kitware Inc., New York, NY, USA) [33].

2.1.3. Optimization of the Velocity Control Value

Obtaining the correct values for the parameters of a computational model can be pretty challenging and may require dedicated experimental input. In this regard, defining an efficient inverse problem can help save time and resources when estimating the unknown parameters. In this study, a dedicated in vitro experiment was set up, and the results were used in a Bayesian optimization routine [34] to calibrate the parameter A. The objective function of the inverse problem was the root-mean-square error of the difference between the predicted and experimentally obtained values of tissue growth rate over 21 days.

2.2. In Vitro Experiments

2.2.1. Design of the Disk

In order to efficiently test a range of pore geometries and sizes, a disk was designed with a height of 2 mm and a diameter of 14 mm, fitting the well of a 24-well plate. In the disk, channels were included, with four basic cross-sections (triangle, square, hexagon, and circle) and three sizes. They were 0.5 mm, 0.7 mm, and 1 mm for the circle and hexagon and 0.7 mm, 1 mm, and 2 mm for the square and triangle, as with the latter shapes, the smallest size could not be accurately produced. Each combination of cross-sectional shape and size was repeated three times. All channels were arranged randomly on the disk, with at least 60 µm in between them. Table 1 provides a summary of the experimental setup.

2.2.2. Design of the Gyroid Scaffold

Upon confirmation of the curvature-based growth principle in CaP-based scaffolds (see results section), a 3D structure was designed that allowed us to test the potential of the in silico model to predict neotissue growth in more complex geometries. Triply periodic minimal surface structures in general and gyroid structures in particular provide an environment with a well-controlled curvature and a narrow curvature distribution [24]. Gyroid structures (or triply-periodic minimal surfaces in general) have received an increasing amount of attention over the last couple of years for this reason. In addition to being interesting from a biological/mathematical perspective, they are also very manufacturing-friendly, as the geometry varies very smoothly from one layer to the next.

2.2.3. Production of the Disk and Scaffold

The disks were produced through stereolithography using different CaP-based pastes from Cerhum (Liège, Belgium): pure hydroxyapatite (HAp100), pure tricalcium phosphate (TCP100), and a 60/40 mixture of the two (HAp60 TCP40), also known as BCP. Stereolithography is an additive manufacturing process that builds polymer parts in 3D by photocuring a liquid or paste. Here, the bioceramic powder was carefully mixed with organic components (polyfunctional acrylic resins and a UV photoinitiator) in order to obtain a viscous paste material with roughly 50% solid loading to be processed by SLA (Cerhum and Sirris, Liège, Belgium). During manufacturing, the suspension was spread on the working area in thin layers of 50 µm, after which UV light was projected by a digital light onto the paste surface. Subsequently, the samples were subjected to a thermal cycle (1030 °C for TCP100 and HAp60-TCP40 and 1130 °C for HAp100 for 5 h), allowing for the removal of the resin and the densification of the ceramic, as reported and discussed elsewhere [10,24,35,36,37]. After manufacturing, the parts were rinsed and ultrasonically cleaned in an 80% ethanol bath for 10 min. The same process was followed for the manufacturing of the 3D gyroid structure (HAp100).

2.2.4. Cell Culture and Analysis

After production, the disks were sterilized with an autoclave at 121 °C for 15 min. Prior to the cell culture experiment, the disks were pre-wetted for 3 h with growth medium (GM) composed of Prigrow II Medium + Fetal Bovine Serum (FBS) to a final concentration of 10% + hydrocortisone to 10−6 mol/L and Penicillin/Streptomycin Solution to a final concentration of 1%. After prewetting, the disks were air-dried for 1 h under sterile conditions. Then, 600,000 hTERT-Immortalized Bone Mesenchymal Stromal Cells (hTERT-BMSCs, Applied Biological Materials Inc. Richmond, Canada) were drop-seeded onto each disk suspended in a 200 µL cell suspension and subsequently incubated statically for 4 h at 37 °C to facilitate cell attachment. The amount of cells was chosen to ensure a good baseline coverage of the disk with cells without having open spaces on the disk. Then, the cell-seeded scaffolds were transferred to a 24-well plate and cultured in GM for 3 weeks. The medium was refreshed three times a week. The cell viability and kinetics of the neotissue (cell+ECM) channel filling were evaluated after 10 and 21 days of in vitro culture for the different pore geometries using fluorescence microscopy imaging (Live–Dead viability/cytotoxicity staining (Invitrogen, Thermo Fisher Scientific inc., Waltham, MA, USA) and DAPI/Phalloidin). Disks were rinsed with 1 mL of PBS, incubated in the staining solution (0.5 mL of calcein AM and 2 mL of ethidium homodimer in 1 mL of PBS) for 20 min under standard cell culture conditions, and finally imaged using an Olympus IX83 inverted fluorescence microscope (Evident, Tokyo, Japan).
Similar steps were followed for the 3D structure. First, 200,000 cells were drop-seeded and allowed to attach for 3 h prior to the start of the static culture. Neotissue formation was evaluated at days 10 and 21 using contrast-enhanced nanofocus Computed Tomography (nanoCT) imaging with an 80% Hexabrix 320 solution (Guerbet, Villepinte, France) as a contrast agent (applied for 20 min) to visualize the neotissue inside the scaffold. NanoCT scans of the samples were acquired using the GE Nanotom-M (Phoenix Nanotom® M, GE Measurement and Control Solutions, Billerica, MA, USA). The scaffold was scanned with a diamond–tungsten target, mode 0, a 500 msec exposure time, 1 frame average, 0 image skips, 1800 images, and a 0.2 mm aluminum filter. The constructs were scanned at a voltage of 70 kV and a current of 150 μA, resulting in a voxel size of 4 μm.

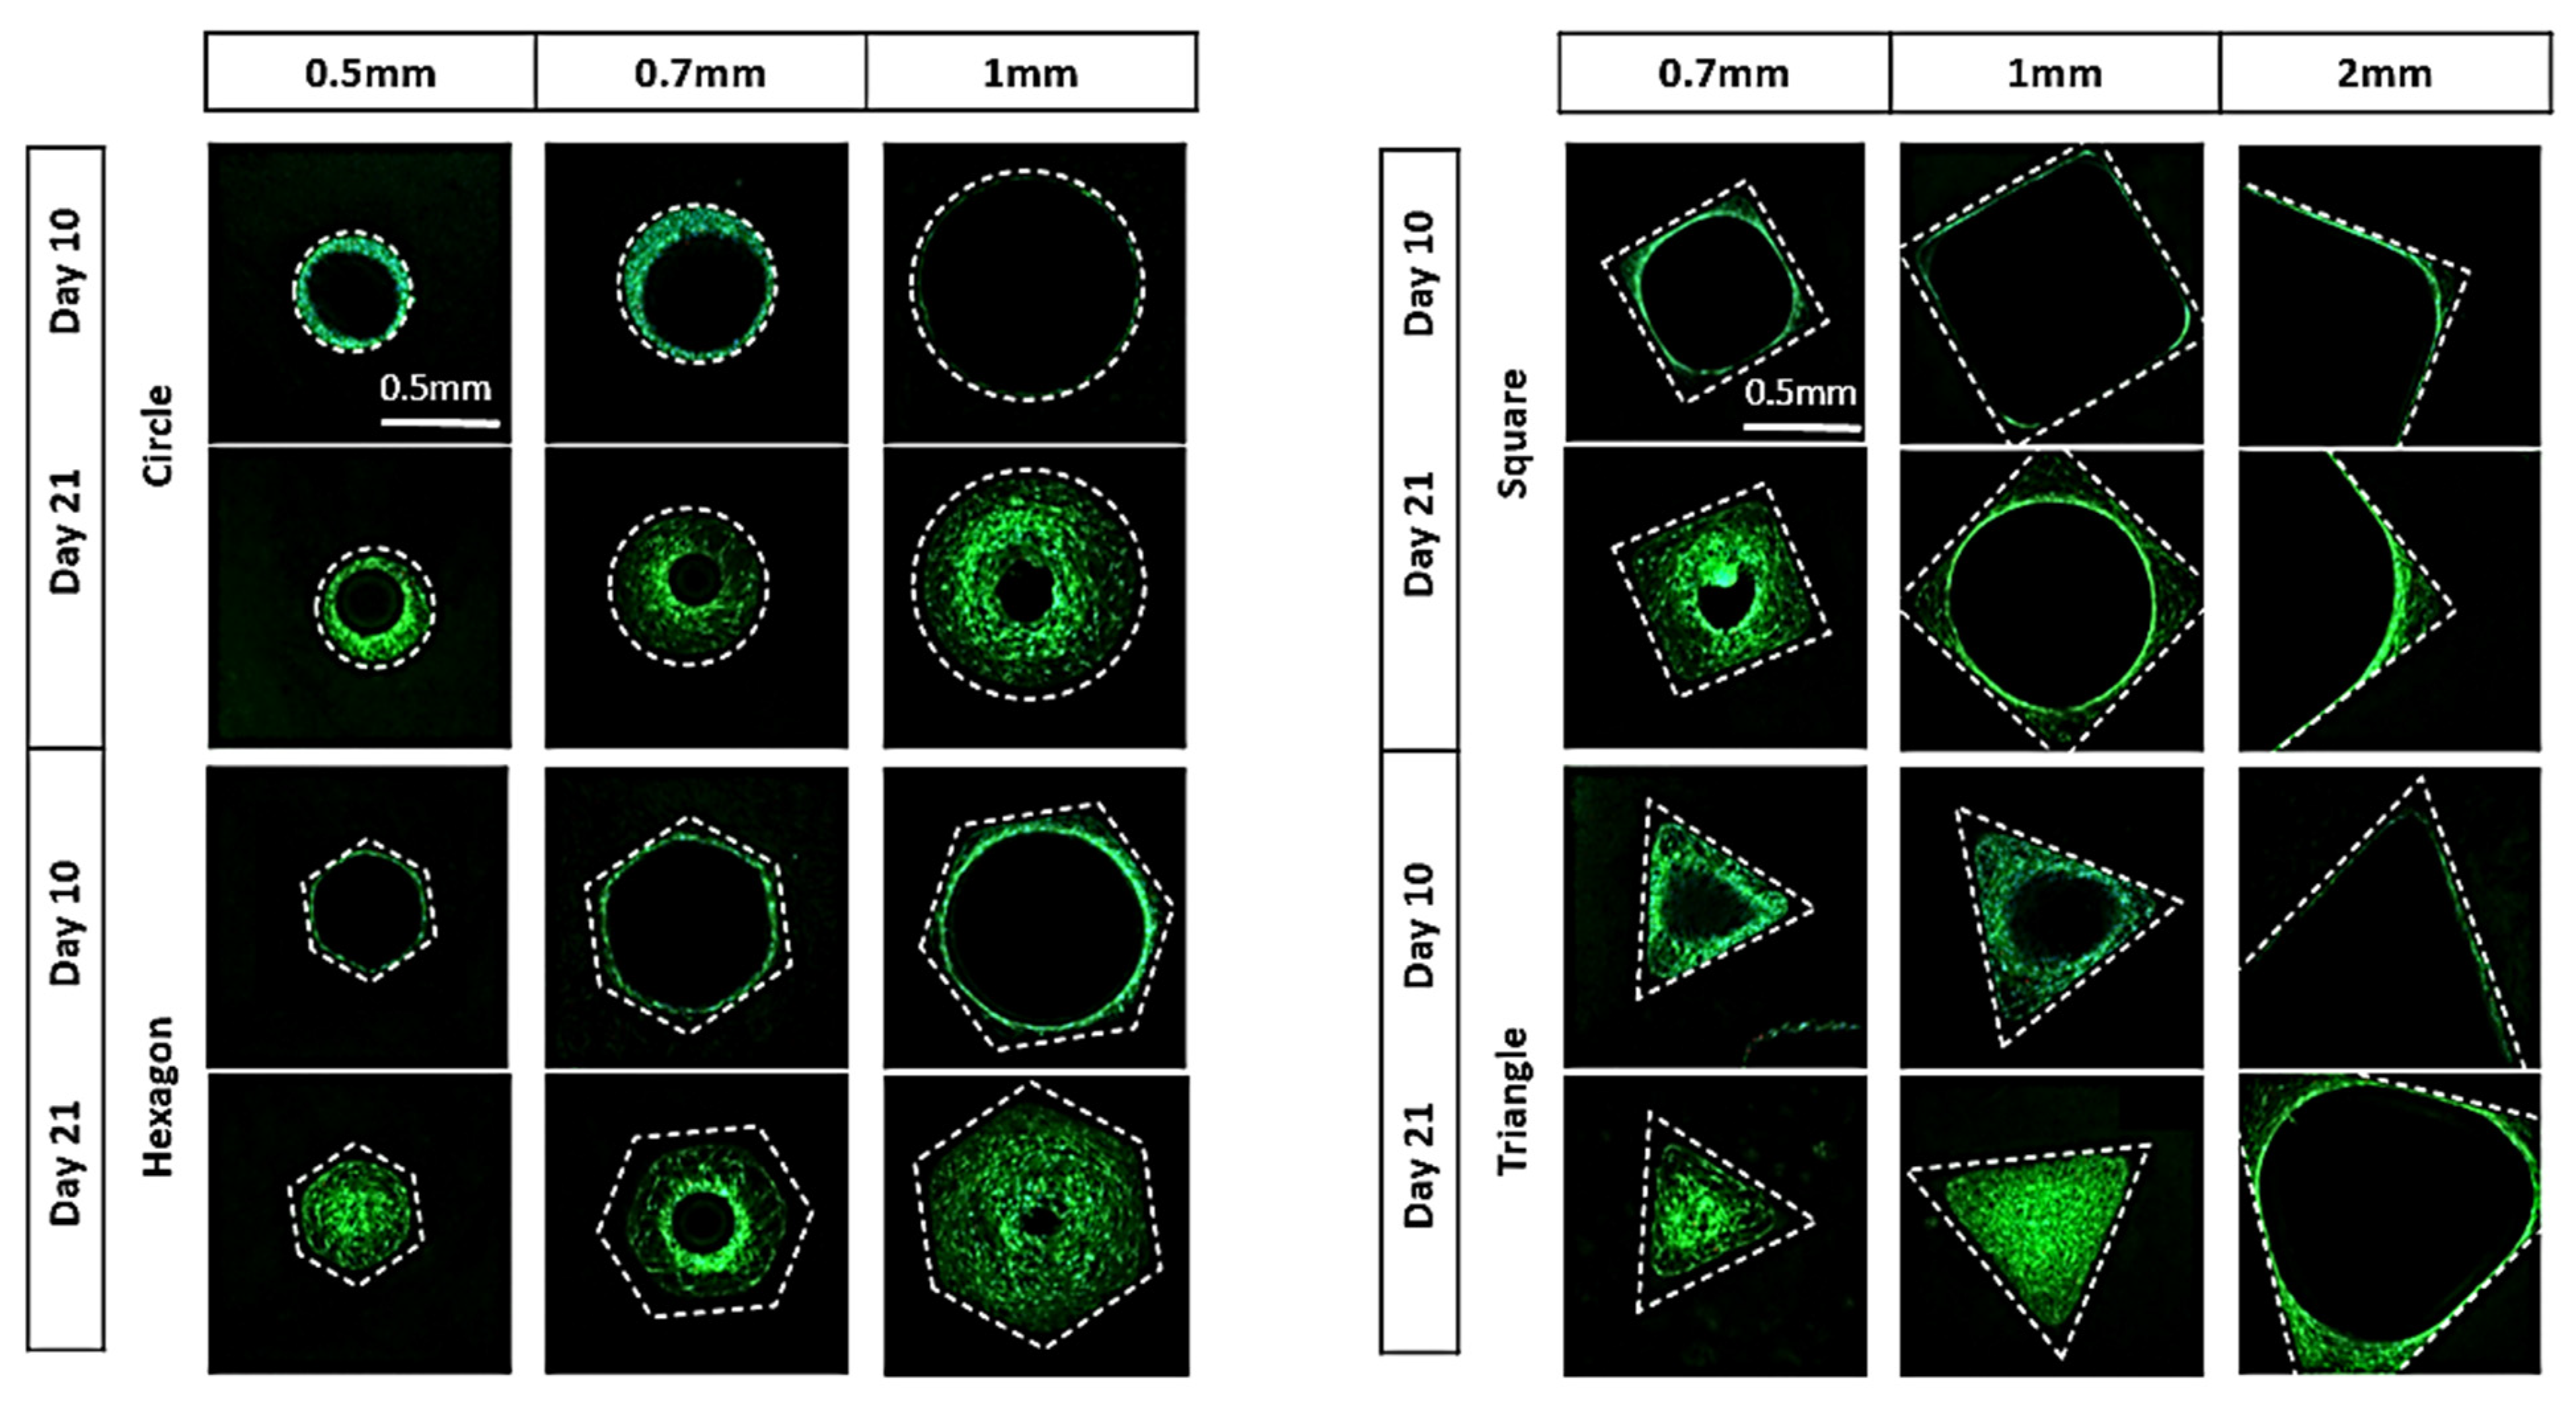
2.2.5. Image Processing

All images from the fluorescence microscopy were analyzed with ImageJ software version 1.53q for Windows (v1.53, ImageJ software, Wayne Rasband and contributors, NIH, Bethesda, MD, USA), using Bio-Format (v7.0.1, Bio-Format project, Madison, WI, USA) as a plugin for ImageJ to read and write images in the formats it supports. The image analysis provided a qualitative and quantitative measure of the filling of each channel on the disk.
CTAn (v1.18.8.0, Bruker Belgium SA, Kontich, Belgium) was used for image processing and the quantification of newly formed tissue based on automatic Otsu segmentation, 3D space closing, and a de-speckle algorithm. The percentage of neotissue was calculated in relation to the total scaffold volume. CTVox (v3.3.0, Bruker Belgium SA, Kontich, Belgium) was used to create 3D visualization.

2.2.6. Statistical Analysis

All data from the quantitative processing of the fluorescence microscopy images were statistically analyzed using GraphPad Prism software version 8.2.1 for Windows (GraphPad Software, San Diego, CA, USA). To compare multiple groups’ means with three repeats, a statistical analysis of the results was performed by a two-way analysis of variance (ANOVA), followed by post hoc tests (Tukey’s multiple comparison test). Significant levels are reported as follows: * p < 0.05, ** p < 0.01, *** p < 0.001, and **** p < 0.0001.

3. Results

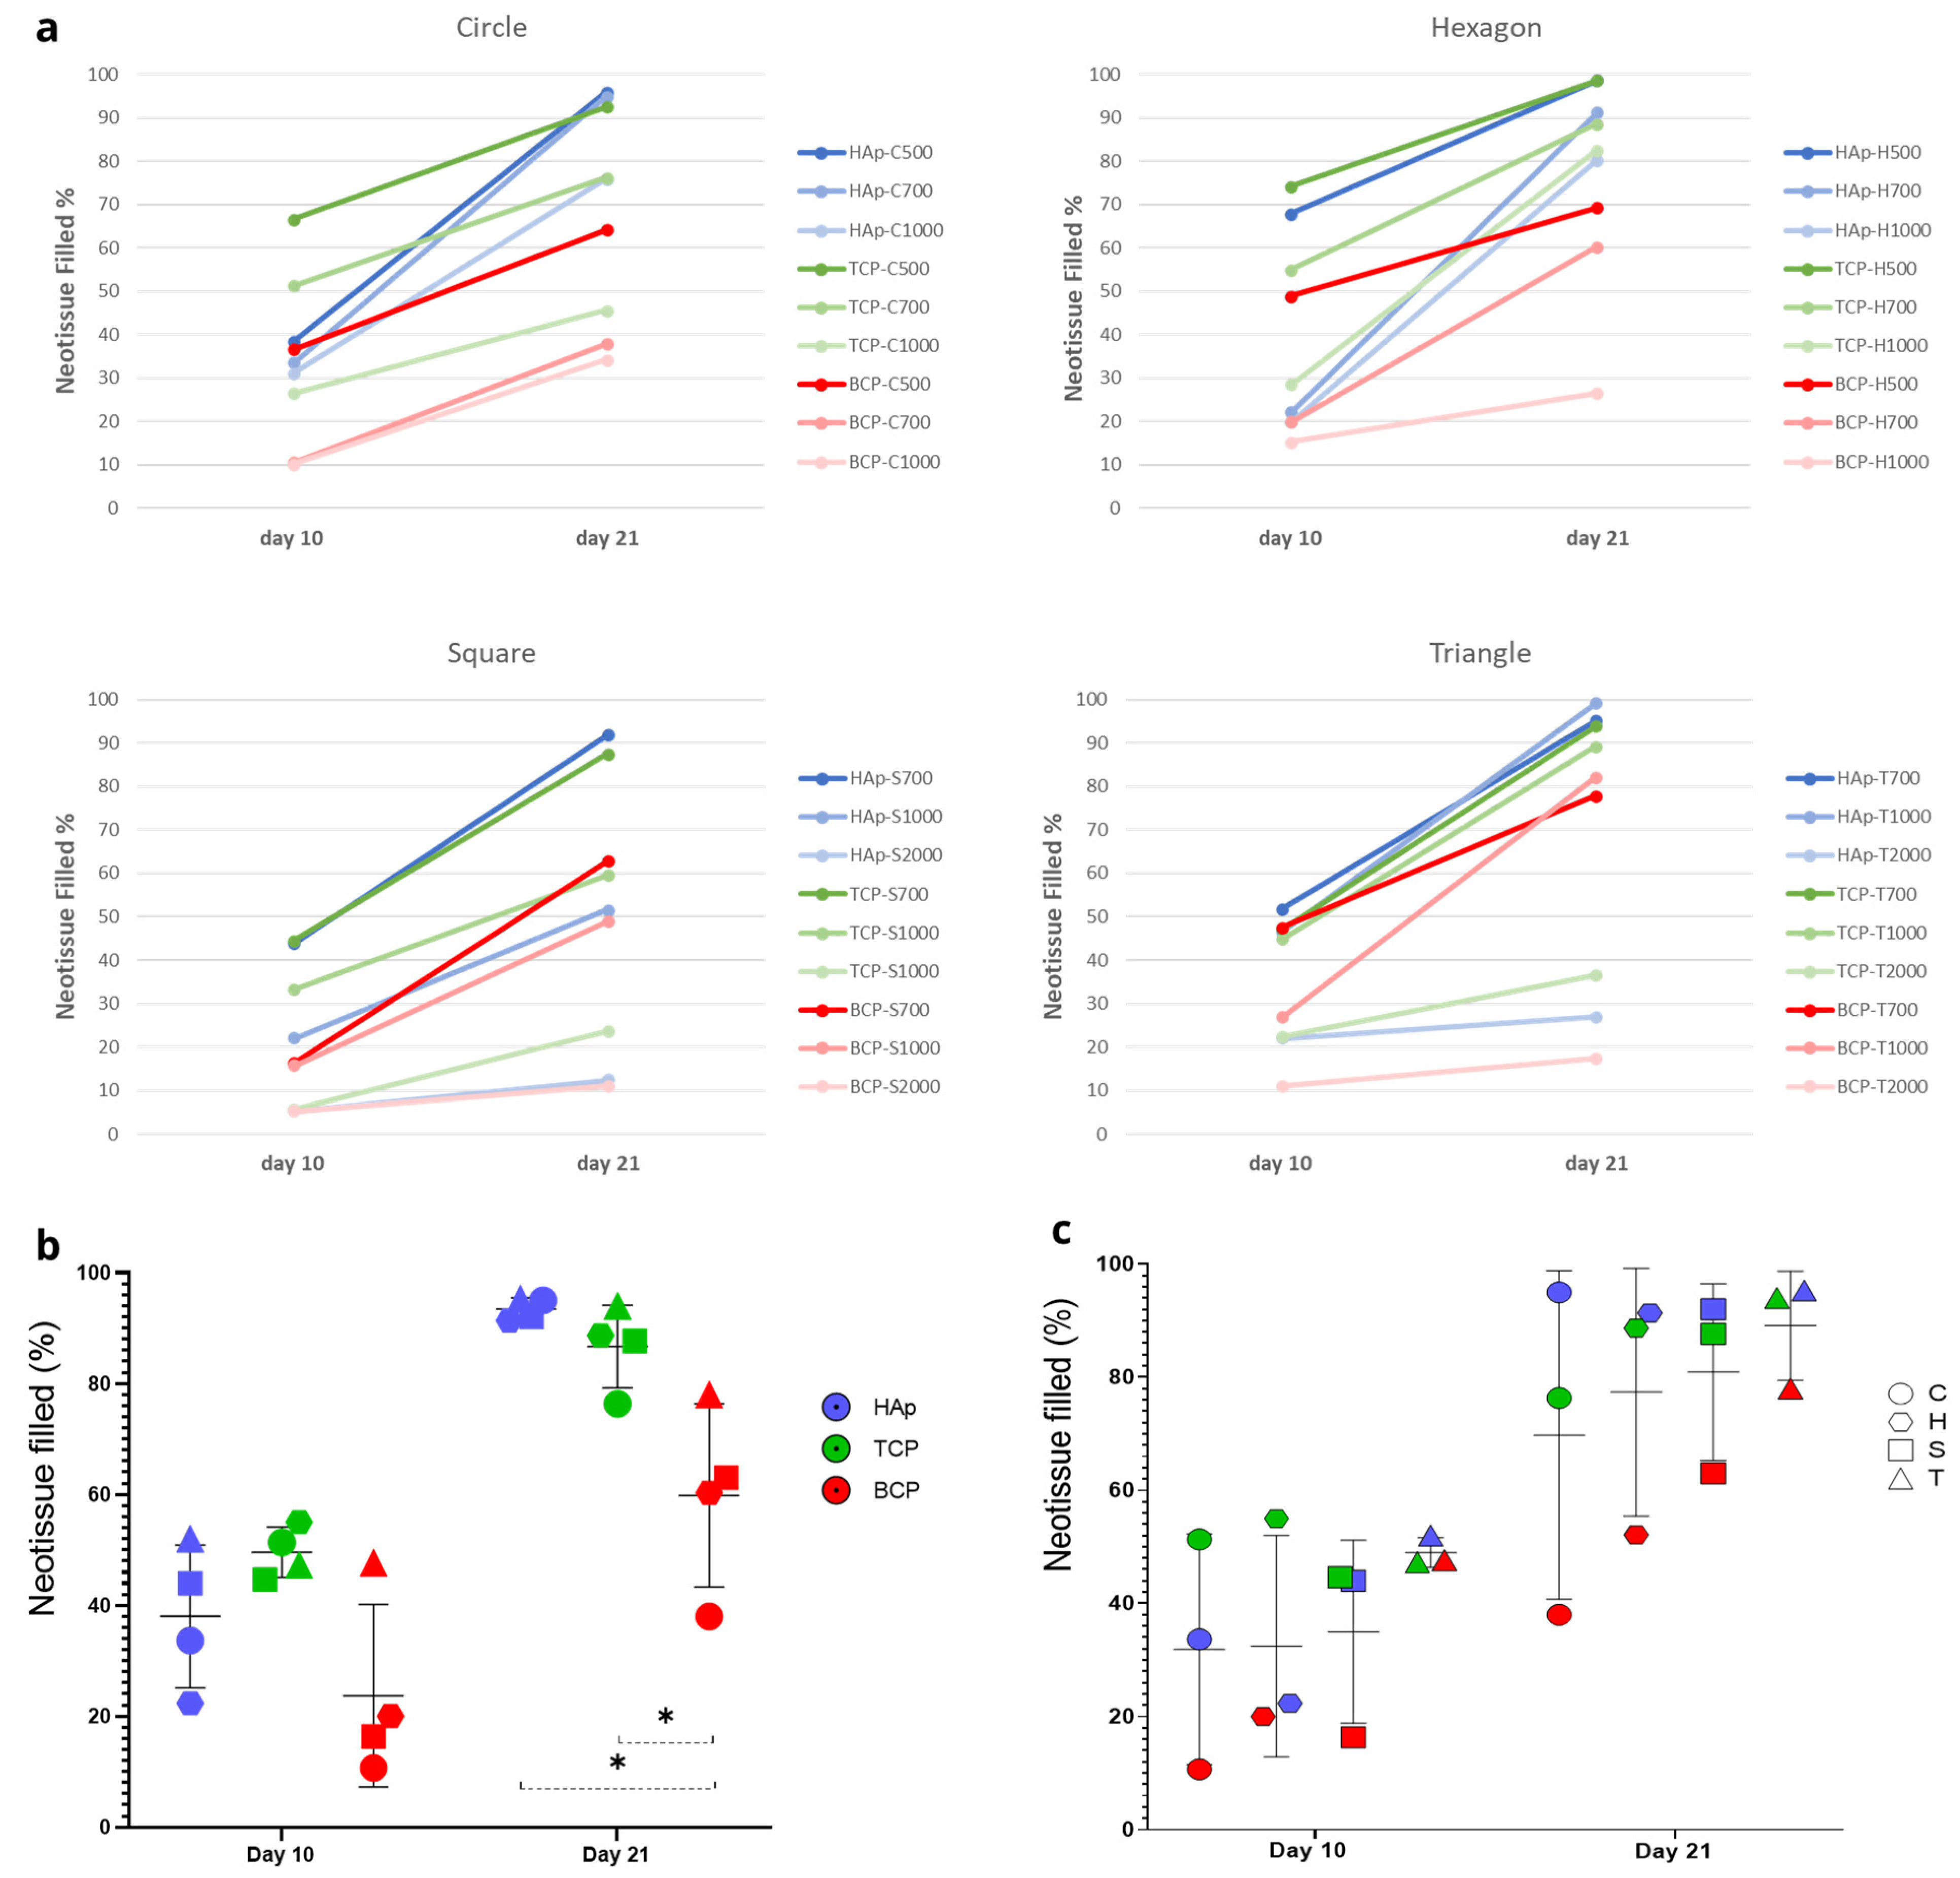
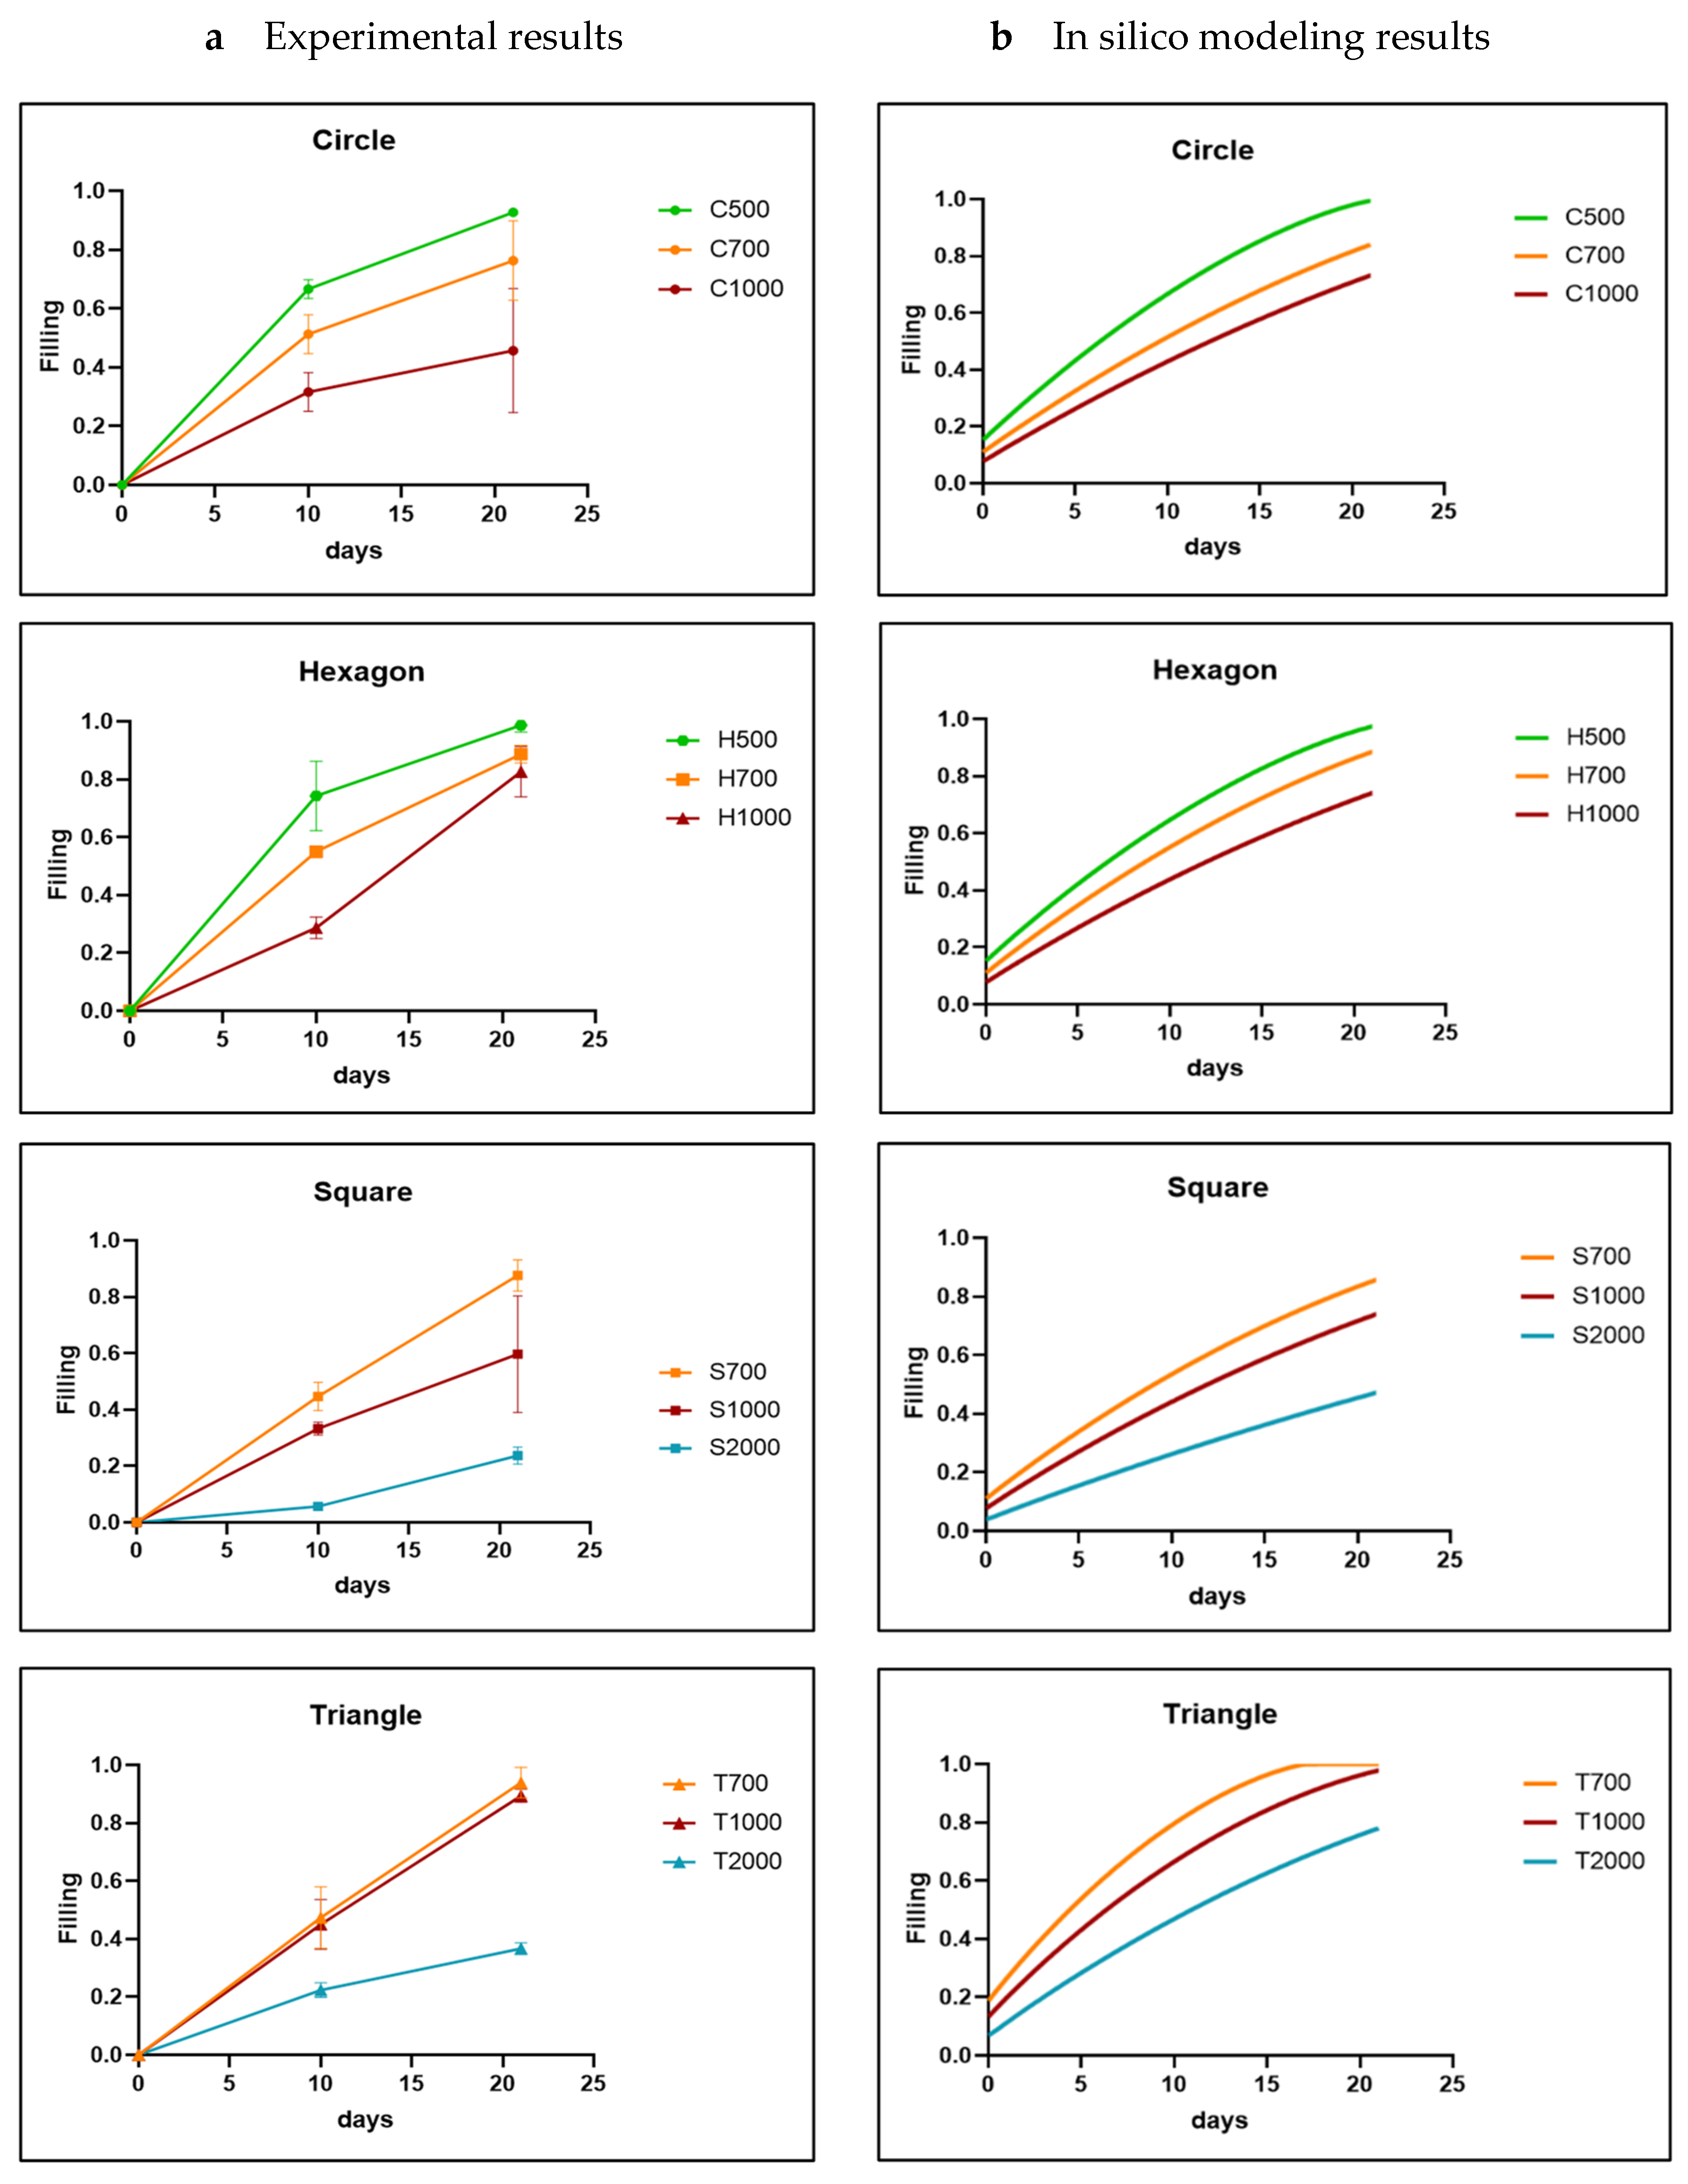
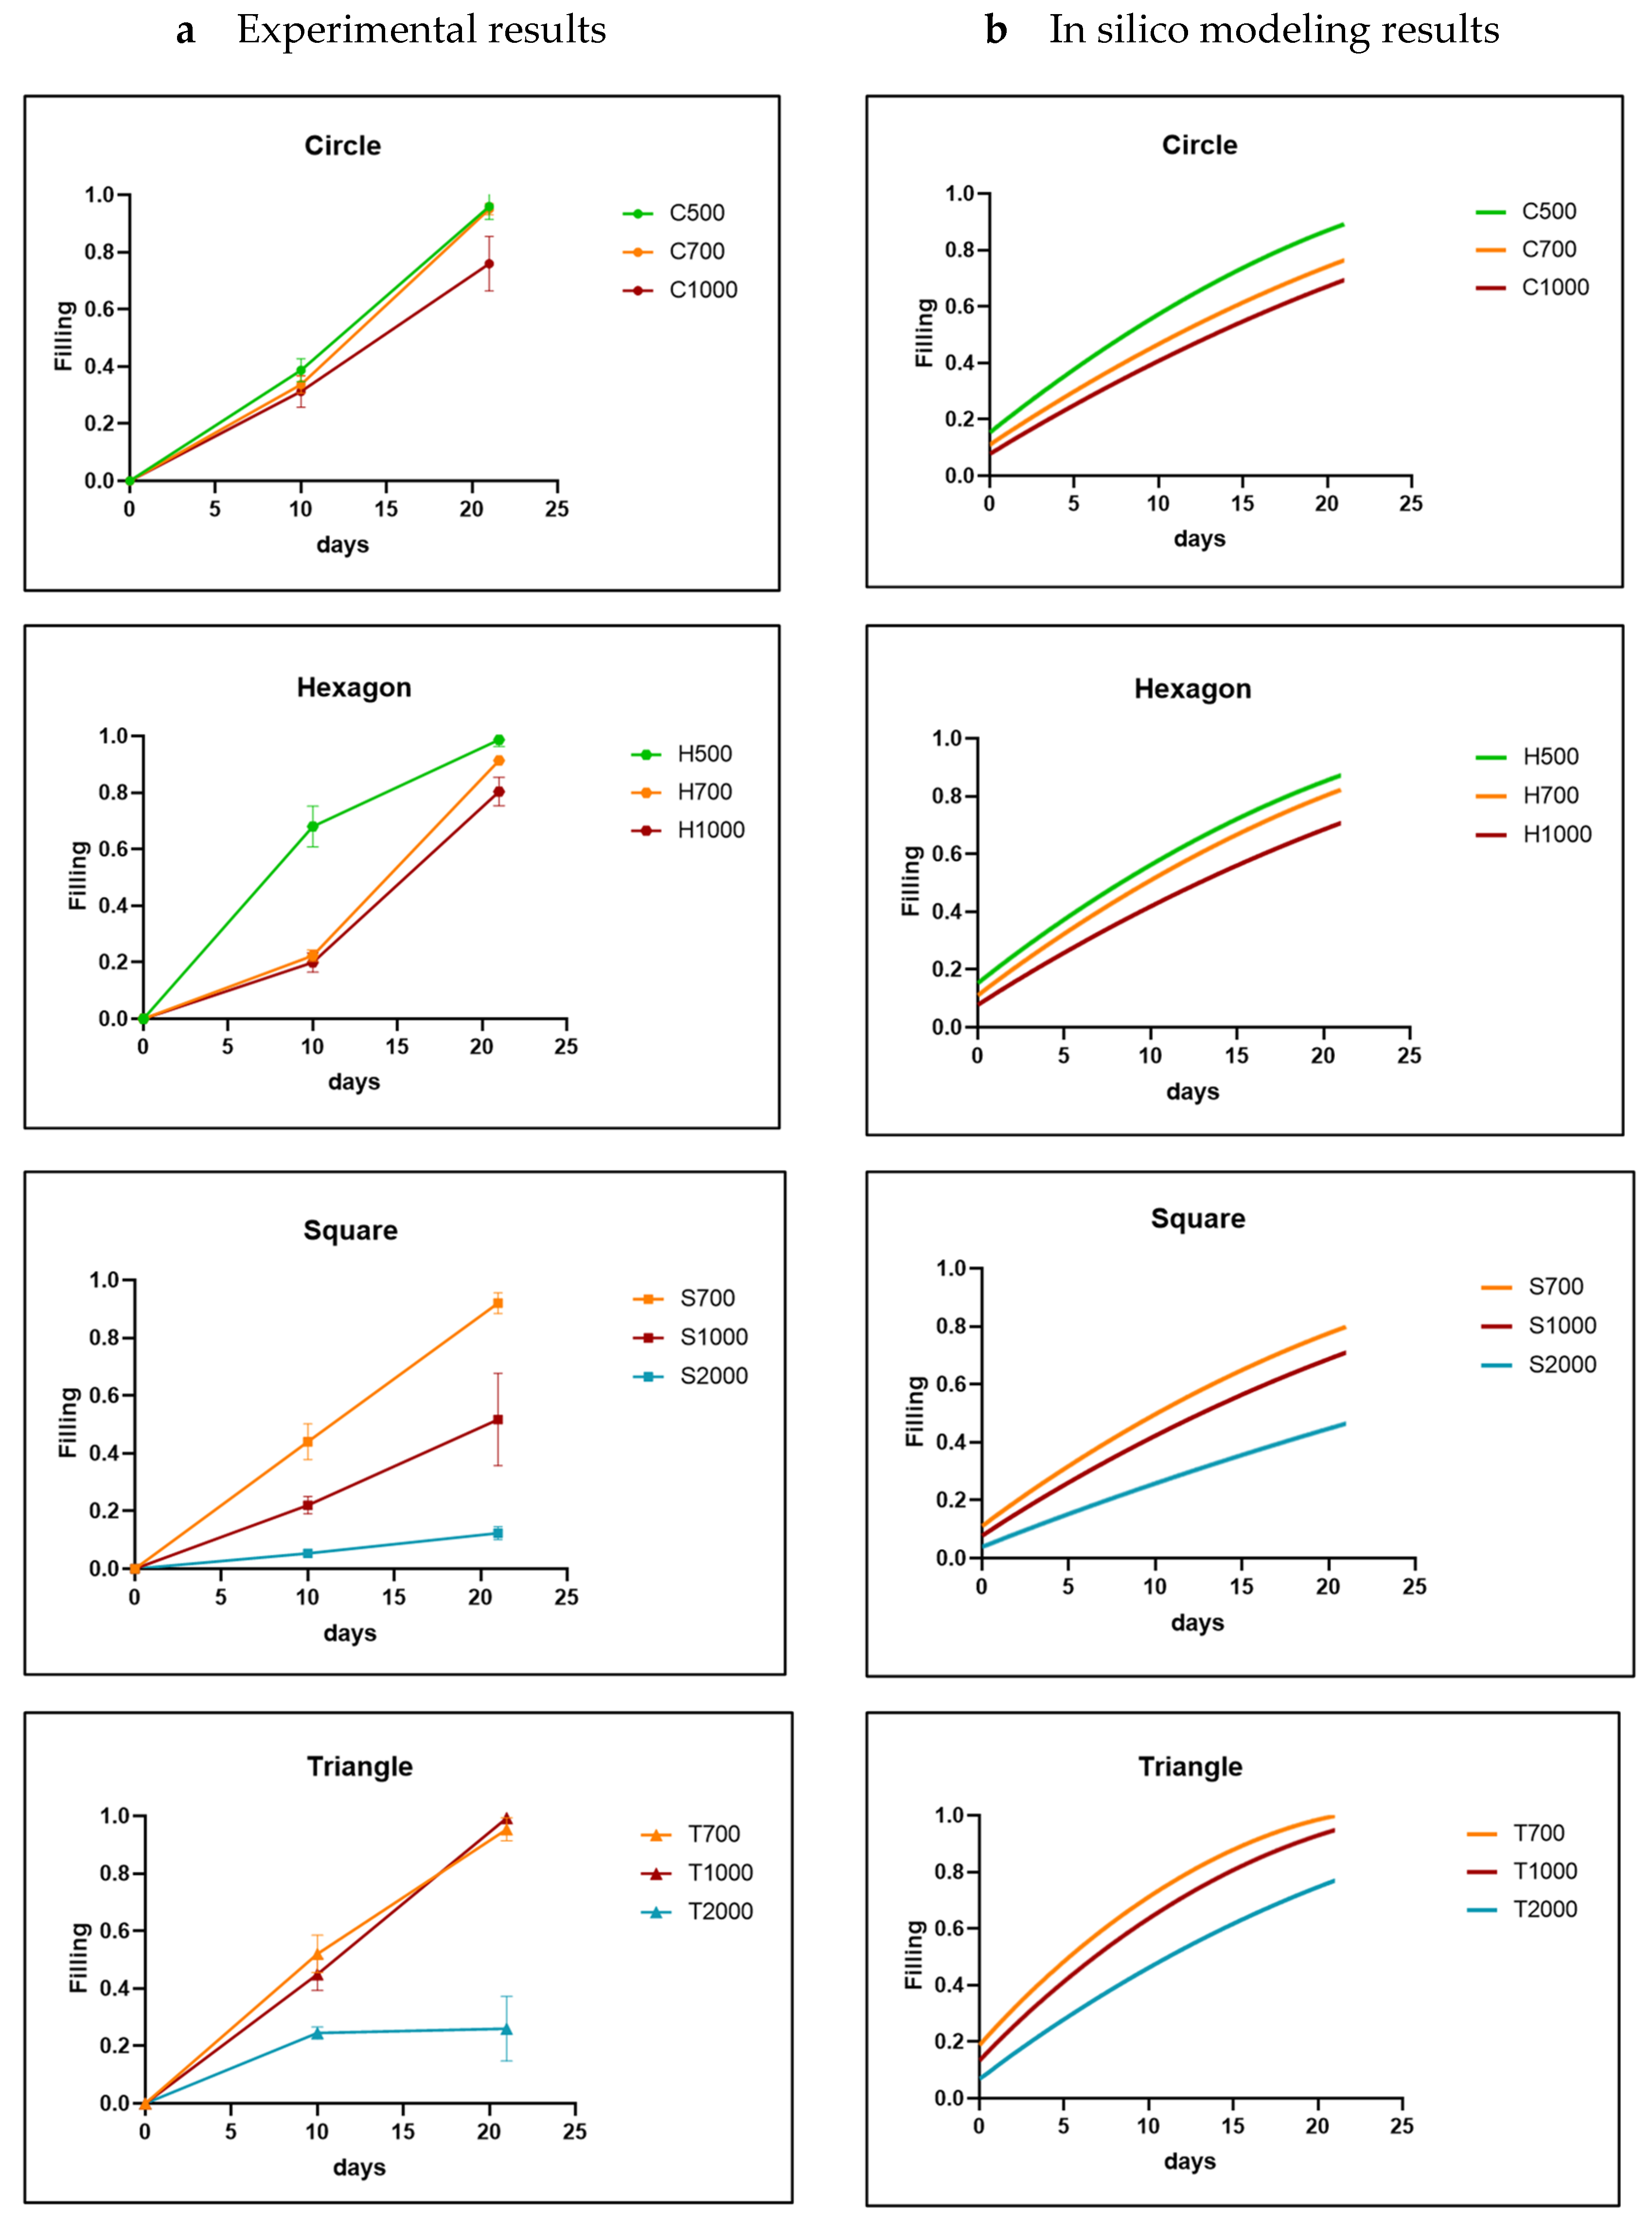
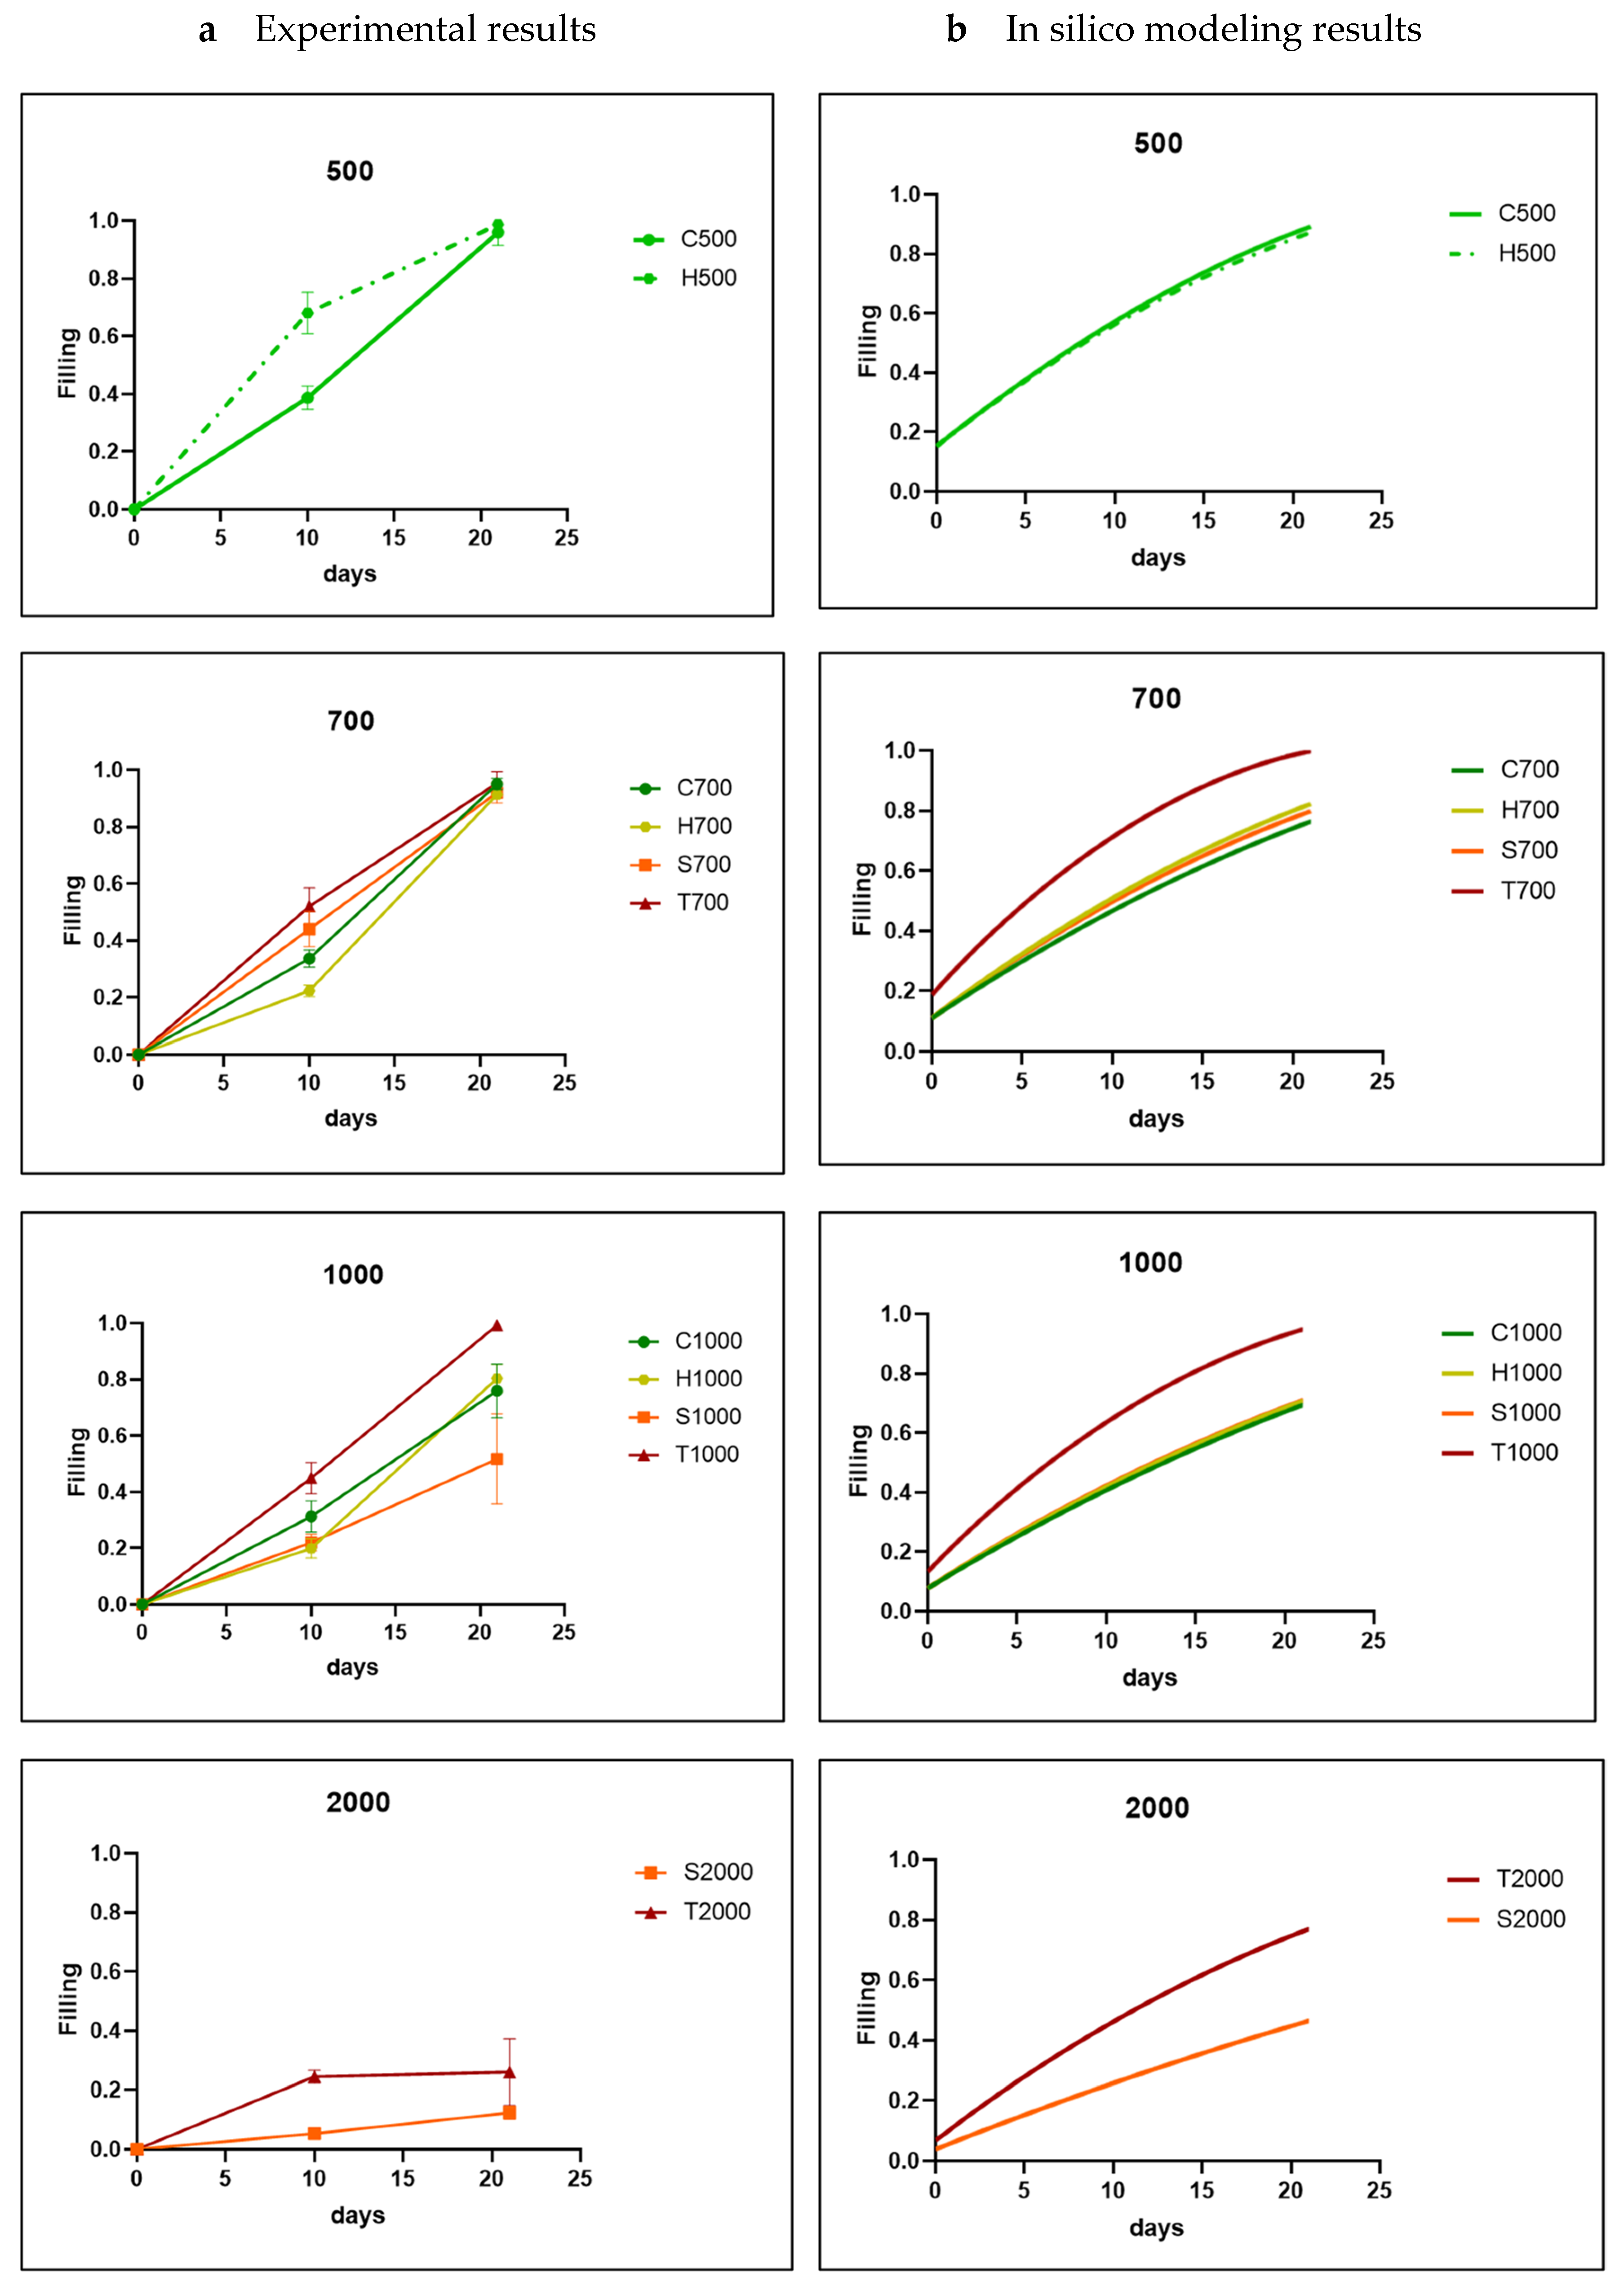
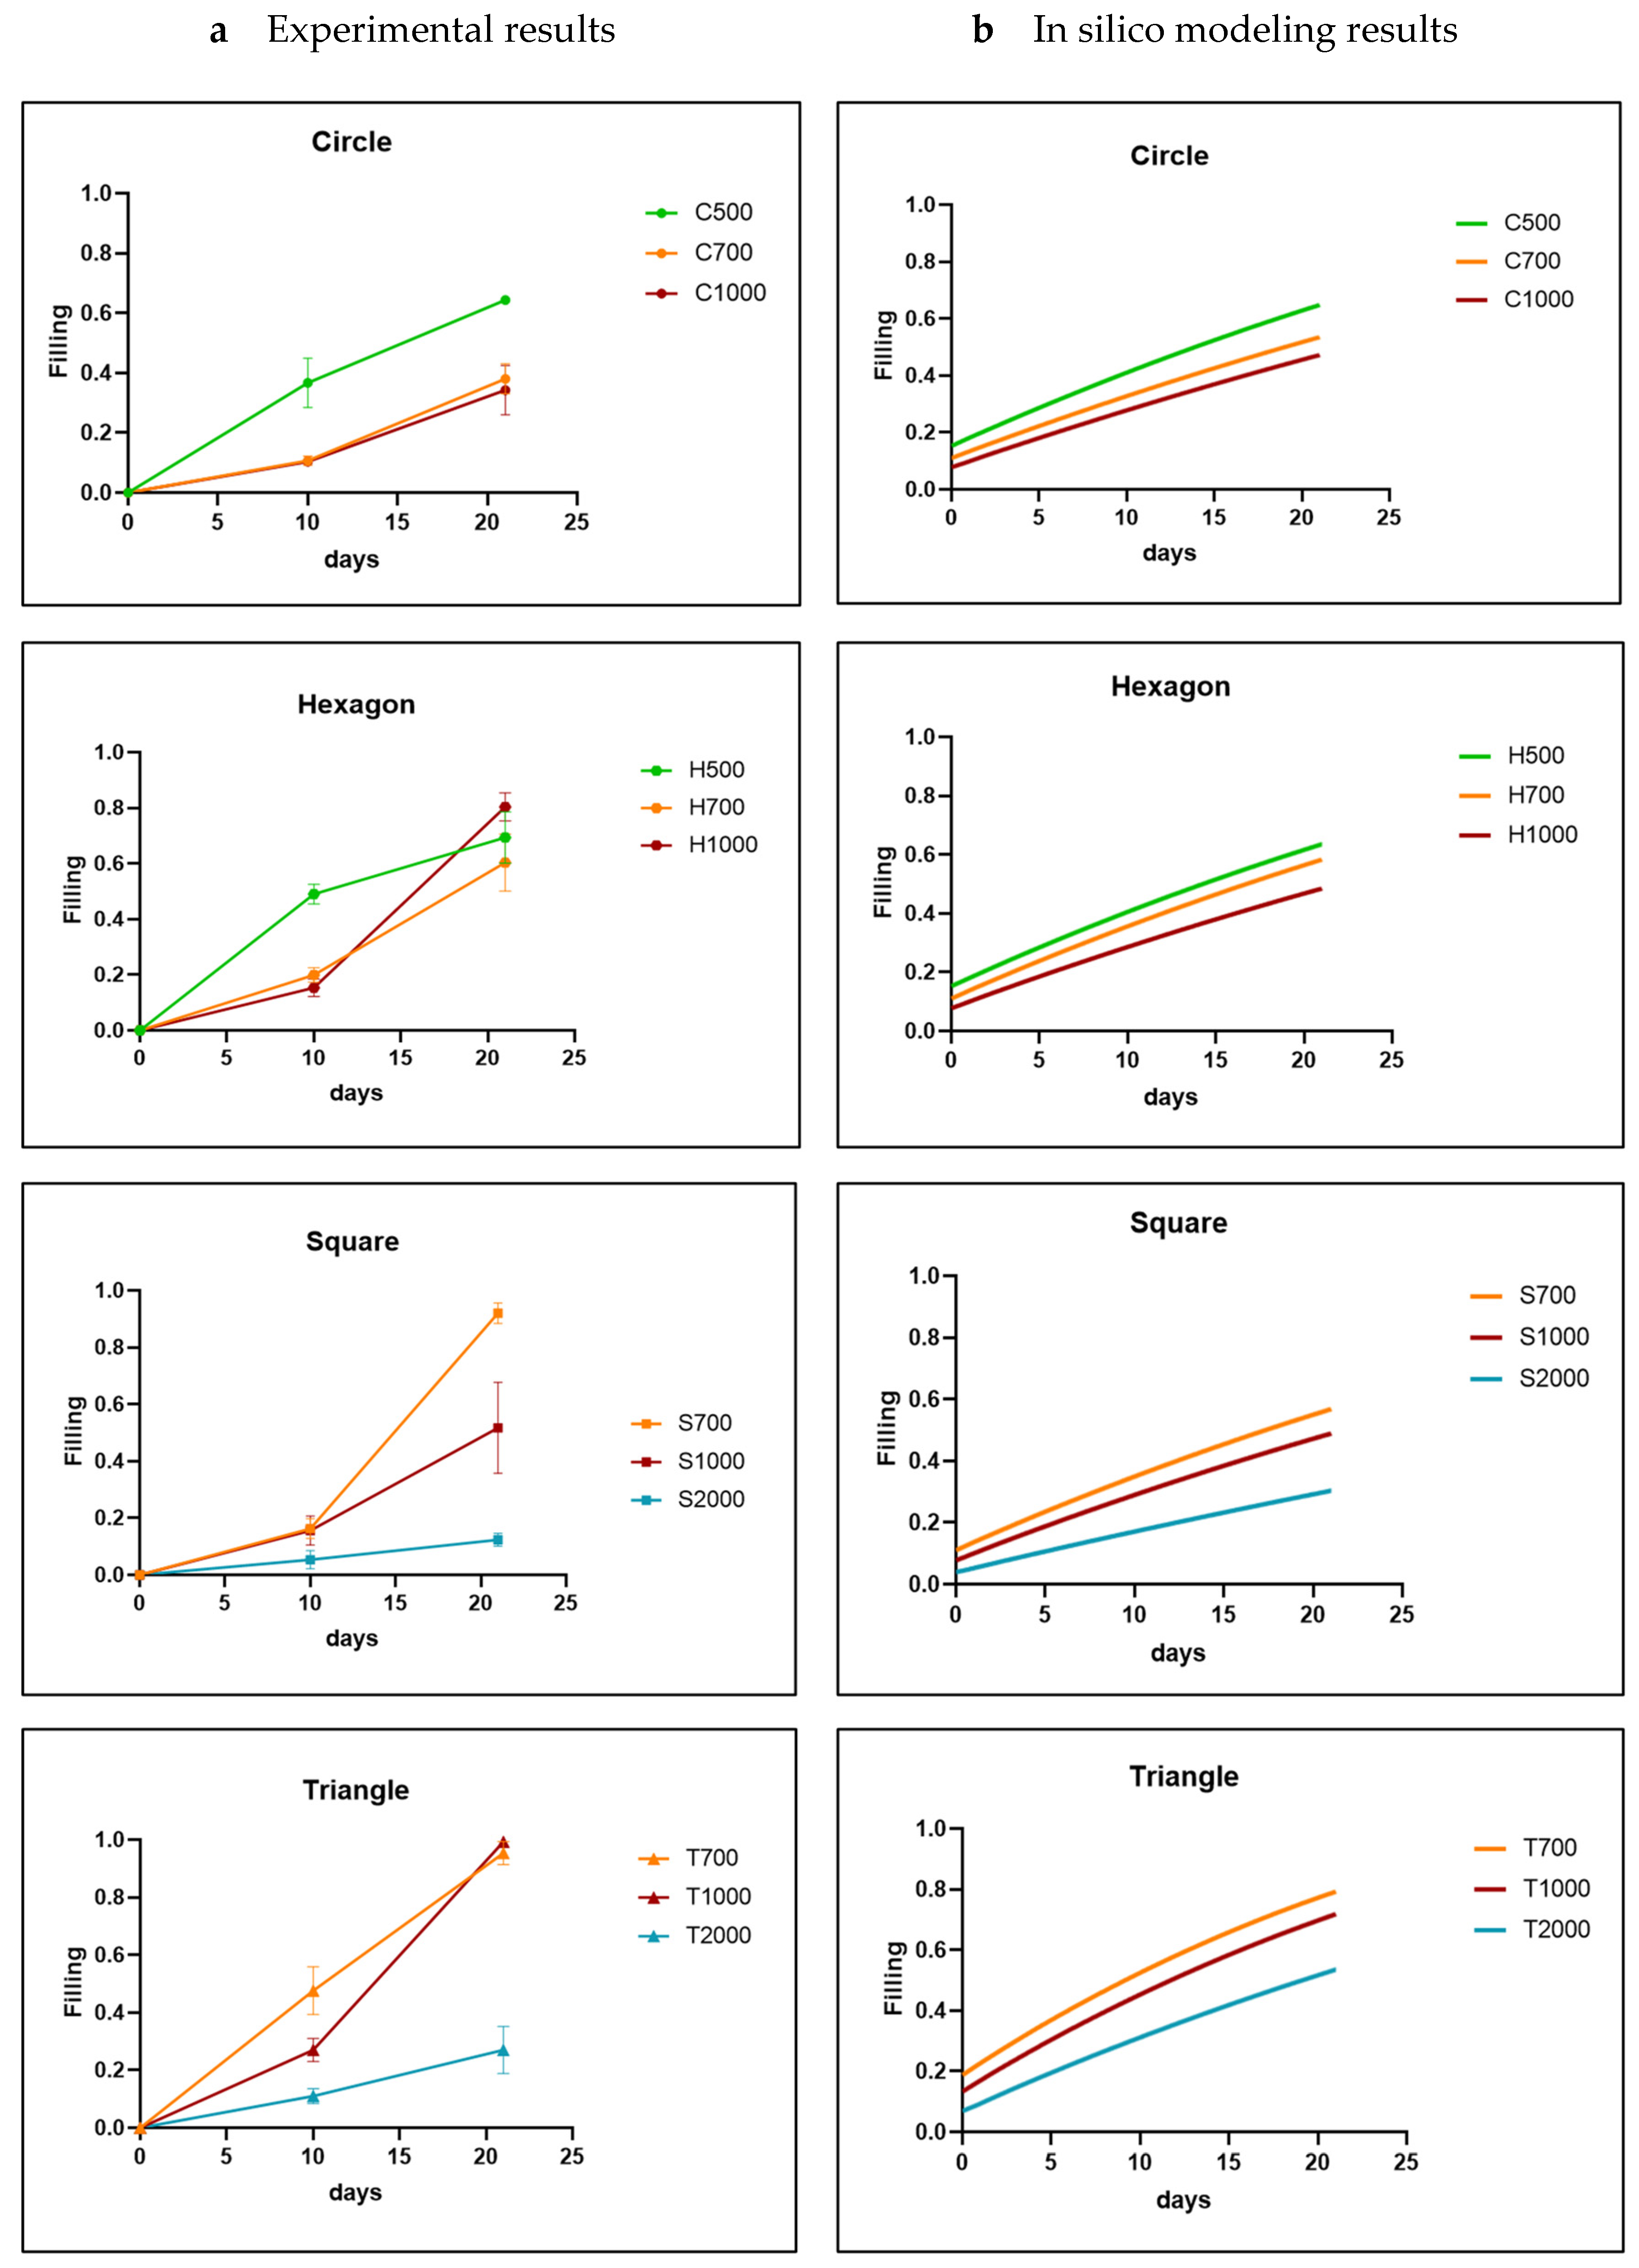
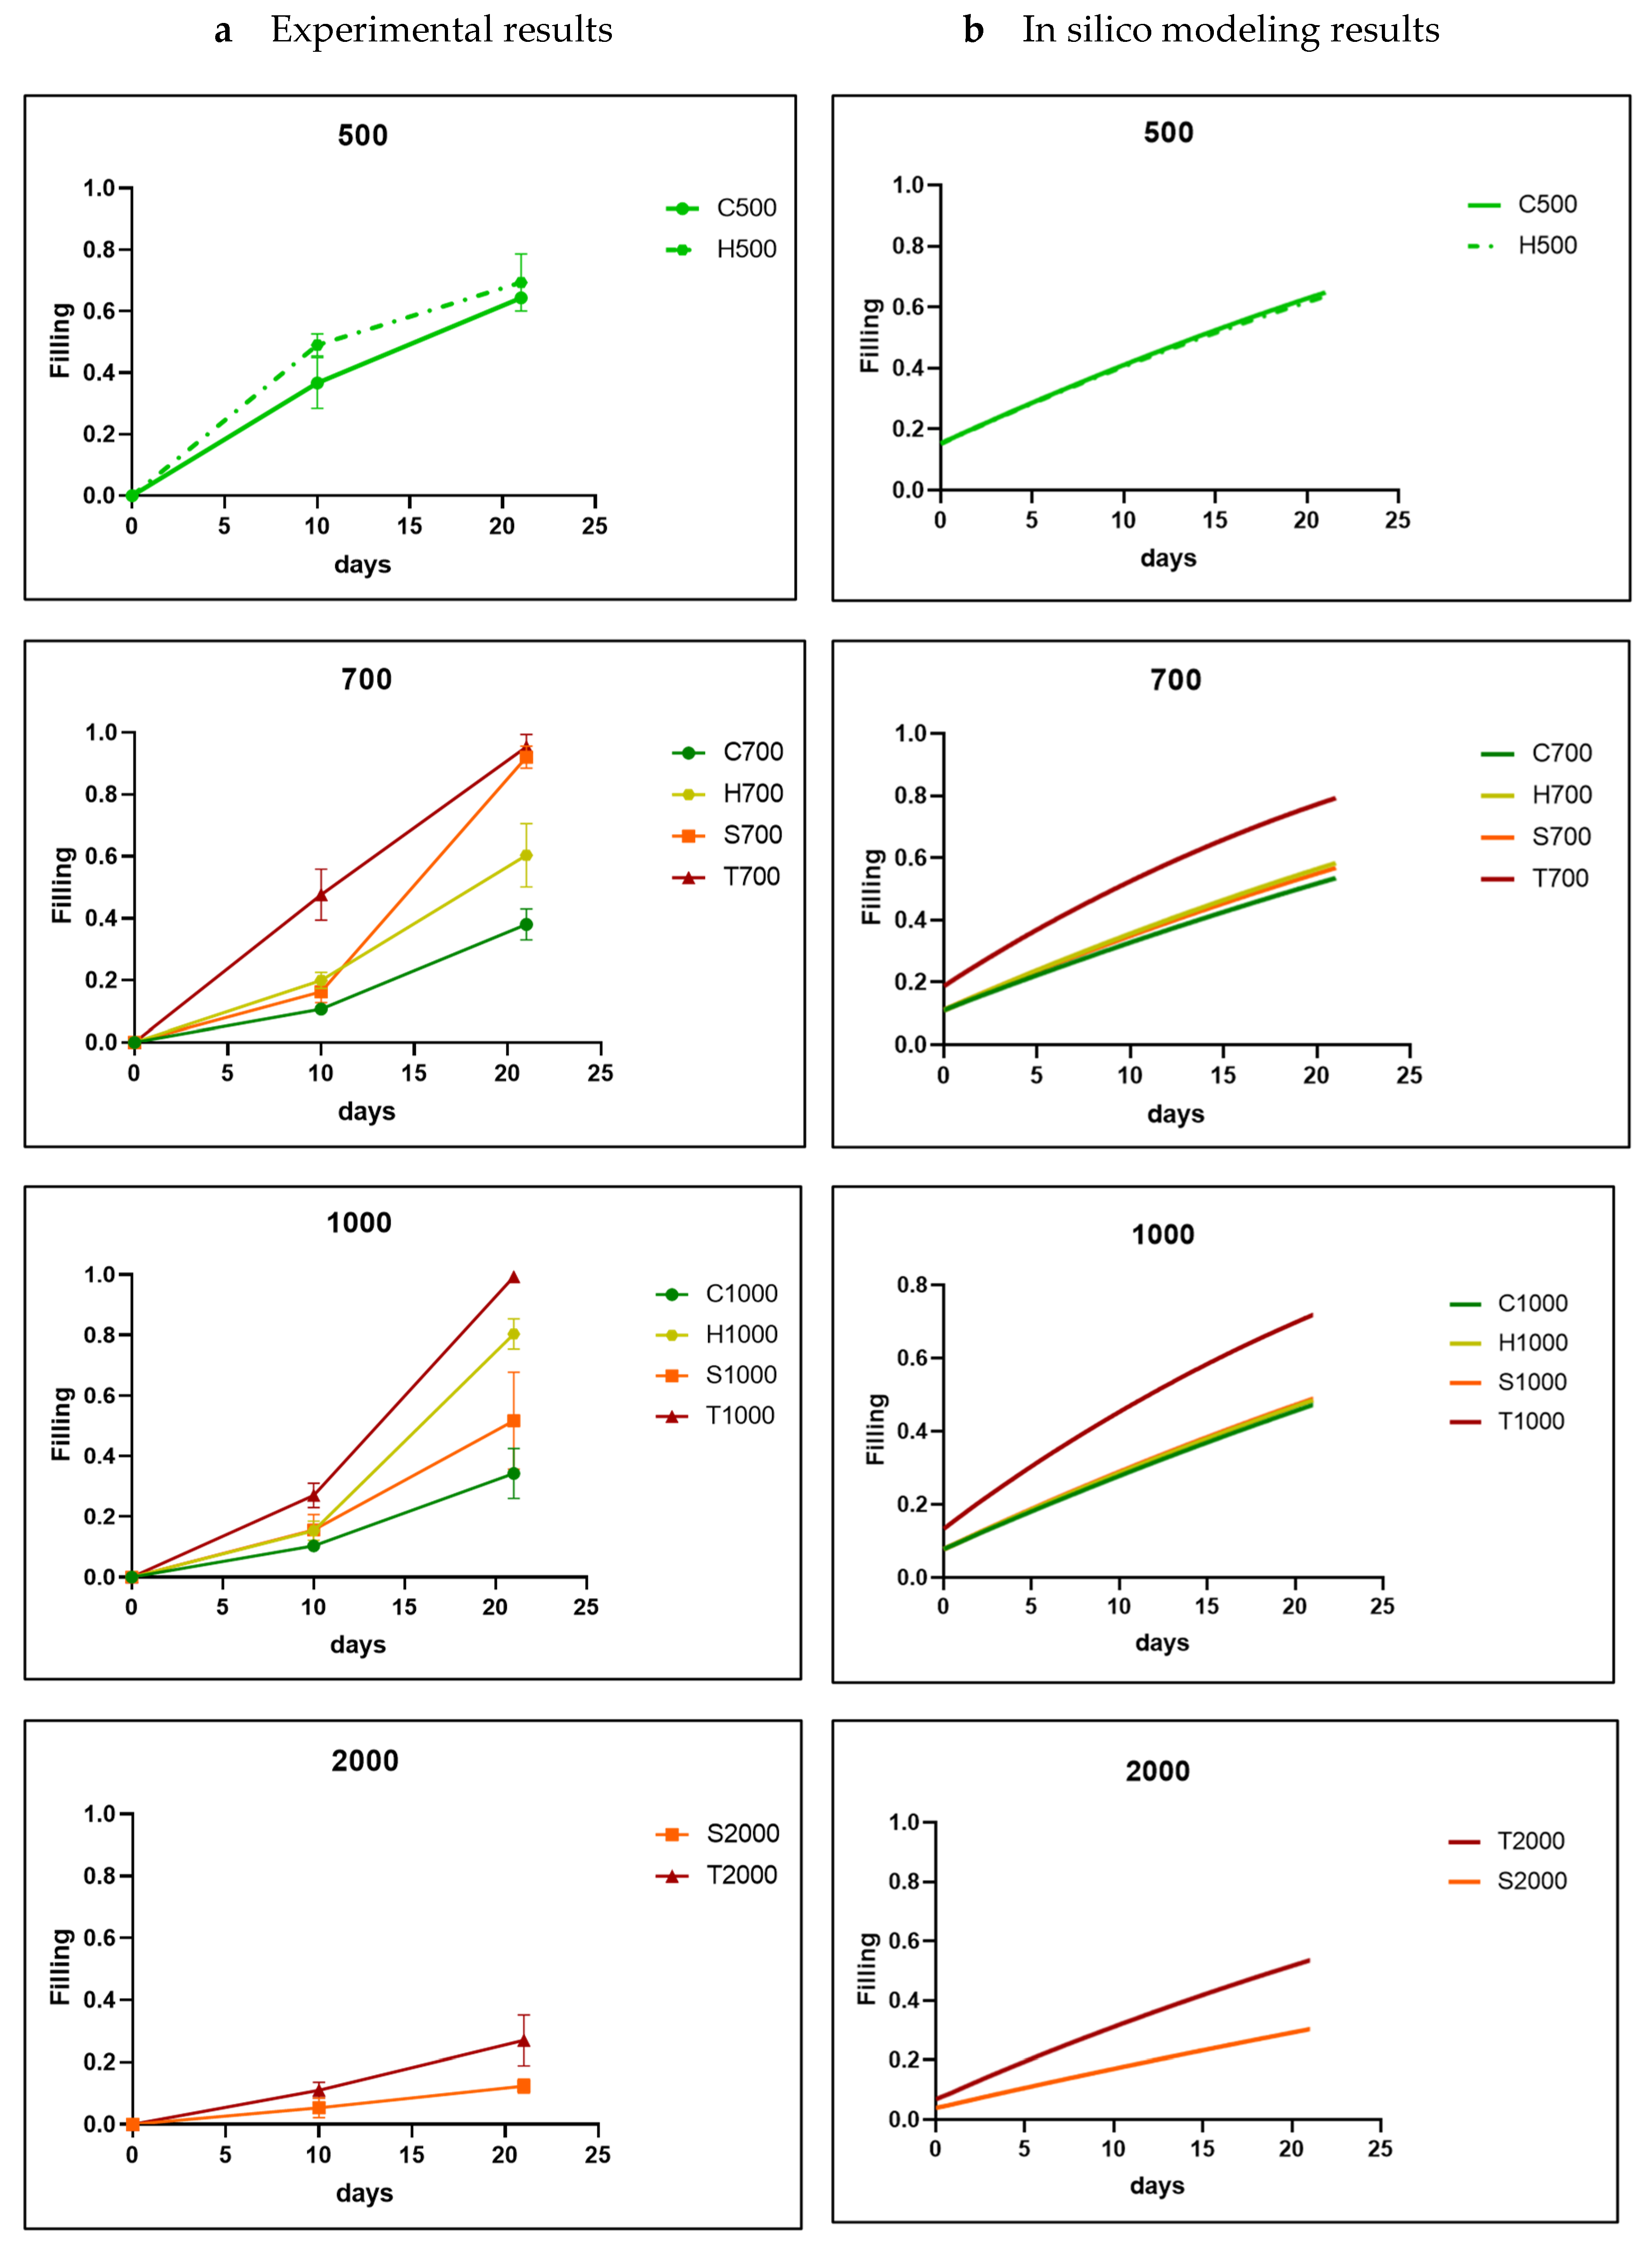
3.1. Analysis of In Vitro Cell Behavior

The percentage of neotissue formed within the channels was calculated using image processing on fluorescent images (Figure 2). The Live/Dead staining showed the good biocompatibility of the produced CaP disks with the hTERT-BMSCs. The fluorescence images revealed a viable cell population for all pore channels on both time points with a greater abundance for day 21 compared to day 10. Cells were seen to attach to the top surface of the disk as well as the pore walls. The pattern of neotissue growth in the channels, particularly for the triangle, square, and hexagon shapes, demonstrates that neotissue growth indeed starts in the areas of the highest curvature, ultimately forming a circular growth boundary. Subsequently, neotissue continues to grow towards the center of the channel, gradually filling it up. This was observed to happen regardless of the shape and size of the initial channel or the material used, confirming the curvature-based hypothesis for the tested materials. The results of the quantification of neotissue formed for different channel cross-sectional shapes and sizes and different types of CaP biomaterials on days 10 and 21 are shown in Figure 3 and in Table A1 and Figure A1, Figure A2, Figure A3 and Figure A4 in Appendix A, respectively. When comparing the different materials (using the channels with 0.7 mm and 1 mm diameters as examples), the experiments demonstrated that the results for HAp (0.7 mm: 38% on day 10 to 93.42% on day 21; 1 mm: 30% on day 10 to 76.83% on day 21) and TCP (0.7 mm: 49.58% on day 10 to 86.67% on day 21; 1 mm: 33.42% on day 10 to 69.33% on day 21) were not significantly different; however, the BCP results (0.7 mm: 23.67% on day 10 to 59.83% on day 21; 1 mm: 17.08% on day 10 to 48.08% on day 21) were significantly lower on day 21 (Figure 3b). Comparing the pore shapes, the triangles mostly showed faster growth than squares, hexagons, and circles (Figure 3c and Figure 4a), although the influence of the material and pore size confounded the results. For the largest sizes (2 mm in the triangle and square channels), the growth rate was strongly reduced compared to all others, with limited neotissue formation present in the corners, though the circularization of the neotissue interface was still visible.

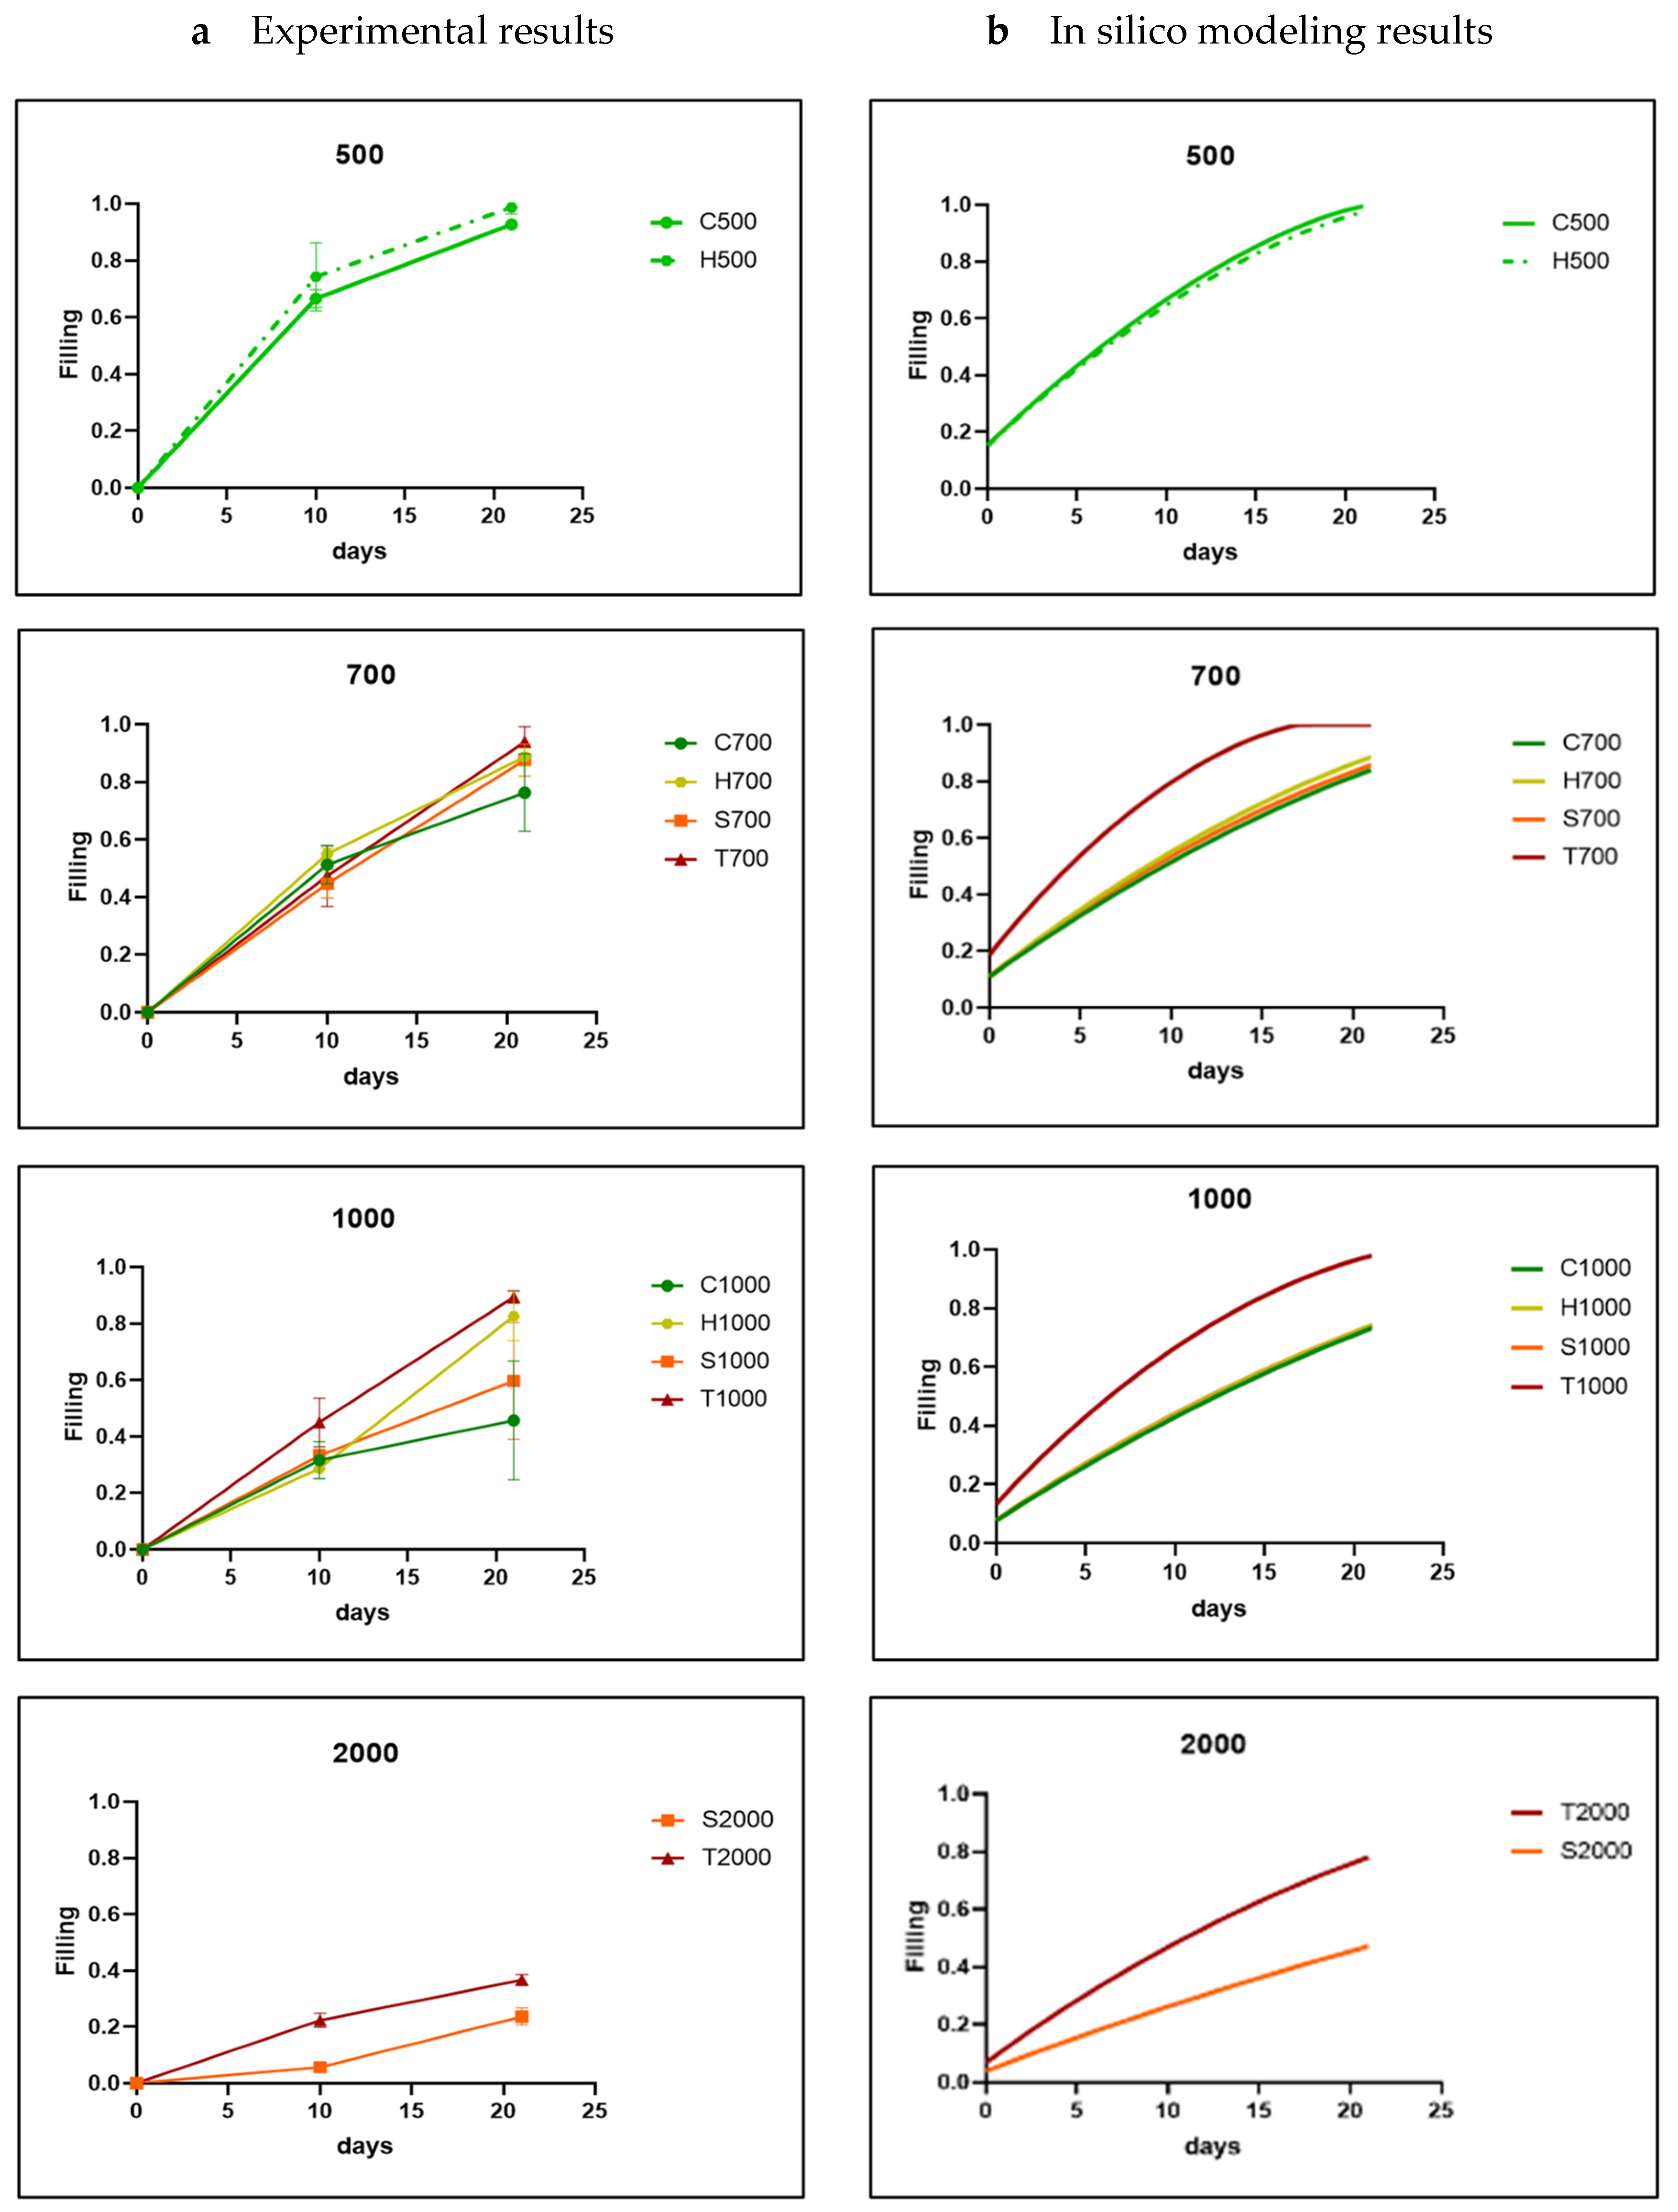
3.2. In Silico Modeling

As the experimental results confirmed the in silico model’s basic premise of curvature-based neotissue growth, qualitatively, the simulation results largely corresponded to the experimental ones. Bayesian optimization was used as indicated in the Methods section in order to calibrate the model parameter A for all materials, shapes and sizes and was ultimately fixed at 0.3 for the HAp disks, 0.01 for the TCP, and 0.001 for the BCP disks. The optimization led to a good quantitative correspondence between the experimental and simulation results, shown in relation to channel size (Figure 4) and channel shape (Figure 5). The simulation results showed, as expected from the curvature-based principles, that increasing the channel diameter decreased the neotissue growth rate (Figure 4). For the channel sizes 0.5 mm and 0.7 mm, all the shapes reached high filling percentages on day 21. However, especially for 0.5 mm, the experimental time points did not allow us to assess the exact time point at which 100% filling was reached. Hence, this could explain the qualitative difference in filling rates between the experiments and simulations, with the filling tendency appearing as a polyline in the experimental result and a smoother line in the simulations. The hexagon shows the fastest neotissue growth across all sizes, whereas for the smallest sizes (0.7 mm and 1 mm), the triangular channel fills up fastest both in the experiments and the simulations due to the curvature being highest in those channels and the neotissue growing inward from the corners being more likely to establish contact quickly. For the size 1 mm, the triangle was still the fastest-growing one, almost reaching 100% filling on day 21, followed by the circle and hexagon, which reached about 60% filling on day 21. The square was relatively slow, and the final filling rate was about 40%. For the size 2 mm, the filling rate of the four basic shapes did not exceed 20%.

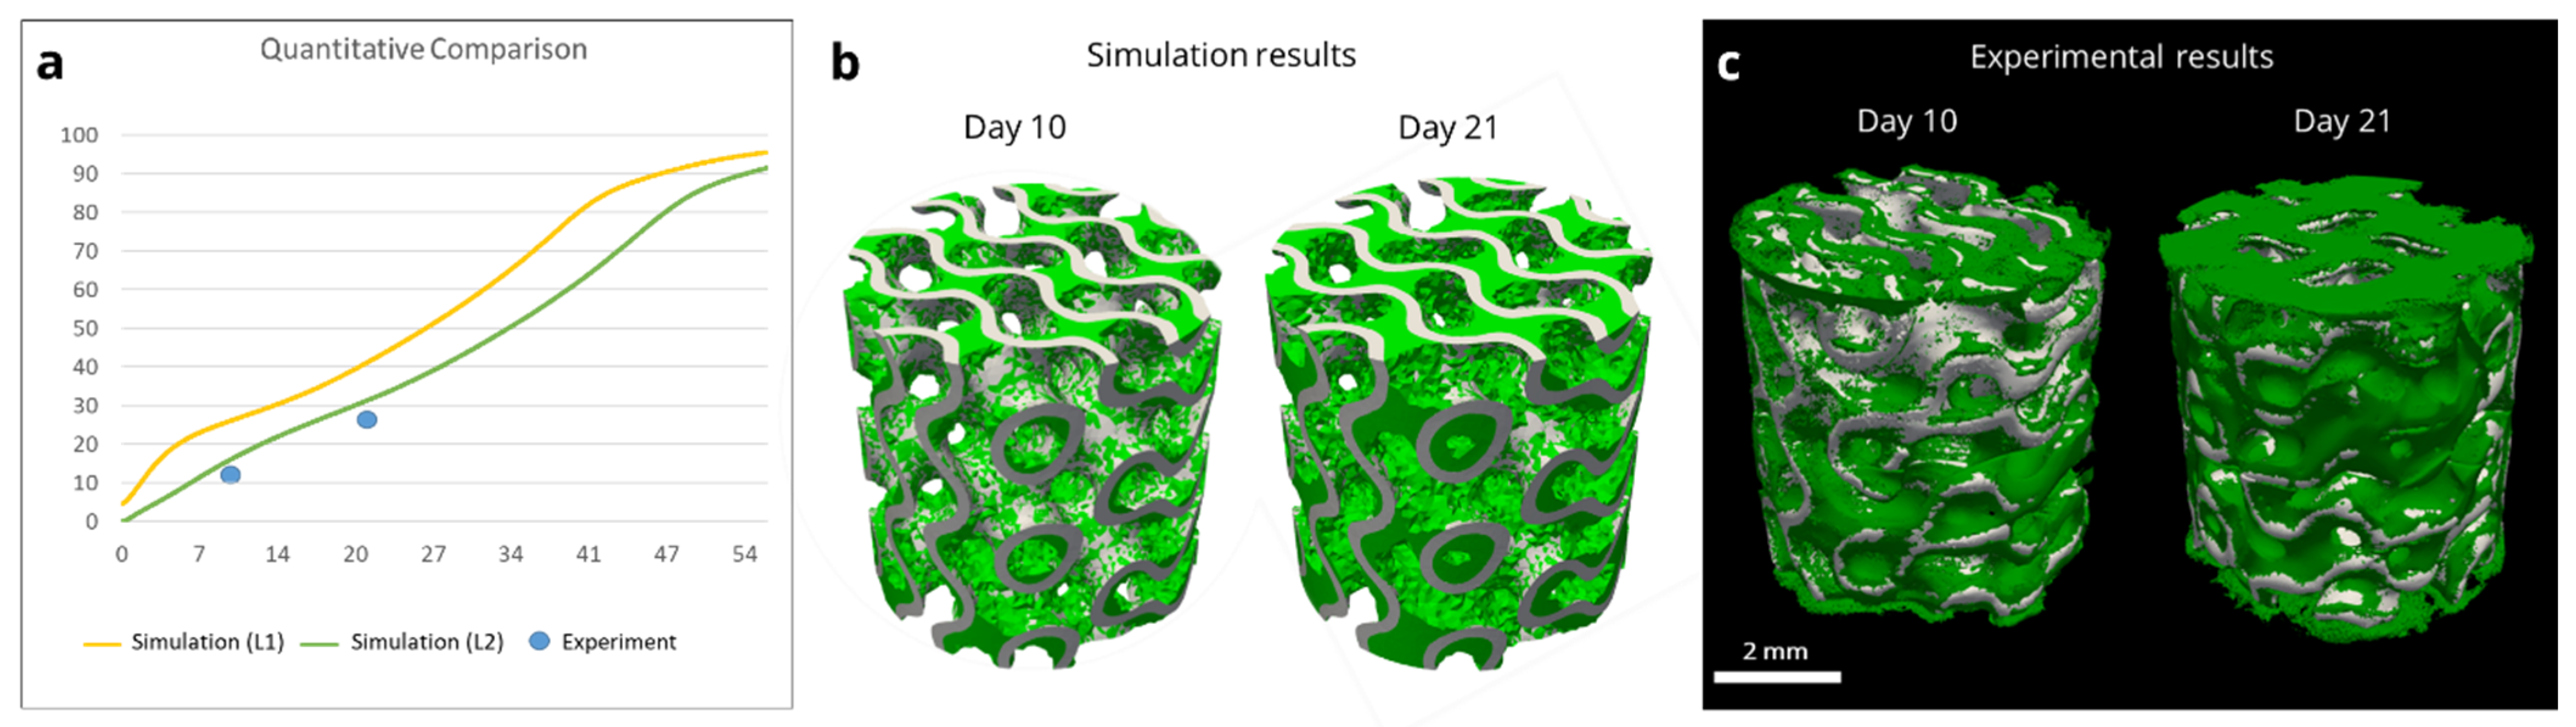
3.3. Model-Informed 3D Scaffold Design and Validation

Based on the results obtained with the basic geometries, neotissue growth in a 3D HAp structure was predicted and experimentally assessed to provide a validation step. A triply-periodic minimal surface structure (gyroid) was designed with a 0.2 mm wall thickness and 0.9 mm pore size (Figure 1d) to respect manufacturing constraints. Due to differences in the initial seeding densities between the experimental disc and 3D structure experiments, different values of the thickness of the initial cell layer were tested (10 µm (L1 in Figure 6a) and 1 µm (L2 in Figure 6a), respectively), as seeding at a non-confluent density was followed by a period of mostly 2D growth before starting growth in the third dimension, leading to an overall reduction in the speed of neotissue formation (Figure 6a,b). In vitro experiments under static conditions in growth medium were executed for the designed gyroid structure, produced in HAp, and analyzed using contrast-enhanced nanoCT imaging (with Hexabrix as a contrast agent) (Figure 6c). The quantitative comparison demonstrated a similar trend in neotissue growth between day 10 and day 21, illustrating the potential of the model to be used as a tool to design 3D bone tissue engineering scaffolds.

4. Discussion

Optimizing the scaffold shape with respect to cell (in)growth remains an open challenge in tissue engineering. With additive manufacturing, not only material composition and overall porosity but also the microarchitecture can be designed and accurately produced. The present model builds on previous work for simulating neotissue growth in titanium additively manufactured scaffolds [22] in order to investigate neotissue growth in calcium-phosphate-based scaffolds. First, a dedicated 2D+ in vitro experiment was designed, allowing us to qualitatively and quantitatively compare the influence of channel shape and size for different CaP materials. The final calibrated model was then used to predict neotissue growth on a 3D gyroid-based scaffold, showing adequate agreement between the simulation results and the in vitro experiments. The most important contribution of this study is the application of the neotissue growth model to CaP additively manufactured scaffolds, moving from basic shapes and 2D+ substrates to experimentally validated complex 3D structures.
A Bayesian approach was followed for calibrating the computational-intensive model [38] since it minimizes the number of optimization iterations, during each of which the computational model should run at least once. Since evaluating the objective function is expensive, a Bayesian optimization routine considers the previous iterations to choose the following values by constructing a probability tree of the objective function, acting as a surrogate model, which makes the selected approach more efficient than gradient-based or fully stochastic methods [34]. The probability model is a conditional probability, p (score parameters), which gets updated by the optimization algorithm during each iteration by incorporating newly obtained results. This operation was carried out by Sequential Model-Based Optimization (SMBO) methods, which need fewer optimization iterations than methods relying on a random selection of values (stochastic methods) or approaches needing an evaluation of the objective function at least twice (gradient-based methods) [39].
Regardless of the basic shape and channel size tested, the neotissue growth showed the hallmarks of curvature-based growth, including the circularization of the neotissue-void interface taking place over time and the neotissue growth speed decreasing for the larger channel sizes. For all the materials tested, the triangular shape demonstrated the fastest growth with the lowest variability compared to the other channel geometries of the same size. This might appear to contrast with our previous study, where, when testing basic shapes in titanium scaffolds, the triangle performed worst in terms of speed [22]. However, in that study, the parameter d was chosen as the diameter of the inscribed circle rather than the side of the triangle, as was done here (Figure 1b), leading to a substantially larger surface compared to the other shapes (~30%) with longer straight edges between the corners and hence a slower filling. The results of this study are in agreement with other reports using a dimensionalization similar to the one used here [20]. For the smallest diameter channels (500 µm in the hexagon and circle), complete filling was reached during the experiment in between the first and second observation time points, explaining the experimentally observed change in growth speed between both points. Not knowing the exact point of filling, the simulations were unable to account for it accurately, leading to a smoother behavior in the simulation results compared to the experimental observations.
Extending the use of the model from basic shapes towards 3D structures for the same materials and experimental settings is a strong point of this study. For the 2D+ set-up, cells were seeded at a density close to confluency to speed up the onset of growth inside the channels. For the 3D structure, a lower initial density was chosen, moving towards densities more typically used in tissue engineering applications [40]. This meant that the initial phase of the neotissue growth was mostly driven by the growth of cells onto the substrate [41]. As this type of growth is not captured by the current model, it was simulated by lowering the initial thickness of the cell layer to 1µm. This resulted in slower predicted neotissue growth in the initial phase, followed by a neotissue growth rate and final filling density similar to those obtained for a higher initial cell layer, in line with the experimental observations (Figure 6a). This second phase of neotissue growth is characterized by cells growing on top of the extracellular matrix they have produced themselves, as described in [41]. The gyroid structure used in this study (defined by its pore size and wall thickness) was the result of an in silico study in the context of oral bone regeneration, balancing the need for rapid neotissue (in)growth, the need for a high neotissue-to-biomaterial ratio, and the constraints imposed by the additive manufacturing process. The gyroid structure was tested for its capacity to induce in vivo bone formation in a cranial augmentation model (implantation without seeded cells), showing the superiority of the design over the clinically used gold standard and a lattice structure control [10].
Compared to our own previous work [22,42], moving from titanium to CaP-based materials led to a decrease in the neotissue growth rate. This might be related to the active nature of the CaP material, which could be shifting the balance from the proliferation of the progenitor cells towards their early differentiation [43] or to the difference in surface composition and topography [44]. Both factors might also provide additional insight into the obtained experimental differences for the different materials that were tested. A wide range of in vitro and in vivo studies have been reported in the literature with the different calcium phosphate materials used in this study (reviewed extensively in [45,46,47,48,49,50,51]). These reports describe how differences in composition, manufacturing techniques, sintering temperatures, surface treatments, etc., result in differences in terms of (amongst others) mechanical properties, dissolution rates, biological activity, and bone formation potential. Added to this are the effects that the in vitro and in vivo conditions themselves have on the experimental results (e.g., the same materials respond differently in different animal models [50]). Confirmation of the possible causes explaining the observed differences between the materials in this study could be obtained from additional biological experiments involving gene expression analysis on the cultured cells in the neotissue or material tests such as X-ray diffraction to analyze material decomposition; however, this falls outside of the scope of this study.
This study provides additional experimental and numerical support for the current research focus on triply-periodic minimal surfaces in bone tissue engineering. This focus was inspired by the development of the relatively new field of curvature-based biology (see [19] and references within). In this field, the mechanistic underpinnings of the effect of local curvature on neotissue growth (linked to intercellular tensile forces) have been investigated in a range of materials and applications [21,25,26,41,52]. On the other hand, in the tissue engineering field, many studies address either theoretical aspects of the description of 3D structures [53] or focus on particular mechanical or mass transport [54,55,56]. This study sits at the interface between the aforementioned approaches, using a combined in vitro–in silico approach with a focus on the biological outcome. As such, it provides a clear basis for the further testing of these structures in in vivo settings [10].

5. Conclusions

In this study, a curvature-based tissue growth model was adapted for use in calcium phosphate 3D additively manufactured structures. After model calibration by a coupled in silico–in vitro approach, the final model’s potential for simulating neotissue growth was demonstrated on a 3D gyroid scaffold. The in silico framework presented in this study has demonstrated its ability to be used as a tool for designing improved bone tissue engineering scaffolds and can easily be extended with additional design features for other applications in the future.

Author Contributions

Conceptualization, L.G. and B.L.; methodology, L.G. and M.B.; software, B.L. and M.B.; validation, B.L., E.S.D., and D.V.H.; formal analysis: B.L., E.S.D., and D.V.H.; resources: B.V. and G.N.; writing: B.L., L.G.; writing—review and editing: E.S.D., D.V.H., M.B., G.N., J.P., F.L., and L.G.; supervision, L.G. and F.L.; project administration, J.P.; funding acquisition, L.G., D.V.H., and F.L. All authors have read and agreed to the published version of the manuscript.

Funding

This research was funded by the Walloon Region (SPW Recherche) through the BioWin project BIOPTOS (ID: 7560) and the Win2Wal project B2Bone (2210023), the Fund for Scientific Research Belgium FNRS-FRFC (project ID: T.0256.16), the Interreg VA Flanders—The Netherlands project Prosperos (grant no.: 2014TC16RFCB046), and the European Union’s Horizon 2020 research and innovation program via the European Research Council (ERC CoG INSITE 772418). The APC was funded by the Walloon Region (SPW Recherche) through the Win2Wal project B2Bone (2210023).

Institutional Review Board Statement

The study used a commercially procured cell line, related ethical clearance was obtained by the company.

Informed Consent Statement

Not applicable.

Data Availability Statement

Quantified data are contained within the article and supplementary materials. All raw images and software can be made available upon request.

Acknowledgments

We gratefully acknowledge technical support by Carla Geeroms on the nano CT scanning.

Conflicts of Interest

The authors declare no conflict of interest. Justine Pirson is an employee of Wishone SA. The paper reflects the views of the scientists, and not the company. The funders had no role in the design of the study; in the collection, analyses, or interpretation of data; in the writing of the manuscript; or in the decision to publish the results.

Appendix A

Table A1. Raw numbers and averages of the neotissue filling percentages for the different time points (10 and 21), materials (HAp, TCP, BCP), channel shapes (C: circle; H: hexagon; S: square; T: triangle), and channel sizes (500: 0.5 mm; 700: 0.7 mm; 1000: 1 mm; 2000: 2 mm).
[%]S1S2S3AverageS1S2S3AverageS1S2S3AverageS1S2S3Average
HAp-C500 HAp-C700 HAp-C1000
day 1043353838.6737313333.6734352531.33
day 21979110096.0097959395.0086756776.00
HAp-H500 HAp-H700 HAp-H1000
day 1062667668.0024202322.3318241820.00
day 211009610098.6793909191.3375818580.33
HAp-S700 HAp-S1000 HAp-S2000
day 10 51394244.0019252222.005565.33
day 21 96918992.0053673551.6715111112.33
HAp-T700 HAp-T1000 HAp-T2000
day 10 59465152.0049415046.6726231722.00
day 21 931009395.339810010099.3334182927.00
TCP-C500 TCP-C700 TCP-C1000
day 1063696866.6753445751.3330242626.67
day 2193939292.6769689276.3332703545.67
TCP-H500 TCP-H700 TCP-H1000
day 1063877374.3357535555.0026332728.67
day 219610010098.6786928888.6790738582.67
TCP-S700 TCP-S1000 TCP-S2000
day 10 40504444.6736323233.337555.67
day 21 85948487.6741825659.6721272323.67
TCP-T700 TCP-T1000 TCP-T2000
day 10 36495747.3335505045.0020222522.33
day 21 921009094.0088889289.3335363936.67
BCP-C500 BCP-C700 BCP-C1000
day 1046303436.671291110.6710111010.33
day 2163656564.3333433838.0041372534.33
BCP-H500 BCP-H700 BCP-H1000
day 1045525049.0021221720.0013141915.33
day 2165806369.3369496360.3326272726.67
BCP-S700 BCP-S1000 BCP-S2000
day 10 20161316.3317201015.673945.33
day 21 79446663.0042604549.001311911.00
BCP-T700 BCP-T1000 BCP-T2000
day 10 57414547.6723273127.009101411.00
day 21 85658478.0084788582.3321161517.33
Figure A1. Comparison between experimental results (a) and in silico results (b) for all channel shapes for TCP disks. The parameter A was fixed at 0.01 during Bayesian optimization. The shapes are labelled by a letter (T: triangle; S: square; H: hexagon; C: circle) and a number indicating the channel diameter in micrometers. The experimental data are shown as the mean ± SD.
Jfb 14 00563 g0a1
Figure A2. Comparison between experimental results (a) and in silico results (b) for all channel sizes for TCP disks. The parameter A was fixed at 0.01 during Bayesian optimization. The shapes are labelled by a letter (T: triangle; S: square; H: hexagon; C: circle) and a number indicating the channel diameter in micrometers. The experimental data are shown as the mean ± SD.
Jfb 14 00563 g0a2
Figure A3. Comparison between experimental results (a) and in silico results (b) for all channel shapes for BCP disks. The parameter A was fixed at 0.001 during Bayesian optimization. The shapes are labelled by a letter (T: triangle; S: square, H: hexagon; C: circle) and a number indicating the channel diameter in micrometers. The experimental data are shown as the mean ± SD.
Jfb 14 00563 g0a3
Figure A4. Comparison between experimental results (a) and in silico results (b) for all channel sizes for BCP disks. The parameter A was fixed at 0.001 during Bayesian optimization. The shapes are labelled by a letter (T: triangle; S: square; H: hexagon; C: circle) and a number indicating the channel diameter in micrometers. The experimental data are shown as the mean ± SD.
Jfb 14 00563 g0a4

References

  1. Baldwin, P.; Li, D.J.; Auston, D.A.; Mir, H.S.; Yoon, R.S.; Koval, K.J. Autograft, Allograft, and Bone Graft Substitutes: Clinical Evidence and Indications for Use in the Setting of Orthopaedic Trauma Surgery. J. Orthop. Trauma 2019, 33, 203–213. [Google Scholar] [CrossRef]
  2. Schmidt, A.H. Autologous Bone Graft: Is It Still the Gold Standard? Injury 2021, 52, S18–S22. [Google Scholar] [CrossRef] [PubMed]
  3. Bone|Definition, Anatomy, & Composition|Britannica. Available online: https://www.britannica.com/science/bone-anatomy (accessed on 30 October 2023).
  4. Peacock, M. Calcium Metabolism in Health and Disease. J. Am. Soc. Nephr 2010, 5, S23–S30. [Google Scholar] [CrossRef] [PubMed]
  5. Foreman, M.A.; Gu, Y.; Howl, J.; Jones, S.; Publicover, S.J. Group III Metabotropic Glutamate Receptor Activation Inhibits Ca2+ Influx and Nitric Oxide Synthase Activity in Bone Marrow Stromal Cells. J. Cell. Physiol. 2005, 204, 704–713. [Google Scholar] [CrossRef] [PubMed]
  6. Riddle, R.C.; Taylor, A.F.; Genetos, D.C.; Donahue, H.J. MAP Kinase and Calcium Signaling Mediate Fluid Flow-induced Human Mesenchymal Stem Cell Proliferation. Am. J. Physiol. Cell Physiol. 2006, 290, C776–C784. [Google Scholar] [CrossRef]
  7. Hou, X.-D.; Zhang, L.; Zhou, Z.; Luo, X.; Wang, T.-L.; Zhao, X.-Y.; Lu, B.-Q.; Chen, F.; Zheng, L. Calcium Phosphate-based Biomaterials for Bone Repair. J. Funct. Biomater. 2022, 13, 187. [Google Scholar] [CrossRef] [PubMed]
  8. Garot, C.; Bettega, G.; Picart, C.; Picart, C. Additive Manufacturing of Material Scaffolds for Bone Regeneration: Toward Application in the Clinics. Adv. Funct. Mat. 2021, 31, 2006967. [Google Scholar] [CrossRef]
  9. Lin, K.; Sheikh, R.; Romanazzo, S.; Roohani, I. 3D Printing of Bioceramic Scaffolds—Barriers to the Clinical Translation: From Promise to Reality, and Future Perspectives. Materials 2019, 12, 2660. [Google Scholar] [CrossRef]
  10. Van hede, D.; Liang, B.; Anania, S.; Barzegari, M.; Verlee, B.; Nolens, G.; Pirson, J.; Geris, L. 3d-printed Synthetic Hydroxyapatite Scaffold with in silico Optimized Macrostructure Enhances Bone Formation in vivo. Adv. Funct. Mat. 2022, 32, 2105002. [Google Scholar] [CrossRef]
  11. Yang, Y.; Xu, T.; Bei, H.P.; Zhang, L.; Tang, C.Y.; Zhang, M.Y.; Xu, C.; Bian, L.; Yeung, K.W.K.; Fuh, J.Y.H. Gaussian Curvature–driven Direction of Cell Fate Toward Osteogenesis with Triply Periodic Minimal Surface Scaffolds. Proc. Natl. Acad. Sci. USA 2022, 119, e2206684119. [Google Scholar] [CrossRef]
  12. Li, Y.; Liu, J.; Zhong, C.; Zhao, C.C.; Shen, J.; Chen, H.; Ye, M.; Zhou, J.; Yang, X.; Gou, Z. The Design of Strut/tpms-based Pore Geometries in Bioceramic Scaffolds Guiding Osteogenesis and Angiogenesis in Bone Regeneration. Mater. Today Bio 2023, 20, 100667. [Google Scholar] [CrossRef]
  13. Carlier, A.; Lammens, J.; Van Oosterwyck, H.; Geris, L.; Geris, L. Computational Modeling of Bone Fracture Non-unions: Four Clinically Relevant Case Studies. Silico Cell Tissue Sci. 2015, 2, 1. [Google Scholar] [CrossRef] [PubMed]
  14. Perier-Metz, C.; Duda, G.N.; Checa, S. Mechano-biological Computer Model of Scaffold-supported Bone Regeneration: Effect of Bone Graft and Scaffold Structure on Large Bone Defect Tissue Patterning. Front. Bioeng. Biotechnol. 2020, 8, 585799. [Google Scholar] [CrossRef] [PubMed]
  15. Sandino, C.; Checa, S.; Prendergast, P.J.; Lacroix, D. Simulation of Angiogenesis and Cell Differentiation in a Cap Scaffold Subjected to Compressive Strains Using a Lattice Modeling Approach. Biomaterials 2010, 31, 2446–2452. [Google Scholar] [CrossRef]
  16. Sandino, C.; Lacroix, D. A Dynamical Study of the Mechanical Stimuli and Tissue Differentiation Within a Cap Scaffold Based on Micro-ct Finite Element Models. Biomech. Model. Mechanobiol. 2011, 10, 565–576. [Google Scholar] [CrossRef] [PubMed]
  17. Coelho, P.; Hollister, S.J.; Flanagan, C.L.; Fernandes, P.R. Bioresorbable Scaffolds for Bone Tissue Engineering: Optimal Design, Fabrication, Mechanical Testing and Scale-size Effects Analysis. Med. Eng. Phys. 2015, 37, 287–296. [Google Scholar] [CrossRef] [PubMed]
  18. Dias, M.; Guedes, J.M.; Flanagan, C.L.; Hollister, S.J.; Fernandes, P.R. Optimization of Scaffold Design for Bone Tissue Engineering: A Computational and Experimental Study. Med. Eng. Phys. 2014, 36, 448–457. [Google Scholar] [CrossRef] [PubMed]
  19. Schamberger, B.; Roschger, A.; Ziege, R.; Anselme, K.; Ben Amar, M.; Bykowski, M.; Castro, A.P.G.; Cipitria, A.; Coles, R.; Dimova, R.; et al. Curvature in Biological Systems: Its Quantification, Emergence, and Implications Across the Scales. Adv. Mater. 2023, 35, e2206110. [Google Scholar] [CrossRef]
  20. Rumpler, M.; Woesz, A.; Dunlop, J.; van Dongen, J.; Fratzl, P. The Effect of Geometry on Three-dimensional Tissue Growth. J. R. Soc. Interface 2008, 5, 1173–1180. [Google Scholar] [CrossRef]
  21. Bidan, C.M.; Kommareddy, K.P.; Rumpler, M.; Kollmannsberger, P.; Fratzl, P.; Dunlop, J.W.C. Geometry as a Factor for Tissue Growth: Towards Shape Optimization of Tissue Engineering Scaffolds. Adv. Healthc. Mat. 2013, 2, 186–194. [Google Scholar] [CrossRef]
  22. Guyot, Y.; Guyot, Y.; Papantoniou, I.; Chai, Y.C.; Bael, S.V.; Schrooten, J.; Geris, L.; Geris, L. A Computational Model for Cell/ecm Growth on 3D Surfaces Using the Level Set Method: A Bone Tissue Engineering Case Study. Biomech. Model. Mechanobiol. 2014, 13, 1361–1371. [Google Scholar] [CrossRef] [PubMed]
  23. Alias, M.A.; Alias, M.A.; Buenzli, P.R. Modeling the Effect of Curvature on the Collective Behavior of Cells Growing New Tissue. Biophys. J. 2017, 112, 193–204. [Google Scholar] [CrossRef] [PubMed]
  24. Blanquer, S.; Werner, M.; Hannula, M.; Sharifi, S.; Lajoinie, G.; Eglin, D.; Hyttinen, J.; Poot, A.A.; Grijpma, D.W. Surface Curvature in Triply-periodic Minimal Surface Architectures as a Distinct Design Parameter in Preparing Advanced Tissue Engineering Scaffolds. Biofabrication 2017, 9, 025001. [Google Scholar] [CrossRef] [PubMed]
  25. Buenzli, P.R.; Lanaro, M.; Wong, C.S.; McLaughlin, M.P.; Allenby, M.C.; Woodruff, M.A.; Simpson, M.J. Cell Proliferation and Migration Explain Pore Bridging Dynamics in 3D Printed Scaffolds of Different Pore Size. Acta Biomater. 2020, 114, 285–295. [Google Scholar] [CrossRef]
  26. Bidan, C.M.; Kommareddy, K.P.; Rumpler, M.; Kollmannsberger, P.; Bréchet, Y.J.M.; Fratzl, P.; Dunlop, J.W.C. How Linear Tension Converts to Curvature: Geometric Control of Bone Tissue Growth. PLoS ONE 2012, 7, e36336. [Google Scholar] [CrossRef]
  27. Osher, S.; Sethian, J.A. Fronts Propagating with Curvature-dependent Speed: Algorithms Based on Hamilton-jacobi Formulations. J. Comp. Phys. 1988, 79, 12–49. [Google Scholar] [CrossRef]
  28. Hecht, F. New development in FREEfem++. J. Num. Math. 2012, 20, 251–266. [Google Scholar] [CrossRef]
  29. Ribes, A.; Caremoli, C. Salomé platform component model for numerical simulation. In Proceedings of the 31st Annual International Computer Software and Applications Conference (COMPSAC 2007), Beijing, China, 24–27 July 2007; Volume 2, pp. 553–564. [Google Scholar] [CrossRef]
  30. Dapogny, C.; Frey, P. Computation of the signed distance function to a discrete contour on adapted triangulation. Calcolo 2012, 49, 193–219. [Google Scholar] [CrossRef]
  31. Polyanin, A.D.; Zaitsev, V.F.; Moussiaux, A. Handbook of First-Order Partial Differential Equations; CRC Press: Boca Raton, FL, USA, 2001. [Google Scholar]
  32. Amestoy, P.R.; Duff, I.S.; L’Excellent, J.Y.; Koster, J. MUMPS: A general purpose distributed memory sparse solver. In Applied Parallel Computing. New Paradigms for HPC in Industry and Academia; Sørevik, T., Manne, F., Gebremedhin, A.H., Moe, R., Eds.; Springer: Berlin/Heidelberg, Germany, 2000; Volume 1947, PARA 2000. Lecture Notes in Computer Science. [Google Scholar] [CrossRef]
  33. Ahrens, J.; Geveci, B.; Law, C. Paraview: An End-User Tool for Large Data Visualization. In The Visualization Handbook; Elsevier: Amsterdam, The Netherlands, 2005; pp. 717–731. [Google Scholar] [CrossRef]
  34. Mockus, J. Bayesian approach to global optimization: Theory and applications. Springer Sci. Bus. Media 2012, 37. [Google Scholar]
  35. Goffard, R.; Sforza, T.; Clarinval, A.-M.; Dormal, T.; Boilet, L.; Hocquet, S.; Cambier, F. Additive Manufacturing of Biocompatible Ceramics. Adv. Prod. Eng. Manag. 2013, 8, 96. [Google Scholar] [CrossRef]
  36. Champion, E. Sintering of calcium phosphate bioceramics. Acta Biomater. 2013, 9, 5855–5875. [Google Scholar] [CrossRef]
  37. Bouakaz, I.; Sadeghian Dehkord, E.; Meille, S.; Schrijnemakers, A.; Boschini, F.; Preux, N.; Hocquet, S.; Geris, L.; Nolens, G.; Grossin, D.; et al. 3D printed triply periodic minimal surfaces calcium phosphate bone substitute: The effect of porosity design on mechanical properties. Ceram. Interntl. 2023. [Google Scholar] [CrossRef]
  38. Barzegari, M.; Geris, L. An Open Source Crash Course on Parameter Estimation of Computational Models Using a Bayesian Optimization Approach. J. Open Source Ed. 2021, 4, 89. [Google Scholar] [CrossRef]
  39. Mehrian, M.; Mehrian, M.; Guyot, Y.; Guyot, Y.; Papantoniou, I.; Olofsson, S.; Sonnaert, M.; Misener, R.; Geris, L.; Geris, L. Maximizing Neotissue Growth Kinetics in a Perfusion Bioreactor: An in silico Strategy Using Model Reduction and Bayesian Optimization. Biotech. Bioeng. 2018, 115, 617–629. [Google Scholar] [CrossRef] [PubMed]
  40. Kerckhofs, G.; Chai, Y.C.; Luyten, F.P.; Geris, L. Combining microCT-based characterization with empirical modelling as a robust screening approach for the design of optimized CaP-containing scaffolds for progenitor cell-mediated bone formation. Acta Biomater. 2016, 35, 330–340. [Google Scholar] [CrossRef] [PubMed]
  41. Kommareddy, K.P.; Lange, C.; Rumpler, M.; Dunlop, J.W.C.; Manjubala, I.; Cui, J.; Kratz, K.; Lendlein, A.; Fratzl, P. Two stages in three-dimensional in vitro growth of tissue generated by osteoblastlike cells. Biointerphases 2010, 5, 45–52. [Google Scholar] [CrossRef] [PubMed]
  42. Van Bael, S.; Chai, Y.C.; Chai, Y.C.; Truscello, S.; Moesen, M.; Kerckhofs, G.; Van Oosterwyck, H.; Kruth, J.-P.; Schrooten, J. The Effect of Pore Geometry on the in vitro Biological Behavior of Human Periosteum-derived Cells Seeded on Selective Laser-melted Ti6al4v Bone Scaffolds. Acta Biomater. 2012, 8, 2824–2834. [Google Scholar] [CrossRef] [PubMed]
  43. Winning, L.; Robinson, L.; Boyd, A.; El Karim, I.A.; Lundy, F.; Meenan, B.J. Osteoblastic Differentiation of Periodontal Ligament Stem Cells on Non-stoichiometric Calcium Phosphate and Titanium Surfaces. J. Biomed. Mater. Res. A 2017, 105, 1692–1702. [Google Scholar] [CrossRef]
  44. Cun, X.; Hosta-Rigau, L. Topography: A Biophysical Approach to Direct the Fate of Mesenchymal Stem Cells in Tissue Engineering Applications. Nanomaterials 2020, 10, 2070. [Google Scholar] [CrossRef]
  45. Jeong, J.; Kim, J.H.; Shim, J.H.; Hwang, N.S.; Heo, C.Y.; Heo, C.Y. Bioactive Calcium Phosphate Materials and Applications in Bone Regeneration. Biomater. Res. 2019, 23, 4. [Google Scholar] [CrossRef]
  46. Milazzo, M.; Milazzo, M.; Contessi Negrini, N.; Contessi Negrini, N.; Scialla, S.; Marelli, B.; Farè, S.; Danti, S.; Danti, S.; Danti, S. Additive Manufacturing Approaches for Hydroxyapatite-reinforced Composites. Adv. Funct. Mater. 2019, 29, 1903055. [Google Scholar] [CrossRef]
  47. Bal, Z.; Kaito, T.; Korkusuz, F.; Yoshikawa, H. Bone Regeneration with Hydroxyapatite-based Biomaterials. Emerg. Mater. 2020, 3, 521–544. [Google Scholar] [CrossRef]
  48. Tavoni, M.; Dapporto, M.; Tampieri, A.; Sprio, S. Bioactive Calcium Phosphate-based Composites for Bone Regeneration. J. Compos. Sci. 2021, 5, 227. [Google Scholar] [CrossRef]
  49. Han, Y.; Wei, Q.; Chang, P.; Hu, K.; Okoro, O.V.; Shavandi, A.; Nie, L. Three-dimensional Printing of Hydroxyapatite Composites for Biomedical Application. Crystals 2021, 11, 353. [Google Scholar] [CrossRef]
  50. Yazdanpanah, Z.; Johnston, G.D.; Cooper, D.M.L.; Chen, X. 3D Bioprinted Scaffolds for Bone Tissue Engineering: State-of-the-art and Emerging Technologies. Front. Bioeng. Biotechnol. 2022, 10, 824156. [Google Scholar] [CrossRef]
  51. Nik Md Noordin Kahar, N.N.F.; Ahmad, N.; Jaafar, M.; Yahaya, B.H.; Sulaiman, A.R.; Abdul Hamid, Z.A. A Review of Bioceramics Scaffolds for Bone Defects in Different Types of Animal Models: HA and Β -TCP. Biomed. Phys. Eng. Express 2022, 8, 052002. [Google Scholar] [CrossRef]
  52. Callens, S.J.P. Emergent Collective Organization of Bone Cells in Complex Curvature Fields. Nat. Commun. 2023, 14, 855. [Google Scholar] [CrossRef]
  53. Callens, S.J.P.; Uyttendaele, R.J.C.; Fratila-Apachitei, L.E.; Zadpoor, A.A. Substrate Curvature as a Cue to Guide Spatiotemporal Cell and Tissue Organization. Biomaterials 2020, 232, 119739. [Google Scholar] [CrossRef]
  54. Hayashi, K.; Kishida, R.; Tsuchida, A.; Ishikawa, A. Superiority of Triply Periodic Minimal Surface Gyroid Structure to Strut-based Grid Structure in Both Strength and Bone Regeneration. ACS Appl. Mater. Interfaces 2023, 15, 34570–34577. [Google Scholar] [CrossRef]
  55. Li, Z.; Chen, Z.; Chen, X.; Zhao, R. Effect of Surface Curvature on the Mechanical and Mass-transport Properties of Additively Manufactured Tissue Scaffolds with Minimal Surfaces. ACS Biomater. Sci. Eng. 2022, 8, 1623–1643. [Google Scholar] [CrossRef]
  56. Pires, T.H.V.; Dunlop, J.W.C.; Castro, A.P.G.; Fernandes, P.R. Wall Shear Stress Analysis and Optimization in Tissue Engineering TPMS Scaffolds. Materials 2022, 15, 7375. [Google Scholar] [CrossRef] [PubMed]
Figure 1. In silico–in vitro experimental design element. (a) Schematic representation of the different domains of the level set method showing the curvature-based growth velocity (in blue) as well as the interface (in yellow) between the neotissue (in green, φ > 0) and void space (in white, φ < 0). (b) Individual channel geometries and sizes (indicated by d). (c) Additively manufactured disks shown in the wells (diameter 14 mm) of a 24-well plate submerged in culture medium. (d) 3D scaffold with gyroid design.
Jfb 14 00563 g001
Figure 2. Neotissue growth results in the different channels for HAp disks (representative images) for the different channel shapes and diameters over time. Looking vertically, it is evident that for every shape and size, curvature-driven neotissue formation is taking place over time. Scale bar (0.5 mm) is the same for all panels.
Jfb 14 00563 g002
Figure 3. Quantification of experimental results. (a) Percentage of channel cross-section filled with neotissue after 10 and 21 days for the different channel shapes, shown as the mean. The labels in the legend refer to the material used (HAp, TCP, BCP), the shape (C: circle, H: hexagon, S: square, T: triangle), and the channel diameter in micrometers. (b) Percentage of channels with a diameter of 0.7 mm filled with neotissue after 10 and 21 days comparing different CaP biomaterials, shown as the mean of various shapes ± SD, and (c) percentage of channels with a diameter of 0.7 mm filled with neotissue after 10 and 21 days comparing different shapes, shown as the mean of various biomaterials ± SD. Statistical significance is calculated by two-way ANOVA test; * p < 0.05.
Jfb 14 00563 g003
Figure 4. Comparison between experimental results (a) and in silico results (b) for each channel size (parameter A was fixed at 0.3 during Bayesian optimization) for HAp disks. The shapes are labelled by a letter (T: triangle; S: square; H: hexagon; C: circle) and a number indicating the channel diameter in micrometers. The experimental data are shown as mean ± SD.
Jfb 14 00563 g004
Figure 5. Comparison between experimental results (a) and in silico results (b) for each channel shape (parameter A was fixed at 0.3 during Bayesian optimization) for HAp disks. The shapes are labeled by a letter (T: triangle; S: square; H: hexagon; C: circle) and a number indicating the channel diameter in micrometer. The experimental data are shown as mean ± SD.
Jfb 14 00563 g005
Figure 6. Comparison between in vitro experiment and simulations for 3D HAp gyroid structure. (a) Quantification of the neotissue formation (% of filling as a function of time (days)) in the experiment (points) and simulations (full line). L1 = initial thickness of neotissue layer, 10 µm; L2 = initial thickness of neotissue layer, 1 µm. (b) Quantitative view of simulation results on day 10 and day 21. (c) Contrast-enhanced nanoCT images of in vitro experiments on day 10 and day 21, with neotissue in green pseudo-color.
Jfb 14 00563 g006
Table 1. Disk design, manufacturing parameters, and experimental variables considered for the in vitro experiment in this study.
Property Description
Pore shapesTriangle, square, hexagon, and circle
Pore size0.5 mm, 0.7 mm, 1 mm, and 2 mm
DistributionRandomly
MaterialsHydroxyapatite (HAp, 100%), Tricalcium phosphate (TCP, 100%), and mixed HAp 60%–TCP 40% pastes (supplier Cerhum)
Sintering temperature1030 °C for TCP100 and HAp60-TCP40 and 1130 °C for HAp100
Time points analysis10 days and 21 days
Cell typeHuman telomerase reverse transcriptase-immortalized bone marrow mesenchymal stem cells (hTERT-BMMSCs)
Disclaimer/Publisher’s Note: The statements, opinions and data contained in all publications are solely those of the individual author(s) and contributor(s) and not of MDPI and/or the editor(s). MDPI and/or the editor(s) disclaim responsibility for any injury to people or property resulting from any ideas, methods, instructions or products referred to in the content.

