Communication

Laser Powder Bed Fusion with Intentionally-Seeded Porosity for Prototyping of Powder Metallurgy Parts

by
Morgan Letenneur
1,
Pete Imbrogno
2,
Amin Molavi-Kakhki
3 and
Vladimir Brailovski
1,*
1
Department of Mechanical Engineering, École de Technologie Supérieure, 1100 Notre-Dame Street West, Montreal, QC H3C 1K3, Canada
2
Keystone Powdered Metal Co., 289 Eberl Street, St. Marys, PA 15857, USA
3
Rio Tinto Metal Powders, 1625, route Marie-Victorin, Sorel-Tracy, QC J3R 1M6, Canada
*
Author to whom correspondence should be addressed.
J. Manuf. Mater. Process. 2020, 4(4), 119; https://0-doi-org.brum.beds.ac.uk/10.3390/jmmp4040119
Submission received: 11 November 2020 / Revised: 4 December 2020 / Accepted: 9 December 2020 / Published: 11 December 2020

Abstract

:
Laser powder bed fusion (LPBF) additive manufacturing technology was used to produce functional prototypes of powder metallurgy (PM) components from high carbon content, iron-based water-atomized powders. The melt pool modeling and design of experiment approaches were combined in order to determine the LPBF operation window allowing to print parts with components similar to the PM in terms of density, microstructure and mechanical properties. The size, morphology and distribution of processing-induced pores were evaluated using computed tomography, while a microstructure analysis was carried out using X-ray diffraction and scanning electron microscopy, and the mechanical properties were evaluated using tensile and unnotched Charpy testing. It was demonstrated that LPBF technology could effectively be used for the just-in-time manufacture of high-fidelity functional prototypes of PM parts from iron-based powders.

1. Introduction

The development of new parts in the conventional powder metallurgy (PM) industry (powder forming via pressing and sintering) is a time-consuming process where, based on our experience, it can take up to 3 months to generate a first prototype. Indeed, the production of functional prototypes require the manufacture of a generic PM volume that is machined to final dimensions and, finally, tested. This sequence must be repeated several times if the prototype performance is found to be unsatisfactory, and the design needs to be modified. The possibility of using the laser powder bed fusion (LPBF) technology to manufacture high-fidelity functional prototypes of PM parts was explored in this study in a bid to reduce the lead time needed for the serial production of such new PM parts. This idea is based on the potential of LPBF technology to manufacture parts with a controlled level of porosity by modulating the printing (laser exposure) parameters [1,2,3,4]. This potential of LPBF technology was successfully used to produce components with intentionally seeded porosity with the objective of assessing the influence of processing-induced flaws on the mechanical properties of LPBF parts [4]. However, to the best of the authors’ knowledge, this strategy has not yet been reported for the purpose of reproducing PM parts generally containing a fairly high level of porosity (8–10%). One of the reasons for this lack of data is that this strategy clearly goes in the opposite direction to the omnipresent goal of maximizing the density of a printed alloy, striving to reach that of the alloy’s wrought equivalent.
Furthermore, the idea developed in this study is not only to create an adequate level of porosity, but also to reproduce the PM parts microstructure and mechanical properties. Note that in this context, this study targets the use of iron–copper–carbon PM alloy powders [5]. These powders are particularly suitable for applications that require good fatigue strength and resistance to shock loading. Indeed, the addition of ~2 wt.% of copper in the iron–carbon powder increases the mechanical properties of PM parts, more specifically the ultimate tensile strength and the fatigue resistance, due to solid solution strengthening taking place during the post-process thermal treatments [6,7]. However, a high carbon content of ~0.7 wt.% of these powders complicates their laser powder bed fusion. The appearance of hard and brittle martensite phase and a volume increase associated with the martensite formation decreases the powder weldability and increases the risk of hot and cold cracking. This last aspect must be considered when optimizing the LPBF processing conditions of these powders.
To reach the above goal, the following three main steps were followed. First, the powder feedstock of a given composition was produced using water atomization. Second, an industrial LPBF system was adapted to work with this powder feedstock, and the processing parameters of this system were adjusted to produce parts with a controlled level of density (porosity). The LPBF parts were then heat-treated, subjected to structural analysis in terms of density, phases, texture and grain size, and mechanically tested.

2. Methodology

2.1. Powder Manufacturing

2.1.1. Powder Preparation

The feedstock powder used in this research is a water-atomized powder with high copper and graphite contents. After the final processing steps, its composition corresponds to the MPIF FC-0208 grade. In conventional powder metallurgy, copper and graphite powders are added to an iron powder mixture as admixed. However, for the laser powder bed fusion manufacturing technique, these alloying elements should be added either as pre-alloyed or diffusion-bonded/diffusion-alloyed elements to prevent their segregation in the powder bed. On the one hand, a pre-alloyed FC-0208 steel powder can be produced by the addition of proper amounts of copper and graphite to liquid iron followed by the atomization of the alloyed molten metal. The atomization product must then be annealed to reduce the oxides present, and then screened to obtain an appropriate particle size distribution (PSD). On the other hand, to obtain the diffusion-bonded/diffusion-alloyed FC-0208 steel powder used in this study, an ATOMET 1001HP iron powder (Rio Tinto Metal Powder (RTMP), Sorel-Tracy, Canada) is initially screened to reach the appropriate PSD and mixed with proper amounts of copper and graphite powders. This powder mixture is then heated up to a certain temperature, allowing the carbon atoms to diffuse into iron particles (diffusion alloying), while the copper particles undergo metallurgical bonding with iron particles (diffusion bonding). Both processes produce a powder feedstock with a reduced risk of segregation, which is therefore appropriate for the LPBF process.

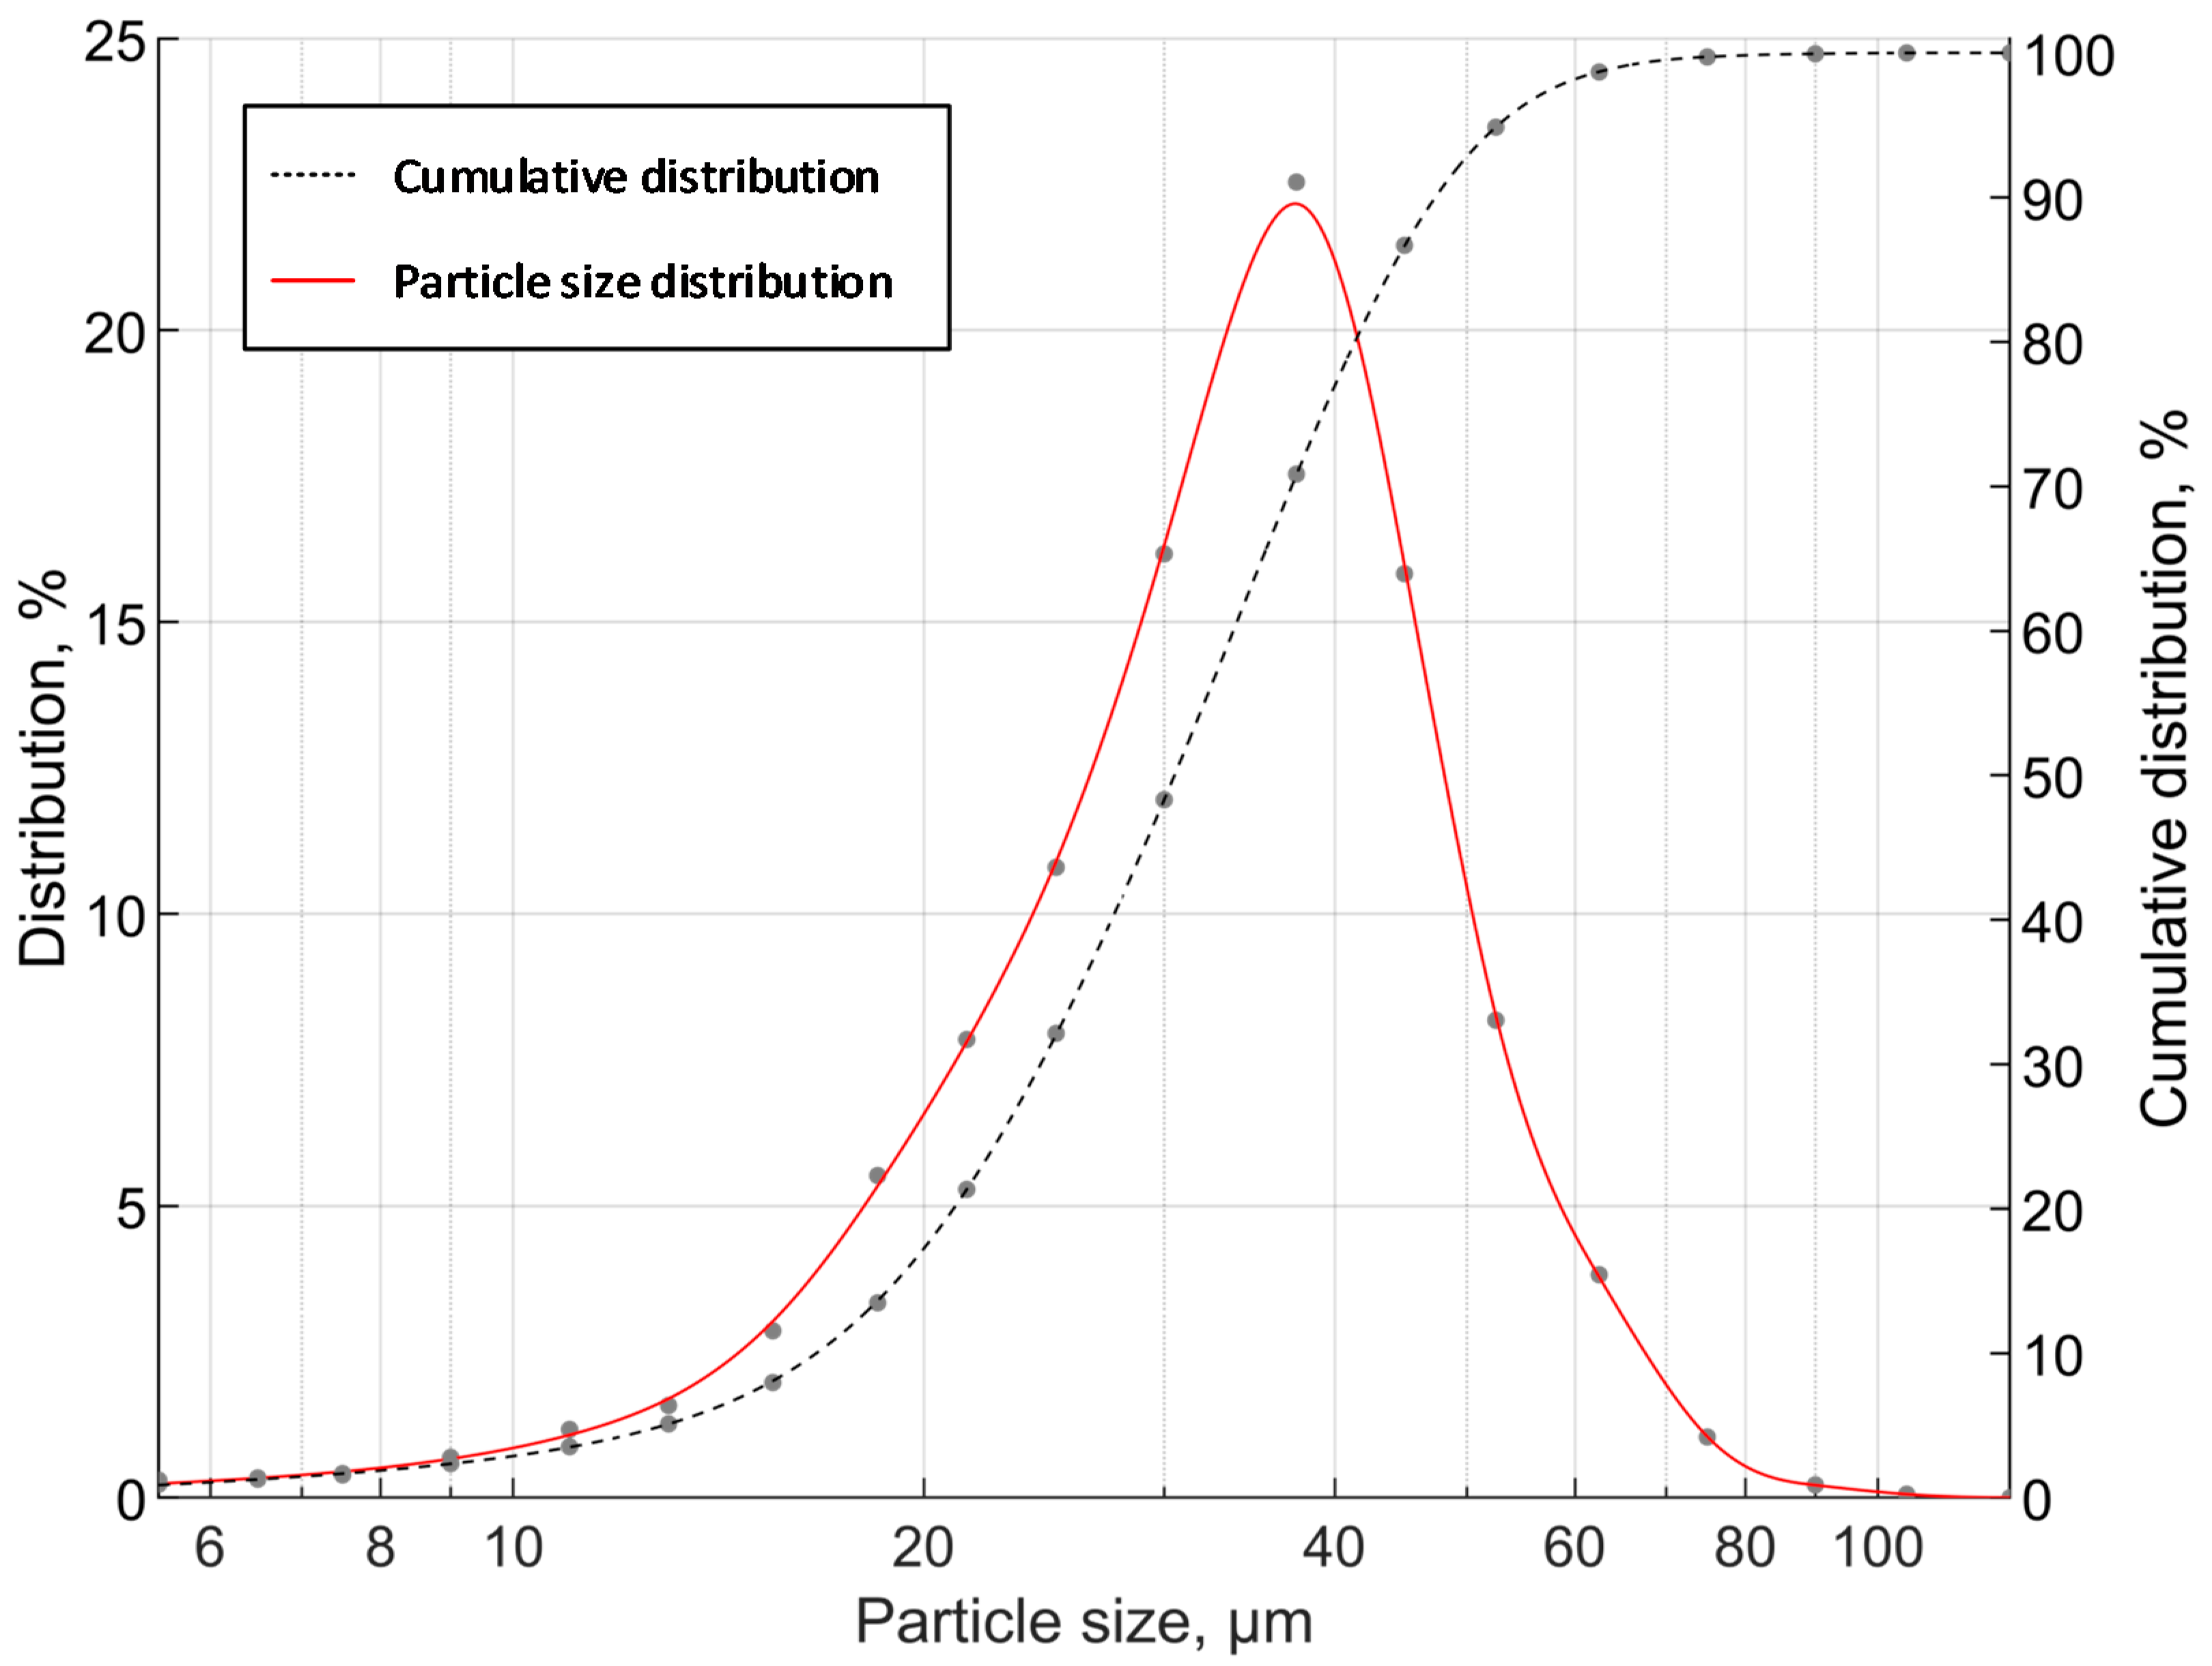
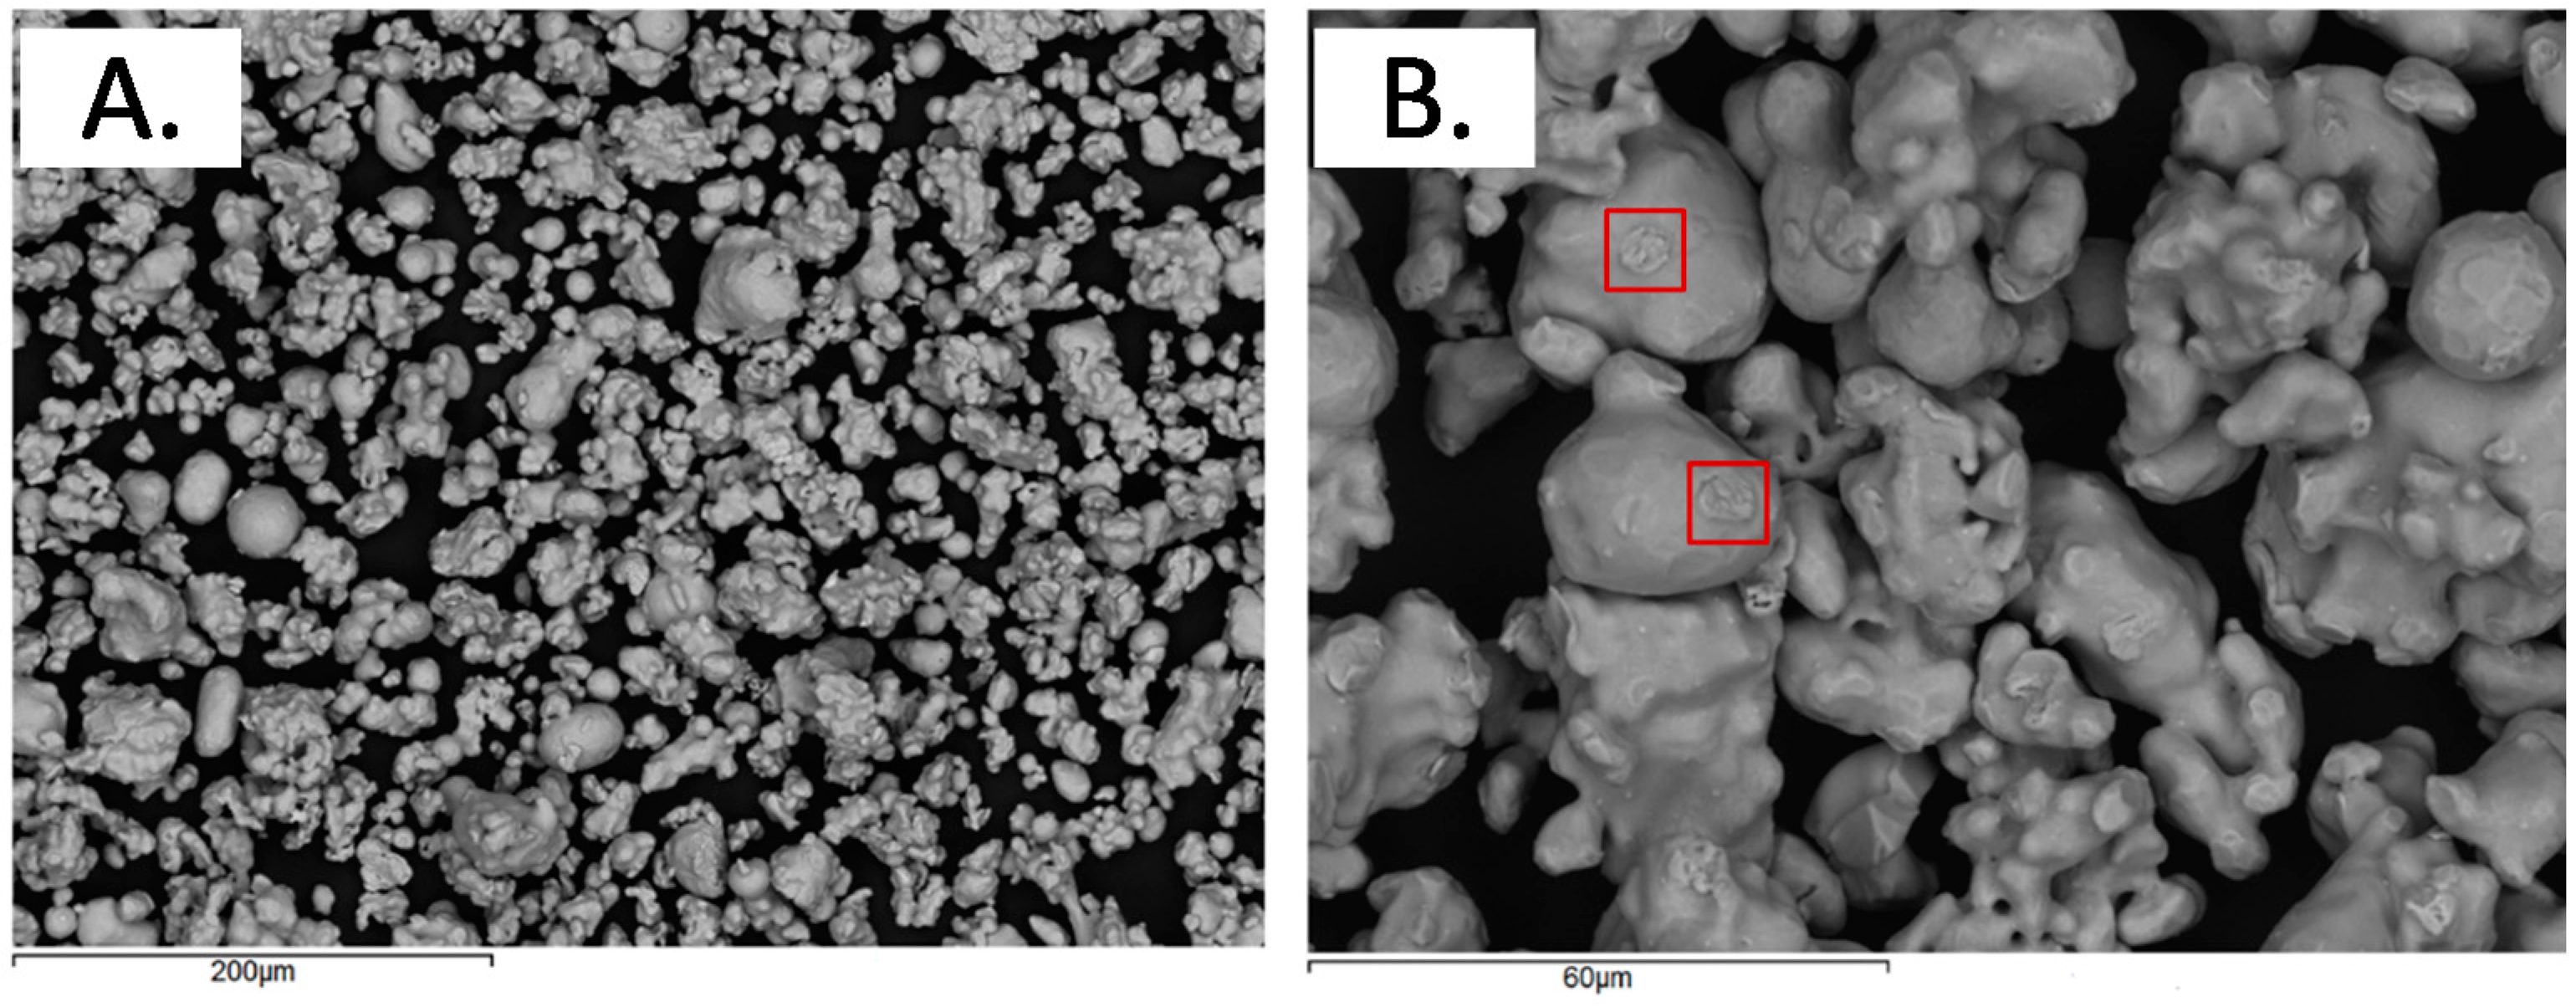
2.1.2. Powder Characterization

The levels of carbon and oxygen in the powders were measured using elemental analysis (LECO), while that of copper was assessed using the X-ray fluorescence (XRF) technique. The apparent density and flowability of the powders were measured in conformity with the MPIF standards 28 [8] and 46 [9], respectively, while the PSD and morphology of powder particles were measured using laser diffraction spectrometry (Sympatec, Helos/BR + Rodos) and scanning electron microscopy (SEM) techniques. Next, at RTMP, an in-house-designed dusting test was performed to determine the quality of the metallurgical bonding between the iron and fine copper particles formed during the diffusion bonding operation. This test can also be used to verify the percentage of carbon diffused into iron particles during the thermal treatment. To perform this test, a pressured air flow passes through a pre-weighed amount of powder mixture (with known copper and carbon contents). As a result of this air flow, fine and lightweight particles with loose bonding to iron particles are forced out of the powder mixture. Once the test is completed, the copper and carbon contents of the retained powder are measured and the dusting resistance of each of these additives is calculated as the ratio of the additive content after and before the test.

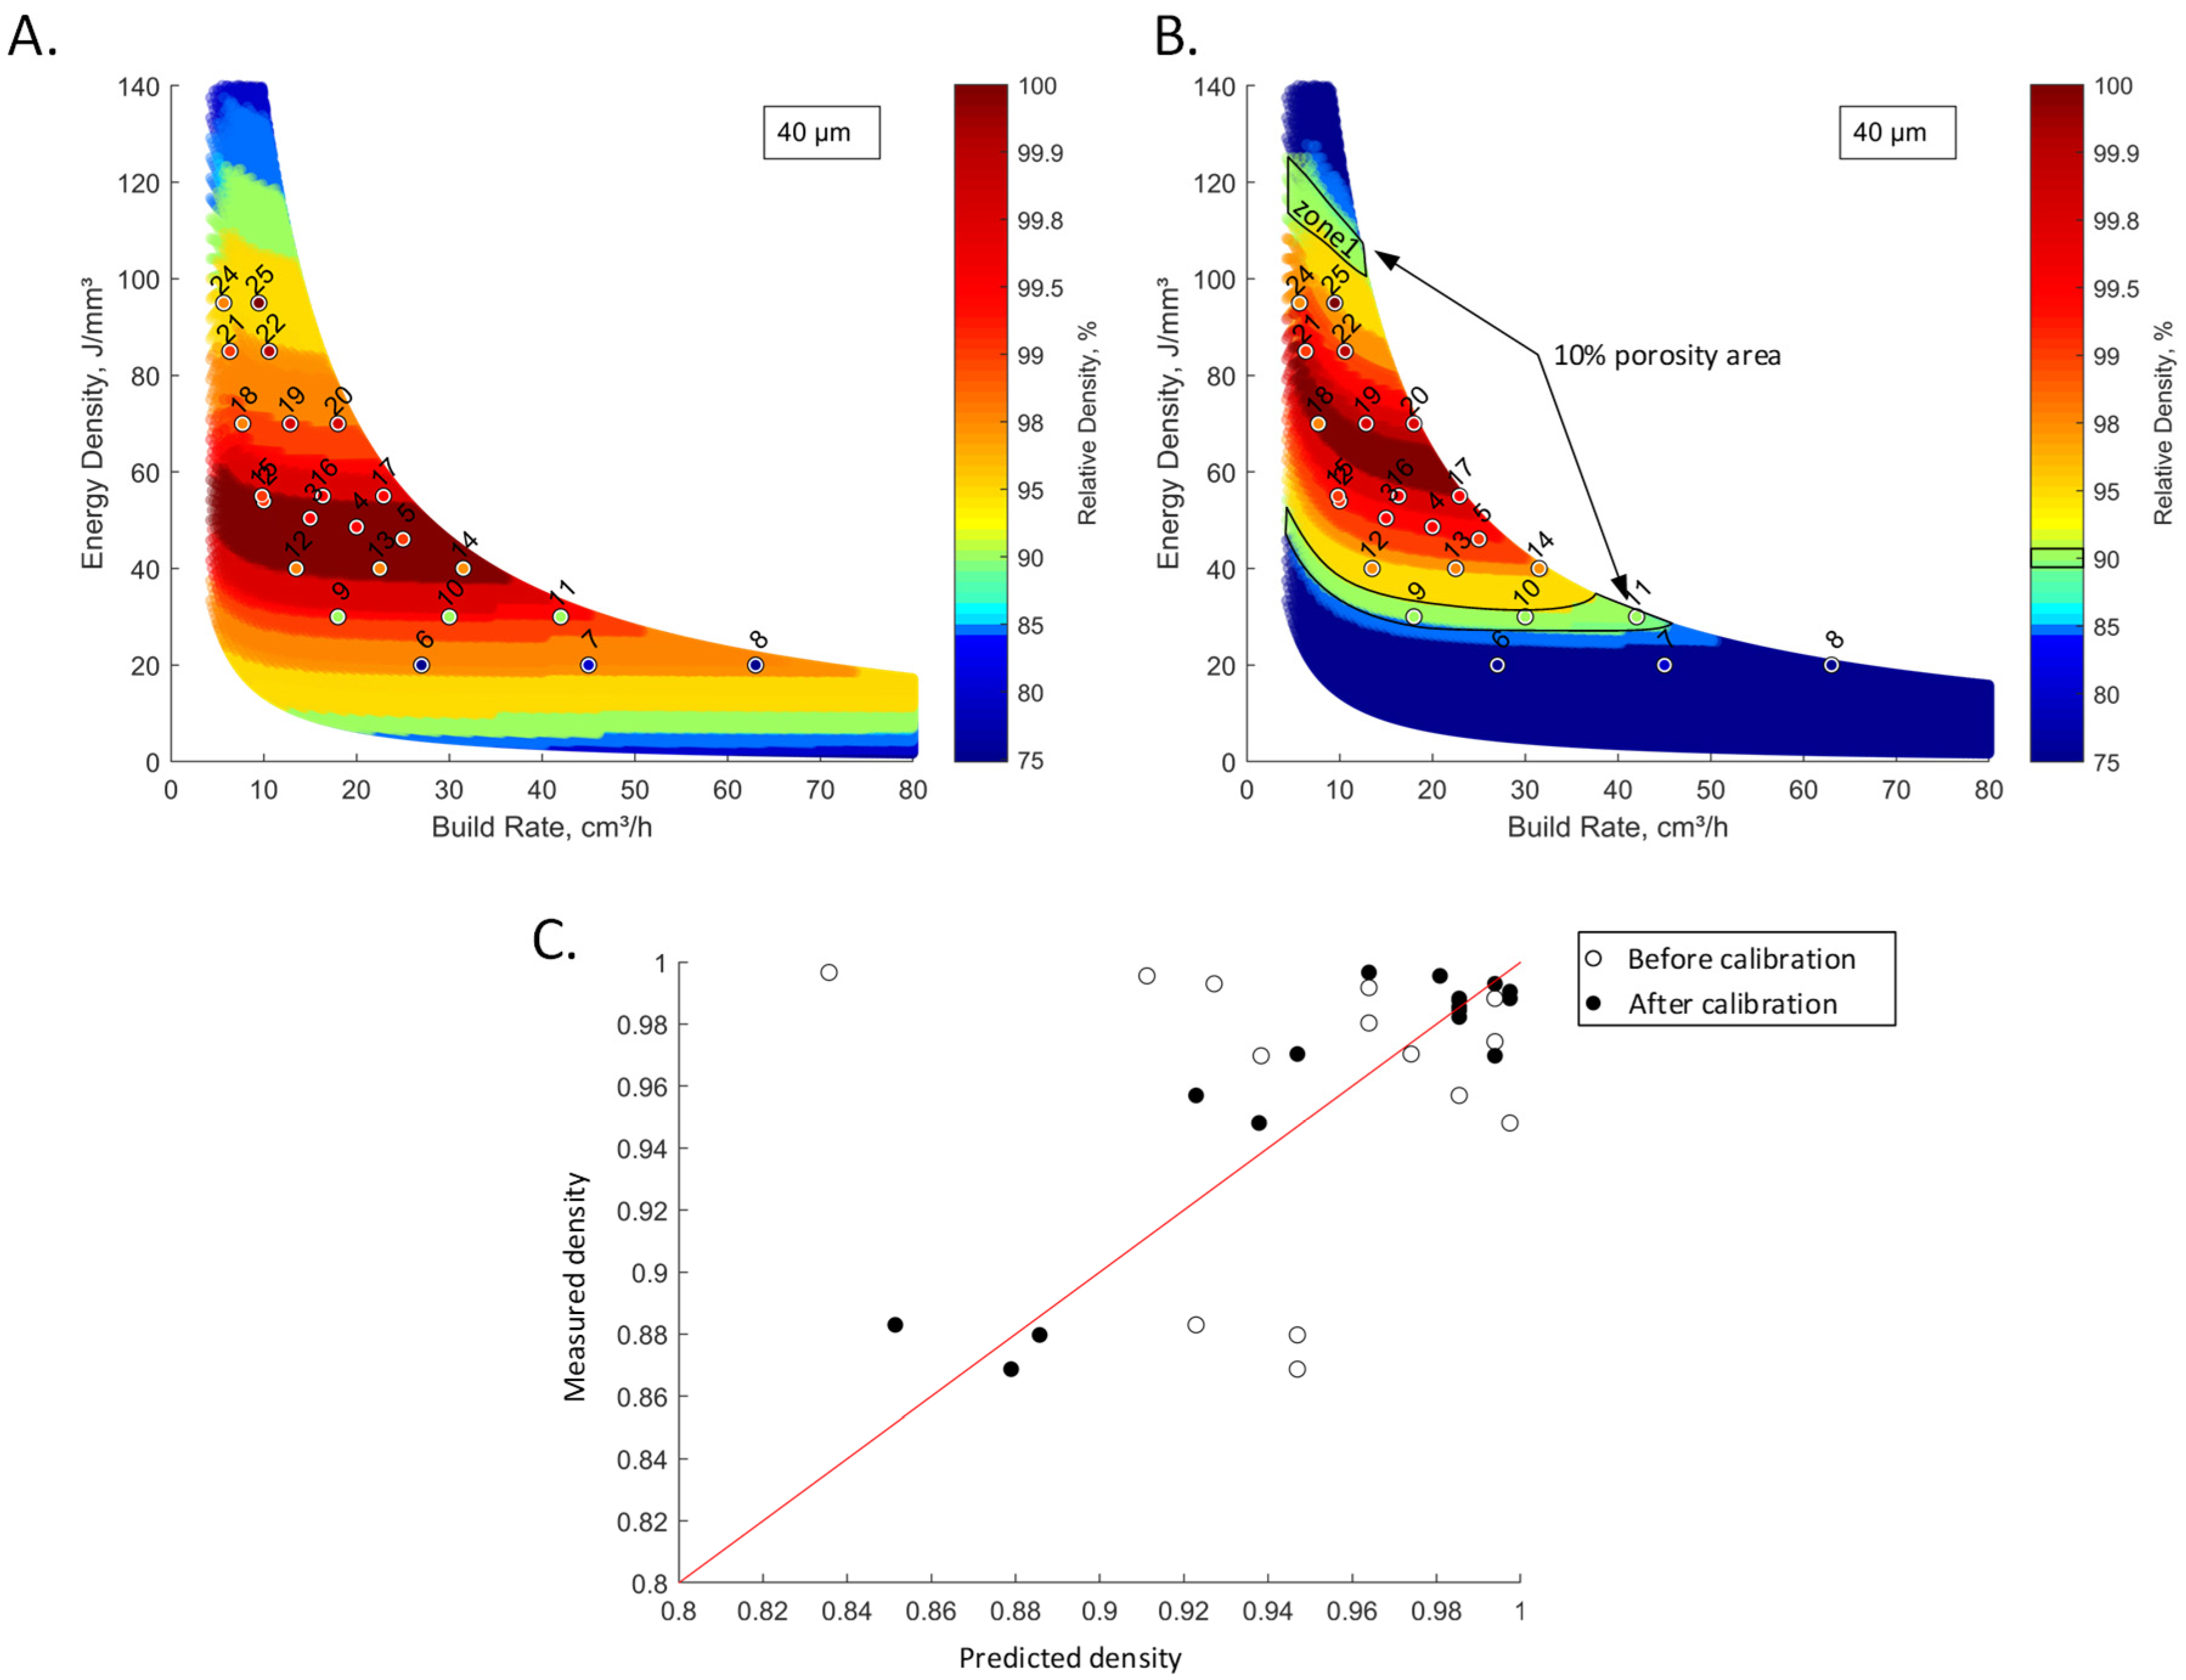
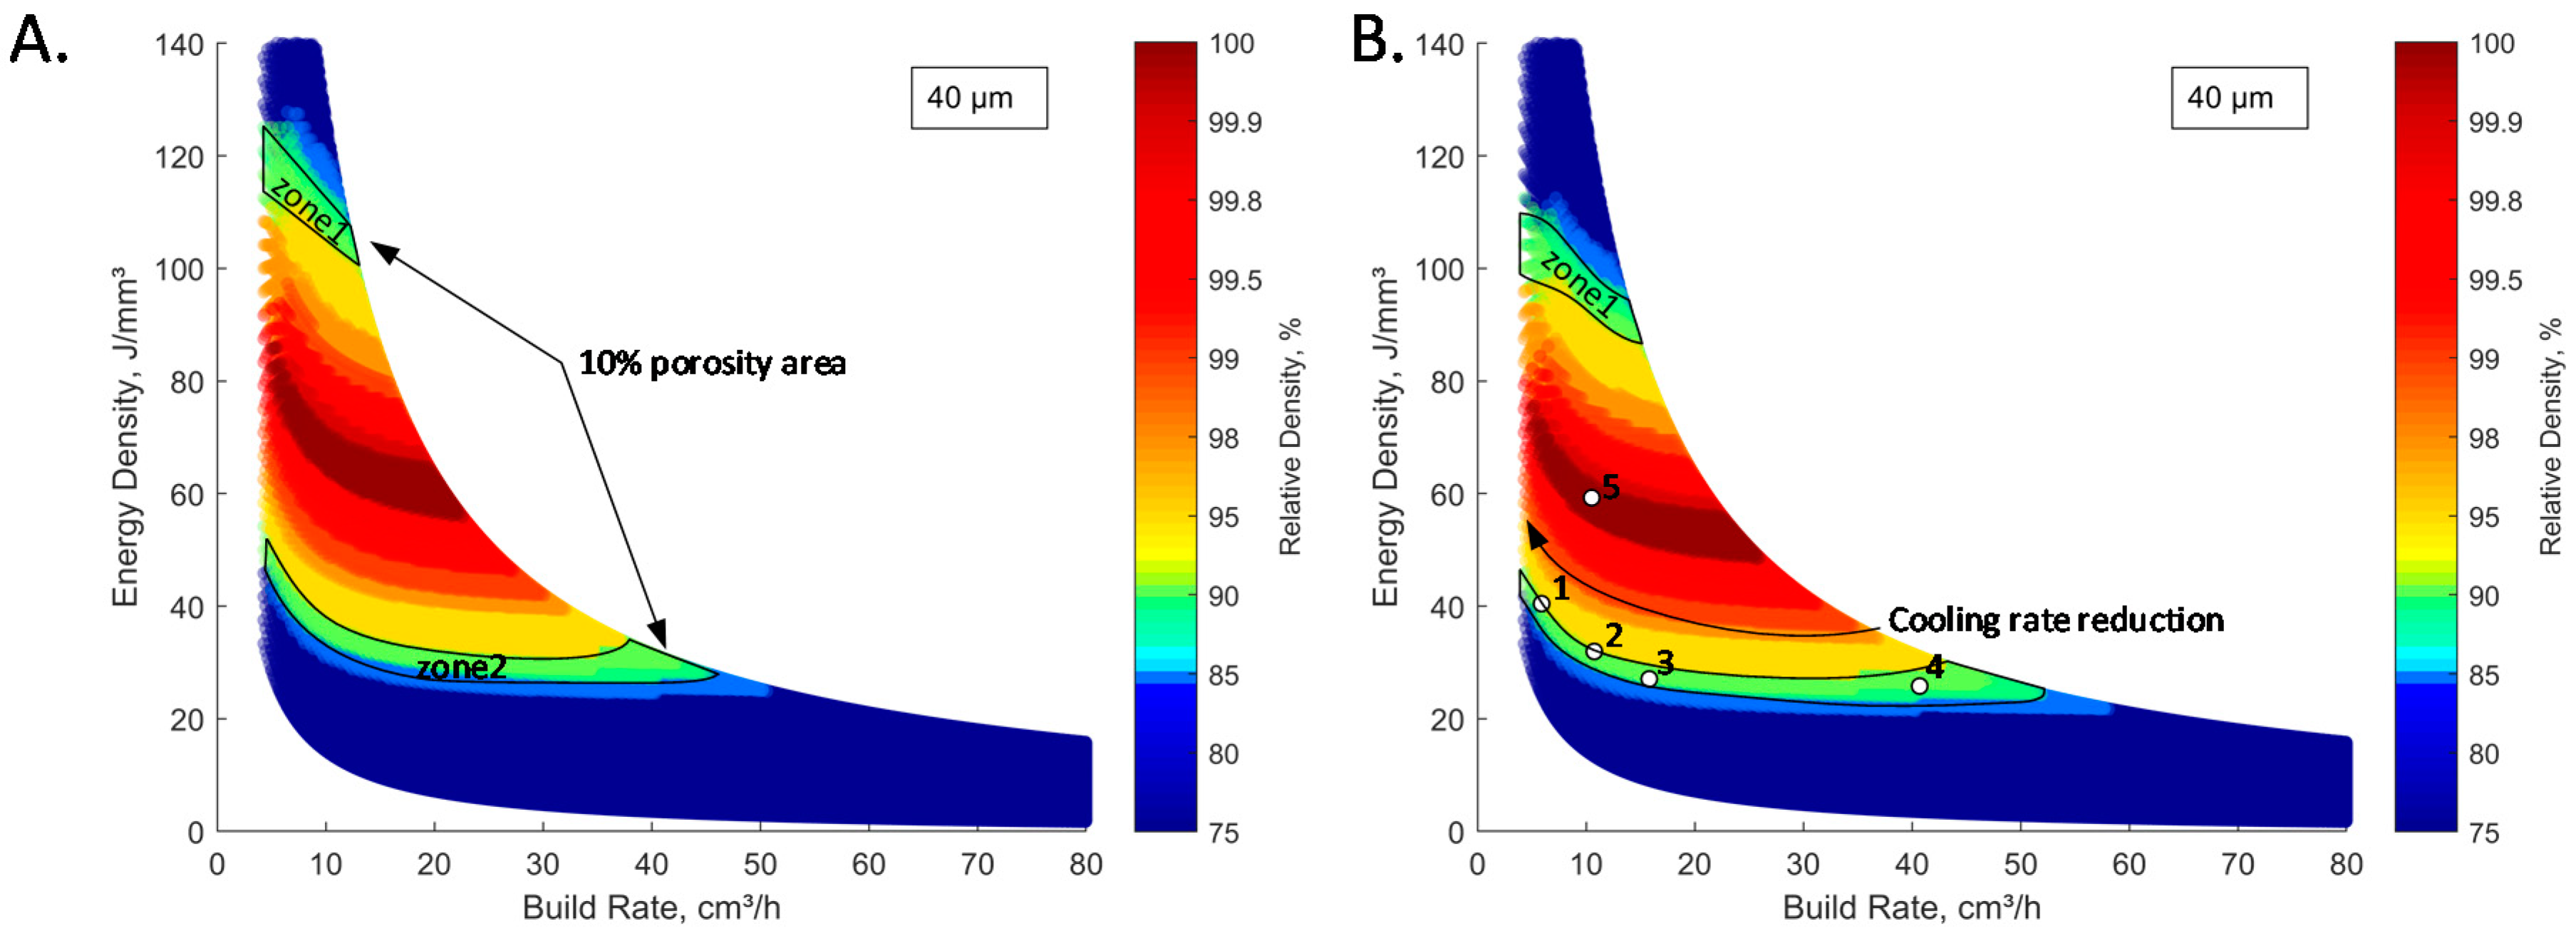
2.2. Laser Powder Bed Fusion Process Calibration and Optimization

The targeted density of the LPBF parts of this study corresponds to ~90% of the theoretical density of pure iron, or to ~7.0 g/cm3, these values being close to those of standard PM parts manufactured from iron-based powders. In the present study, the density of LPBF parts was controlled using a combined melt pool modeling-design of experiment approach, which was successfully validated for Fe [10], Ti-Zr-Nb [11], and AlSiMg, IN625, Ti64, 316 L [12] powders. As a first step of this study, this approach was used to build an initial density processing map shown in Figure 1A in the energy density (E)-build rate (BR) coordinates
E ( J / m m 3 ) = P v × h × t
B R ( c m 3 / h ) = v × h × t
where P is the laser power, v, the laser speed, h, the hatching space, and t, the layer thickness.
The initial density processing map in Figure 1A was built by varying the laser power from 40 to 380 W, the laser speed, from 200 to 4000 mm/s, and the hatching space, from 60 to 200 μm, while keeping a constant layer thickness of 40 μm and considering a powder bed density of φ = 65% (common value for commercial LPBF systems, this value was evaluated using the power encapsulated method [13]). Since the physical properties of the powders used in this study were not known, the properties of an AISI 1070 alloy with a carbon content close to that of the FC-0208 powders were used (Table 1).
Next, 25 10 × 10 × 10 (mm) calibration specimens covering the entire processing map of Figure 1A were printed using an EOSINT M280 LPBF system (EOS GmbH, Munich, Germany) equipped with a 400 W ytterbium fiber laser (effective beam radius reffective = 40 μm) and a standard EOS ceramic doctor blade. Once manufactured, the specimens were cut from the build plate and polished, and their density was measured using the Archimedes technique (ASTM B962-15) with a SARTORIUS Secura 324-1s scale (Sartorius, Goettingen, Germany) with a precision of 0.1 mg. Each density measurement was repeated at least three times. Based on the calibration density measurements results, the model was calibrated by minimizing the root mean squared error between the predicted and measured density values. The adjusted processing map is shown in Figure 1B, and the standard deviations between the predicted and measured density values before and after the adjustment are shown in Figure 1C.
Once the model is calibrated, a new set of printing parameters that would result in a relative density close to a target density of ~90% (or to an absolute density of 7.0 g/cm3) can be established. Note, however, that the alloy used in this study contains a high amount of carbon. This condition, combined with an extremely high cooling rate inherent to the LPBF process (~106 °C/s [15]), could result in the appearance of martensite, hot cracking and process failure. To reduce this risk, the processing-related cooling rate needs to be reduced as much as possible, while preserving the targeted density. To this end, two additional approaches are available: (a) heating the build plate, thus decreasing the temperature gradient and (b) decreasing the build rate, thus maximizing the melt pool size. To test these two approaches, the calibrated density processing map was first modified considering the use of a heated build plate. The processing maps for printing with the unheated and heated build plates can be compared in Figure 2A (identical to Figure 1B) and Figure 2B. The build plate temperature for the second map is 200 °C, which is the maximum build plate temperature for the conventional EOS M280 system.
Next, five sets of printing parameters were defined within the limits of the modified processing map of Figure 2B. Specimens 1–4 were selected to meet the objective of matching the target relative density of PM parts (~90%) and to assess the influence of the cooling rate on the risk of hot cracking, and Specimen 5 was taken as a reference specimen with a highest density of ≥99.9%. Note that a 90%-density Zone 1 (Figure 1B) was excluded from consideration, since over-melting occurring in this zone may alter the alloy chemical composition. To obtain the same material density of ~90%, heating the build plate resulted in a ~15% reduction in the laser energy density required for fusion (green zone containing Specimens 1 to 4 is shifted mainly downward, Figure 2A,B).
The quality of the specimens built was assessed in terms of their density and the presence of cracks; all of them met the ~90% density functional requirements and had no cracks. Based on these results, the processing conditions corresponding to those of Specimen 3 (E = 32 J/mm3 and BR = 16 cm3/h) were selected because they offered a well-balanced compromise between the productivity of the process and the risk of hot cracking (increasing the build rate increases the productivity, but at the expense of a higher cooling rate and, therefore, at a risk of hot cracking). The corresponding LPBF parameters (P = 140 W, v = 1380 mm/s, h = 80 µm and t = 40 µm) were finally used to manufacture ~90% density specimens for the structural analysis (porosity, grain size and phases) and mechanical characterization (Figure 3), and the results obtained were compared with those of the PM counterparts manufactured from the same powder composition.

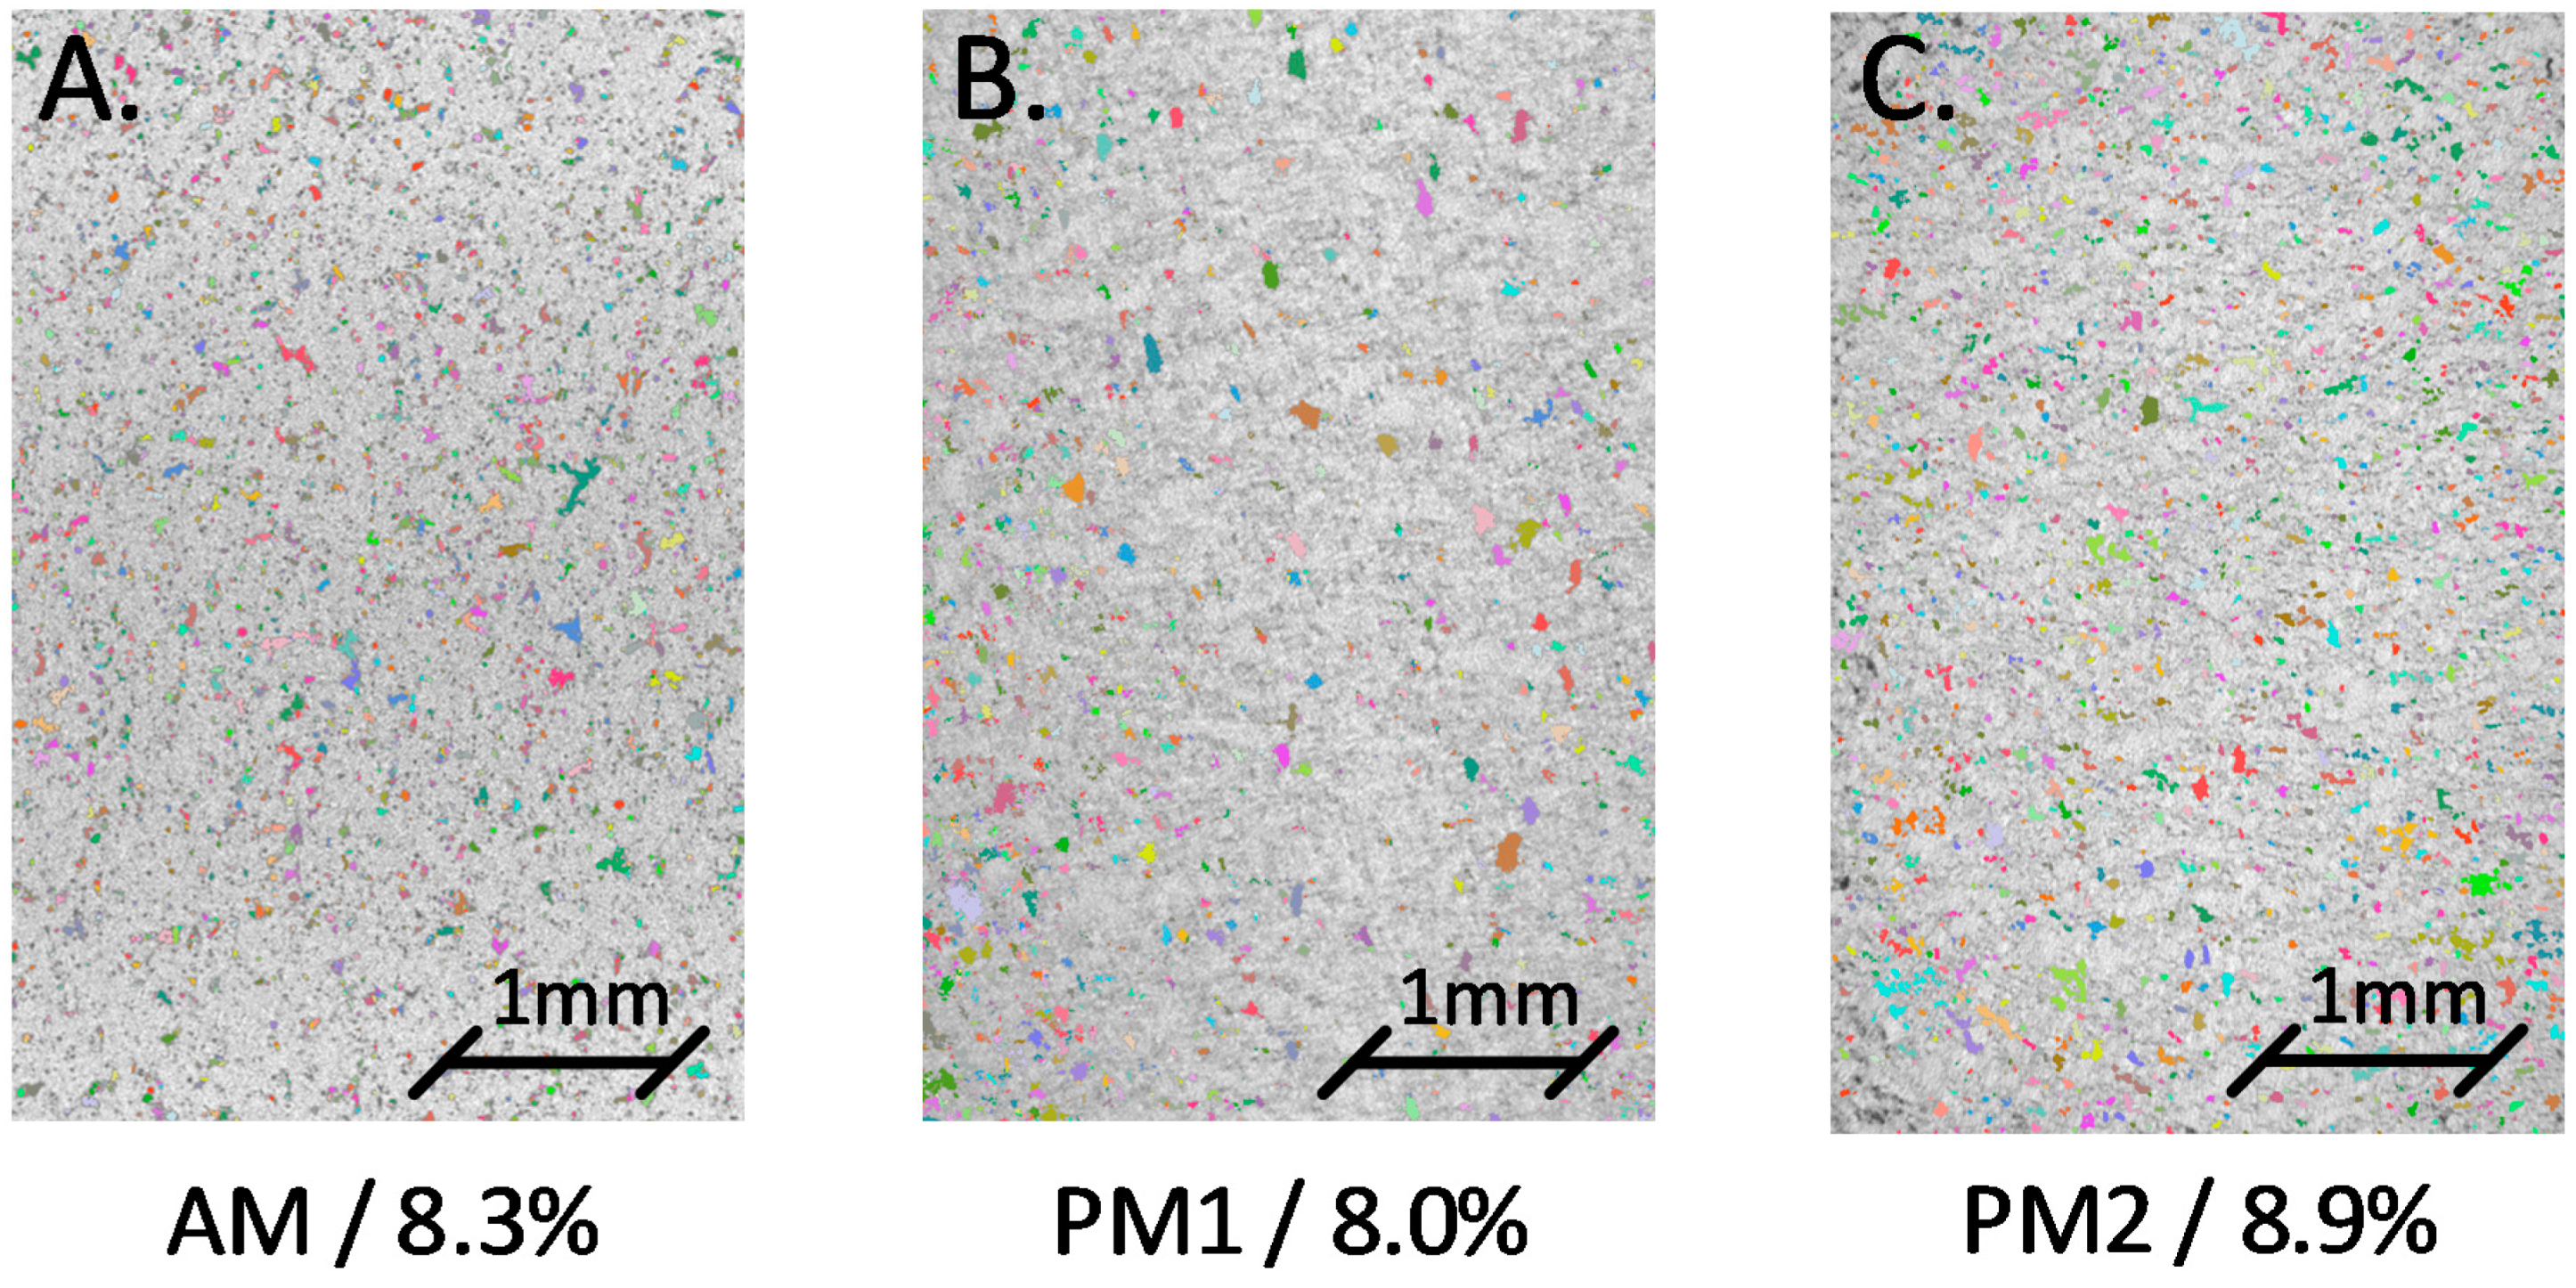
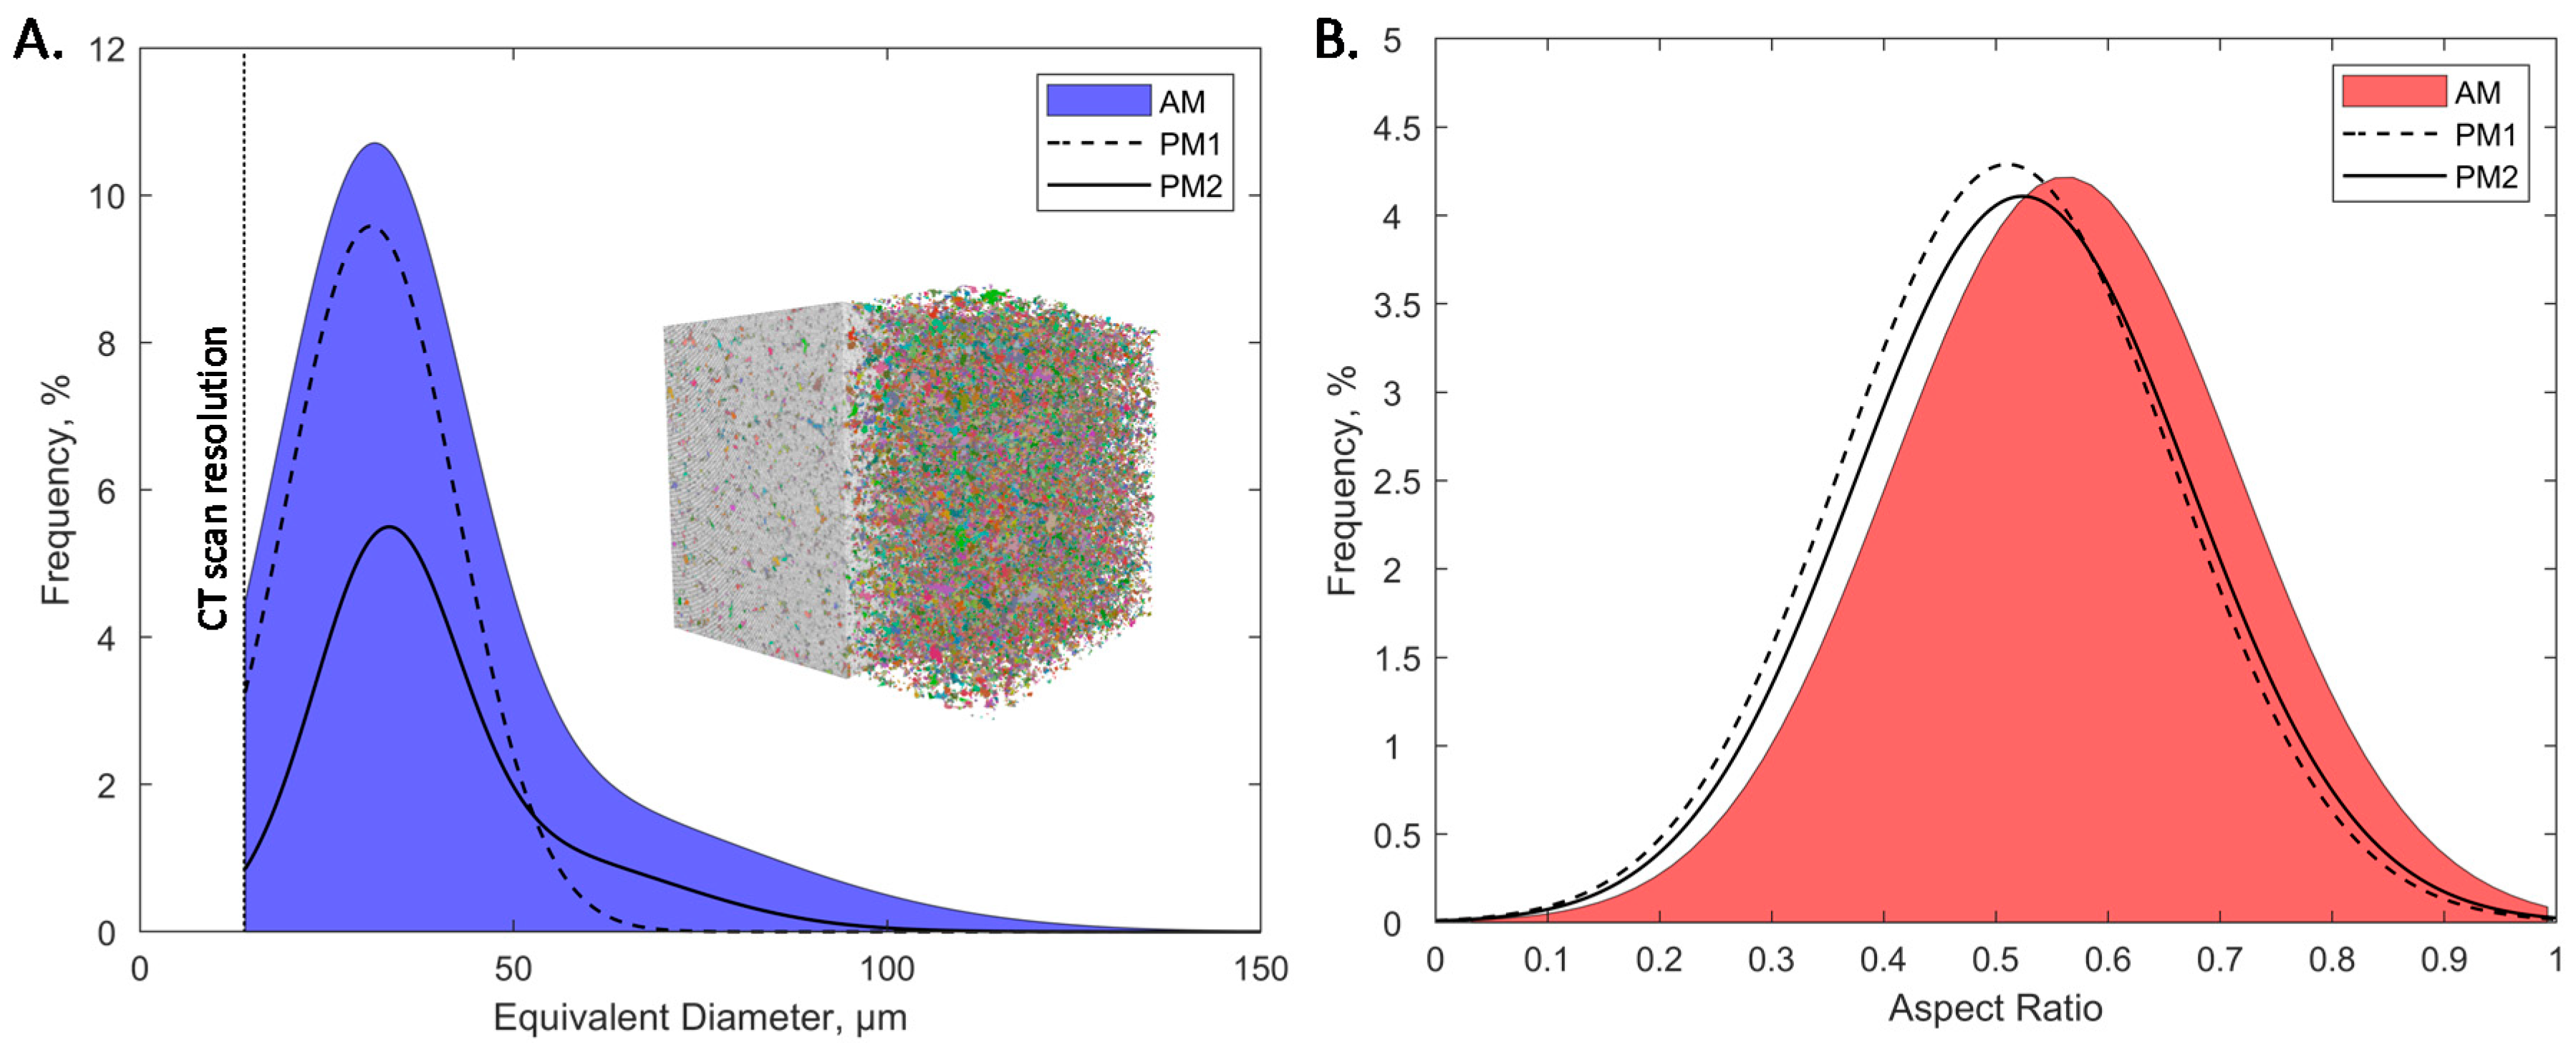
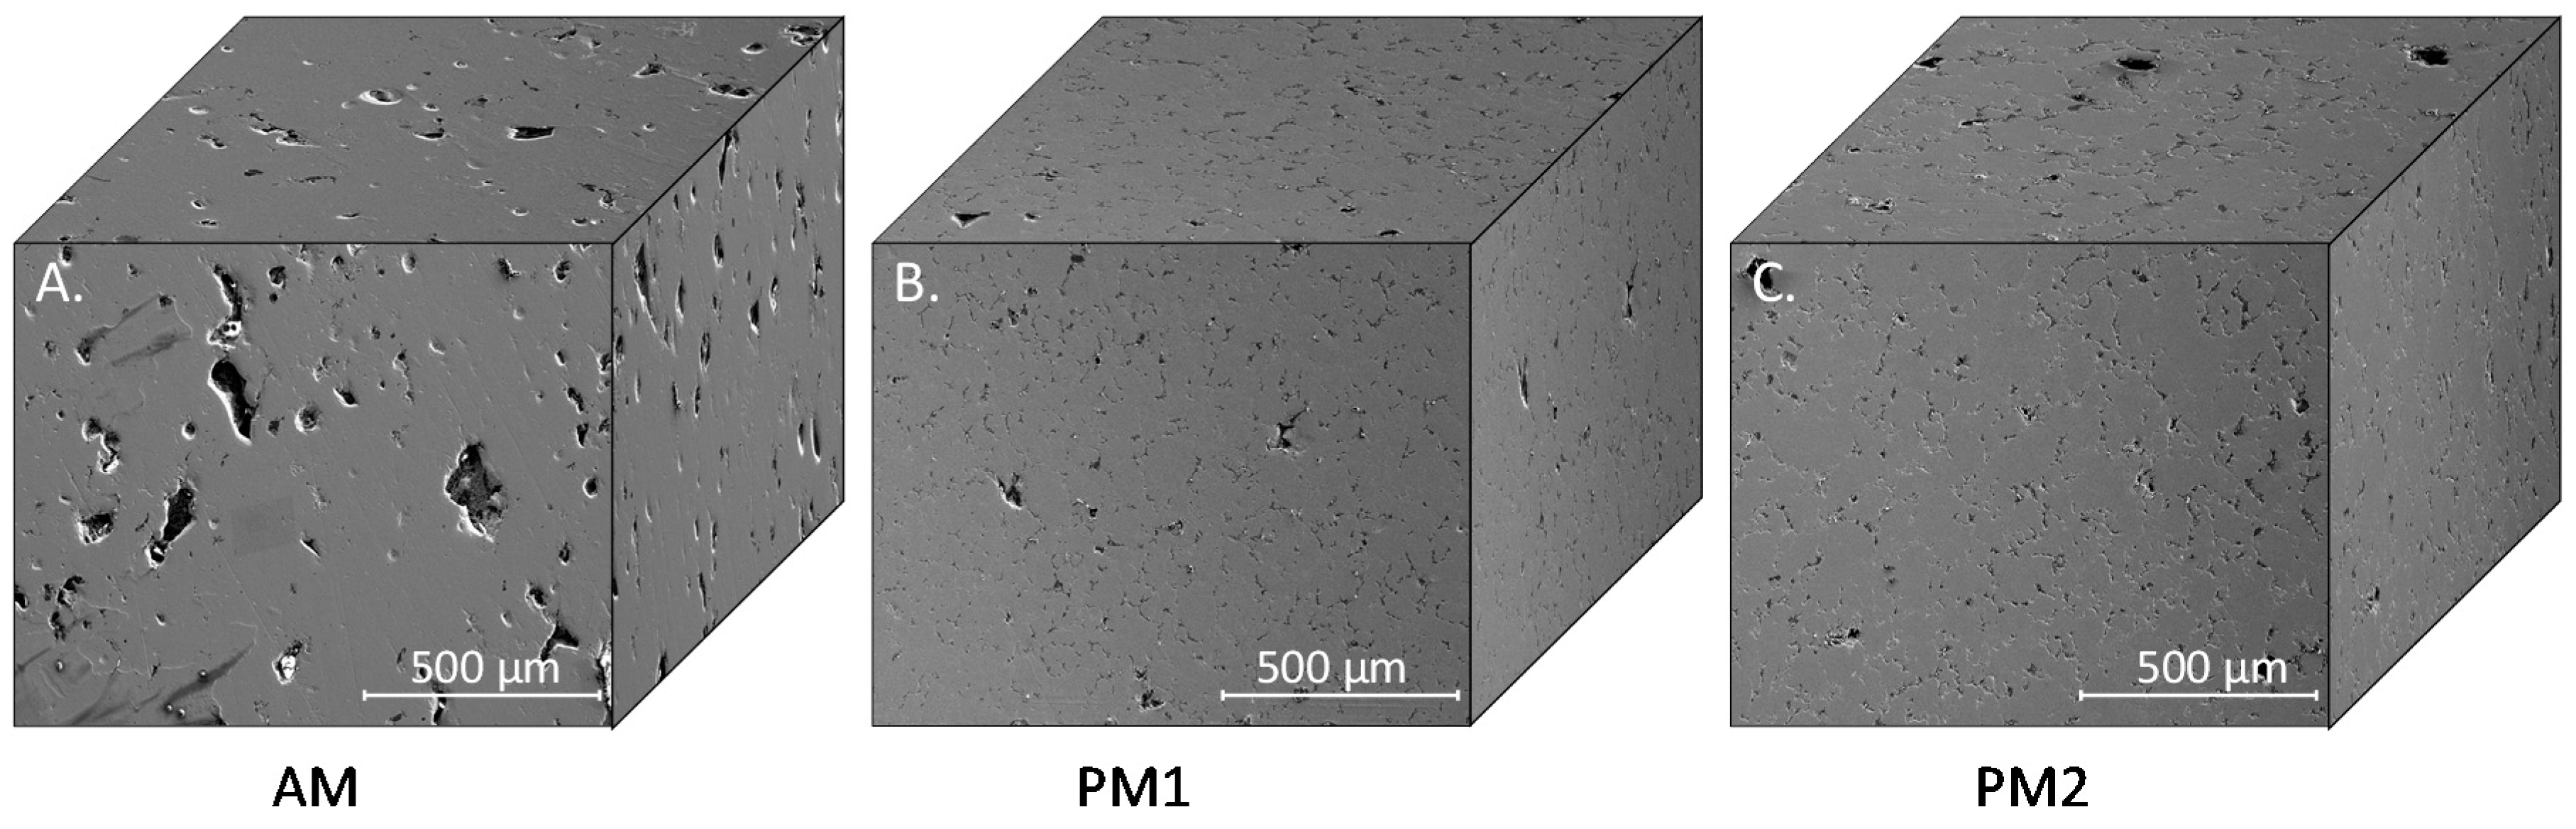
2.3. Porosity Analysis
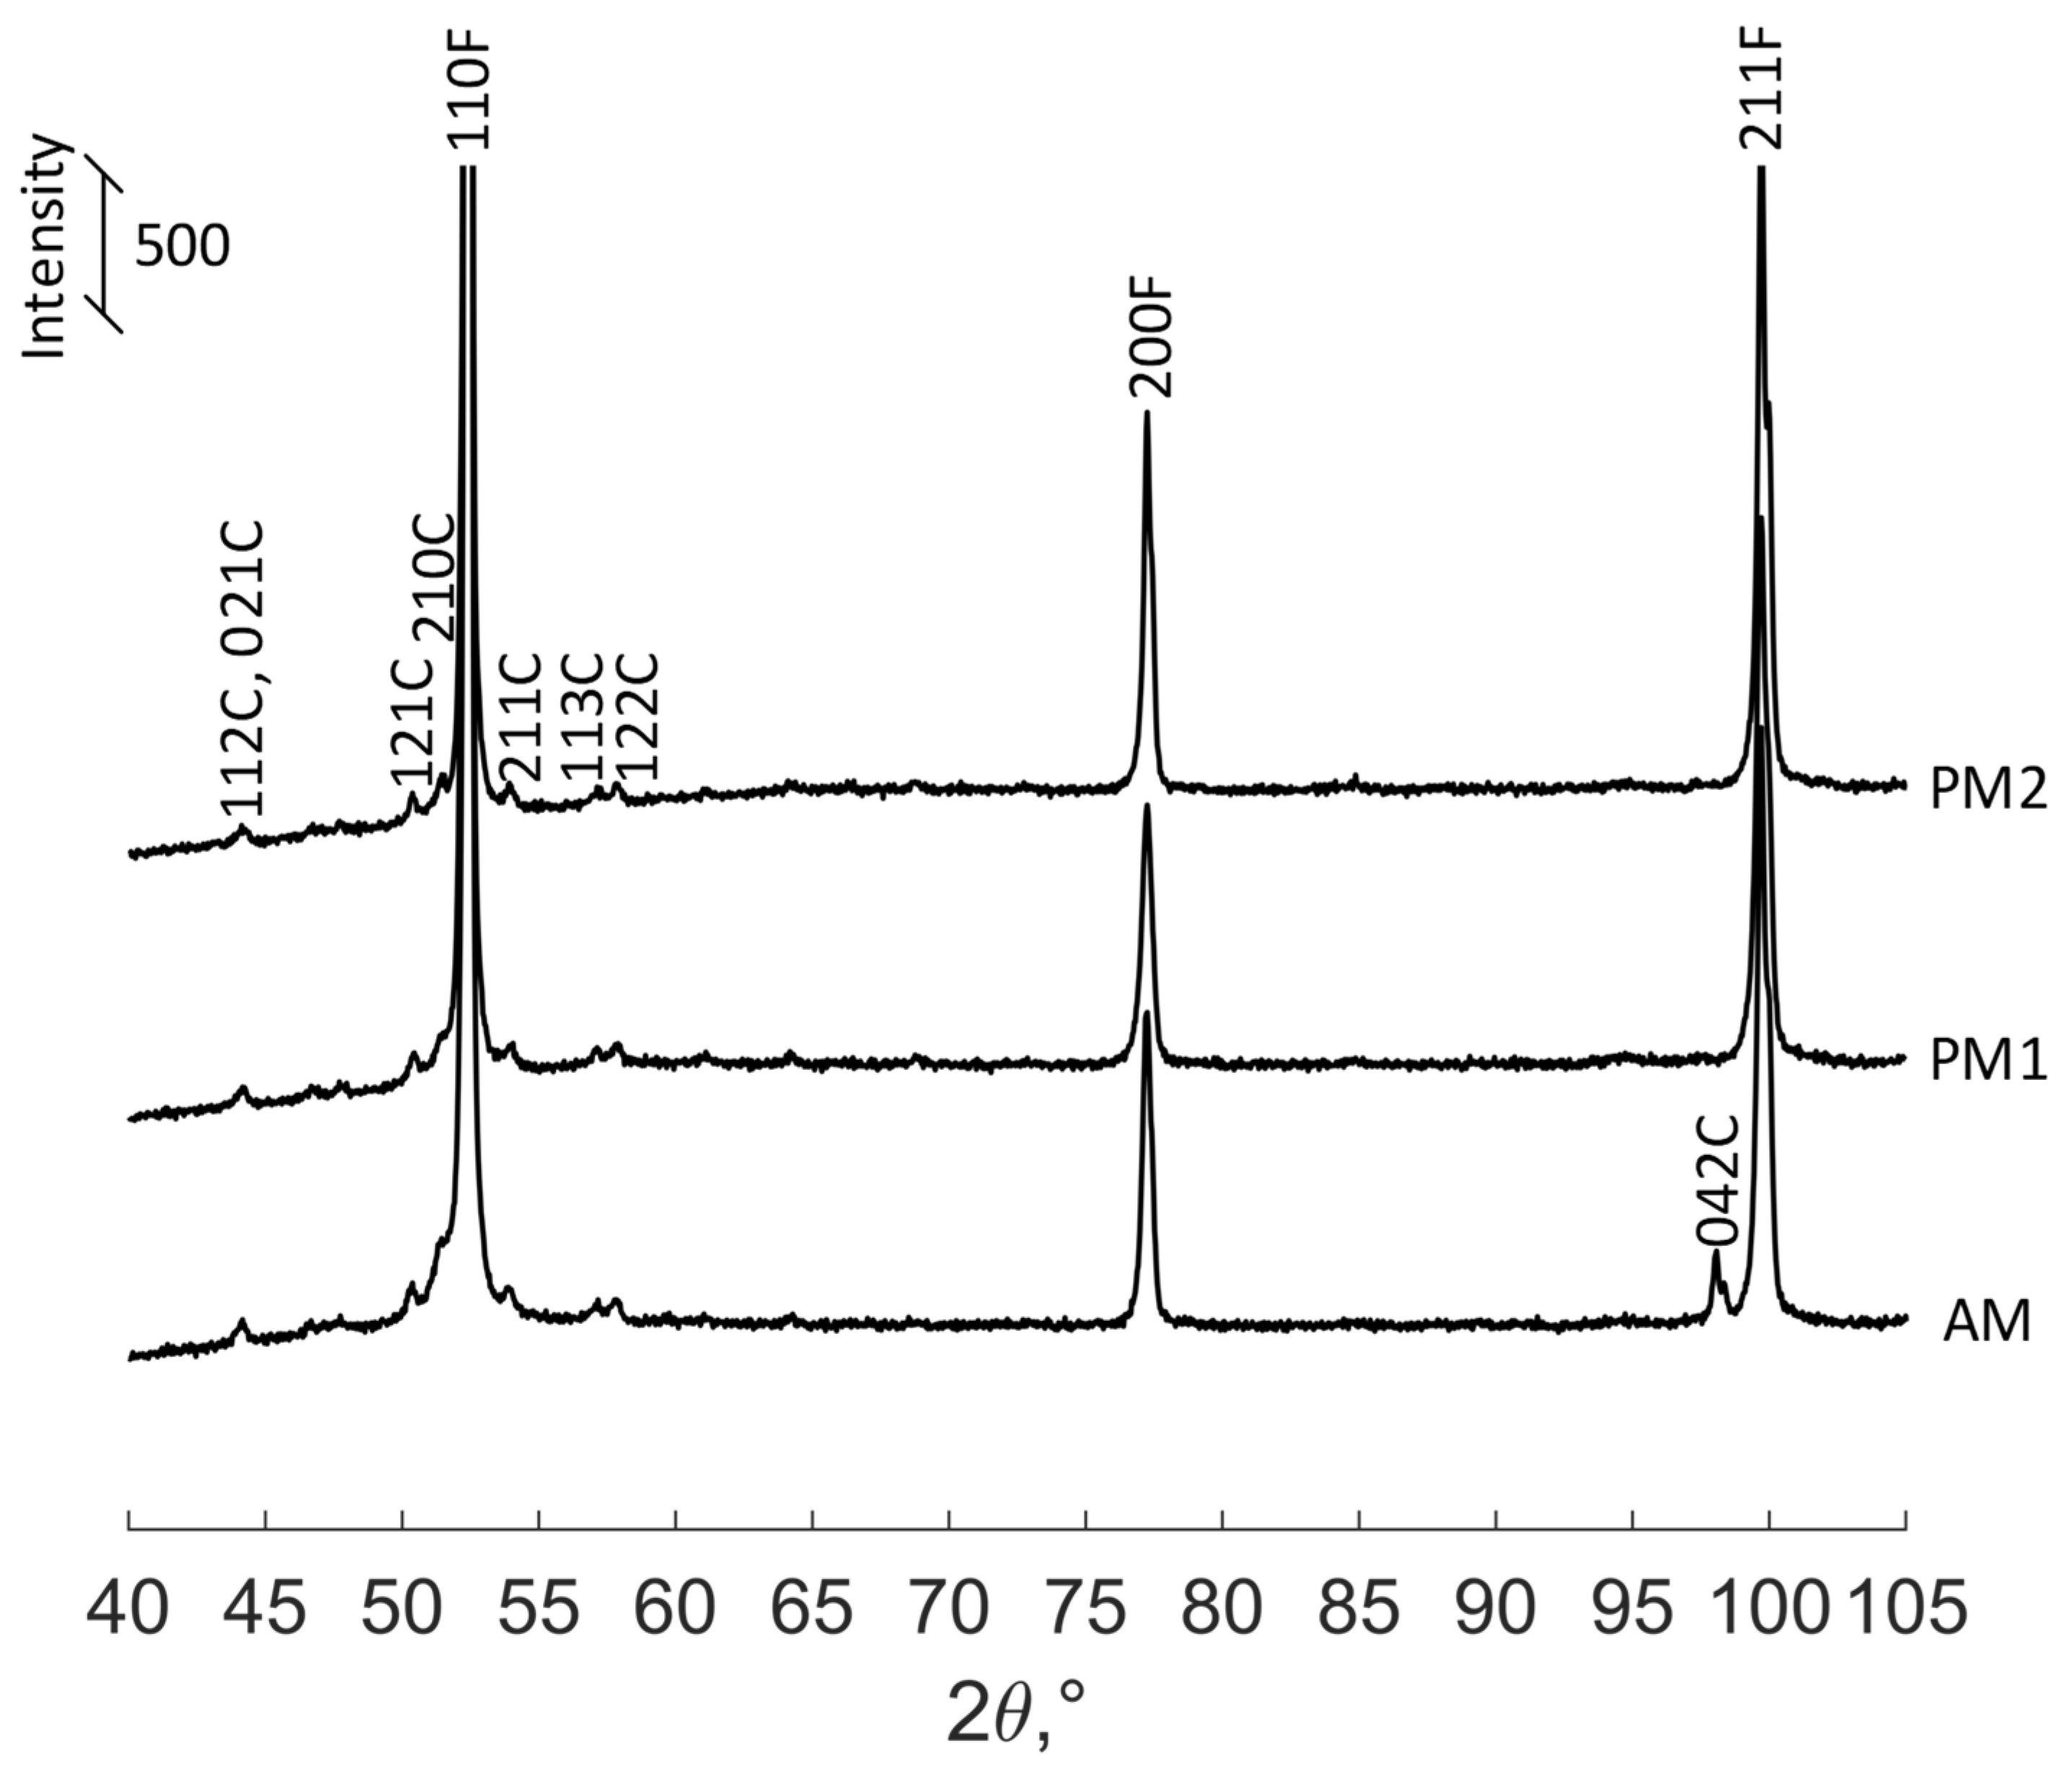
For a comparative porosity analysis of the AM (LPBF) and PM specimens, they were scanned using a Nikon XTH 225 (Nikon, Brighton, MI, USA) X-ray micro-tomography system. The scanned volumes were reconstructed using CT pro 3D (Nikon, Brighton, MI, USA) software and analyzed in the Dragonfly V4 (Object Research Systems, Montreal, QC, Canada) software environment. The scans were performed using a reflect X-ray source configured with a tube voltage of 205 kV, a current of 50 µA and a 0.5-mm-thick copper filter. This CT scan configuration results in a resolution of ~8 µm. The segmentation of pores was carried out using a manual threshold. Since the PM and AM parts may contain interconnected pores, the 3D watershed method [16] was used to compare their porosities. The pore equivalent diameter and aspect ratio were calculated for both types of samples (Equation (3)). The aspect ratio corresponded to the ratio between the largest and the smallest eigenvalues of the pore inertia eigenvectors, while their equivalent diameter was calculated as follows
E q   d i a m e t e r = 2 × ( V o l u m e × 3 4 π ) 1 3
Finally, the pore morphology was also observed using SEM. The images were obtained with a scanning electron microscope with a resolution of 1.2 µm (SEM, HitachiSU8230).

2.4. Phase Analysis

To compare their phase states, both the AM and PM specimens were subjected to X-ray diffraction analysis using an X’Pert Pro Panalytical diffractometer, Co-Kα radiation (λ = 1.79021 Ȧ) at 40 kV and 40 mA, using a scan mode over a 40–105° 2theta range.

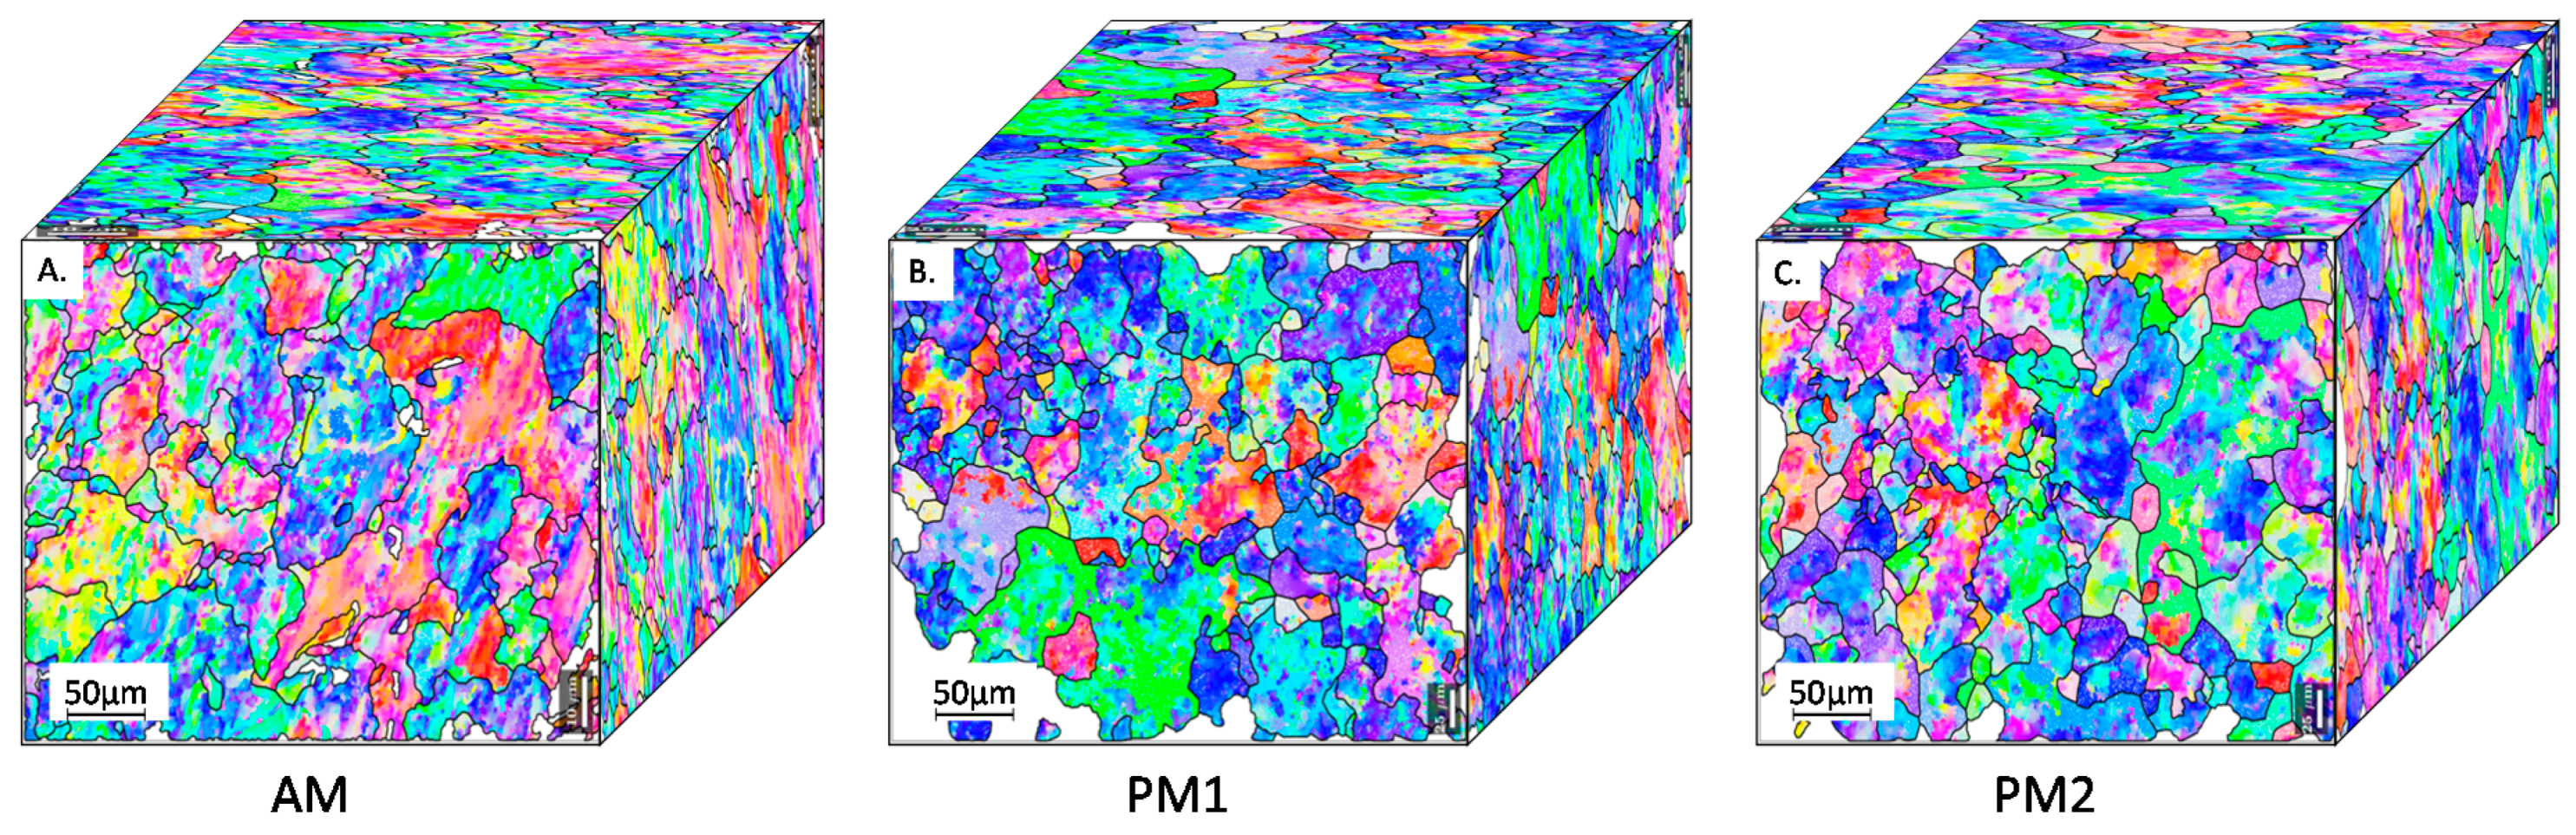
2.5. Microstructure Analysis

To analyze the AM and PM specimen microstructures, cubic samples in the horizontal (XY) and vertical (YZ) planes were cut from the compact specimens used for the metallography analysis (Unnotched Chapry test specimens, Figure 3). They were mounted in Bakelite and polished manually using SiC paper up to grit 1200. Final polishing was then performed using a vibrometer and colloidal silica solution (0.05-μm grit size). After polishing, the samples were electro-etched for 10 min under 2–5 V potential in a 70-mL HPO3 + 30-mL water solution and observed with a scanning electron microscope (SEM, HitachiSU8230) equipped with an electron backscatter diffraction (EBSD) unit. The grain size was measured according to ASTM E112−13 [17] (linear intercept method). The texture evolution was characterized using EBSD, orientation contrast imaging and integrated ARGUS FES/BSE imaging. The specimens were tilted by 70° and scanned at 25 kV, with a 0.1–0.2-μm step. This analysis was performed using 150 × 200 µm2 and 150 × 100 µm2 mapping areas for the horizontal and vertical planes, respectively.

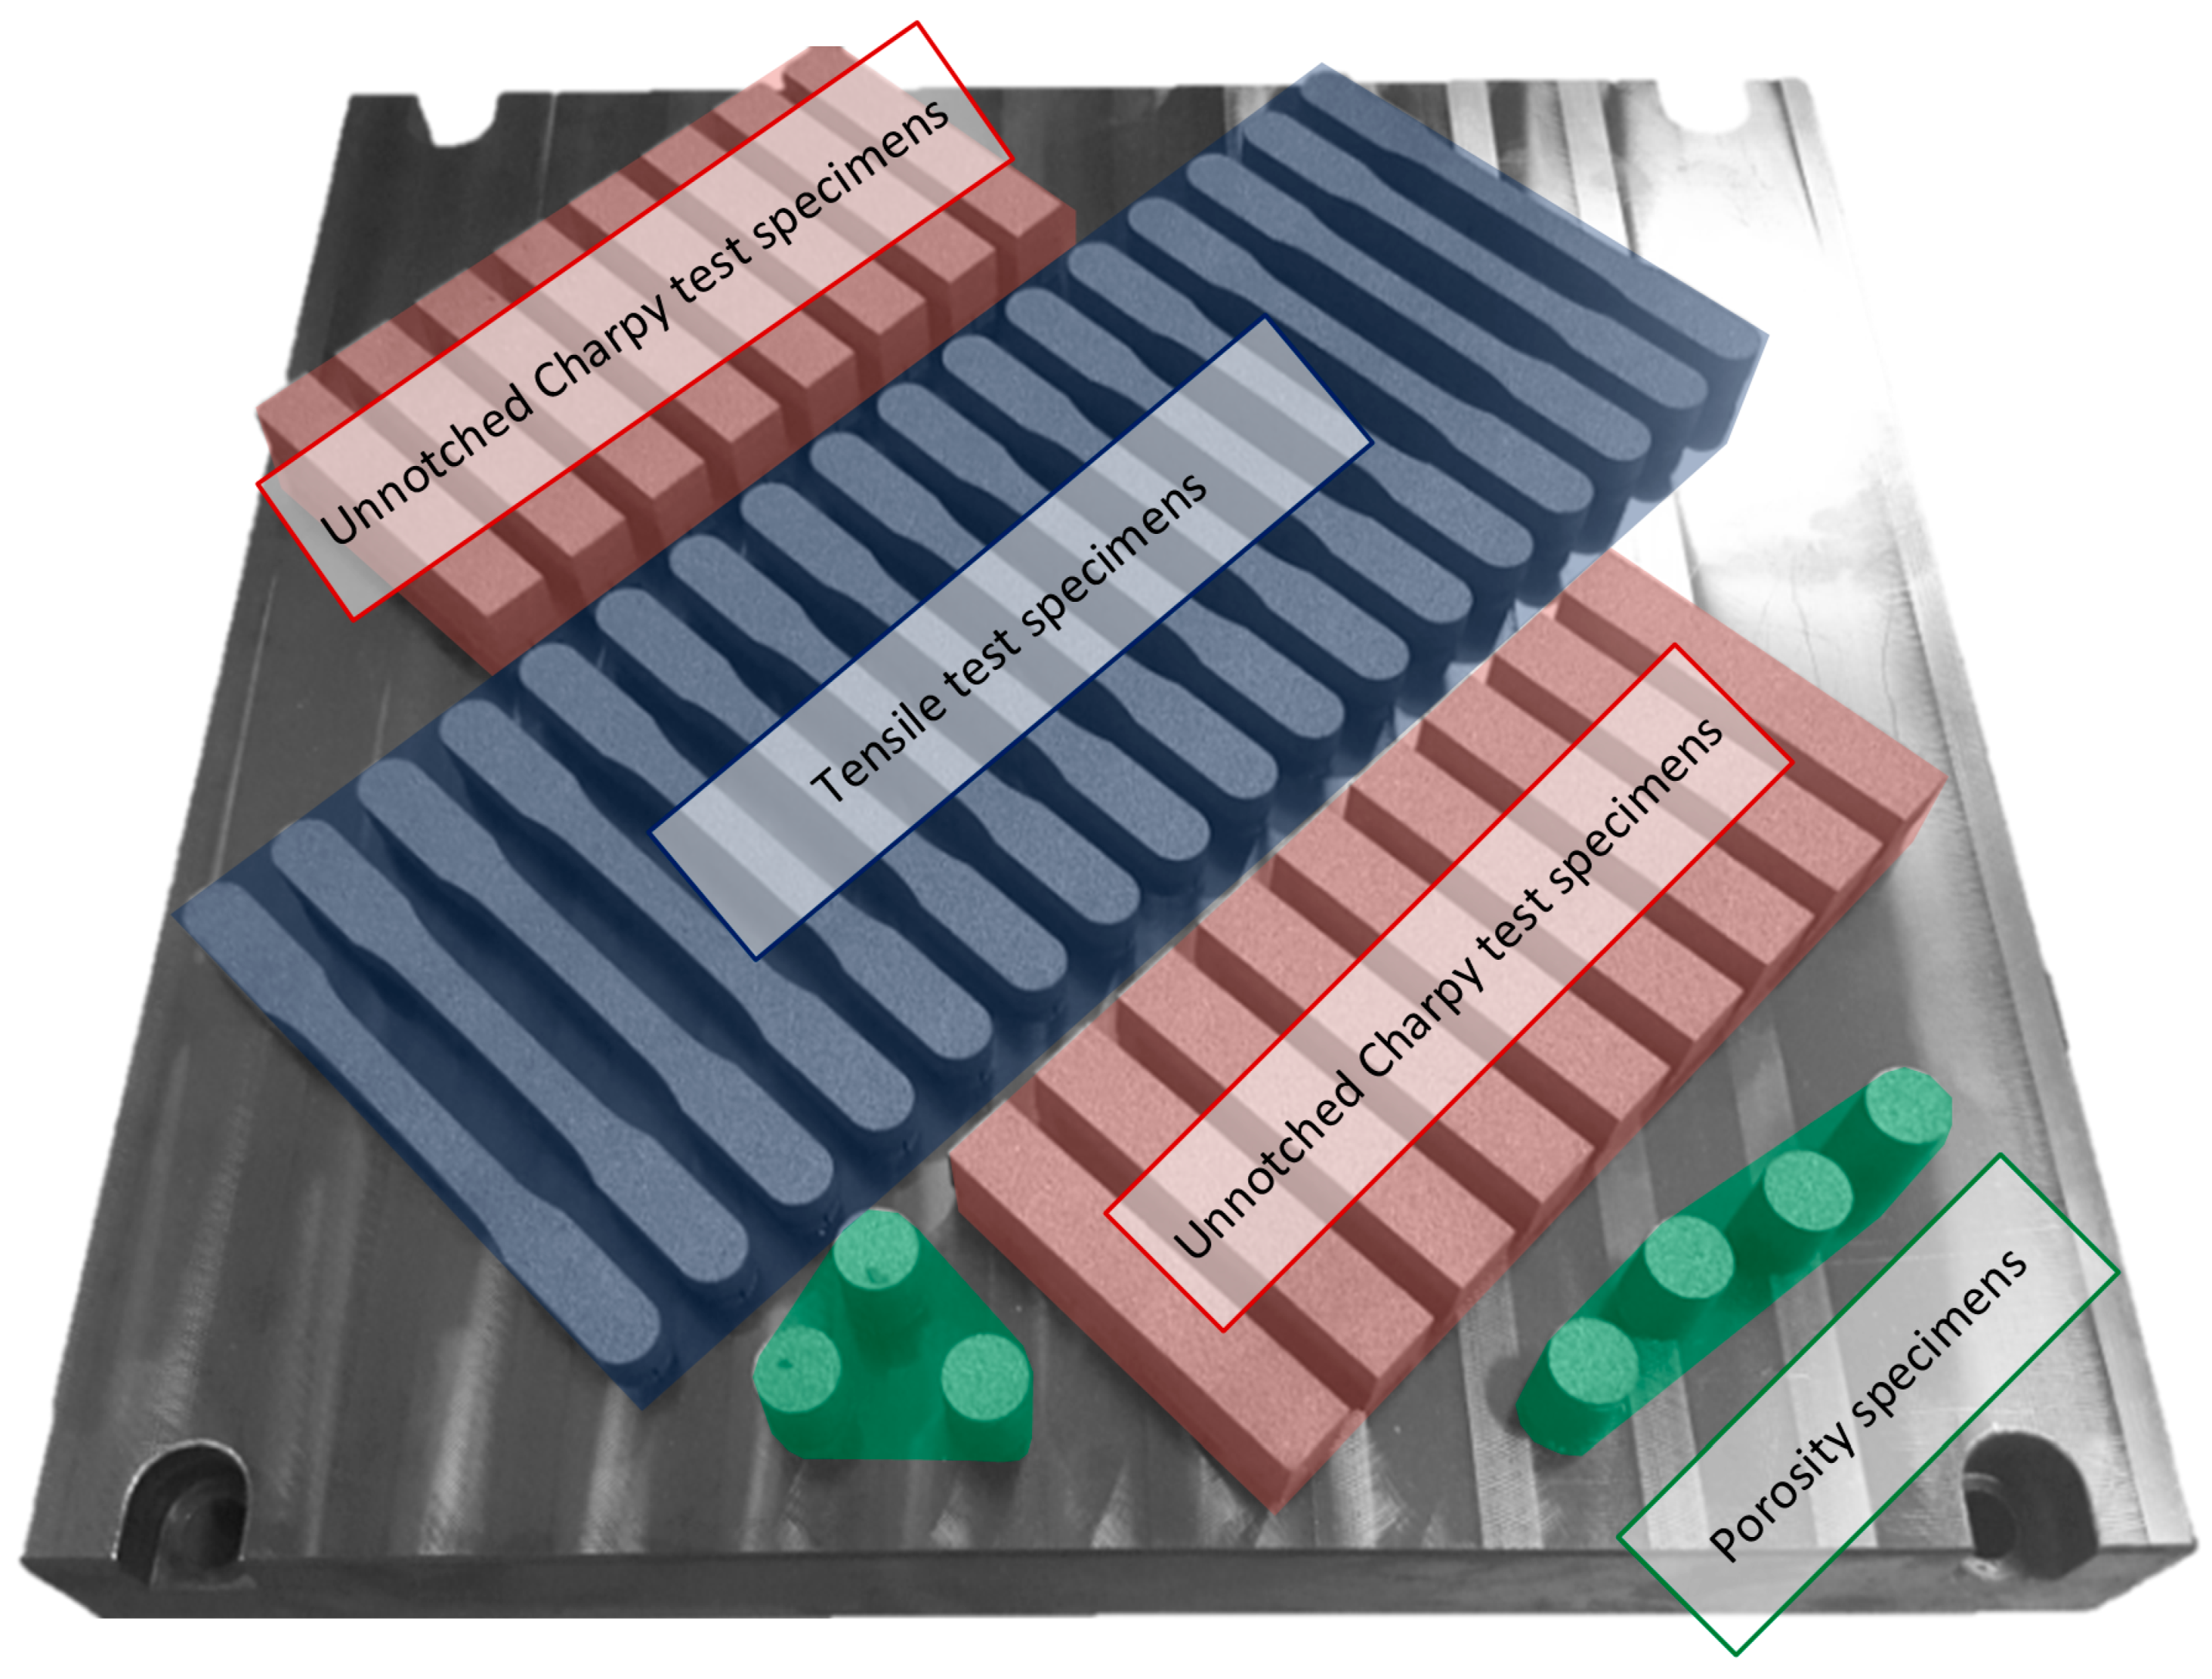
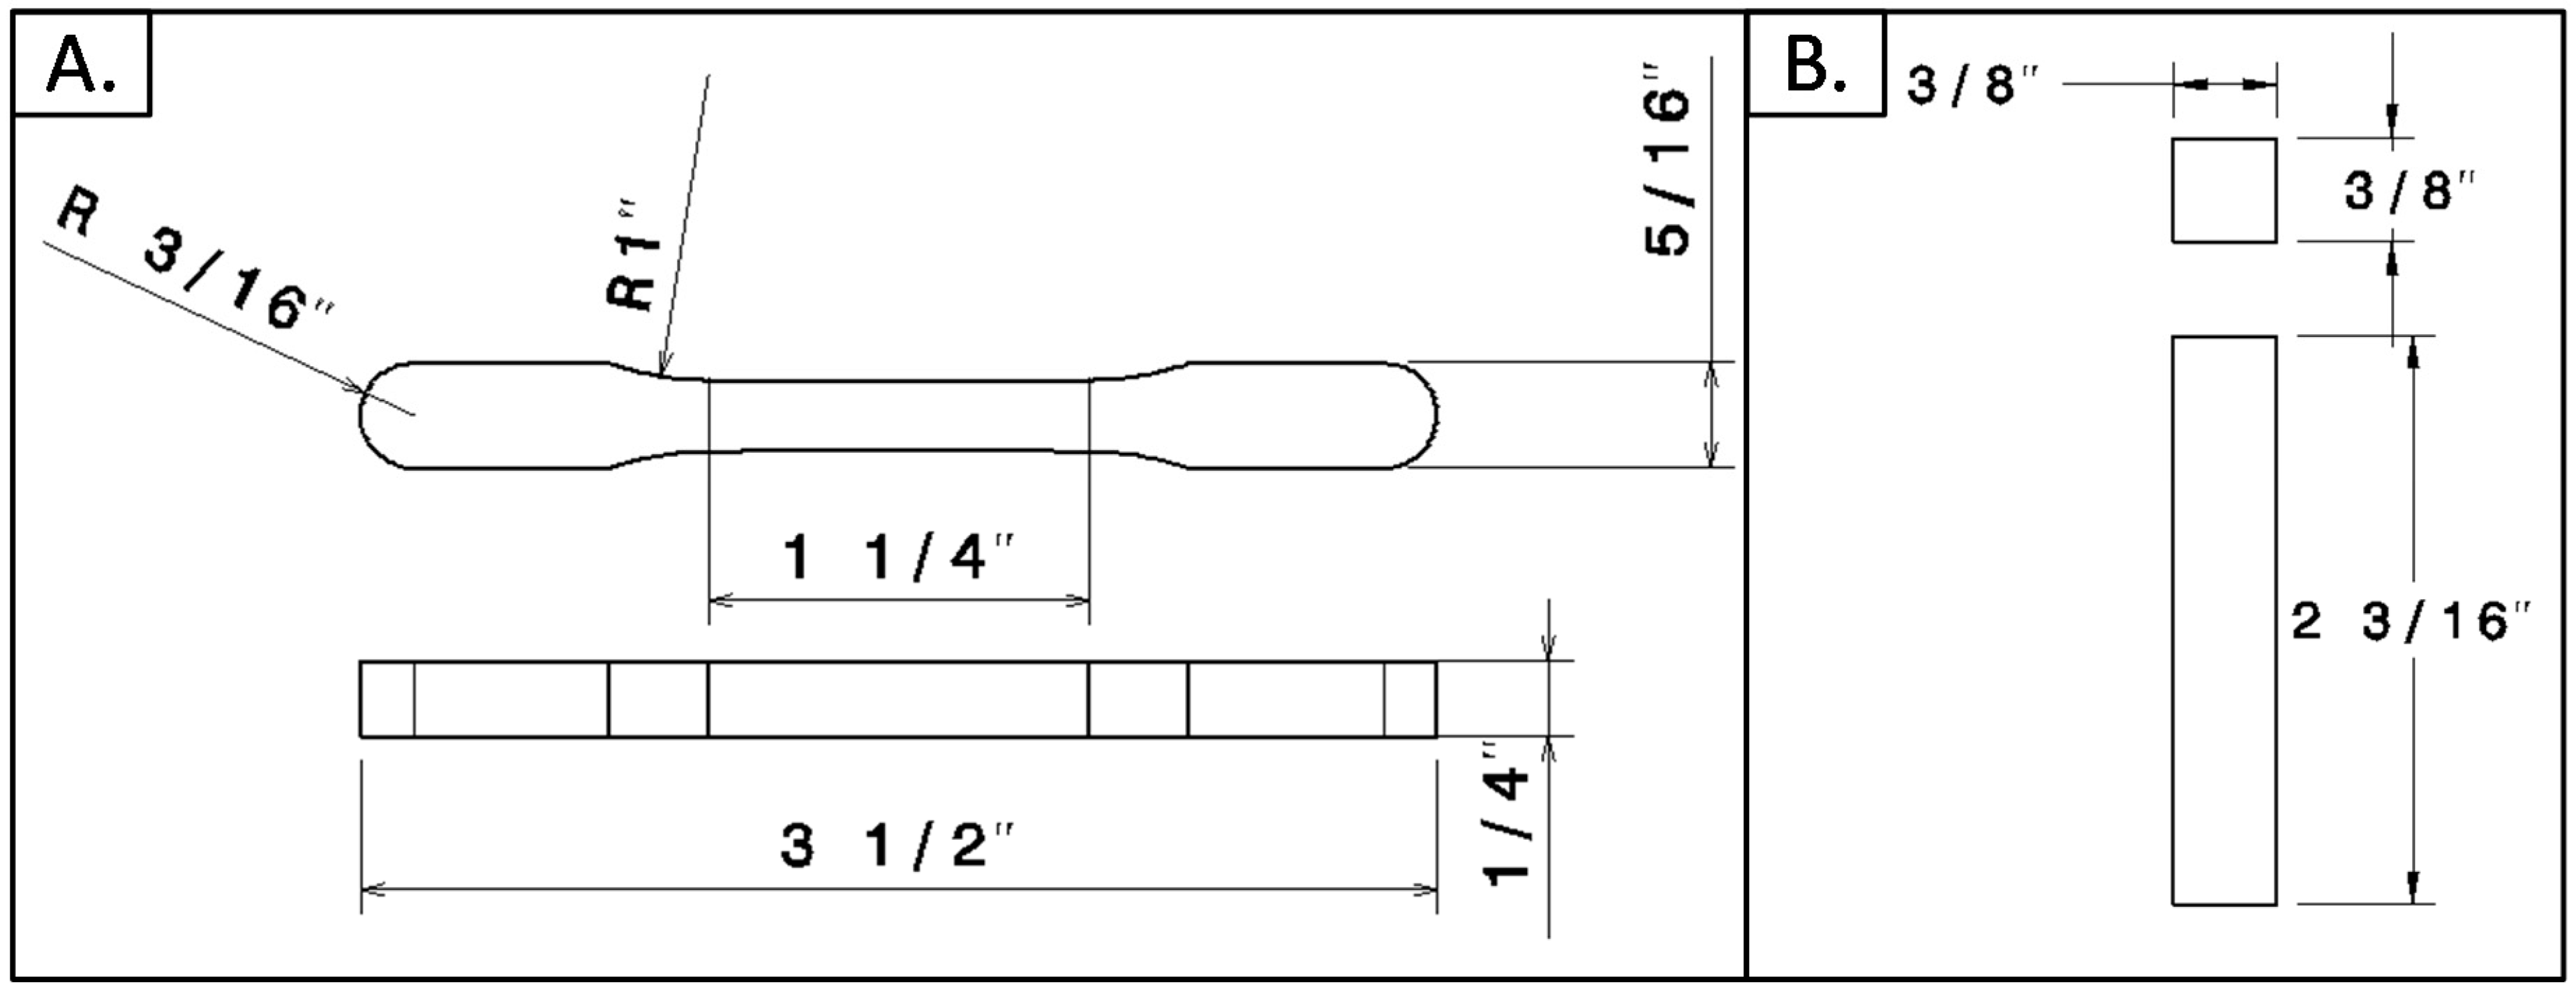
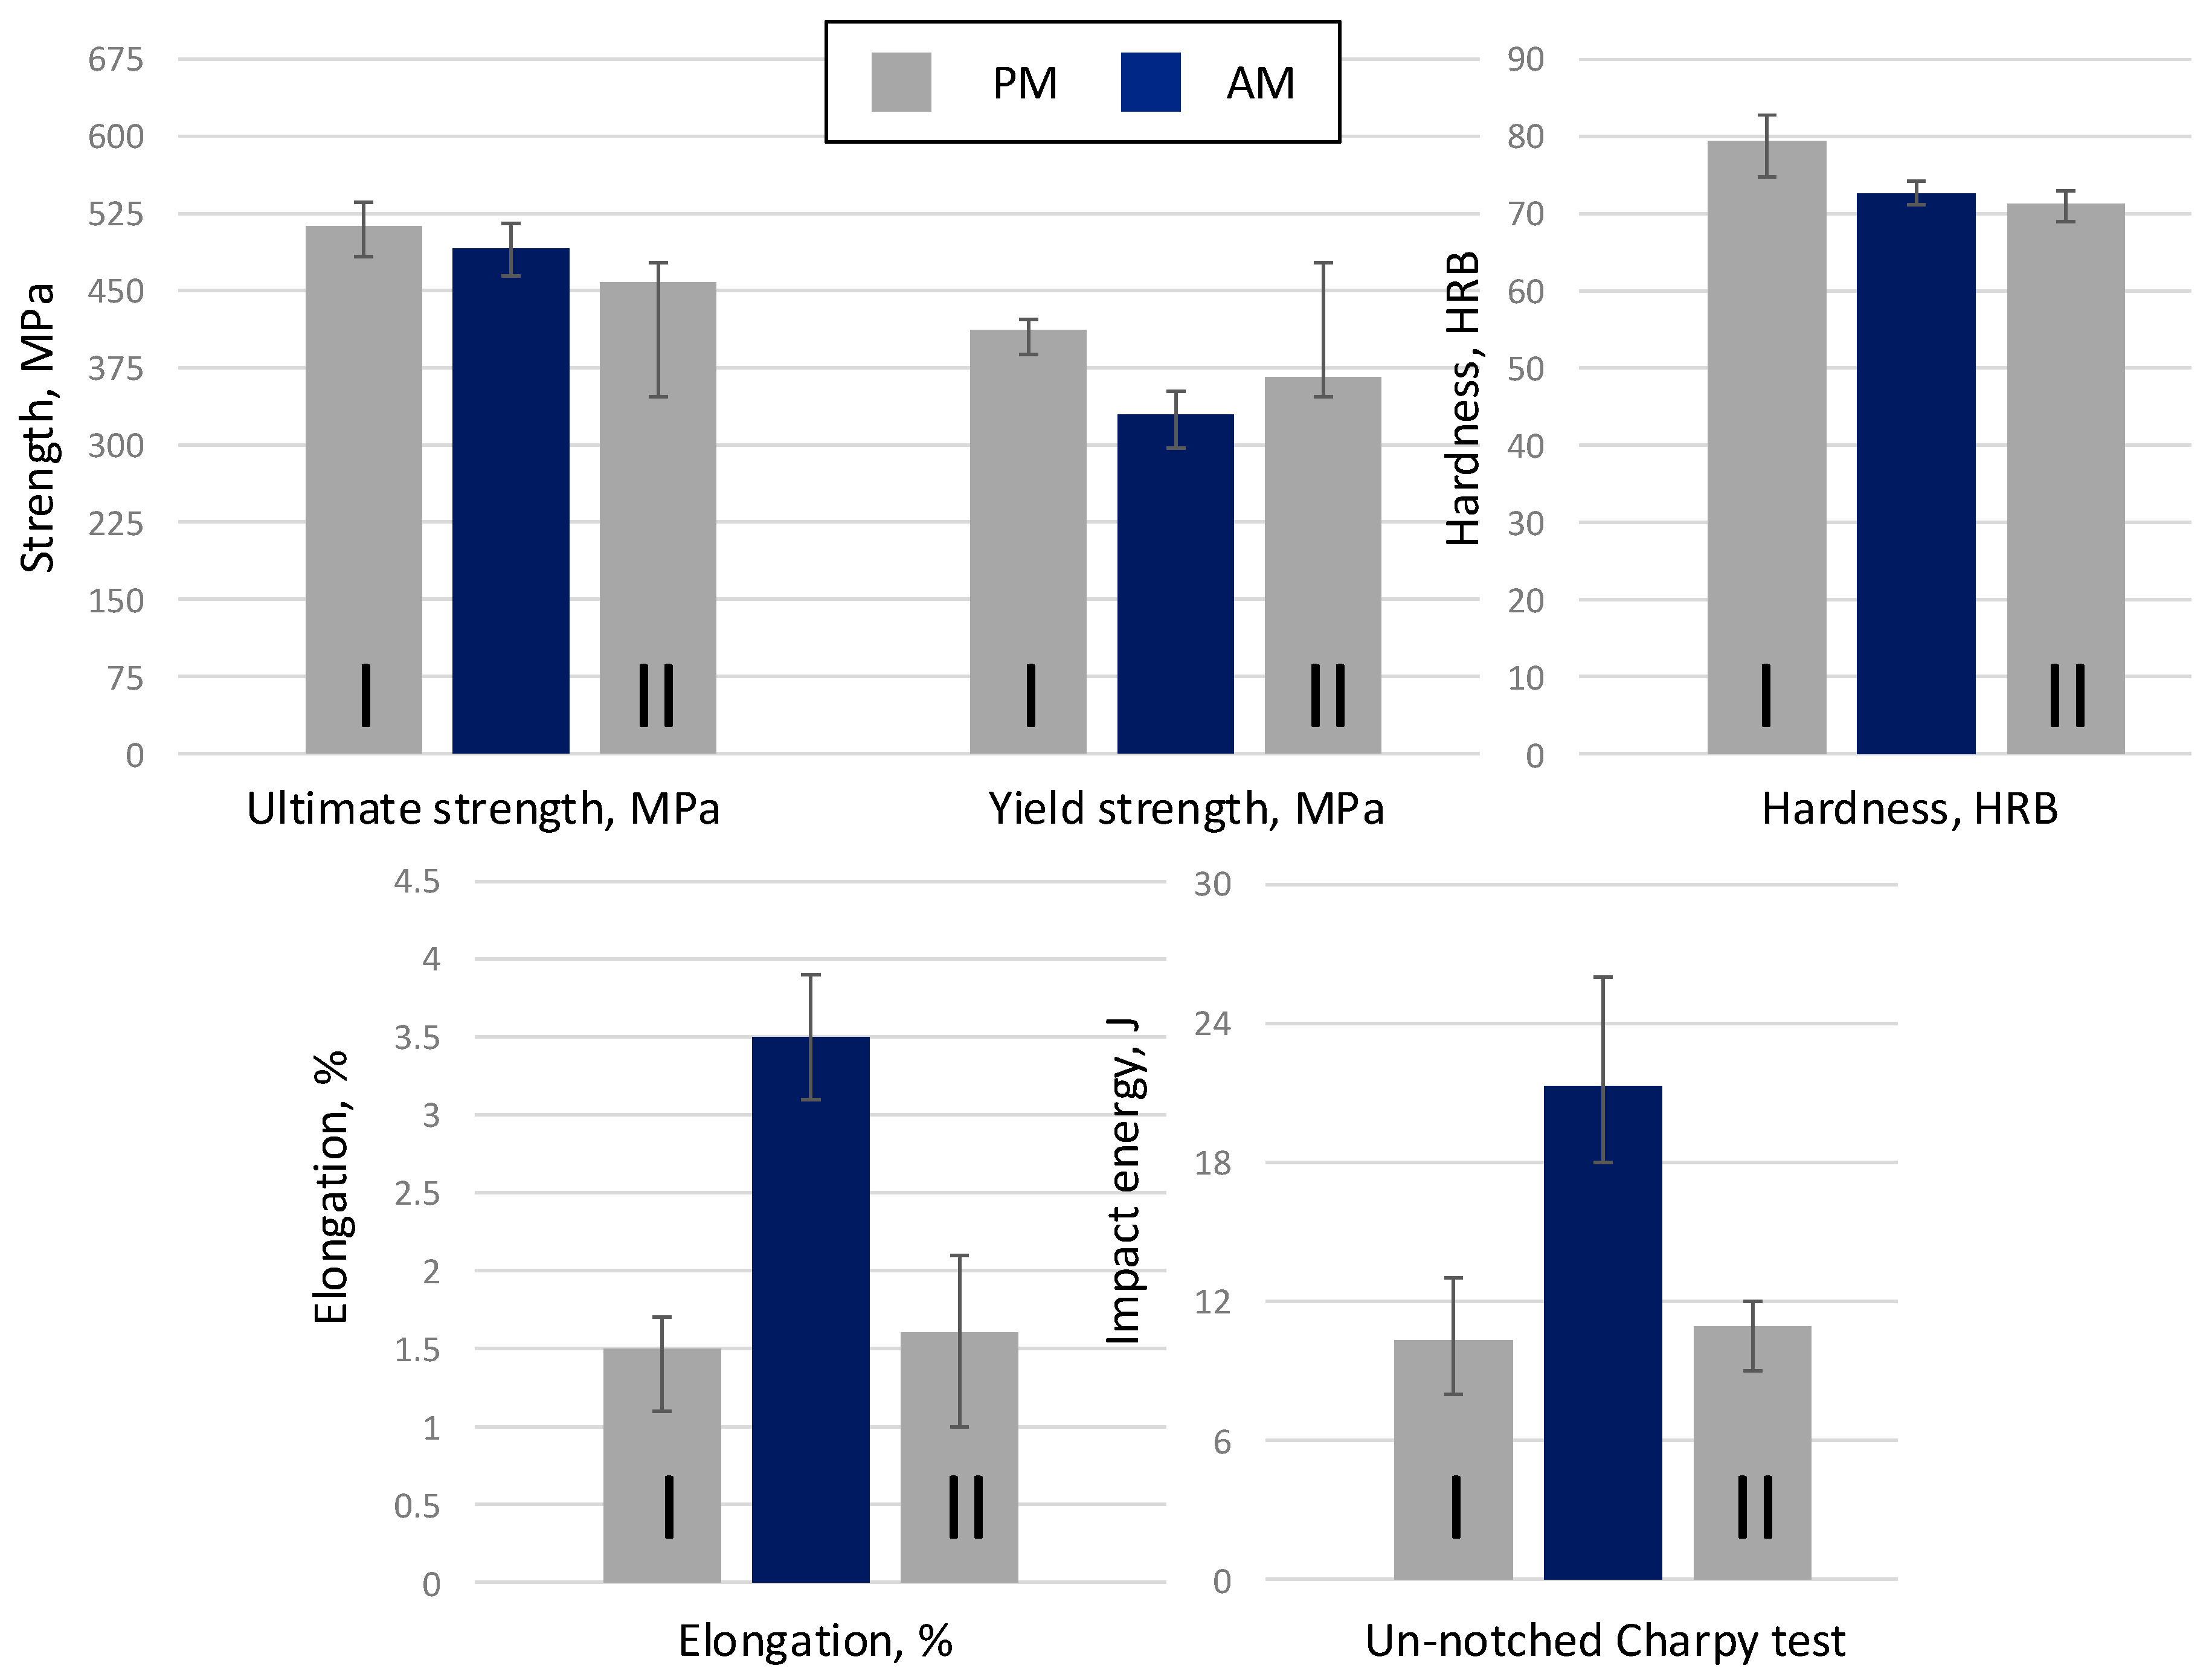
2.6. Mechanical Characterization

The mechanical properties of specimens produced using the selected set of LPBF processing parameters were compared against those measured on specimens produced using the conventional powdered metal pressing–sintering processing technology. For the latter, the dogbone-shaped tensile specimens (Figure 4A) and unnotched Charpy impact specimens (Figure 4B) were prepared with sintered densities of 6.70–6.72 g/cm3 (PM1) and 6.64–6.66 g/cm3 (PM2) using the equivalent of the MPIF FC-0208 powder used for LPBF. The use of two PM specimens, one with a higher density and another with a lower density than those of the AM specimens, was assumed to cover the largest possible PM density range.
Tensile testing of the LPBF and PM specimens was carried out using the MPIF standard 10 [18]. The specimens were tested using a Tinius Olsen testing machine, with a cross-head speed of 5 mm/min, equipped with a Model 602 Strain Module for an Epsilon Gauge Extensometer. Data were collected using a Horizon Software Package. Finally, unnotched Charpy Impact testing was conducted using the MPIF standard 40 [19]. Single-blow Charpy Impact testing was performed on a pendulum-type Baldwin Impact Tester with a capacity of 150 J. Finally, both the tensile and the Charpy impact tests were repeated on five samples for statistics purposes.

3. Results and Discussion

3.1. Powder Characterization

First, the chemical composition of the powder was evaluated. As can be seen in Table 2, the carbon and copper contents in the bonded/diffusion alloyed powder are in line with the MPIF FC-0208 grade chemical composition, while the level of oxygen is sufficiently low, thus making this powder suitable for laser powder bed fusion. However, because of the irregular shape and fine particles size, the powder did not flow through the Hall flow vessel, which was expected.
Then, the PSD and the sphericity of the powder were evaluated. Figure 5 contains the PSD of the FC-0208 powder, while Figure 6 shows the SEM micrographs of the diffusion bonded/diffusion alloyed FC-0208 powders, at two different magnifications. As expected, the powder batch consists mostly of irregular and elongated particles, as well as some round and spherical ones. The red squares in Figure 6B represent tiny fractured areas. During the diffusion-bonding/diffusion-alloying treatment, iron particles formed weak necks with the neighboring particles, which were then broken during the post-annealing process.
Finally, an in-house-designed dusting test was performed to determine the quality of the metallurgical bonding between the iron and fine copper particles formed during the diffusion bonding operation. The retained fraction of copper and graphite after this dusting test were 97% and 99% of the initial amounts of these additives in the powder mixture, respectively. This shows that the diffusion-bonding/diffusion-alloying treatment was sufficiently efficient to potentially prevent graphite and copper particles from segregation during the feed of the LPBF machine and during powder spreading in the course of printing.

3.2. Porosity of AM and PM Specimens

The porosity analysis revealed that the CT-scan-measured porosity of AM specimens is 8.3%, whereas that of the PM1 and PM2 specimens is 8.0% and 8.9%, respectively (see Figure 7). Moreover, both the mean equivalent diameter and aspect ratio of pores in the AM and PM specimens are close, ranging from 30.7 to 33.9 µm for the equivalent diameter and from 0.451 to 0.498 for the aspect ratio (Figure 7 and Figure 8 and Table 3).
Note that from these analyses, it has been seen that the CT-evaluated porosity levels are lower than their Archimedes-measured equivalents. For example, the AM sample density was measured equal to 10.3% with the Archimedes’ technique, and only 8.3%, with the CT scan. This discrepancy can be explained by the limited resolution of the CT scan, which did not allow the detection of pores smaller than 12 µm in the AM and PM samples [20]. The presence of such small pores in the AM and PM samples can be seen in the SEM images of Figure 9. Moreover, the differences in term of porosity can also be explained by the manual thresholding used to analyze the CT data [20]. This introduces significant variations in the global porosity evaluation. Note also that the effective pore size distributions formed during the LPBF and PM processes differ: the maximum pore size in the LPBF specimens is 334 µm, while that in their PM counterparts is 25 to 55% smaller (247 µm for PM1 and 142 µm for PM2) (this difference can be seen in Figure 9). This discrepancy is explained by the differences in the material consolidation phenomena inherent to the pressing–debinding–sintering process of powder mixtures (PM) and the laser fusion of the loose powder particles process (LPBF). It should finally be noted that no cracks were detected in the AM specimens, as can be seen in Figure 9.

3.3. Phases of AM and PM Specimens

The XRD analysis revealed a high percentage of ferrite phase with some cementite phase in all the samples (Figure 10). This indicates that despite the high cooling rates seen during the AM process, the thermal treatment allowed the martensitic phase to be avoided in the final sample. Despite a small peak of 042 Cementite for the AM sample, both the AM and PM parts present a relatively similar phase structure.

3.4. Microstructure of AM and PM Specimens

The EBSD analysis demonstrated that the grain structures of all the specimens studied differ within a 40% margin, and that a coarser microstructure is observed in the AM samples as compared to their PM counterparts: an average grain size in the AM specimens is 23.4 µm, while that in the PM1 specimens is 13.9 µm, and that in the PM2 specimens is 13.1 µm (Figure 11 and Table 4).

3.5. Mechanical Properties of AM and PM Specimens

A comparison between the AM and PM specimens reveals that both technologies lead to similar results in terms of the ultimate tensile strength and hardness, slight differences in the yield strengths, and significant differences in terms of ductility, elongation to failure and impact energy, where the AM specimens significantly outperform their PM equivalents (Figure 12). This can be explained by relatively weaker metallurgical bonds between sintered particles than in a fully melted material. Moreover, the average grain size in the AM parts is significantly bigger than in the PM parts, which leads to a lower mechanical resistance and a higher ductility of metals and metallic alloys (Hall–Petch relation).

4. Conclusions

It was demonstrated that laser powder bed fusion technology could be used to reduce the lead time in the manufacture of functional prototypes of PM components. To this end, FC-0208 steel powder was obtained by mixing ATOMET 1001HP iron powder with copper and graphite powders and heating this mixture up to a certain temperature to allow two phenomena to occur simultaneously: diffusion of carbon atoms into iron particles and metallurgical bonding of copper particles with iron particles. Next, a melt-pool analytical model was used to select the right set of printing parameters for the diffusion-bonded/diffusion-alloyed FC-0208 steel powder prepared for this study. Then, characterization specimens were printed, tested and compared with their PM counterparts. Finally, by tuning the printing parameters, it was possible to print components from a high-carbon steel powder with a similar density, microstructure and mechanical properties.

Author Contributions

The work plan was established by M.L. to meet the study objectives defined by V.B. and P.I. Powders selection was carried out by A.M.-K. based on the industrial partners’ needs. Process optimization were carried by M.L. The fabrication and material characterization were performed by M.L. The mechanicals tests were performed by P.I. All the authors contributed to the results interpretation and manuscript drafting. All authors have read and agreed to the published version of the manuscript.

Funding

The financial support of Natural Sciences and Engineering Research Council of Canada (NSERC), Keystone Powdered Metal Company and RioTinto Metal Powder is gratefully acknowledged.

Acknowledgments

The authors would like to express their appreciation for the financial support provided by NSERC (Natural Sciences and Engineering Research Council of Canada) and for the technical support provided by Alena Kreitcberg and Mohammad Saadati.

Conflicts of Interest

The authors declare no conflict of interest.

References

  1. Wits, W.W.; Vaneker, T.H.; Demir, A.G.; Previtali, B.; Geurts, B.J.; Gibson, I. Pulsed mode selective laser melting of porous structures: Structural and thermophysical characterization. Addit. Manuf. 2020, 35, 101263. [Google Scholar] [CrossRef]
  2. Kasperovich, G.; Haubrich, J.; Gussone, J.; Requena, G. Correlation between porosity and processing parameters in TiAl6V4 produced by selective laser melting. Mater. Des. 2016, 105, 160–170. [Google Scholar] [CrossRef] [Green Version]
  3. Poulin, J.R.; Kreitcberg, A.; Terriault, P.; Brailovski, V. Long fatigue crack propagation behavior of laser powder bed-fused inconel 625 with intentionally-seeded porosity. Int. J. Fatigue 2019, 127, 144–156. [Google Scholar] [CrossRef]
  4. Poulin, J.R.; Letenneur, M.; Terriault, P.; Brailovski, V. Influence of intentionally-induced porosity and post-processing conditions on the mechanical properties of laser powder bed fused inconel 625. Struct. Integr. Addit. Manuf. Parts 2018, STP1620-EB, 294–312. [Google Scholar]
  5. James, B.W.; West, G. Ferrous powder metallurgy materials. In ASM Handbook; ASM Intenational: Geauga County, OH, USA, 1998; Volume 7, pp. 751–768. [Google Scholar]
  6. Sanderow, H.I. High-temperature sintering of ferrous powder metallurgy components. In ASM Handbook; ASM Intenational: Geauga County, OH, USA, 1998; Volume 7, pp. 828–833. [Google Scholar]
  7. Moravej, M.; Bailon-Poujol, I.; Labrecque, C.; Khole, P. Characterization of Iron Powder Mixes Prepared with a Compressible Iron Powder. In Proceedings of the PM16 International conference on Powder Metallurgy for Automotive and Engineering Industries, Pune, India, 21 January 2016. [Google Scholar]
  8. Federation, M.P.I. Standard test methods for metal powders and powder metallurgy products. In Standard 28: Determination of Apparent Density of Non-Free-Flowing Metal Powders Using the Carney Apparatus; Metal Powder Industries Federation: Princeton, NJ, USA, 2019. [Google Scholar]
  9. Federation, M.P.I. Standard test methods for metal powders and powder metallurgy products. In Standard 46: Determination of Tap Density of Metal Powders; Metal Powder Industries Federation: Princeton, NJ, USA, 2019. [Google Scholar]
  10. Letenneur, M.; Brailovski, V.; Kreitcberg, A.; Paserin, V.; Bailon-Poujol, I. Laser Powder Bed Fusion of Water-Atomized Iron-Based Powders: Process Optimization. J. Manuf. Mater. Process. 2017, 1, 23. [Google Scholar] [CrossRef] [Green Version]
  11. Kreitcberg, A.; Brailovski, V.; Prokoshkin, S. New biocompatible near-beta Ti-Zr-Nb alloy processed by laser powder bed fusion: Process optimization. J. Mater. Process. Technol. 2018, 252, 821–829. [Google Scholar] [CrossRef]
  12. Letenneur, M.; Kreitcberg, A.; Brailovski, V. Optimization of Laser Powder Bed Fusion Processing Using a Combination of Melt Pool Modeling and Design of Experiment Approaches: Density Control. J. Manuf. Mater. Process. 2019, 3, 21. [Google Scholar] [CrossRef] [Green Version]
  13. Jacob, G.; Jacob, G.; Brown, C.U.; Donmez, A. The Influence of Spreading Metal Powders with Different Particle Size Distributions on the Powder Bed Density in Laser-Based Powder Bed Fusion Processes; US Department of Commerce, National Institute of Standards and Technology: Washington, DC, USA, 2018.
  14. Committee, A.H. Physical Properties of Carbon and Low-Alloy Steels. In Properties and Selection: Irons, Steels, and High-Performance Alloys; ASM International: Geauga County, OH, USA, 1990. [Google Scholar]
  15. Bibby, M.; Parr, J.G. The Martensitic Transformation in Pure Iron; Alberta Univ Edmonton Dept of Mining and Metallurgy: Edmonton, AB, Canada, 1963. [Google Scholar]
  16. Videla, A.; Lin, C.-L.; Miller, J.D. Watershed Functions Applied to a 3D Image Segmentation Problem for the Analysis of Packed Particle Beds. Part. Part. Syst. Charact. 2006, 23, 237–245. [Google Scholar] [CrossRef]
  17. ASTM E112-13. Standard Test Methods for Determining Average Grain Size; ASTM International: West Conshohocken, PA, USA, 2013. [Google Scholar]
  18. Federation, M.P.I. Standard test methods for metal powders and powder metallurgy products. In Standard 10: Determination of Tensile Properties of Powdered Metallurgy (PM) Materials; Metal Powder Industries Federation: Princeton, NJ, USA, 2019. [Google Scholar]
  19. Federation, M.P.I. Standard test methods for metal powders and powder metallurgy products. In Standard 40: Determination of Impact Energy of Unnotched Powder Metallurgy (PM) Test Specimens; Metal Powder Industries Federation: Princeton, NJ, USA, 2019. [Google Scholar]
  20. Letenneur, M.; Brailovski, V.; Moravej, M.; Aguirre, L. Porosity Evaluation in Compacted and Sintered Parts Using the Micro-Tomography and Metallography Techniques. In Proceedings of the International Conference on Powder Metallurgy and Particulate Material (POWDERMET), San Antonio, TX, USA, 17–20 June 2018. [Google Scholar]
Figure 1. Density processing maps: (A) initial processing map and (B) adjusted processing map; positions of 25 calibration specimens are indicated on both maps; two zones corresponding to a target relative density of ~90% are indicated on the adjusted processing map; (C) discrepancy between the predicted and measured densities before (white dots) and after (black dots) the calibration process.
Jmmp 04 00119 g001
Figure 2. Calibrated density processing maps: (A) unheated and (B) heated (200 °C) build plates; Specimens 1–4 correspond to a target density of ~90%; Specimen 5 corresponds to a ≥99.9% reference density.
Jmmp 04 00119 g002
Figure 3. Building plate with printed specimens.
Jmmp 04 00119 g003
Figure 4. Specimens geometry, (A) tensile test specimen [18] and (B) unnotched Charpy impact specimen [19].
Jmmp 04 00119 g004
Figure 5. PSD of the diffusion-bonded/diffusion-alloyed FC-0208 powder.
Jmmp 04 00119 g005
Figure 6. SEM micrographs of the water-atomized diffusion-bonded/diffusion-alloyed FC-0208 powders (A) 250× and (B) 1000×.
Jmmp 04 00119 g006
Figure 7. 2D images extracted from the CT scans: (A) AM (porosity 8.3%); (B) PM1 (porosity 8.0%) and (C) PM2 (porosity 8.9%); colors are added for better visualization only.
Jmmp 04 00119 g007
Figure 8. Porosity analysis: (A) equivalent diameter and (B) aspect ratio.
Jmmp 04 00119 g008
Figure 9. SEM images of internal porosity. (A) AM, (B) PM1 and (C) PM2.
Jmmp 04 00119 g009
Figure 10. XRD diffractograms of the AM and PM specimens.
Jmmp 04 00119 g010
Figure 11. EBSD images of the (A) AM, (B) PM1 and (C) PM2 specimens.
Jmmp 04 00119 g011
Figure 12. Comparison of the mechanical properties of the AM and PM specimens, I for PM1 and, II for PM2.
Jmmp 04 00119 g012
Table 1. Physical properties of the AISI 1070 bulk and powdered alloys [14] used for the melt pool modeling.
AISI 1070
BulkPowder (φ = 65%)
Liquidus temperature, °C14501450
Density, kg/m378005175
Thermal conductivity, W/m·K48.432.0
Specific heat capacity, J/kg·K532532
Laser absorptivity0.530.66
Table 2. Chemical composition (wt.%) and flow properties of the diffusion-bonded/diffusion-alloyed FC-0208 powder.
MPIFCarbon (%)Copper (%)Oxygen (%)Apparent Density (g/cm3)Flow (g/50 s)
FC-02080.71.670.072.85No Flow
Table 3. Summary of porosity analysis.
SamplesEquivalent Diameter, µmAspect Ratio
MeanMinimumMaximumMeanMinimumMaximum
AM33.2 ± 18.3123340.498 ± 0.170.0241
PM130.7 ± 14.1122470.451 ± 0.150.0190.964
PM233.9 ± 14.2121420.461 ± 0.150.0390.956
Table 4. Grain size of the AM and PM parts.
Average Grain Size, µmMinimum Grain Size, µmMaximum Grain Size, µm
AM23.42.893
PM113.92.683
PM213.13.1109
Publisher’s Note: MDPI stays neutral with regard to jurisdictional claims in published maps and institutional affiliations.

