
A User Interface Design Framework for Augmented-Reality-Supported Maritime Navigation


1
Institute of Design, The Oslo School of Architecture and Design, 0175 Oslo, Norway
2
Fisheries and Marine Institute, Memorial University of Newfoundland, St. John’s, NL A1C 5R3, Canada
*
Author to whom correspondence should be addressed.
J. Mar. Sci. Eng. 2024, 12(3), 505; https://0-doi-org.brum.beds.ac.uk/10.3390/jmse12030505
Submission received: 31 January 2024
/
Revised: 8 March 2024
/
Accepted: 14 March 2024
/
Published: 19 March 2024
(This article belongs to the Special Issue New Trends in Marine Robotics: Virtual Experiments and Remote Access)
Abstract
:Augmented reality (AR) technology has emerged as a promising solution that can potentially reduce head-down time and increase situational awareness during navigation operations. It is also useful for remote operation centers where video feeds from remote ships can be “augmented” with data and information. In this article, we introduce a user interface design concept that supports ship navigation by showing data about points of interest in AR. This approach enables users to view and interact with relevant data in the maritime environment by bridging the gap between digital information and real-world features. The proposed concept can provide operational data from various maritime systems, such as radar, GPS, AIS, or camera systems, empowering users with a wealth of information about their surroundings. Developed through an iterative user-centered design process, it was built as an extension to the OpenBridge design system, an open-source platform facilitating consistent design in maritime workplaces. Furthermore, we use this concept to propose a design framework that paves the way for establishing new standards for AR user interface design in the maritime domain.
1. Introduction
The maritime industry is undergoing a rapid digital transformation. New technologies can support operators’ decision-making and enhance operations by offering improved information to the crew. The transformation poses a challenge to navigators’ situation awareness since users must integrate new digital tools and data into the already complex operational context of the vessel, whether they operate the ship at sea or on land at remote operation centers (ROC). The abundance of data can lead to users spending more time looking away (head-down time) from the physical operation outside windows. They may also struggle to connect the data to real-world objects seen through windows or on video. The failure to coordinate information from instruments with the observable context can potentially have catastrophic consequences.
It is well established that navigators need to maintain visual oversight over their external environment [1,2]. They pay special attention to moving objects such as ships and navigational markers such as buoys and lighthouses. These can be seen on navigation equipment (e.g., RADAR or ECDIS). However, not all elements in the world are shown on these devices and need to be spotted directly. In other cases, users might confuse objects on equipment and the real world, leading to wrongly linked objects. Failing to see objects in the world or being unable to link data on equipment with objects observed in the world are navigational hazards.
Sampson et al. [3] discovered that around one-quarter of the collisions analyzed in their review of maritime accidents from 2002–2016 were caused by “inadequate lookout”, and according to Hareide and Ostnes [4], maritime navigators can spend over half of their time looking down at bridge instruments while navigating. Although instruments, such as RADAR or electronic charts, aid situation awareness (SA), too much head-down time (HDT) during operational activities can have a negative impact [5]. Mallam et al. [6] found that the increasing time navigators spend on the systems on physical consoles and screens, as opposed to observing the outside environment, can lead to ship accidents.
Augmented reality (AR) is an emerging technology that has gained much attention in the maritime domain since it can potentially help improve safety in navigation. Azuma [7] defines AR as allowing “the user to see the real world, with virtual objects superimposed upon or composited with the real world”. AR technology can be realized through head-mounted see-through displays like HoloLens, as overlays over video streams on screens, or as video pass-through in virtual reality headsets, such as Apple Vision pro. According to Hareide and Porathe [8], AR has the potential to reduce HDT in maritime navigation by allowing information to be placed and accessed in various locations beyond the screen and, as such, to help coordinate digital information with the observable world (Figure 1). AR in the maritime domain has mainly focused on supporting situational awareness on ships. In recent years, attention has shifted towards the use of AR in video streams used in remote operation centers (ROC).
AR has already been applied in multiple domains such as transportation, medicine, military, manufacturing, and general consumer electronic products [9]. AR solutions have also been applied in the maritime domain with several examples currently in existence. These commonly include navigation data, such as heading, speed, compass, waypoints, and no-go zones [10,11]. Specialized applications have also been developed for ice navigation [12], high-speed vessels [8], and recreational crafts [13]. Despite the many examples, Laera et al. [10] note that most of the maritime AR systems they reviewed have a low technology readiness level (TRL).
Research has found that AR technology can cause an increase in a user’s workload by providing excessive information [9]. Additionally, overlaying AR data can impair a user’s field of view (FOV), which is crucial for transportation sectors that rely on operators’ visual access and assessment of their surroundings to make decisions [14]. In the case of automobile drivers, Kim and Gabbard [14] show that AR can distract the user, further highlighting the potential negative effects of AR technology on human factors in safety-critical domains.
According to Holder and Pecota’s [15] research, the inclusion of a Head-Up Display on a ship’s bridge effectively reduced the amount of time navigators spent looking down. Furthermore, participants in the study preferred the Head-Up Display over the traditional navigation system but did note that it could be distracting. Rowen and colleagues [16] conducted a study that supported this view, as they discovered that operators who used head-mounted AR devices for navigation in maritime settings were less responsive. Although augmented reality (AR) has been shown to enhance navigator situational awareness (SA) and performance, it also increases their workload, as demonstrated by Hong and colleagues [17] and Rowen et al. [16].
We define an AR point of interest (POI) system for maritime navigation as a technology that enables the visual connection of datasets to stationary or moving objects in the physical world (Figure 1). A POI system allows users to view and interact with various data connected to objects and landmarks in the maritime environment. POI systems can usually alert the user to potential hazards or obstacles and provide real-time information that can help prevent accidents or collisions. The POI system will typically use data from maritime technologies, such as RADAR, AIS (Automatic Identification System), or intelligent camera systems, allowing users to access a wealth of information. It is likely that POI systems can enhance navigators’ situational awareness and decision-making abilities by directly connecting navigation-related data with features in the world [8].
POI systems have already started to appear in the maritime industry. Some examples are meant to be installed on screens in ships’ bridges, supporting navigators’ outlook. One of the most notable examples is the Furuno envision AR system that displays diverse types of POIs, such as ship targets, buoys, and landmarks [18]. In addition to these, there is an emerging branch of systems supporting the operations of ROCs. In these workplaces, video streams from ships in the ocean are used to give navigators on land a better understanding of the ship’s situation.
All POI systems are working in conjunction with other software on the ship’s bridge and draw information from systems such as RADAR, ECDIS, AIS, and new sensor systems. Recently there has been increased attention on the importance of consistent design across systems to reduce human errors [19]. Current regulation provides some resources such as icons that can be used to achieve such consistency. In addition, recent developments in open-source design guidelines have started to make an impact in the industry [20].
Currently there are no regulations of maritime POI systems. Regulations from the International Electrotechnical Commission (IEC) have some content that can be used for POI systems, such as iconography in IEC 62288 [21]. This is likely because the regulative processes have not yet managed to follow up the new category of equipment. Further, there is still limited documentation or guidelines supporting user interface (UI) design for maritime POI systems. Lack of such guidance can lead to systems being developed in isolation from existing equipment, regulations, and UI design frameworks. This isolation could lead to complications as these systems will inevitably be integrated with existing ship bridges and equipment, thereby introducing uncoordinated visual symbolism through the AR systems. An interface philosophy and design principles that veer away significantly from existing systems can add to users’ mental load, impeding their ability to learn and use the new systems efficiently [19].
There is an imminent need to develop design guidance and new regulatory frameworks related to maritime POI systems to meet these challenges. In this article, we contribute by presenting a novel UI design concept that supports flexible display of POI data related to maritime navigation. This research has two outcomes. An open-source design example, contributing to design precedence of how AR can be applied in the maritime sector. In addition, a design framework derived from the design precedence, to contribute to the future development of AR-mediated POI systems.
Scope and Aims
There is an uncertainty around the performance of AR in real work conditions since maritime AR examples are mostly untested in real conditions, with low TRL or only oriented towards demonstrating the potential of the technology [22]. There are currently no standards or best practices for maritime AR user interface design, making it likely that existing AR designs still need more development before we have sufficient understanding of their potential and limitations. Specifically, our work addresses an emerging category of maritime AR applications that we refer to as POI systems.
We contribute to the limited body of knowledge into the research and development of AR applications and solutions, as applied to the maritime navigational context, by presenting an elaborate description of a user interface design concept for a POI system. The results are drawn from multiple design cases. The presented POI system has been formally user tested and evaluated in previous work and as part of the elaborate collaborative design process. This article will not focus on the evaluation of the system, but rather will produce a rich description of the form and structure of the user interface design. In addition, we provide a detailed list of design requirements discovered in our design process.
2. Materials and Methods
This work related to the tradition of user interface design, user-centered design, and early phase design exploration. To develop knowledge of how to design for a new technology, we have conducted an extensive iterative and case-based design process.
2.1. Design Background
This current work has been carried out under the OpenAR 1 research project that is seeking to expand the OpenBridge Design Guideline by incorporating support for AR design [23].
The work draws on a series of projects and design cases carried out by the Ocean Industries Concept Lab [24]. First, it is based on the OpenBridge project that is developing comprehensive open-source design guidelines for maritime workplaces [25]. This framework has a base structure for user interface elements and palettes that as been used as a basis for the AR designs. In addition, a POI system, previously developed for Arctic navigation under the SEDNA EU project [26], has been updated and included in this work.
2.2. Process and Methods
As shown in Table 1, concept development spanned over a period of more than 6 years. There were 3 main iterations. The presented POI system in this article is based on the 3rd iteration. This research has followed a human-centered design approach. Design-oriented field studies were used extensively, especially in the first phase [27]. They were used to understand users‘ tasks and context, carry out participatory design, and to test AR hardware.
Design proposals were created in 2D using the design tool Figma [28]. These sketches were connected to a multiuser virtual reality (VR) sketching tool, facilitating the evaluation of the design, both in 2D and 3D VR. We applied virtual reality-reconstructed operational scenarios (VRROS) to connect the sketches to a 3D environment. There were two iterations of the VR system. The first one was realized in Unity game engine (Unity Technologies, San Francisco, CA, USA) and the second in the Unreal Game engine (Epic Games, Cary, NC, USA). The second iteration supported remote collaboration with up to 10 users in VR simultaneously.
Throughout the projects, a series of prototypes were developed to enhance our understanding of AR design. In the SEDNA project, an AR prototype was created with the Unity game engine on Microsoft HoloLens (Microsoft Corporation, Redmond, WE, USA), showcasing simulated data. The OpenAR project produced an initial AR demo for ship testing, again utilizing the Unity engine on HoloLens. This demo introduced the POI system’s first iteration and incorporated live AIS data via mobile. AR graphics were further tested on mobile phones using the web tool Bezi (Bezi Inc., San Francisco, CA, USA). Table 1 provides a comprehensive overview of each iteration, design ideation methods, external evaluations, and related publications.
We applied maritime regulations and common user interface regulations in the work. Initially we applied the IEC regulation, and later Web Content Accessibility Guidelines (WCAG) 2.1 guidance was added.

Table 1.
Design process.
| Iteration | Design Precedence | Demo | Regulation Used | Design Method | External Evaluation | Associated Publications |
|---|---|---|---|---|---|---|
| 1. SEDNA (2017–2019) | None | VR demo (Unity), HoloLens demo, simulated data, (Unity). | IEC | Co-design with end-users during field study (3 weeks + 3 weeks) | [12,20] | |
| 2. OpenAR 1.0 (2019–2021) | SEDNA POI Concept | HoloLens demo, AIS, (Unity). | IEC + WCAG | VRROS 1.0 (Unreal only) | Chalmers | [18,29] |
| 3. OpenAR 2.0 (2021–2023) | OpenAR POI Concept | VR demo (Unreal), web trial (Bezi) | IEC + WCAG | VRROS 2.0 (Figma + Unreal) | USN, UiB, Industry | [30,31] |
2.3. Design Evaluation
We used three types of evaluation throughout the process. First, the design team conducted collaborative critique sessions, during which designers working in a team evaluated the formal aspects of the design and implemented changes. Second, domain experts and stakeholders participated in workshops and seminars. Third, external formal testing was carried out by partner universities (Chalmers, USN, UiB).
2.4. Establishing Design Requirements
To develop the framework of design requirements we applied an analytical process composed of, (1) deconstructing the design proposals into UI components, (2) documenting the design rationale behind the various components in the POI system, and (3) reformulating the rationale into preliminary design requirements for the POI system.
In the next sections we present first the POI system user interface we have developed, and then the framework of design requirements we have derived.
3. Results
A POI system realized in AR represents a new category of navigation and maneuvering support system. Determining how it can best be adapted to specific operational requirements and user demands is an open question. There is a large amount of data generated from sensors and information systems onboard the ship that could potentially be displayed within the AR environment. However, the space to present this information is limited, given that the AR system overlays the real world, which users also need to view.
In our approach to designing a POI system, we developed a flexible set of information components that can be adapted to cover the needs of users in a range of operational scenarios. Therefore, our concept consists of several building blocks that need to be further customized to align with the specific needs of distinct and evolving operations.
The design proposal demonstrates novel contributions to POI system design at two levels. First, we offer a range of user interface design patterns novel to maritime AR and which have not been described in detail in research. Second, the system demonstrates how the many concepts can be assembled into a common user interface architecture that can be applied across different types of devices.
The system has been designed as an extension to OpenBridge [25]. The intention is to make a system that will work seamlessly together with other maritime equipment. Features such as the palette system, the form, and behavior of interactive components are drawn from OpenBridge. As with the rest of OpenBridge, our design proposal is licensed as open source and can be found at Supplementary Material www.openbridge.no (accessed on 1 February 2024).
In our work, we applied IEC 62288 to the POI system wherever possible. This included using IEC maritime icons throughout the system for compatibility with existing equipment. Where icons were lacking, we incorporated icons from the OpenBridge guidelines, designed to complement the IEC icons. We also adhered to IEC 62288’s mandatory minimum sizes for touch interactions and font sizes, suitable for screen-based AR interfaces. However, for HMD AR, sizes must be adjusted due to varying resolutions and interaction methods across devices.
WCAG 2.1 was utilized for ensuring adequate contrast in both pass-through and screen-based AR, though it was not suitable for see-through AR like HoloLens. OpenBridge Design Guideline was applied system-wide for consistent interaction across AR and other maritime systems, covering design language for interactive components like buttons, lines, and cards.
The Convention on the International Regulations for Preventing Collisions at Sea (COLREG) establishes rules and procedures aimed at preventing ship collisions [2]. Our framework links data related to points of interest with the real world, aiding navigators in making informed decisions within the COLREGs framework. Furthermore, we promote sound navigational practices by visualizing this data through graphical languages in line with current maritime regulations, as outlined in the text.
Following is a description of the proposed POI system, starting with a generic POI component. We then present how several generic components can be used together, then their layout, and compatibility features. We conclude with a framework for design requirements derived from the proposed POI concept.
3.1. Generic POI Component
The generic POI component represents data relevant to a single (or a group) of points of interest in the world and connect them to their physical location. The design of the generic POI component needs to meet a range of general UI requirements such as legibility and user interaction. In addition, it needs to offer significant adaptability for changing user needs, help to organize maritime information, connect to existing systems, and support existing maritime standards. The sub-elements that together make up a generic POI component can be seen in Figure 2. Different elements will be visible depending on the state of the interface.
In the next sections, we will describe how the generic POI component can change content and behavior. This is followed by a description of how multiple components are shown in a layout placed over the world.
3.1.1. POI Button
The component can show different types of POIs such as moving targets (like ships and helicopters), navigation targets (like buoys and lighthouses), and datasets connected to POIs or inputs (like waypoints or set points). Moving targets are square and navigation targets are round, to better differentiate between the POI types. The lighthouse target has an optional colored visualization that demonstrates the different sectors of a lighthouse. Figure 3 shows an overview of POI types and states.
The POIs are visualized using standard icons for AIS and Radar [21]. All moving target POIs have an icon that describes the POI according to the sensor detecting it, such as RADAR, AIS, or camera identification. The navigation target POIs use icons representing the type of navigation target. Examples of IEC icons used for identifying different types of targets are shown in Figure 4.
3.1.2. POI Button Sizes
Each POI button can be displayed in different visual sizes depending on the device, system, operation, and user preferences. Figure 5 shows different target button sizes such as a flat button without a border (a,1), a regular size where the visible area is smaller than the touch areas (a,2), and a large version that may show more data (a,4). The widths are narrow to better support stacking of several POIs in a view with less overlap. For instance, Figure 1 shows that targets can be stacked closely. The regular and large versions use a backdrop behind the POI since our earlier AR trials at sea indicated that using a backdrop behind data readouts helps separate the letters from the unpredictable background.
The POI button is designed to show a wide range of data, with additional data stacked vertically. As shown in Figure 5, each data category is separated with a divider to make it easier to connect the value and unit. The target icon is always at the bottom to maintain proximity to the real-world target.
3.1.3. Selected State
The selected state is used to highlight a point by “selecting” it. This is in line with current standards for Radar and ECDIS interfaces, where a target can be selected and highlighted in the interface. A selected POI is separated by adding a selected target graphic [21] around the main identifying icon and a number label (Figure 3). We suggest that a selected target should be shown as selected in all relevant interfaces, such as ECDIS and RADAR, with the same label number.
3.1.4. Component Value
Each component has multiple values, as shown in Figure 3, middle row. The value can show whether the component is not interactive (flat), interactive (normal), or that it is active (checked). They can also show alert states such as warning, caution, and alarm in line with regulation [21]. All POI types can have all component values.
3.1.5. Button State
The POI components support standard button states that show the interaction status of the button (Figure 3, bottom row). This includes enabled, hover, active, and disabled. Focused is a special state showing a selection ring around the POI that supports key navigation in the interface. Overlapped is a special state that is enabled when two or more POIs are overlapping.
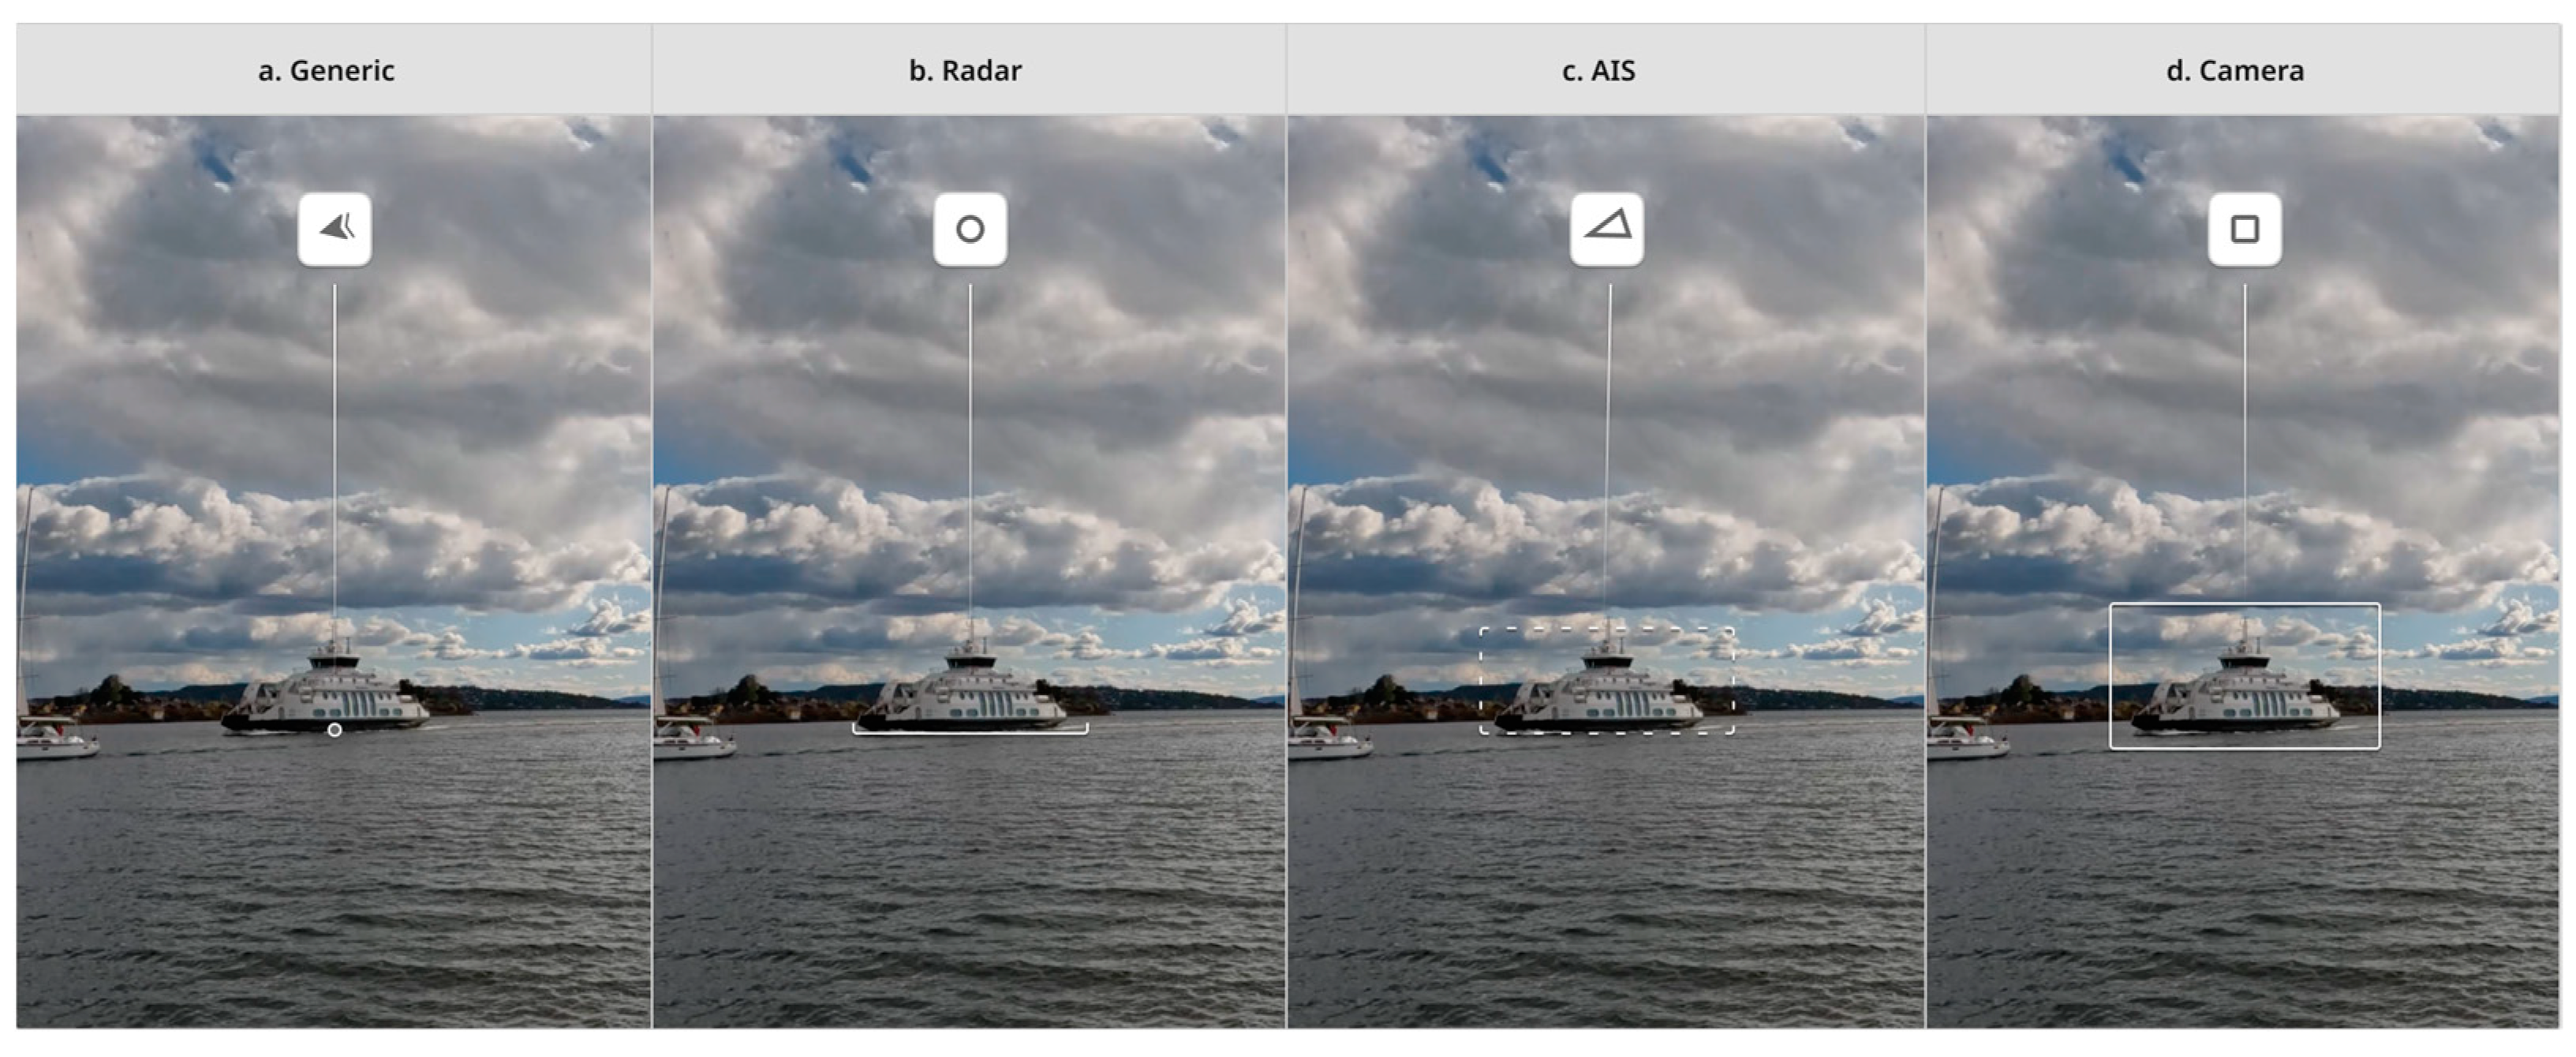
3.1.6. Surface Targets
The system supports a set of target markers that can be positioned in direct relation to a target on the water. These are designed to show which sensor is detecting the target, such as radar or camera (Figure 6). The generic targets are values such as a point in the target location on the water, the generic version shows an arrow with a smaller arrow line behind to indicate both speed and direction, the radar target frame has a line indicating the area, the AIS target has a dashed target frame, and the camera target uses a square line frame.
3.1.7. POI Card
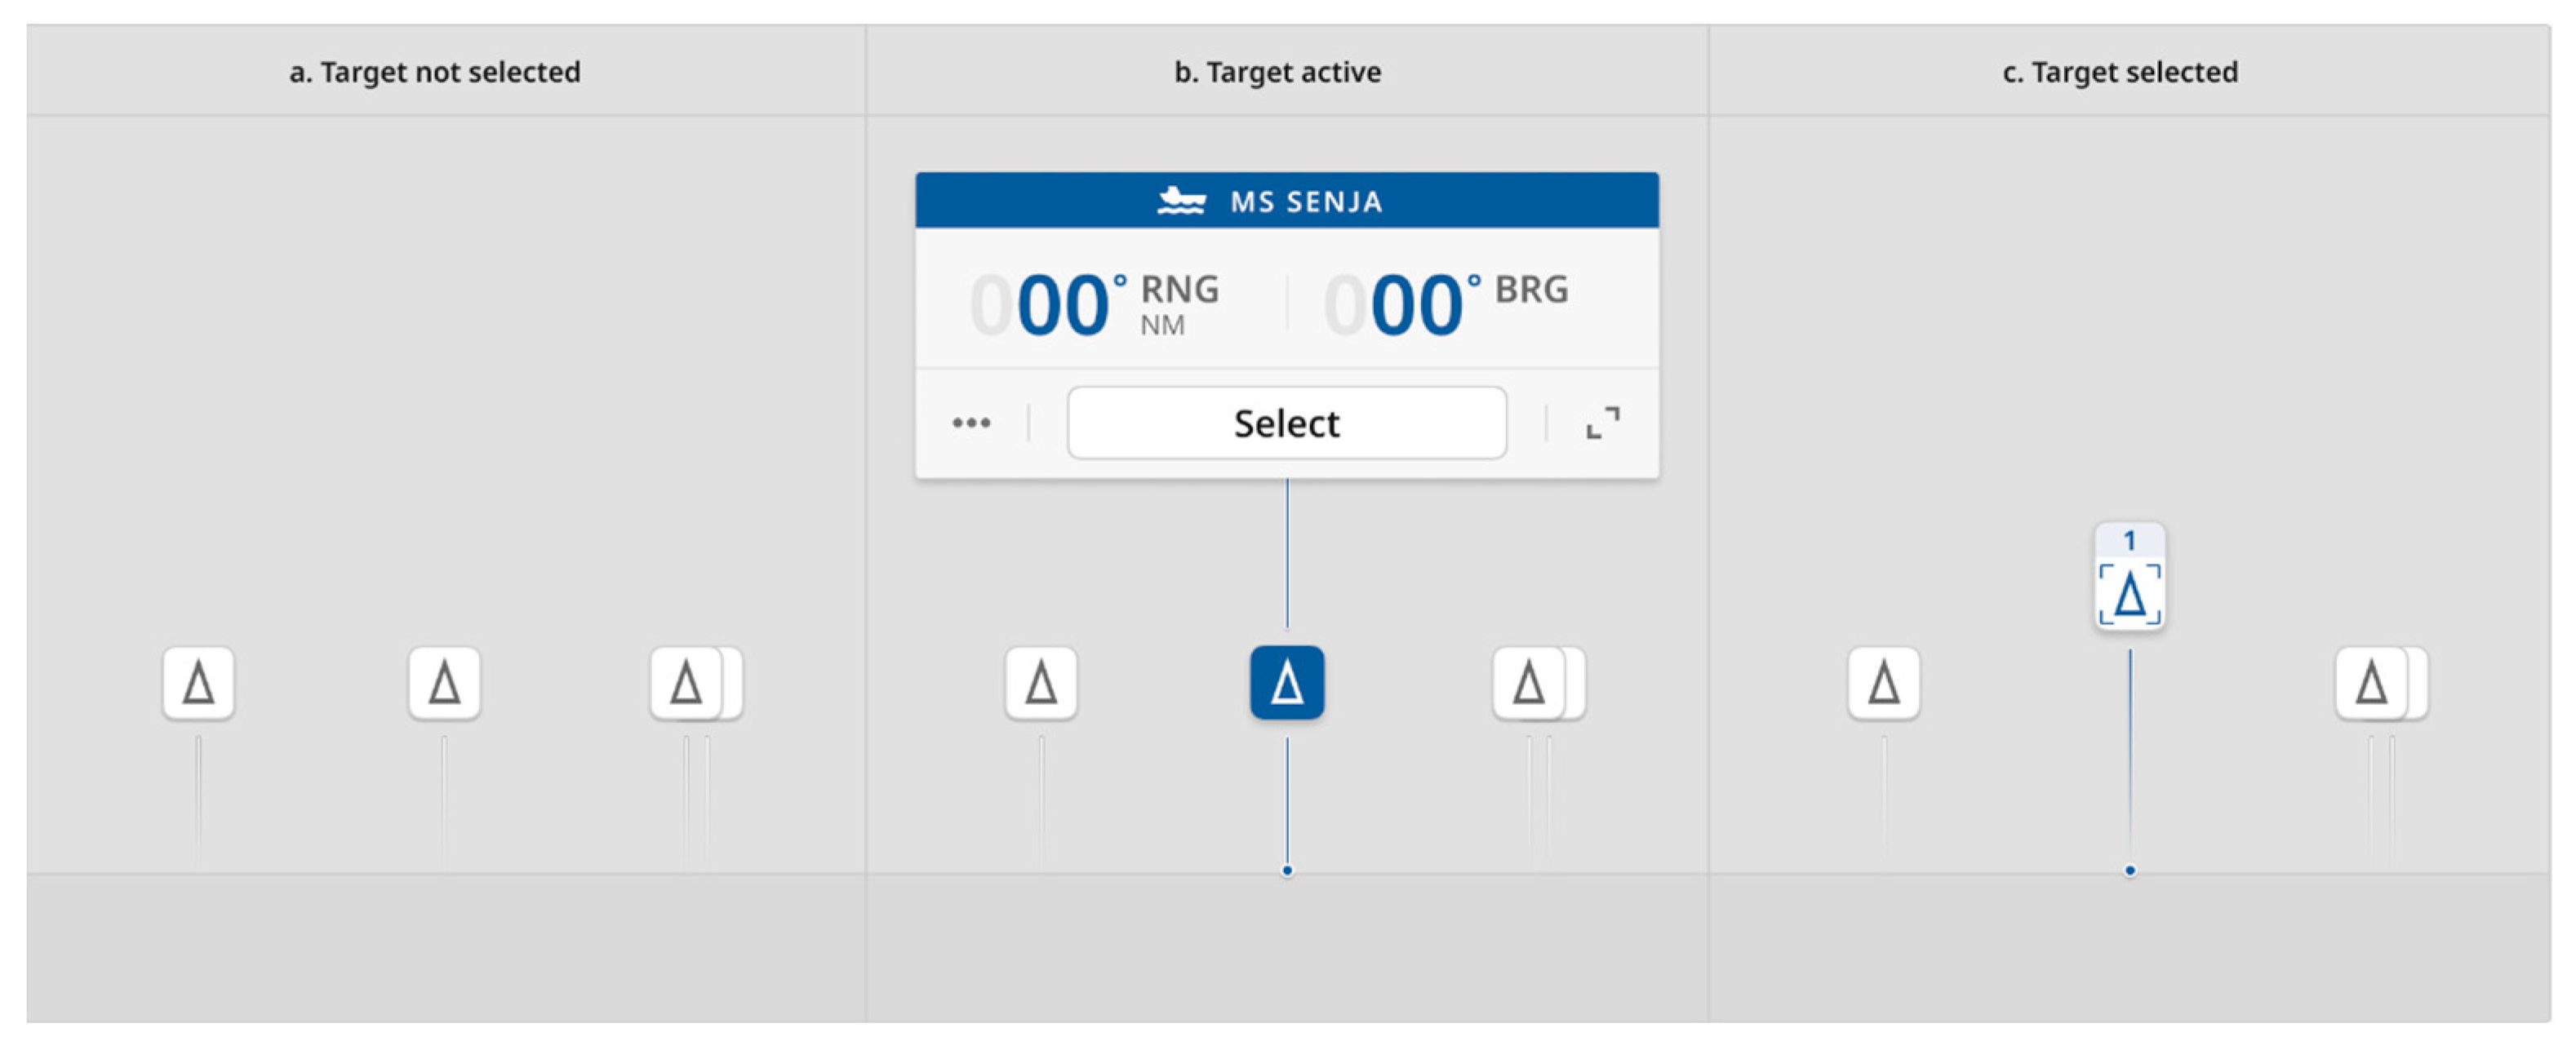
Clicking on a POI component reveals a “POI card”, which consists of a flyout menu with detailed information and associated actions for either a single POI or a group of POIs (Figure 7). The POI card facilitates access to POI-related functions and displays pertinent data. Users have the option to “select” or “deselect” specific POIs using the card. Figure 7 shows the process of selecting a target. First, a target is unselected (a), then a user clicks on the target and it goes into checked status and the POI card is shown, then, after the user clicks on the select button, the POI card disappears and the POI is in selected mode (c).
The POI group card displays a list of individual POIs with essential data or provides a top-down view of their locations. When a POI within the group is selected, it is highlighted separately from the group in a distinct layer (see the layout section below for more details).
When a card is open, it remains stationary, and a connector line extends to follow the target, reducing excessive movement in the interface for a more stable visual experience. Users can also set a POI card for a particular target to remain ‘sticky’, keeping it constantly visible at the top of the display area.
3.2. Layout
Organizing the POIs over the real world is challenging. Firstly, the number of potential POIs in the world can be very large. Secondly, due to the perspective, targets will tend to gather close to the horizon. Consequently, there is a large chance that POIs will overlap and that the overlapping POIS will cluster close to the horizon. To meet these challenges, we have developed a layout system that uses several techniques to organize the available information.
3.2.1. Sorting Content Types in Columns
The POI buttons are structured above the horizon line to ensure they do not interfere with any objects in the water. The sky is divided into rows where different types of POIs such as ships and lighthouses are categorized into separate sections. “Selected” POIs occupy a single row at the top to better separate them from the rest (Figure 8). There can be any number of rows depending on the POI types the user needs to extract.
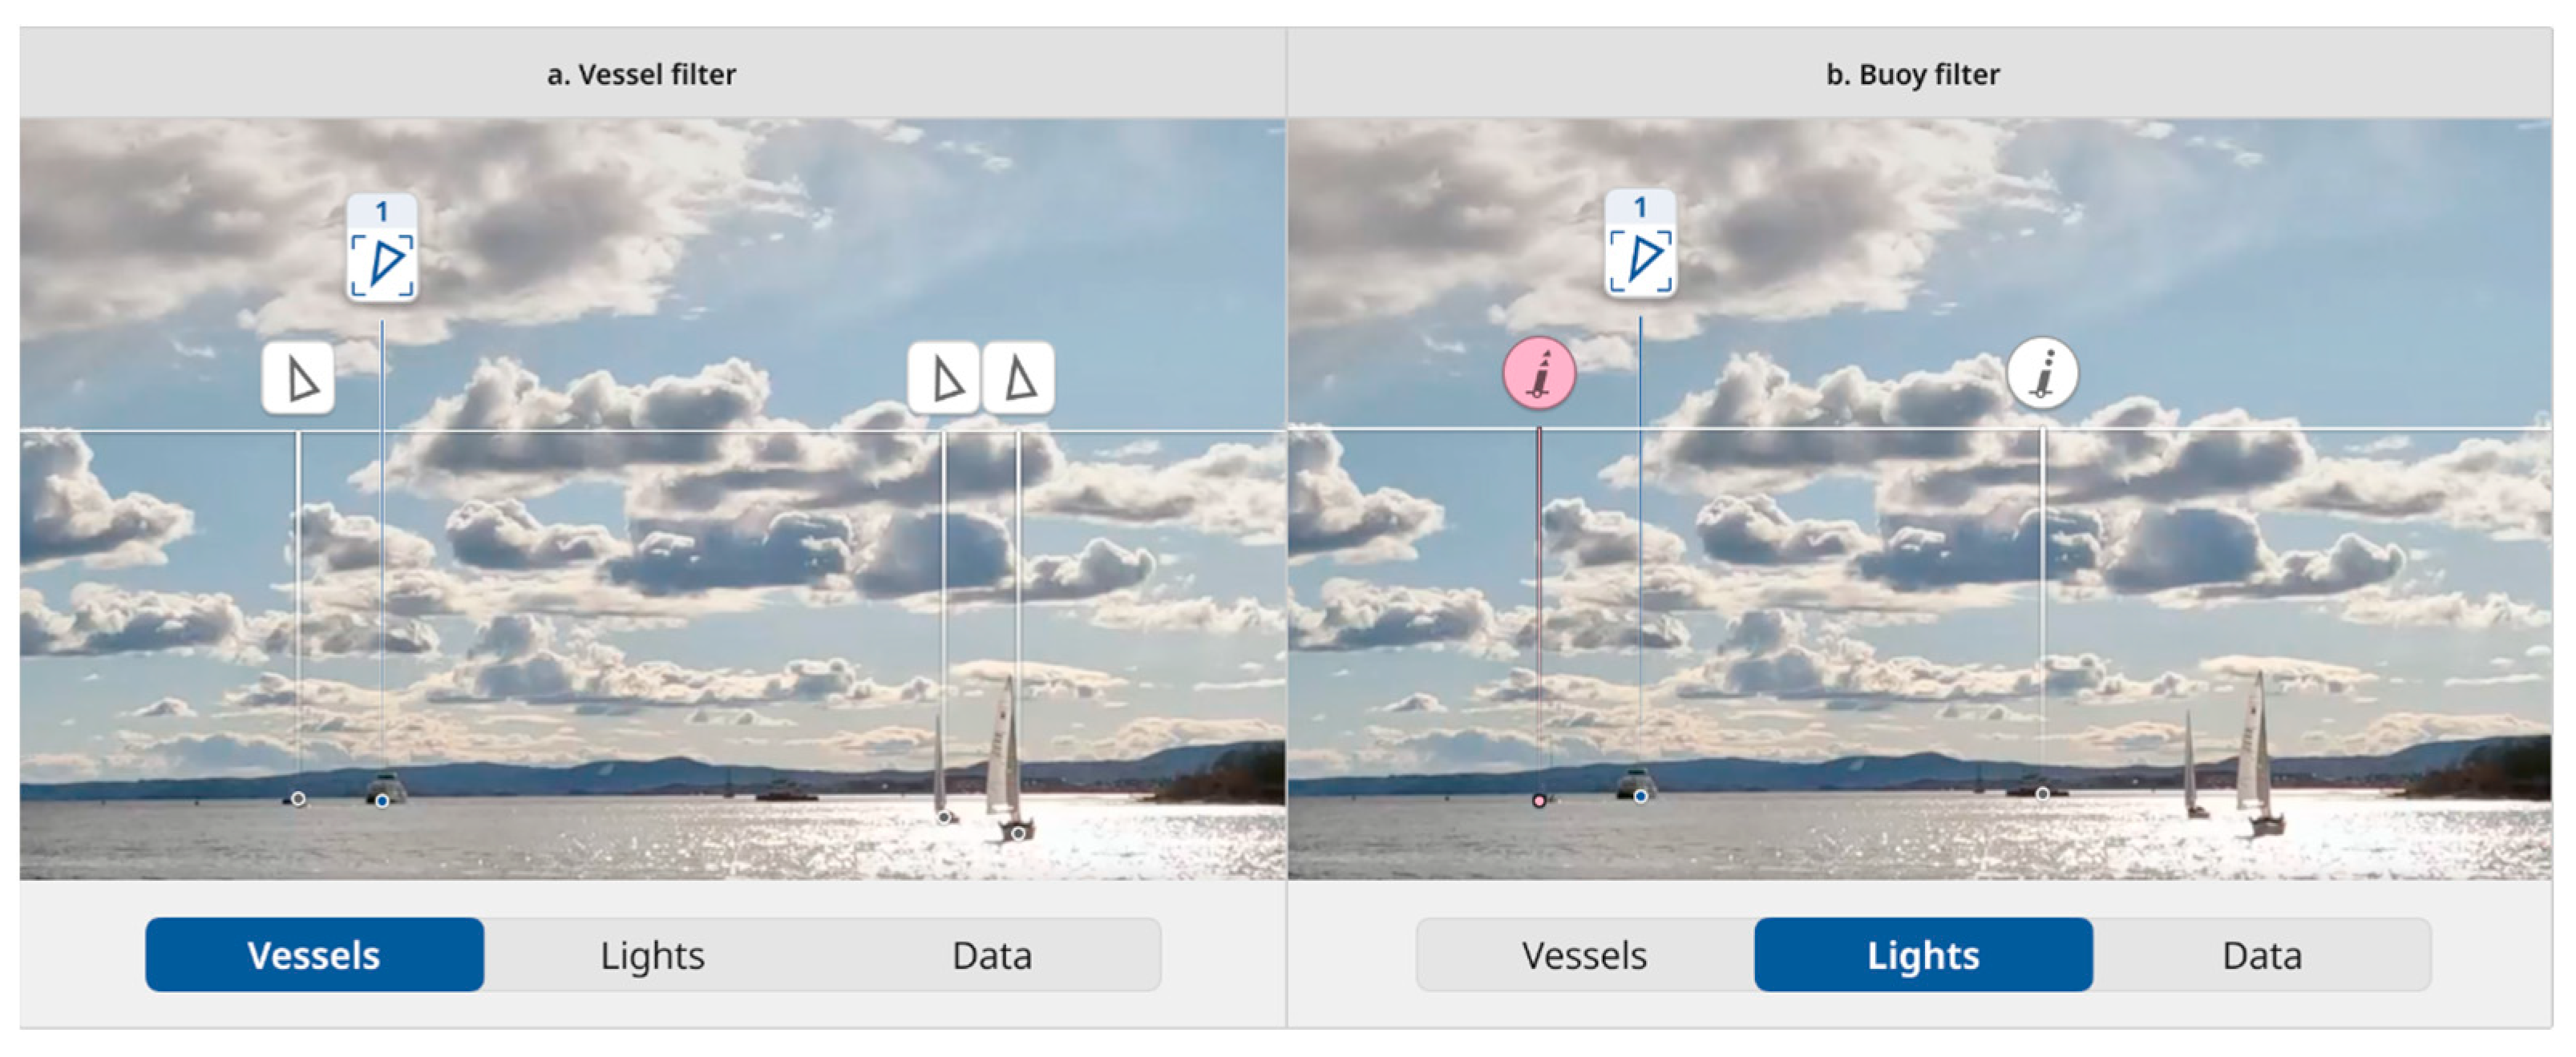
3.2.2. Content Filter
We propose multiple user-selectable filters to manage the density of information. A range filter, indicated on the horizon, has been added and can be adjusted to exclude targets that are considered too distant by the users. More filter types, such as target speed and direction, will likely be useful in helping users reduce information clutter. Figure 9 shows an example in filtering the view after POI type.
3.2.3. Information Density Control
Given that AR graphics can obscure the external world, it is crucial for users to be able to switch AR information layers swiftly. We suggest swift access between having a “non” info mode, a “selected” information overlay showing only critical information and selected targets, and an “all” overlay showing dense information about the context (Figure 10). The user must be able to obtain an unobscured view of ocean space at any time. We argue that a dense information view should only be used temporarily if the AR view replaces the real view, such as with see-through AR glasses. This can be useful to swiftly compare the outside view with sensor data.
3.2.4. Distance View
Distance between POIs can be shown in an optional information row. Here the lower line represents the user’s own ship position, and the higher line represents the set range limit (Figure 11). All target relative distances to the user’s own ship position are shown within the row. Ranges can be compared between POIs by adding range rulers. The range rules will appear on the water and in the row when it is used. We propose the range rulers are harmonized with the Variable Range Marker (VRM) and Electronic Bearing Line (EBL) that are tools used in radar maneuvering. We propose displaying VRM and EBL directly in the AR view to align readings across radar and AR views.
3.2.5. POI Overlap
When two POIs in a row start to overlap, they merge into a group component. The group component will prioritize the display of the most important content icons. We have not defined the principles for considering what is most important since they will depend on a range of factors related to available detection equipment and the specific context of the current operation. Any overlapped icon will be hidden to avoid misrepresentation of partly obscured icons. A user must interact with a grouped POI in order to see a POI card showing the individual POIs in the group and related data. If a user marks a POI in the group as “selected” it will be pulled out of the group and placed in the selected target column. Figure 12 shows how overlapping POIs are grouped.
3.3. Cross UI Hardware Compatibility
AR hardware is in rapid development, and it is likely that any POI system would benefit from being able to adapt to several display technologies. For that reason, our design proposal can be adapted to regular screens and two main types of head-mounted displays (HMD). These are see-through AR devices like Microsoft HoloLens and pass-through VR devices such as the Meta Quest 3.
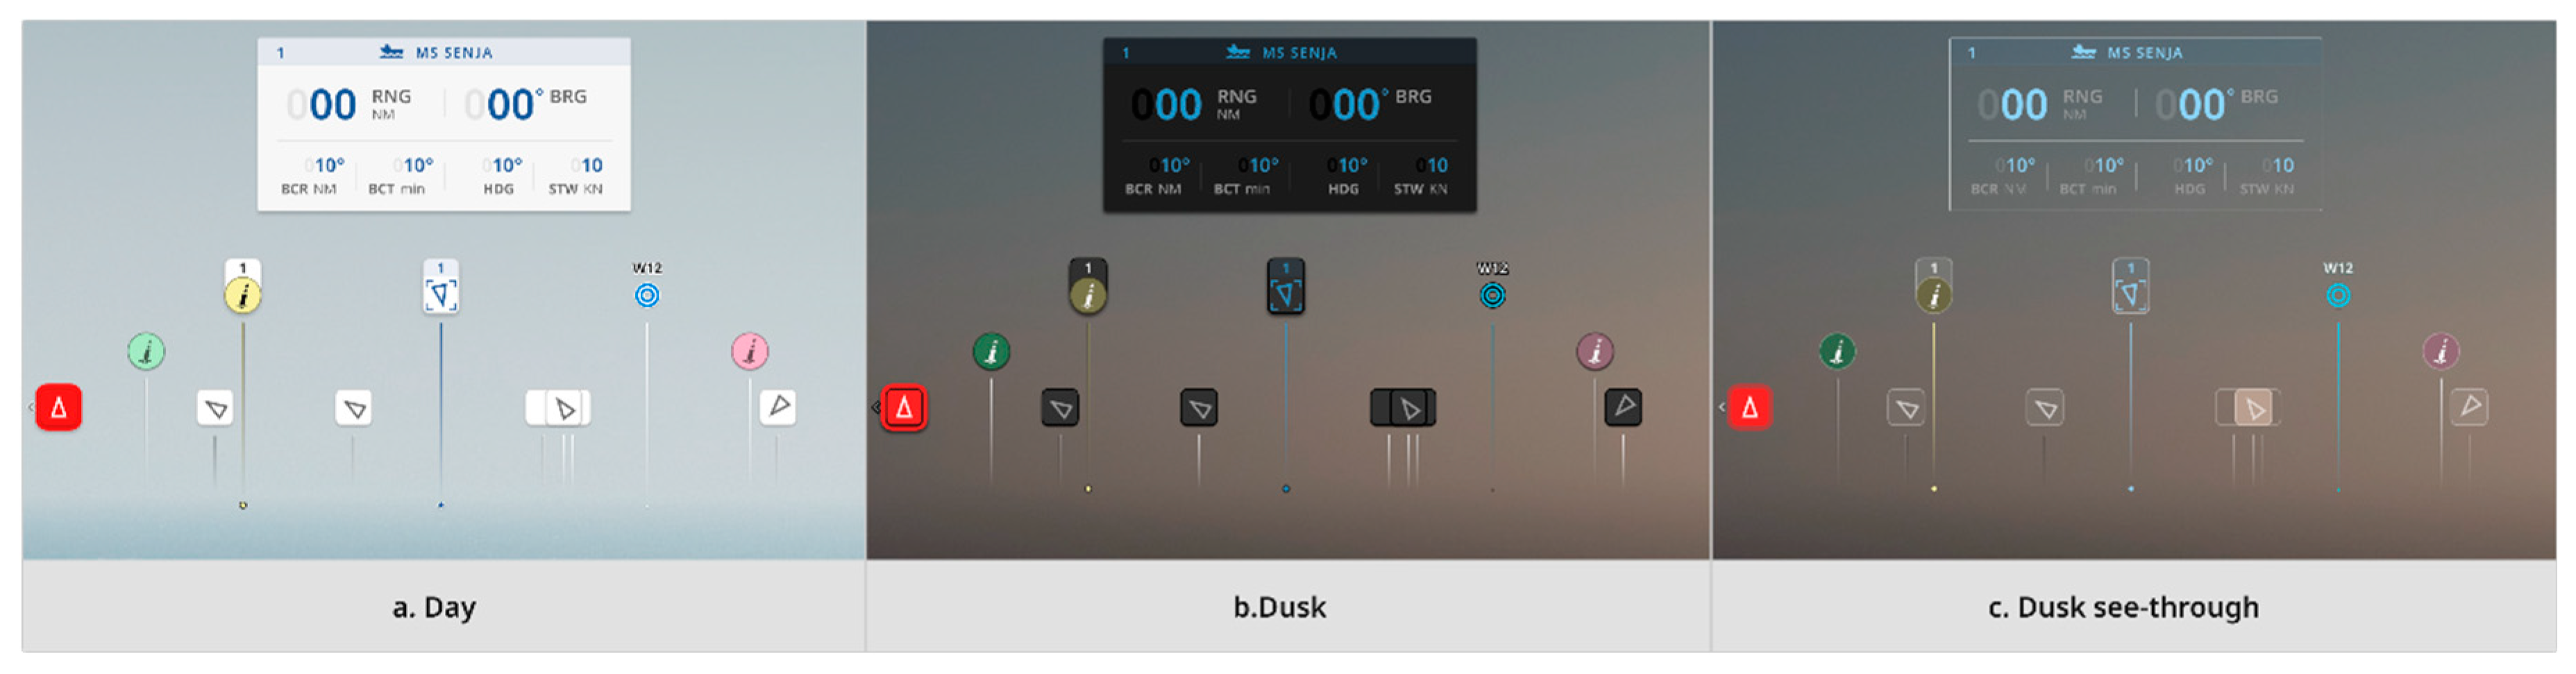
3.3.1. Colors
For screen-based AR, we have applied the OpenBridge palettes directly as they provide good contrast and legibility. To support different luminosity on the video and in the screens context, we have applied standard dusk, day, and night palettes. Figure 13 shows (a) day palette and (b) dusk palette. We use the same palette setup for VR pass-through devices since they also rely on overlaying graphics on video.
See-through devices pose a challenge as the overlaying graphics in most headsets are transparent, and contrast is defined by the luminosity of the added graphics and the optics of the device in use. Hence, it is necessary to adjust colors, contrast, and brightness to the individual hardware used for see-through AR. Figure 13c shows an example of a palette for see-through AR.
3.3.2. Interface Structure
There is a distinct difference in how we structure the interface for screens, pass-through devices, and see-through devices. For screens, interface components can typically be placed along the side of the screen (Figure 14a). For HMDs, there are no edges since the entire view is a potential info area. In addition, for see-through devices, the area where we can show graphics is smaller than a user’s field of view (Figure 14b). These differences make it necessary to alter the layout for each individual technology.
3.3.3. Interaction
The screen-based system is designed to support indirect pointers such as mouse or rollerball or touch screen interaction. We support this by having a minimum 15 mm click surface on all interactive components according to regulations for touch interaction [21]. The HMD design also supports those interaction devices and uses the same size adjusted for distance to interactive components.
HMDs also commonly support a diverse set of input technologies such as gestures and eye tracking. We have yet to test these technologies for the POI system. If the current size is not sufficient to support eye-tracking or gestures, the interactive areas need to be enlarged. Our current experience suggest that we can likely apply the current scale for gaze interaction, while it might be necessary to use larger buttons for direct tap gesture interactions.
The previous section has provided a detailed account of an example of a POI UI design. The examples have been developed over a long period through several iterations. By laying out the design and its rationale in detail we add to the current state of the art of POI design for maritime navigation. In the next section we will move from a specific example to a framework for generic requirements.
3.4. Framework for Design Requirements
Since POI systems are relatively novel in the maritime context, there are few formal requirements directing the design process. We propose our design proposal can be a source for establishing an early phase framework of design requirements for POI system design. In the following tables, we present a set of possible design requirements that are drawn from the design rationale developed through the design case. Table 2 shows general requirements, Table 3 shows requirements for workplace integration, Table 4 shows requirements for POIs, and Table 5 requirements for organizing POIs.
4. Discussion
POI systems are often presented as a new category of systems supporting users’ situational awareness. In upcoming ROC centers, they may fill the same function and make it easier to connect sensor data with real life context. As a new safety-oriented system, it is important for the industry to share knowledge of how to design safe POI systems. This will require multidisciplinary collaboration including testing of novel systems and new forms of training. We contribute to this development by showing an example of how to design user friendly POI systems and sharing the results as open source to the maritime community through the OpenBridge Design system.
The design proposals are demonstrating a series of novel approaches to POI design that go beyond the state of the art. For instance, since the system is designed in conjunction with other systems such as RADAR and ECDIS, it will draw in benefits related to consistent design such as user ability to transfer skills from one system to another [32]. Further, the system demonstrates a new and comprehensive approach to organizing and sorting data in AR space, such as dividing the horizon into content rows. Also, the proposal has been designed to work across different AR technologies. Our proposal enables the application of the same POI design framework across most available AR technologies through minor adjustments of palette, information organization, and sizing of components. This makes it possible to make one system supporting both operators of ships’ bridges and ROC workplaces.
Our work demonstrates the feasibility of designing AR systems with existing guidelines, yet it highlights the need for AR-specific guidelines. Current icon libraries lack support for all features necessary for AR, including sensors like LIDAR and cameras. Icons are crucial for reducing screen clutter by overlaying the real world effectively. Furthermore, font and touch interaction sizes must be adjusted for selected hardware, as current minimum requirements are not universally applicable. For instance, the accuracy of eye-tracking technology impacts interaction target size. Also, consideration is required for see-through HMDs, where transparent screens pose readability challenges that vary with background color of the real world, ambient light, headset luminance, and potential HMD sun shading.
We argue that while parts of current regulations can be adapted in AR design, there is a clear need for developing amendments specifically for various AR hardware types to ensure safe and efficient operation in the future.
Our work proposes a hardware-agnostic approach to AR. Throughout the project, we developed a series of prototypes and conducted trials across screen-based, pass-through, and see-through AR modalities. Based on these trials, we believe the concepts presented are applicable across different technologies, provided the interface is adapted to account for the medium-specific differences highlighted in this text.
In terms of AR adaptation, our experience shows that screen-based AR is highly relevant and already implemented in ROC centers and for SA support on ships. HMD-based AR still poses challenges, such as tracking in moving environments or system performance under bright light. However, promising developments are emerging, with increased support for moving platforms and new hardware offering improved light performance. Regarding rendering performance, we successfully demonstrated POI graphics on both pass-through and see-through HMDs without major issues in our trials. This success is likely attributable to the AR graphics’ reliance on simple geometry, which is less taxing on hardware compared to full VR experiences.
Our work contributes to the development of design requirements for POI system design. We have used the design process to better understand and establish new requirements. Many of the design requirements related to designing POI systems were not obvious or understood at the start of the process, as they emerged because of the experimentation through the design process. The design requirements are abstracted from these solutions, and we argue the work is an early step towards establishing design requirements for new POI systems. The design requirements must be considered early phase and not universal since they only reflect the requirements found through our design process.
We argue such proposed requirements are important for the maritime industry since no regulatory requirements currently exist specifically supporting maritime POI systems. Since POI systems are currently entering the market, there is an imminent need for regulatory authorities to evaluate whether or how POI system user interfaces should be regulated. Our work contributes to new regulation and guidance development by offering a concrete and elaborate example of a POI system design and an overview of the general set of requirements that are compatible with the design.
5. Conclusions
We have presented a series of novel user interface concepts supporting the design of an AR-mediated POI system, developed through an extensive user-centered design process. The novel concepts have been used to establish a series of detailed design requirements that can inform future development of AR-related design guidance.
Early phase design exploration of new technology formats is essential to move the domain forward and better expose possibilities and challenges when adding new technologies to the workplace. This is especially important for new technologies such as AR, that require entirely new approaches to user interface design. This work, as one of the first detailed descriptions of a comprehensive maritime AR POI system, is a significant contribution to the open development of safe new POI AR interfaces. Further, we argue it can help the development of new detailed design guidance for maritime AR.
In further work, the system will be developed further in the context of application in ROCs and the system will be extended to more elaborate support for maneuvering applications.
Supplementary Materials
UI components supporting POI design can be downloaded at: www.openbridge.no (accessed on 1 February 2024).
Author Contributions
Conceptualization, K.N. and J.E.F.; methodology, K.N.; validation, E.G., S.M. and J.E.F.; formal analysis, K.N. and J.E.F.; investigation, K.N. and J.E.F.; writing—original draft preparation, K.N. and J.E.F.; writing—review and editing, E.G. and S.M.; visualization, J.E.F.; supervision, K.N.; project administration, K.N.; funding acquisition, K.N., E.G., S.M. and J.E.F. All authors have read and agreed to the published version of the manuscript.
Funding
This research was funded by the Norwegian Research Council through the MAROFF program, grant number 320247.
Institutional Review Board Statement
Not applicable.
Informed Consent Statement
Not applicable.
Data Availability Statement
The design component for the AR system is available at www.openbridge.no in the Figma section. Or use this link for direct access: https://www.figma.com/file/97IQwfn2ybi9Cas78ei8BE/OpenBridge-5.0?type=design&node-id=36353%3A293515&mode=design&t=xoLxJoSPcRDuCCZJ-1 (accessed on 1 February 2024).
Acknowledgments
Thank you to the OpenAR project members.
Conflicts of Interest
The authors declare no conflicts of interest.
| 1 | OpenAR is a short name for a Norwegian research project and must not be confused with the OpenAR consortium for general AR standardization. |
References
- Hareide, O.S. Improving Passage Information Management for the Modern Navigator. In Proceedings of the 19th International Association of Marine Aids to Navigation and Lighthouse Authorities Conference (IALA 2018), Incheon, Republic of Korea, 27 May–2 June 2018. [Google Scholar]
- International Maritime Organization. Convention on the International Regulations for Preventing Collisions at Sea, 1972 (COLREGs); International Maritime Organization: London, UK, 1977. [Google Scholar]
- Sampson, H.; Ellis, N.; Acejo, I.; Turgo, N.; Tang, L. The Causes of Maritime Accidents in the Period 2002–2016; Cardiff University: Cardiff, UK, 2018. [Google Scholar]
- Hareide, O.S.; Ostnes, R. Maritime Usability Study by Analysing Eye Tracking Data. J. Navig. 2017, 70, 927–943. [Google Scholar] [CrossRef]
- Liu, Y.-C.; Wen, M.-H. Comparison of Head-up Display (HUD) vs. Head-down Display (HDD): Driving Performance of Commercial Vehicle Operators in Taiwan. Int. J. Hum.-Comput. Stud. 2004, 61, 679–697. [Google Scholar] [CrossRef]
- Mallam, S.; Nordby, K.; Johnsen, S.; Bjørneseth, F. The Digitalization of Navigation: Examining the Accident and Aftermath of US Navy Destroyer John S. McCain. In Proceedings of the Royal Institution of Naval Architects Damaged Ship V, London, UK, 11 March 2020; pp. 55–63. [Google Scholar]
- Azuma, R.T. A Survey of Augmented Reality. Presence Teleoperators Virtual Environ. 1997, 6, 355–385. [Google Scholar] [CrossRef]
- Hareide, O.S.; Porathe, T. Maritime Augmented Reality. Coordinates Magazine, February 2019; pp. 31–35. [Google Scholar]
- Woodward, J.; Ruiz, J. Analytic Review of Using Augmented Reality for Situational Awareness. IEEE Trans. Vis. Comput. Graph. 2022, 29, 2166–2183. [Google Scholar] [CrossRef] [PubMed]
- Laera, F.; Fiorentino, M.; Evangelista, A.; Boccaccio, A.; Manghisi, V.M.; Gabbard, J.; Gattullo, M.; Uva, A.E.; Foglia, M.M. Augmented Reality for Maritime Navigation Data Visualisation: A Systematic Review, Issues and Perspectives. J. Navig. 2021, 74, 1073–1090. [Google Scholar] [CrossRef]
- Takenaka, M.; Nishizaki, C.; Okazaki, T. Development of Ship Collision Prevention Device with Augmented Reality Toolkit. In Proceedings of the 2019 IEEE International Conference on Systems, Man and Cybernetics (SMC), Bari, Italy, 6–9 October 2019; pp. 4290–4295. [Google Scholar]
- Frydenberg, S.; Aylward, K.; Nordby, K.; Eikenes, J.O.H. Development of an Augmented Reality Concept for Icebreaker Assistance and Convoy Operations. J. Mar. Sci. Eng. 2021, 9, 996. [Google Scholar] [CrossRef]
- Porathe, T.; Ekskog, J. Egocentric Leisure Boat Navigation in a Smartphone-Based Augmented Reality Application. J. Navig. 2018, 71, 1299–1311. [Google Scholar] [CrossRef]
- Kim, H.; Gabbard, J.L. Assessing Distraction Potential of Augmented Reality Head-Up Displays for Vehicle Drivers. Hum. Factors 2022, 64, 852–865. [Google Scholar] [CrossRef] [PubMed]
- Holder, E.; Pecota, S.R. Maritime Head-Up Display: A Preliminary Evaluation. J. Navig. 2011, 64, 573–594. [Google Scholar] [CrossRef]
- Rowen, A.; Grabowski, M.; Rancy, J.P.; Crane, A. Impacts of Wearable Augmented Reality Displays on Operator Performance, Situation Awareness, and Communication in Safety-Critical Systems. Appl. Ergon. 2019, 80, 17–27. [Google Scholar] [CrossRef] [PubMed]
- Hong, T.C.; Andrew, H.S.Y.; Kenny, C.W.L. Assessing the Situation Awareness of Operators Using Maritime Augmented Reality System (MARS). Proc. Hum. Factors Ergon. Soc. Annu. Meet. 2015, 59, 1722–1726. [Google Scholar] [CrossRef]
- Furuno Electric Co., Ltd. Furuno Envision AR. Available online: https://www.furuno.com/special/en/envision/ (accessed on 18 April 2023).
- Nordby, K.; Gernez, E.; Mallam, S. OpenBridge: Designing for Consistency Across User Interfaces in Multi-Vendor Ship Bridges. In Proceedings of the Ergoship 2019, Haugesund, Norway, 24–25 September 2019. [Google Scholar]
- Nordby, K.; Mallam, S.C.; Lützhöft, M. Open User Interface Architecture for Digital Multivendor Ship Bridge Systems. WMU J. Marit. Aff. 2019, 18, 297–318. [Google Scholar] [CrossRef]
- IEC IEC 62288:2014; Maritime Navigation and Radiocommunication Equipment and Systems. International Electrotechnical Commission: Geneva, Switzerland, 2014.
- Gernez, E.; Nordby, K.; Eikenes, J.O.; Hareide, O.S. A Review of Augmented Reality Applications for Ship Bridges. Necesse 2020, 5, 159–186. [Google Scholar]
- Nordby, K.; Gernez, E.; Frydenberg, S.; Eikenes, J.O. Augmenting OpenBridge: An Open User Interface Architecture for Augmented Reality Applications on Ship Bridges. In Proceedings of the 19th Conference on Computer Applications and Information Technology in the Maritime Industries (COMPIT’20), Virtual, 17–19 August 2020. [Google Scholar]
- Ocean Industries Concept Lab. Available online: https://www.oicl.no/ (accessed on 11 December 2023).
- OpenBridge Design System 5.0. Available online: https://www.openbridge.no/ (accessed on 11 December 2023).
- Safe Maritime Operations under Extreme Conditions: The Arctic Case|SEDNA Project|Fact Sheet|H2020. Available online: https://cordis.europa.eu/project/id/723526 (accessed on 11 December 2023).
- Lurås, S.; Nordby, K. Field Studies Informing Ship’s Bridge Design at the Ocean Industries Concept Lab. Hum. Factors Ship Des. Oper. 2014, 20, 27. [Google Scholar]
- Figma. Available online: https://www.figma.com (accessed on 30 January 2024).
- Frydenberg, S.G.; Nordby, K. Virtual Fieldwork on a Ship’s Bridge: Virtual Reality-Reconstructed Operation Scenarios as Contextual Substitutes for Fieldwork in Design Education. Virtual Real. 2022, 27, 3333–3344. [Google Scholar] [CrossRef] [PubMed]
- Houweling, K.P.; Mallam, S.C.; van de Merwe, K.; Nordby, K. The Effects of Augmented Reality on Operator Situation Awareness and Head-Down Time. Appl. Ergon. 2024, 116, 104213. [Google Scholar] [CrossRef] [PubMed]
- van den Oever, F.; Sætrevik, B.; Fjeld, M.; Nordby, K. A Virtual Reality Experiment Shows That Augmented Reality Can Improve Collaboration in Ship Navigation. PsyArXiv. 2023. Available online: https://osf.io/preprints/psyarxiv/ts5wx (accessed on 30 December 2023).
- Nielsen, J. Coordinating User Interfaces for Consistency. ACM Sigchi Bull. 1989, 20, 63–65. [Google Scholar] [CrossRef]
Figure 1.
The OpenBridge POI system concept design.

Figure 2.
The structure of a generic POI component.

Figure 3.
POI types and states.

Figure 4.
The target button can use a large variety of IEC target icons.

Figure 5.
Varieties of target types and sizes.

Figure 6.
Indication of sensor in POI button and on target. (a) Generic target is shown as point, (b) Radar target is shown as line, (c) AIS target is shown as dashed frame, and (d) Camera target is shown as frame.
Figure 6.
Indication of sensor in POI button and on target. (a) Generic target is shown as point, (b) Radar target is shown as line, (c) AIS target is shown as dashed frame, and (d) Camera target is shown as frame.

Figure 7.
Target states, (a) not selected, (b) active target with POI card, and (c) selected target.
Figure 7.
Target states, (a) not selected, (b) active target with POI card, and (c) selected target.

Figure 8.
Row layout system.

Figure 9.
Content filters. (a) Vessel filter. (b) Buoy (light) filter.

Figure 10.
Content density control. (Left) no data. (Middle) selected and important data. (Right) all data.
Figure 10.
Content density control. (Left) no data. (Middle) selected and important data. (Right) all data.

Figure 11.
(a) Distance visualization in AR view. (b) Distance visualization in minimap.

Figure 12.
The figures show transition from not overlapping targets to overlapping and opened group.
Figure 12.
The figures show transition from not overlapping targets to overlapping and opened group.

Figure 13.
Color palette examples: day, dusk, and dusk see-through.

Figure 14.
Interfaces adapted to (a) screen and (b) see-through HMD.

Table 2.
General requirements.
| Title | Description |
|---|---|
| Icons | The POI component must meet the icon specifications outlined in the IEC 62288 standard. |
| Contrast and Legibility | The POI system should follow the contrast and legibility recommendations outlined in the Web Content Accessibility Guidelines (WCAG) 2.1. Exceptions may be made for special cases such as see-through augmented reality devices and night palettes. |
| Font size | Fonts should follow the IEC 62288 font recommendation of sans serif minimum 7.5 mm size one-meter distance. |
| Icon size | Icons should have a minimum 7.5 mm size on one-meter distance. |
| Background contrast | On pass-through or screen-based systems all elements must have an outline separating graphics from video background. |
| Palettes | Must offer day, dusk, and night palettes corresponding to ECDIS and RADAR interfaces. |
Table 3.
Requirements for Workplace integration.
| Title | Description |
|---|---|
| Navigation integration | The POI system must synchronize “selected” targets with RADAR and ECDIS. |
| Design consistency | The POI system should use the same design philosophy as RADAR and ECDIS on the bridge |
| RADAR/ECDIS | Should be able to synchronize “selected” targets across AR, RADAR, and ECDIS including numbering as well as share VRM and EBL. |
| Multiuser | The system must coordinate selected targets and shared data across all instances of AR overlays involved in the same operation. |
Table 4.
Requirements for POI components.
| Title | Description |
|---|---|
| Connect POI and info | The system must visually link information to POIs in the environment. |
| Separate POI types | The system must visually distinguish between navigation markers and moving targets. |
| Input methods | The system should make it possible to interact with POIs using two or more input methods. |
| Interaction screen | For screens, any interactive component must have a minimum of 15 mm touch surface at 1 m. |
| Interaction HMD | For HMD interaction using gaze and click, air tap, or pointer tap, interactive components should demonstrate adequate interaction target size for effective operation. |
| Support interaction states | Interactive components should show relevant interaction states supporting chosen input methods (such as hover, focused, active, and selected) |
| Select targets | Must support two-click interaction to set a target in “selected” mode. |
| Differentiate selected targets | Must be able to clearly separate “selected targets” from other POIs. |
| Minimum POI data display | Must be able to show one or more data elements within 48 mm horizontal size in direct relation to a POI. |
| Detailed POI data | Detailed data related to the POI must be available on single operation. |
| Distance | Must be able to view distance to POI. |
| Alerts | Must be able to display alerts in relation to POIs. |
| Direction and speed | Should be able to show the direction and speed of moving POIs. |
| Sea markers | Make it possible to view sea marker type according to IEC 62288 guidance. |
| Sensor source | Must be able to display data sources that are used to detect the POI in minimum POI data display. |
| POI finder | Must be able to point to important POIs outside field such as POIs with alert or “selected” POI. |
| POI group info | Must be single operation access to individual POI information and relative position for a POI group. |
| Detailed info movement | The system should limit the movement of detailed POI info in relation to the real world and should offer the possibility to anchor the info to world context. |
Table 5.
Requirements for organizing POI objects in the world.
| Title | Description |
|---|---|
| Prioritize urgent content | The POI system must be able to indicate the importance or urgency of individual POIs. |
| Ocean surface | The POI system must restrict the amount of information displayed on the ocean surface and it must be possible to immediately remove all graphics from ocean surface. |
| Separate POI types | Must enable sorting of POI types into categories. |
| Overlapping POIs | Must be able to show grouped POIs whenever POIs are overlapping and are not able to offer 15 mm minimum interaction area. |
| Range filter | The POI system must offer a range setting that can be adjusted to exclude targets outside the range. |
| Information density control | Must offer single action access to at least three information density modes. No AR overlay, only the most important POIs, and a rich data overlay showing more information. |
| Comparing distance | Must be able to compare distance to two or more POIs. |
| Information settings | It should be possible for users to set preferences for what data to show in the AR overlay. |
Disclaimer/Publisher’s Note: The statements, opinions and data contained in all publications are solely those of the individual author(s) and contributor(s) and not of MDPI and/or the editor(s). MDPI and/or the editor(s) disclaim responsibility for any injury to people or property resulting from any ideas, methods, instructions or products referred to in the content. |
© 2024 by the authors. Licensee MDPI, Basel, Switzerland. This article is an open access article distributed under the terms and conditions of the Creative Commons Attribution (CC BY) license (https://creativecommons.org/licenses/by/4.0/).
Share and Cite
MDPI and ACS Style
Nordby, K.; Fauske, J.E.; Gernez, E.; Mallam, S. A User Interface Design Framework for Augmented-Reality-Supported Maritime Navigation. J. Mar. Sci. Eng. 2024, 12, 505. https://0-doi-org.brum.beds.ac.uk/10.3390/jmse12030505
AMA Style
Nordby K, Fauske JE, Gernez E, Mallam S. A User Interface Design Framework for Augmented-Reality-Supported Maritime Navigation. Journal of Marine Science and Engineering. 2024; 12(3):505. https://0-doi-org.brum.beds.ac.uk/10.3390/jmse12030505
Chicago/Turabian StyleNordby, Kjetil, Jon Erling Fauske, Etienne Gernez, and Steven Mallam. 2024. "A User Interface Design Framework for Augmented-Reality-Supported Maritime Navigation" Journal of Marine Science and Engineering 12, no. 3: 505. https://0-doi-org.brum.beds.ac.uk/10.3390/jmse12030505
Note that from the first issue of 2016, this journal uses article numbers instead of page numbers. See further details here.