Article

Towards a Realistic Estimation of the Powering Performance of a Ship with a Gate Rudder System

1
Department of Naval Architecture, Ocean and Marine Engineering, University of Strathclyde, Glasgow G4 0LZ, UK
2
Kuribayashi Steamship Co. Ltd.,Tokyo 100-0004, Japan
3
Kamome Propeller Co. Ltd.,Yokohama 245-8542, Japan
*
Author to whom correspondence should be addressed.
J. Mar. Sci. Eng. 2020, 8(1), 43; https://0-doi-org.brum.beds.ac.uk/10.3390/jmse8010043
Submission received: 11 December 2019 / Revised: 11 January 2020 / Accepted: 12 January 2020 / Published: 15 January 2020

Abstract

:
This paper presents an investigation on the scale effects associated with the powering performance of a Gate Rudder System (GRS) which was recently introduced as a novel energy-saving propulsion and maneuvring device. This new system was applied for the first time on a 2400 GT domestic container ship, and full-scale sea trials were conducted successfully in Japan, in 2017. The trials confirmed the superior powering and maneuvring performance of this novel system. However, a significant discrepancy was also noticed between the model test-based performance predictions and the full-scale measurements. The discrepancy was in the power-speed data and also in the maneuvring test data when these data were compared with the data of her sister container ship which was equipped with a conventional flap rudder. Twelve months after the delivery of the vessel with the gate rudder system, the voyage data revealed a surprisingly more significant difference in the powering performance based on the voyage data. The aim of this paper, therefore, is to take a further step towards an improved estimation of the powering performance of ships with a GRS with a specific emphasis on the scale effect issues associated with a GRS. More specifically, this study investigated the scale effects on the powering performance of a gate rudder system based on the analyses of the data from two tank tests and full-scale trials with the above-mentioned sister ships. The study focused on the corrections for the scale effects, which were believed to be associated with the drag and lift characteristics of the gate rudder blades due to the low Reynolds number experienced in model tests combined with the unique arrangement of this rudder and propulsion system. Based on the appropriate semi-empirical approaches that support model test and full-scale data, this study verified the scale effect phenomenon and presented the associated correction procedure. Also, this study presented an enhanced methodology for the powering performance prediction of a ship driven by a GRS implementing the proposed scale effect correction. The predicted powering performance of the subject container vessel with the GRS presented an excellent agreement with the full-scale trials data justifying the claimed scale effect and associated correction procedure, as well as the proposed enhanced methodology for the practical way of predicting the powering performance of a ship with the GRS.

1. Introduction

1.1. Gate Rudder System

A gate rudder system (GRS) is a rather novel but straightforward arrangement of the ship rudder and propeller to act as an attractive and sound energy-saving propulsion and maneuvring device (ESMD), for example, [1,2,3]. In this system, the classical single-rudder behind the propeller arrangement is replaced by twin-rudder blades with asymmetric cross-sections which are positioned on either side of the propeller. The two rudder blades encircle the propeller at the upper half of the propeller plane, as well as at both sides, such as a separated duct which is split into two sections with no bottom part. The arrangement of the gate rudder system (GRS) on the “Shigenobu” is shown in Figure 1a (left) in contrast to the conventional (flap-) rudder system (CRS) of the “Sakura” in Figure 1b (right). Shigenobu has the world’s first GRS installed on it while her sister ship (Sakura) has a conventional rudder system (CRS) with the same hull and engine particulars. The principal dimensions of both vessels are presented in Table 1, Sasaki et al. (2019) [4].
Each rudder blade of the GRS can be controlled individually to affect the direction of the propeller’s slipstream (i.e., to vector), and hence to steer the vessel with increased maneuvring and motion control capability. The GRS, therefore, takes advantage of additional thrust generated by the two rudder blades, in contrast to the extra resistance that results from the conventional rudder. This is somewhat similar to the ducted propulsor but with a much larger propeller diameter as compared with the traditional ducted propeller with less surface area, and hence improves the efficiency significantly. The GRS, therefore, can be categorized as a new “open-type ducted propeller” which is distinct from a conventional “closed-type ducted propeller” (e.g., Kort Nozzle) and a “front-type ducted propeller” (e.g., the Becker Mewis Duct or SILD and Sumitomo Integrated Lammern Duct), as shown in Figure 2.
The foundation of a GRS is based on the originating activities, in Japan, to improve the maneuverability of coastal vessels which require tighter control of ships in their transverse motions at ports. This propulsion and maneuvering device was further developed by the recent R&D activities in the UK, e.g., Sasaki et al. (2015, 2018, 2017, 2019) [1,4,5,6]. The GRS was applied for the first time on a 2400 GT full-scale, new-built coastal container “Shigenobu”, which was entered into service on November 2017. This was to demonstrate the vessel’s performance, especially her excellent maneuverability performance. The comprehensive speed and maneuvering trials with this vessel and her sister ship “Sakura”, indicated that the vessel with GRS was 14% more efficient at the design speed than her sister’s while the gain in service can be as high as 30% in rough seas, as shown in Figure 3.
The service performances of these sister ships, which operate on the same route and almost follow each other’s path with the same mission in the northeast coast of Japan, are investigated based on the ship owner’s standard logbook. This logbook continuously recorded the mean values of the important key performance indicators, such as ship speed, power, and fuel consumption for both vessels, since Nov 2017. As shown in Figure 3a and Figure 4, the plot of the logbook data for powering and fuel consumption, respectively, indicates that the gain in performance for the ship with the GRS was as high as 30% or more than her sister ship with the conventional rudder system (CRS) [2,3].

1.2. Scale Effects

While the main remarkable features of a GRS are highlighted in the previous section (Section 1.1), it should be asked “why did no one think of the GRS idea before?” One reason appears to be that the conventional modelling techniques are not suitable for use in an unconventional propeller-rudder configuration. It is not easy to say, but it strongly relates to the testing technology and the analysis procedures. A GRS is not within the scope of the existing model testing and scaling technology. For example, the resistance of the gate rudder measured in model tests was found to be rather high, i.e., 5 to 10 times as compared with the full scale due to the suspected scale effects. This gives the wrong conclusion for the model test results. In fact, the decision to apply a GRS in full scale was taken in Japan even though the model test results achieved from existing model testing methodologies were unsupportive and the full-scale performance was remarkably above the predicted gain based upon the model tests. The comparative result of the power prediction for the world’s first gate rudder system driven ship, “Shigenobu”, with the trials data using the combined ITTC and Yazaki method [7], can be seen in Figure 3. As shown in Figure 3a, on the one hand, the conventional prediction method did not present any gain for the gate rudder system while the full-scale trials of Shigenobu presented a 14% energy savings. On the other hand, as also shown in Figure 3a, the same method predicted the trial performance of her sistership “Sakura” with the conventional flap-rudder system very well by raising the question for ships with the GRS. In fact, this was the major motivation of this paper to explore the potential scale effects, which may be the reason for the discrepancy between the predictions and the full-scale data for Shigenobu.
The power prediction of ships based on model tests is one of the main tasks for a towing tank facility. Within this context, the conduct of tank tests and their analysis procedures have been historically developed by taking into account not only theoretical approaches but also empirical model-ship correlation factors to achieve the accurate full-scale power predictions at sea trial. In fact, the introduction of the turbulence stimulators is the most well-known practice of the towing tanks by artificially tripping the flow to be turbulent on the model hull surface. However, it is also a well-known fact that the laminar flow can be experienced over the appendages in the stern region, even within the thick boundary layers which can be stimulated for turbulent flow by the above-mentioned procedure of using a turbulence stimulator. It is also true that the turbulence stimulator is not applied to the models of the conventional rudders because they operate in the propeller slipstream with the accelerated flow which can suppress the presence of laminar flow and its separation, whereas this may not be true for the GRS driven models due their different arrangements as will be discussed later.
In this paper, the reason for the above-mentioned scale effect for the GRS driven ships is explored and verified by using the model test results of two different size models with the GRS. The aim is to take a further step towards an improved estimation of the powering performance of ships with the GRS. The scale effect is associated with the drag and lift characteristics of the gate rudder blades and correction procedures were proposed based on the semi-empirical approaches supported with the available model test and full-scale trials data. The suggested scale effect correction was also implemented in the powering performance prediction method for ships with the GRS and results were validated with the full-scale trials data for Shigenobu.

2. Scale Effect Prediction for the Gate Rudder System

2.1. Effect of the Rudder Position

As shown in Figure 1a, the gate rudder blades are located on either side of a propeller with large clearances. Therefore, the flow field surrounding the gate rudder is quite different from that of a conventional rudder case (Figure 1b) with the following distinct features:
  • The flow field around the gate rudder is rather uniform without any strong disturbance from the propeller’s slipstream;
  • The magnitude of the average flow speed at the gate rudder blades is close to the ship speed while the flow has a component in the transverse direction towards the ship’s center plane;
  • The propeller accelerates the flow in the vicinity of the rudder blades and the top dead center position of the propeller where the high wake zone (or wake shadow) is observed, as in the case of a conventional rudder;
  • Larger transverse flow and, hence, the lift on the rudder blades are generated by the propeller’s action which increases the thrust of the GRS.
The difference in the flow field between the model and full scale depends on the model size. If the model length (LM) is not large enough (i.e., LM < 12 m), the flow around the gate rudder blades has the possibility of being laminar and even developing a laminar flow separation because of their locations and that of the large thickness to chord ratio for the rudder blades. This is expected to result in the scale effect for the gate rudder blades. In fact, the scale effect of the rudder drag should be considered not only for the gate rudder but also for the conventional rudder. However, one can only appreciate the difference clearly if the comparisons of the flow characteristics are made based on the real case [5].

2.2. Drag Coefficients in Model and Full Scale

The resistance of a rudder blade, FRX, and the side force (lift), FRY, can be represented by Equations (1) and (2) as follows:
F R X = F R D cos ( α ) F R L sin ( α )
F R Y = F R D sin ( α ) + F R L cos ( α )
where, FRD and FRL is the contribution from the rudder drag and the rudder lift, respectively and α is the angle of attack of the rudder wing section to the flow. FRL is negligibly small for the conventional rudder case except for the condition behind a rotating propeller.
FRD can be predicted by the empirical formula given by Equation (3) when the flow velocity and rudder geometry is given.
F R D = 1 2 ρ 0 H V o ( z ) 2 C F ( z ) ( 1 + t ( z ) c ( z ) + ( t ( z ) c ( z ) ) 2 )
where Vo and CF are the local flow velocity and frictional resistance coefficient, respectively, corresponding to flow direction and flow characteristics (laminar or turbulent, etc.) at z position and t/c is the thickness-chord ratio in the same position.
Here, the drag coefficient of a rudder can be represented by Equation (4) using ship speed and rudder area S R .
C R D = F R D 1 2 ρ V S 2 S R
It should also be noted that each of the resistance components obeys a different set of scaling laws and the problem of scaling can become more complicated because of the interaction between these components. Therefore, we explore the scale effect of the rudder drag by using data belonging to the gate rudder system of the Shigenobu, as described in the following:
Using Equation (3) the rudder drag was calculated for the gate rudder and the conventional rudder and results are presented as a comparison in Table 2 and Table 3 for the model and full scale, respectively. The comparative results are also presented in Figure 5. The values in Figure 5 and Table 2 and Table 3 are nondimensionalized by the measured ship resistance. To avoid confusion, it should be highlighted that the resultant rudder drag is different from these figures for the GRS because of the lift force acting on the rudder blades. The thrust (i.e., negative resistance) of gate rudder is quite often seen, even in the towing condition.
As shown in Table 2 and Table 3 and Figure 5, it is evident that the drag components of the two rudder cases are somewhat contrasting; the model scale drag of the gate rudder is six to eight times that of the conventional rudder, and both rudder drag components are decreased in full scale by a factor of one-third to one-quarter. Therefore, the scale effect of the gate rudder is relatively more significant as compared with that of the conventional rudder and the difference between the model and full-scale drag components of the gate rudder is 3.6% (5.3% minus 1.7%) of the ship resistance while it is only 0.6% (0.8% minus 0.2%) for the conventional rudder case. It is rather fortunate that the difference is six times, thanks to the flow speed difference around the rudder blades at each towing condition.

2.3. Rudder Drag Correction for the Scale Effect

As explained in Section 2.2, rudder drag cannot be measured directly during the resistance test of a hull with the gate rudder. This is because the blades of the gate rudder produce the lift force, and hence compensate for the rudder drag while a conventional rudder is simply a drag source contributing to the ship resistance. However, if we can measure the two rudder force components, FRX and FRY, in the ship fixed coordinate system, we can configure the rudder drag and lift components based on several assumptions within the wing theory. Hence, one can describe the lift coefficient as follows:
C L = κ ( α + α g )
where CL is the lift coefficient, α and α g are attack angle and zero lift angle, respectively, and κ is the lift slope correction factor.
However, the rudder drag coefficient, CRD, and angle of attack, α, can be estimated by the following equations;
C R D = F Y C L   [ 1 ( α + α g ) 2   ] 0.5 α + α g
α = ( κ + F X ) ( κ + F X ) 2 + 2 F Y 2 F Y α g  
where, F X and F Y is nondimensional rudder force of FRX and FRY, respectively and given by Equations (8) and (9) as follows:
F X = F R X 1 2 ρ V S 2 S R
F Y = F R Y 1 2 ρ V S 2 S R
We can observe a positive flow angle, α, for every kind of vessel when the rudder blades are off-centered, as sketched in Figure 6.
The lift slope correction factor, κ, can be expressed by Equation (10) as follows:
κ = ε 6.13 λ 2.25 + λ
where λ is the aspect of ratio, ε is the effect of low Reynolds number on the lift slope which will be explained in Section 2.4. CL and CD can be obtained from the measured FX and FY during the resistance test directly.
If we can express the rudder drag coefficient by Equation (11) which is combined with the drag coefficient CRD0 explained earlier:
C R D = C R D 0 + δ C R D
where δCRD represents the additional resistance due to the rudder stock. Conservatively, we can use this additional resistance component without correction (i.e., no scale effect) such as wave resistance. Hence the effect on the rudder resistance:
δ F R X = 1 2 ρ V S 2 δ C R D 0 S R c o s α
δ C R D 0 = C R D 0 S C R D 0 M
Figure 7 shows the difference between the obtained CRD and calculated CRD0 (model). The δCRD0 is less than 1% of the total hull resistance, and the effect of this additional uncertain resistance on the full-scale performance is not as significant based on this figure.

2.4. Rudder Lift Correction for the Scale Effect

The lift coefficient of the gate rudder is also influenced by the model scale effect, and hence requires correction of the model test data. For this correction, the wind tunnel test data of NACA0012 section in low Reynolds numbers with the nonlinear lift slope curves are used, as shown in Figure 8 from McCormick (1995) [8].
From Figure 8, the lift coefficient of the full-scale rudder (CLS) can be estimated by using Equation (14) in conjunction with Equations (5) and (10) as follows:
ε = 1.470 X M 3 3.109 X M 2 + 2.376 X M + 1.036 1.470 X S 3 3.109 X S 2 + 2.376 X S + 1.036
if RNS > 8 × 10⁶, XS = 8 × 10⁶
where
X M = R N M × 10 7 X S = R N S × 10 7
Figure 9 also shows the Reynolds number effect on the lift coefficients of other typical NACA wing sections presented by the same study [8].
In order to show the significance of the resultant forces acting on the rudder in the model and full scale, which are evaluated earlier, Figure 10 is included. As shown in Figure 10, the effects of the rudder drag and lift correction on the gate rudder performance are rather significant, and therefore this phenomena explains the discrepancy between the model test and the full-scale results. In the Shigenobu case, two rudder blades seem to be generating a thrust of almost more than 10%. Therefore, the earlier derived two corrections are essential to assess the actual performance of the gate rudder system, which need to be implemented in the powering performance prediction and is discussed in Section 4.

3. Verification of Scale Effect Correction by Model Tests

In this section, the earlier proposed scale effect correction procedure is verified by the lift and drag coefficients of the gate rudder blades for two cargo ship models of different scales (2.0 m and 6.18 m long models). The verification is based on the data obtained from the resistance and self-propulsion tests of these models. Table 4 shows the principal dimensions of the cargo ship and its model size, and Figure 11 shows one of the models (6.18 m). Here, Lpp is the length between perpendiculars (m), B is the beam (m), d is the draft (m), and DP is the propeller diameter (m). Table 5 presents the test conditions of the two models.
From the model tests conducted, as shown in Table 5, the following verification data can be obtained:
(1)
Scale effect on the rudder drag and lift during towing conditions;
(2)
Scale effect on the rudder drag and lift during self-propelled conditions;
(3)
Scale effect on the rudder normal force during steering conditions.
The verification data were calculated and are presented in Figure 12 in terms of the nondimensional drag and lift coefficients, (i.e., CDR and CL) of the rudders, as described earlier, using Equations (11) and (5), respectively. As shown in Figure 12, the proposed procedure shows good agreement with the two different scale model test data.

4. Enhanced Procedure for Powering Performance Prediction

Having established the scale-effect correction procedure in Section 2 and verified it with the model test data as described in Section 3, these corrections are introduced in the analysis of the resistance and self-propulsion test data to predict the powering performance of a ship with the gate rudder system in full scale as described in the following sections.

4.1. Effective Power

The effective horsepower (EHP) of a ship can be calculated based on the improved total resistance of the model by taking into account the scale effect correction on the rudder drag and rudder lift coefficients. Hence,
E H P = R T S   V S
R T S = C T S 0.5 ρ V S 2 S
where C T S is the total resistance coefficient of the ship and is estimated based on the total model resistance coefficient according to the standard procedure, such as a recommended by the ITTC standard procedure.
Now, the total model resistance coefficient can be represented as:
C T M = R T M + δ F R D cos α + δ F R L s i n α 0.5 ρ V 2 S R

4.2. Thrust Deduction Factor
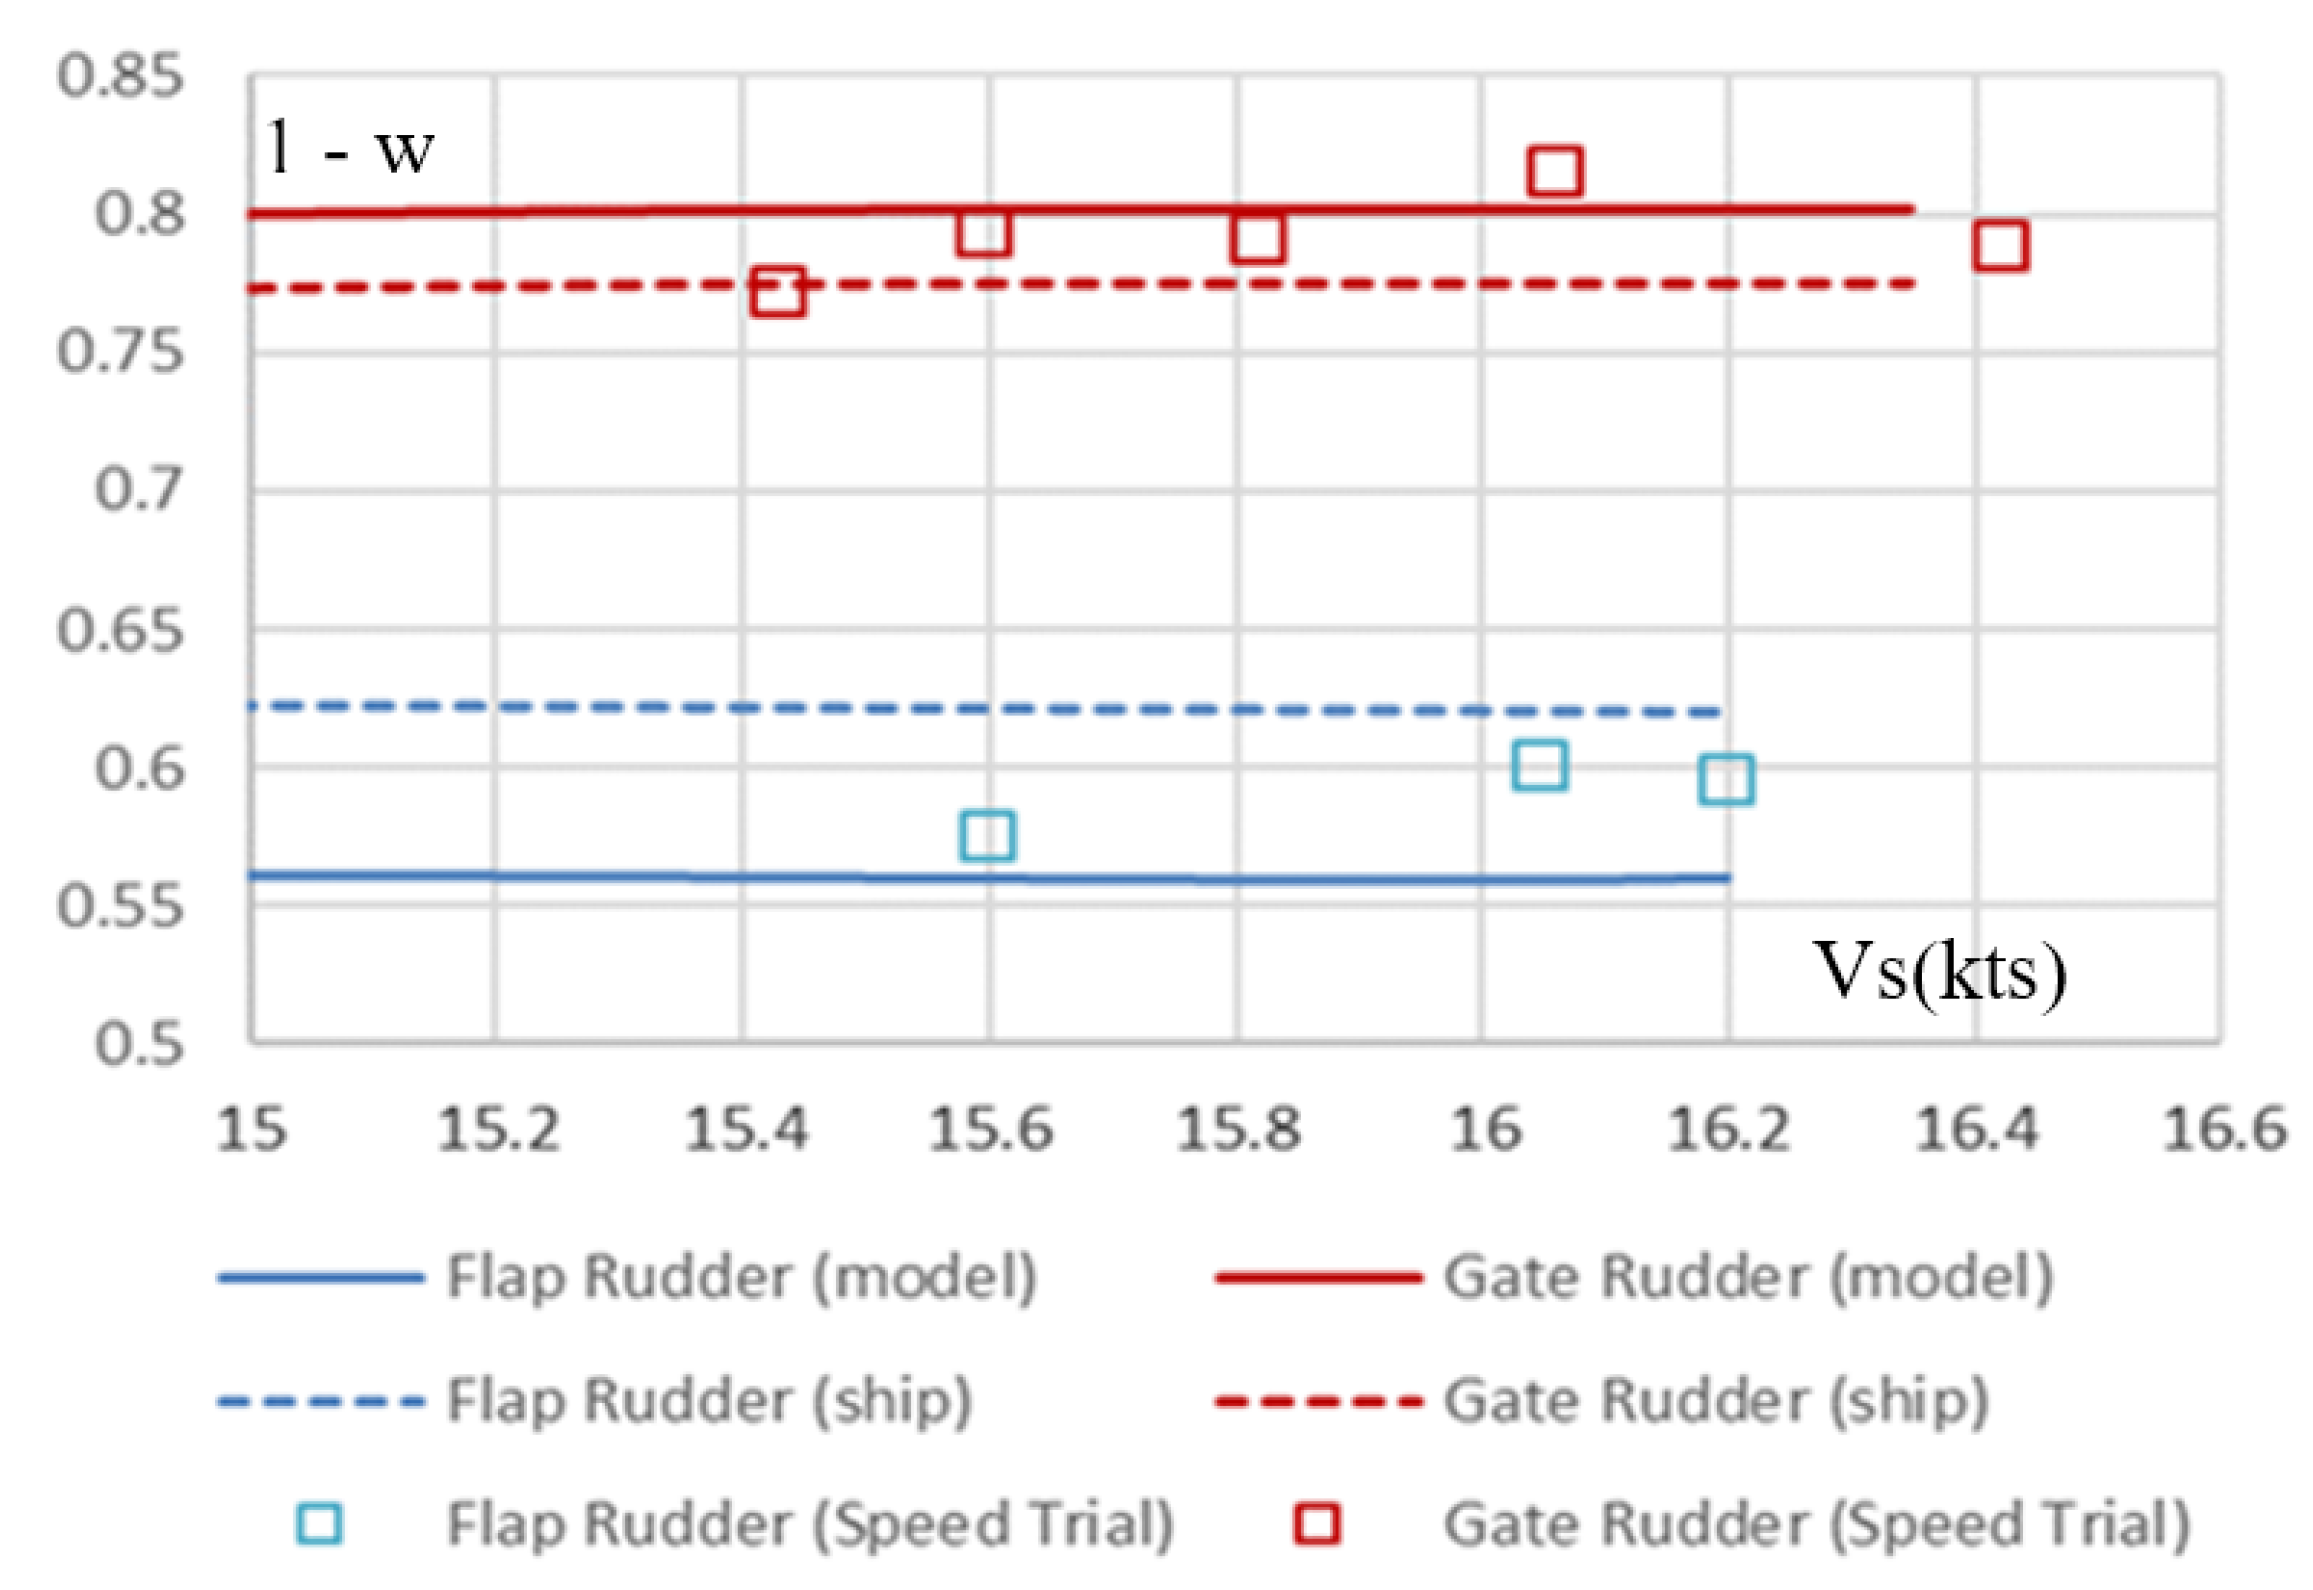
The scale effect correction on the thrust deduction factor to be obtained from the self-propulsion tests can be included by introducing the drag and lift correction on the rudder blades, as described in Section 2.3 and Section 2.4, and implemented in Equation (18):
1 t =   R T M F T + δ F R D cos α + δ F R L s i n α

4.3. Effective Wake

The effective wake of the GRS is the most difficult item to analyze since the propeller advance speed is also accelerated by the gate rudder blades and this effect is not be considered as an integral part of the effective wake, since the effective wake, by definition, is originated from the boundary layer deformation due to a propeller’s suction effect as the function of the propeller’s thrust. Therefore, the actual effective wake of the GRS is less than that of a conventional rudder system because the propeller thrust is smaller than that of the conventional configuration.
Bearing in mind the above fact, to define the wake fraction of the gate rudder system, we need the mean flow speed at the propeller plane that can be represented in the nondimensional form, v P ,   at the propeller plane of the gate rudder system, as in Equation (19):
v P = C 1 v A 0 + v i n P + v i n R
where v A 0 , v i n P   and   v i n R are the propeller advance speed of the conventional rudder case, the propeller self-induced velocity, and the rudder induced velocity, respectively.
C 1 is a correction factor of the wake variation to account for the difference in the propeller diameter and the position and recommended value for this C 1 is <1.0 because of the smaller propeller diameter, and hence the resulting thrust of the gate rudder propeller as compared with the conventional type.
Then, the wake fraction for the gate rudder can be written as follows:
w G R = C 1 ( w 0 0.04 ) + w i n R
where, w i n R is the rudder induced wake, as described earlier and its mean value can be estimated by the following formula:
w i n R = C 2 C T + w 0 R
where C2 is the correction factor for the thrust loading.
In Figure 13, a schematic representation of the scale effect for the gate rudder system is represented in comparison with the conventional rudder case. As shown in this figure, the dotted line presents the scale effect of a conventional rudder case, whereas the solid line shows the gate rudder case, respectively. One should also note in Figure 13 that, while point A’ can be predicted from point A by using the ITTC recommended procedure, point B’ cannot be predicted from point B which can be sometimes smaller, as shown in Figure 9, since point B’ does not follow the same principle.
Having represented the effective wake for the gate rudder system, Figure 14 is included to present the analysis results for Shigenobu (with GRS) and Sakura (with CRS-flap rudder) based on their respective sea trials and including the predicted results using the earlier described scale effects correction procedure.

4.4. Powering Performance Prediction

In order to present an enhanced procedure for the powering performance prediction of a ship with the GRS, including the earlier described scale effect corrections, an algorithm is presented in Figure 15 in terms of a flow chart.
Finally, the above-described procedure is applied to predict powering performance of the Shigenobu (GRS), and results are shown in Figure 16 as compared with the prediction results for the Sakura (CRS) and including the trials data for both ships [9]. As one can see in Figure 16, the predicted power for Shigenobu is in excellent agreement with the trials data and, hence, justify the scale effect corrections applied on the gate rudder drag and lift characteristics.
It should be noted that the full-scale effective wake is estimated from the model test, and the same figures are used for the power prediction (weS = weM).

5. Conclusions

This study explored the scaling effect issues associated with the powering performance prediction of a ship fitted with a gate rudder system (GRS). The study aimed to take a further step towards a realistic estimation of the powering performance of ships with a GRS. The study focused on the corrections for the scale effects, which were believed to be associated with the drag and lift characteristics of the gate rudder blades due to the low Reynolds number experienced in model tests combined with the unique arrangement of this rudder and propulsion system. On the basis of the appropriate semi-empirical approaches and supporting model test and full-scale data, the study verified the scale effect phenomenon and presented the associated correction procedure. Together with this, the study also presented an enhanced procedure for the powering performance prediction of a ship driven by a gate rudder system implementing the proposed scale effect correction.
On the basis of the above, the following conclusions are obtained:
  • Scale effect of a gate rudder system can be considerably more significant than that of the conventional rudder system because of the unique arrangement of the gate rudder system behind the stern;
  • Flow characteristics around a gate rudder system in model scale can be laminar due to the low Reynolds numbers experienced, hence, the drag and lift coefficients of the gate rudder blades are strongly affected by this unfavorable scale effect;
  • The analysis presented in this study based on the semi-empirical procedure and the supporting data for two different models and full-scale ships clearly showed this scale effect and how to make corrections for the drag and lift coefficients of the gate rudder blades based on the verifications with the model test data;
  • The scale effect of the wake of a ship with a gate rudder system is not the same as that of a ship with a conventional rudder. The measured propeller advanced speed, based on the thrust identity, should be divided into two components, and the different scaling methods should be applied to each component;
  • An enhanced powering performance procedure which takes into account the subject scale effects presented in this study demonstrates excellent agreement with the full-scale trials data. This justifies the scale effect claim on the gate rudder drag and lift characteristics, and associated correction procedure, as well as the proposed enhanced methodology for the powering performance prediction.
This study focused on a rapid and practical solution to the powering problem associated with a gate rudder system. However, this study would greatly benefit from further in-depth studies involving CFD, systematic model tests, and full-scale trials which are underway with the increasing applications of this new attractive energy-saving device, Tacar et al. (2019) [10].

Author Contributions

N.S. conducted the study; S.K. introduced the original gate rudder conceptualization; M.F. contributed to the application and validation of the conceptualization; M.A. contributed further advancement of the concept, review, and editing. All authors have read and agreed to the published version of the manuscript.

Funding

In this paper, the Shigenobu full-scale data was obtained from a research project supported by the Nippon Foundation, whereas, the model test data of the cargo ship was obtained from another research project supported by the subsidy for a demonstration project for energy efficiency in commercial transport sector introduced by the Ministry of Economy, Trade and Industry of Japan.

Conflicts of Interest

The authors declare no conflict of interests.

References

  1. Sasaki, N.; Atlar, M.; Kuribayashi, S. Advantage of twin rudder system with asymmetric wing section aside a propeller. J. Mar. Sci. Technol. 2015, 21, 297. [Google Scholar] [CrossRef] [Green Version]
  2. The Naval Architect. New Ducted Design Is a Boon for Propulsive Efficiency; July/August issue; The Naval Architect, RINA: London, UK, 2019; pp. 32–36. [Google Scholar]
  3. The Motorship. New Ducted Propeller Design Offers Fuel Savings; The Motorship: Fareham, UK, 2019; pp. 1–5. Available online: https://www.motorship.com/news101/ships-and-shipyards/new-ducted-propeller-design-offers-fuel-savings (accessed on 18 August 2019).
  4. Sasaki, N.; Kuribayashi, S.; Atlar, M. GATE RUDDER®. In Proceedings of the 3rd International Symposium on Naval Architecture and Maritime (INT-NAM), Istanbul, Turkey, 24–25 April 2018. [Google Scholar]
  5. Sasaki, N.; Kuribayashi, S.; Asaumi, N.; Fukazawa, M.; Nonaka, T.; Turkmen, S.; Atlar, M. Measurements and calculations of Gate rudder performance. In Proceedings of the 5th International Conference on Advanced Model Measurement Technology for Maritime Industry, AMT’17, Strathclyde University, Glasgow, UK, 11–13 October 2017. [Google Scholar]
  6. Sasaki, N.; Atlar, M. Scale effect of gate rudder. In Proceedings of the Sixth International Symposium on Marine Propulsors, SMP’19, Rome, Italy, 26–30 May 2019. [Google Scholar]
  7. Yazaki, A. A diagram to estimate the wake fraction for an actual ship from model tank test. In Proceedings of the 12th International Towing Tank Conference, Rome, Italy, 22–30 September 1969; p. 259. [Google Scholar]
  8. McCormick, B.W. Aerodynamics, Aeronautics, and Flight Mechanics, 2nd ed.; John Wiley & Sons. Inc.: Hoboken, NJ, USA, 1995. [Google Scholar]
  9. Fukazawa, M.; Turkmen, S.; Marino, A.; Sasaki, N. Full-Scale GATE RUDDER Performance obtained from Voyage Data. In Proceedings of the A. Yücel Odabaşı Colloquium Series: 3rd International Meeting-Progress in Propeller Cavitation and Its Consequences: Experimental and Computational Methods for Predictions, Istanbul, Turkey, 15–16 November 2018. [Google Scholar]
  10. Tacar, Z.; Sasaki, N.; Atlar, M.; Korkut, E. Investigation of scale effects on Gate Rudder Performance. In Proceedings of the 6th International Conference on Advanced Model Measurement Technology for Maritime Industry, AMT’19, University of Rome, La Sapienza, Italy, 9–11 October 2019. [Google Scholar]
Figure 1. (a) Gate rudder system (GRS) on coastal container ship “Shigenobu.” and (b) conventional flap-rudder system (CRS) on sister container ship “Sakura.”.
Jmse 08 00043 g001
Figure 2. Kort nozzle (a), Becker Mewis Duct (b), and gate rudder system (c).
Jmse 08 00043 g002
Figure 3. Powering performance comparisons of two sister ships, one with a gate rudder system and the other with a conventional flap-rudder system: In trials (a) and in-service (b).
Jmse 08 00043 g003
Figure 4. In-service fuel consumption comparisons of two sister ships, Shigenobu with GRS (red) and Sakura with CRS (blue).
Jmse 08 00043 g004
Figure 5. Rudder drag in % of ship resistance for model (a) and full scale (b).
Jmse 08 00043 g005
Figure 6. Rudder forces originated from lift and drag.
Jmse 08 00043 g006
Figure 7. Obtained rudder drag coefficients.
Jmse 08 00043 g007
Figure 8. Effect of low Reynolds number on lift coefficients of typical wing section (NACA24xx series).
Jmse 08 00043 g008
Figure 9. Reynolds number effect on the lift coefficients of typical NACA wing sections.
Jmse 08 00043 g009
Figure 10. Effect of rudder drag and lift correction on rudder resultant force (model point case) to ship resistance.
Jmse 08 00043 g010
Figure 11. Large (6.18 m) ship model tested in 400 m towing tank.
Jmse 08 00043 g011
Figure 12. Gate rudder blades drag coefficient, CDR, (top) and lift coefficient, CL, (bottom) obtained with two different size models.
Jmse 08 00043 g012
Figure 13. Schematic diagram of the scale effect of the wake of a gate rudder propulsion system.
Jmse 08 00043 g013
Figure 14. Effect of drag and lift correction on predicted and measured (speed trials) effective wake.
Jmse 08 00043 g014
Figure 15. Algorithm for an enhanced powering performance procedure for a ship driven by a gate rudder system.
Jmse 08 00043 g015
Figure 16. Comparison of trial power predictions for two ships using the ITTC and enhanced method for the gate rudder system.
Jmse 08 00043 g016
Table 1. Principal characteristics of Shigenobu and Sakura.
ParticularsSakuraShigenobu
Length OA (m)111.4
Beam (m)17.8
Draft (m)5.24
Main Engine3309 kW × 220 rpm
RudderFlap rudderGate rudder
DeliveryAugust 2016December 2017
Table 2. Rudder drag calculations (in model scale).
ParametersFlap RudderGate Rudder
SR100%157%
meanV0 (model)0.400.98
CF (model)0.009440.00700
CRD (model)0.00950.0405
% of ship resistance0.85.3
Table 3. Rudder drag calculations (in full scale).
ParametersFlap RudderGate Rudder
SR100%157%
meanV0 (ship)0.401.00
CF (ship)0.002810.0026
CRD (ship)0.00800.0068
% of ship resistance0.21.7
Table 4. Principal dimensions of ship and models.
Cargo Ship Particulars
Lpp (m)69.0
B (m)12.0
d (m)4.11
DP (m)2.3
Model Size (m)6.18/2.00
Table 5. Model tests conducted with two scaled models.
Kind of Test2.0 m Model6.18 m Model
Resistance with rudderwith rudder
Self-propulsionwith rudderwith rudder
Rudder force Izero helmzero helm
Rudder force II−15 deg to +15 deg−9 deg to + deg

