Performance and Effect of Load Mitigation of a Trailing-Edge Flap in a Large-Scale Offshore Wind Turbine

Abstract
:1. Introduction
2. FVW Model and Validation
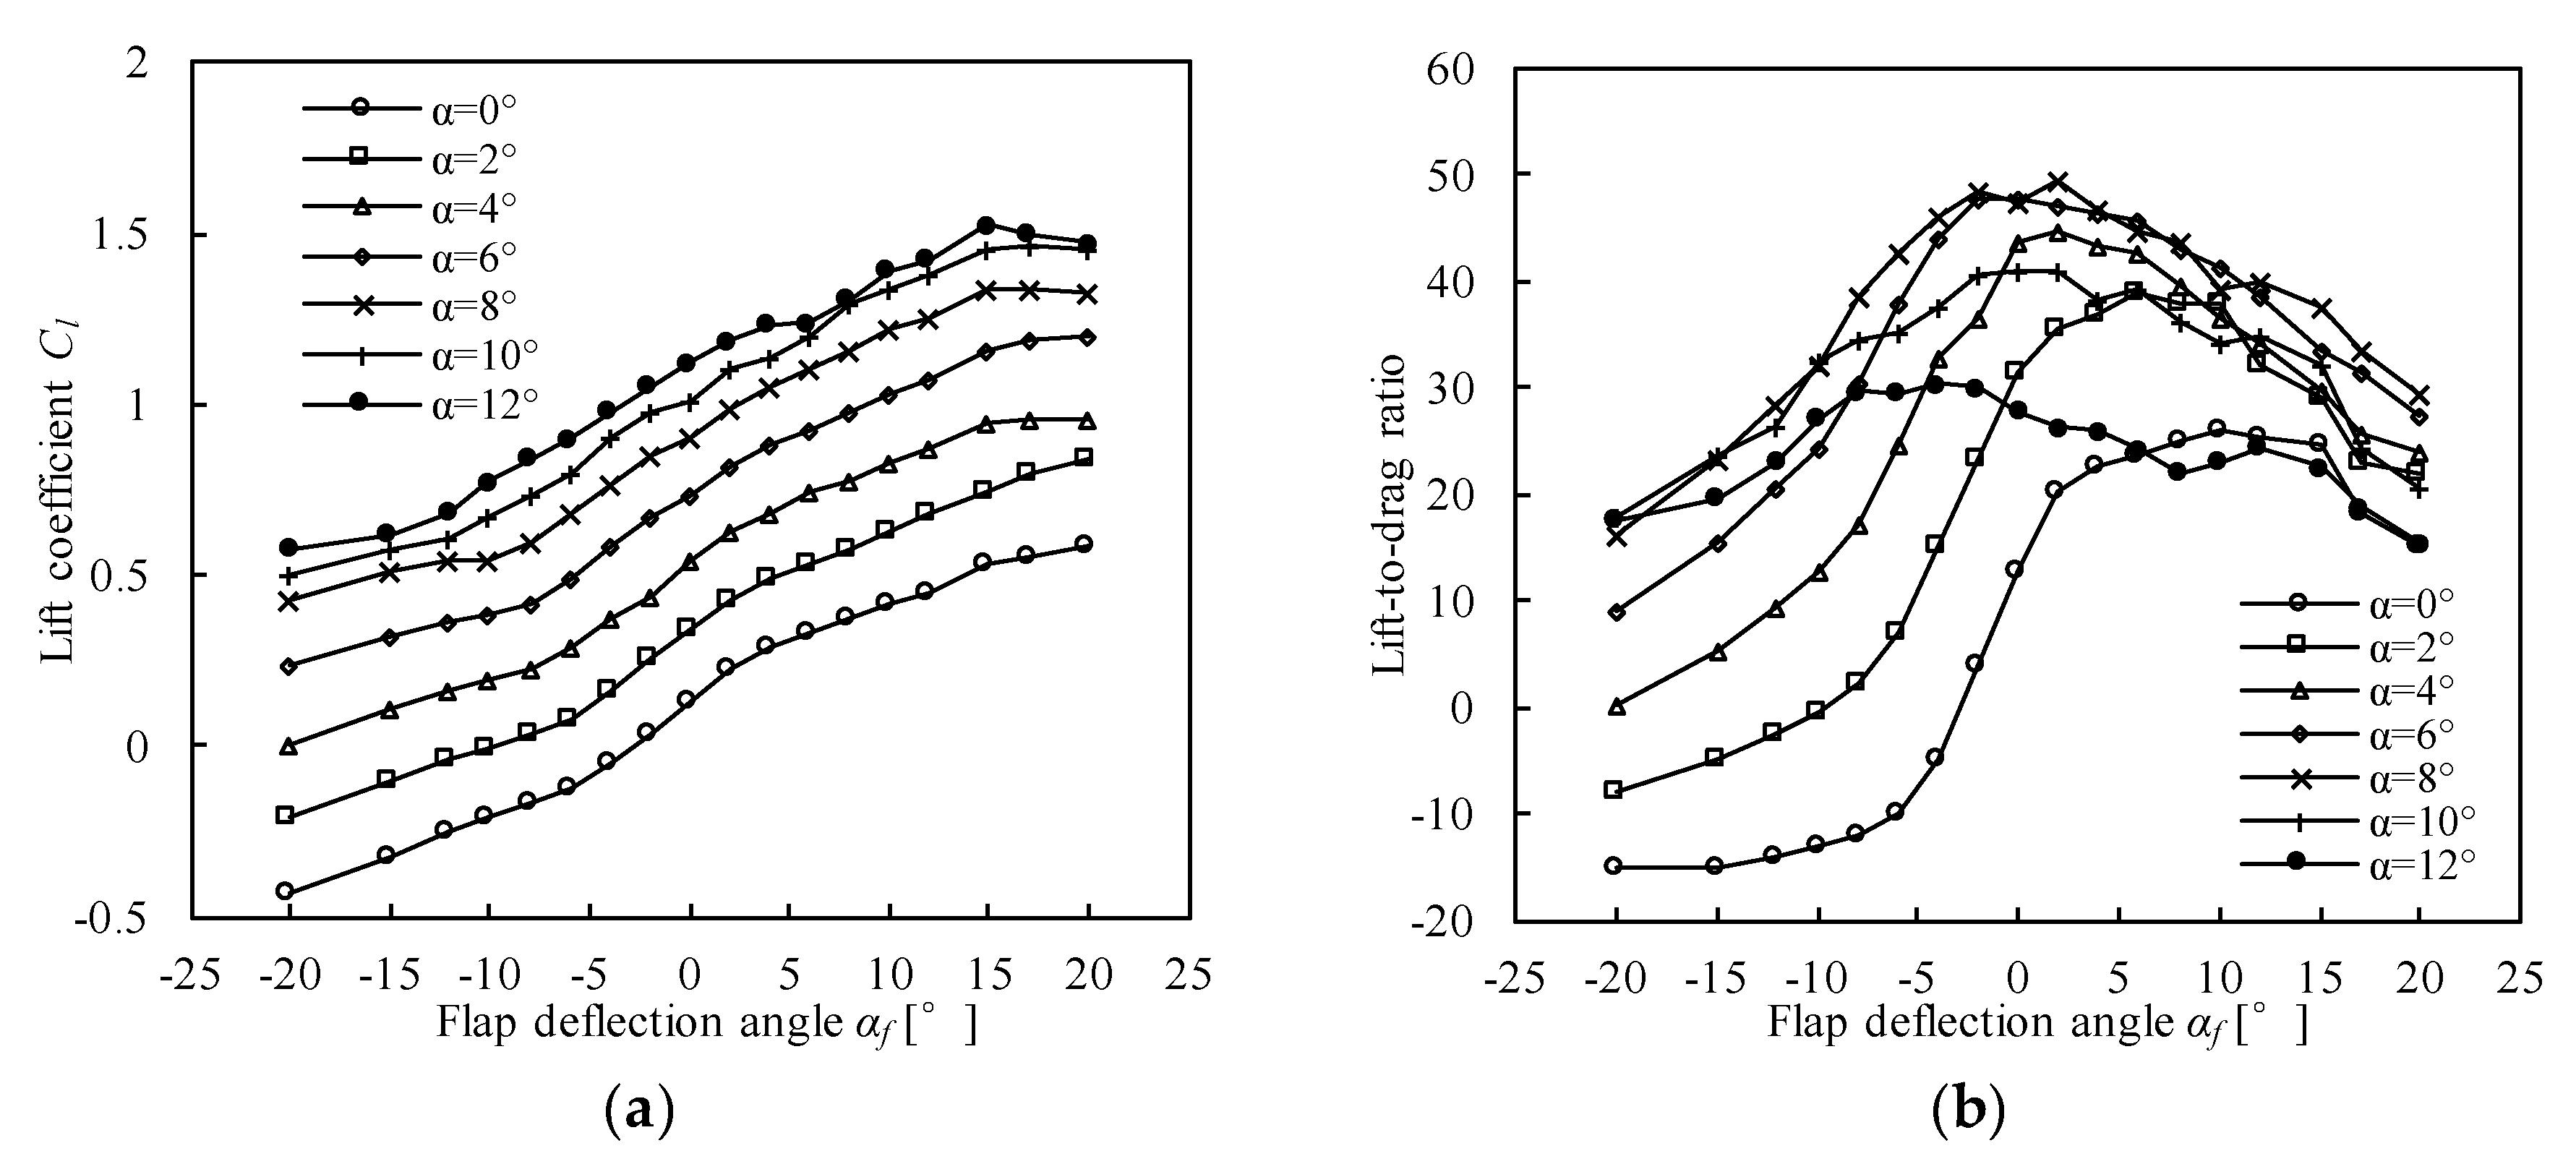
3. Aerodynamic Performance of Trailing-Edge Flap
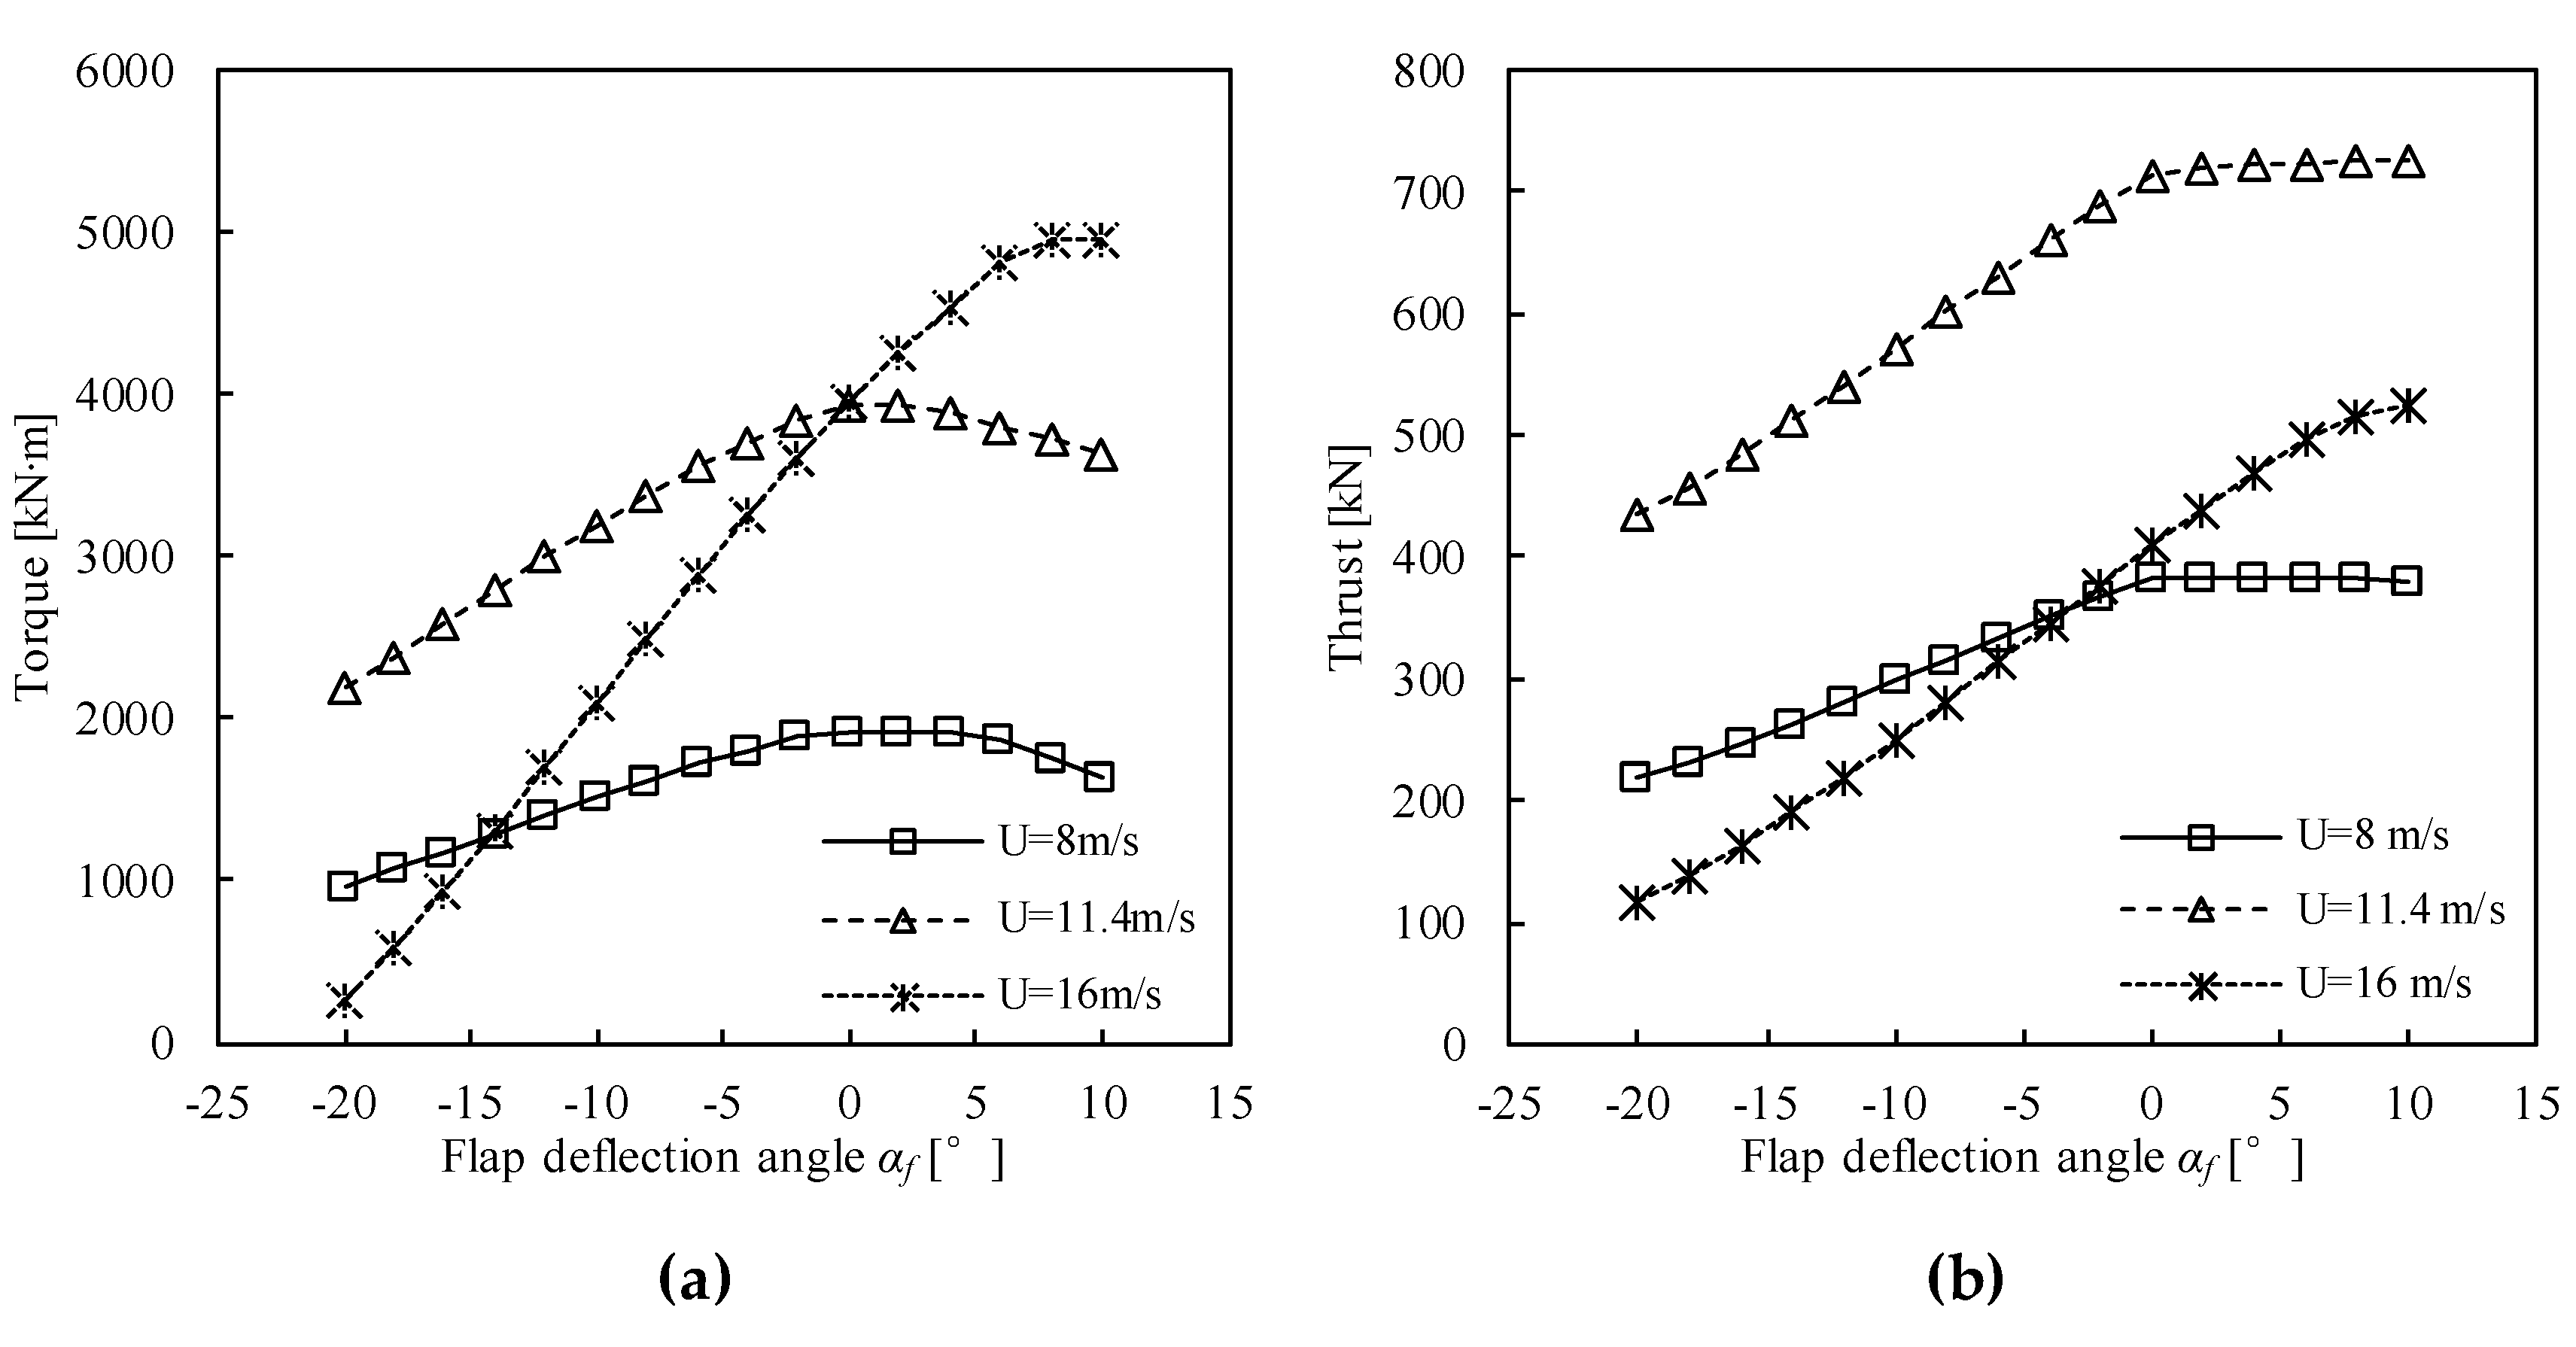
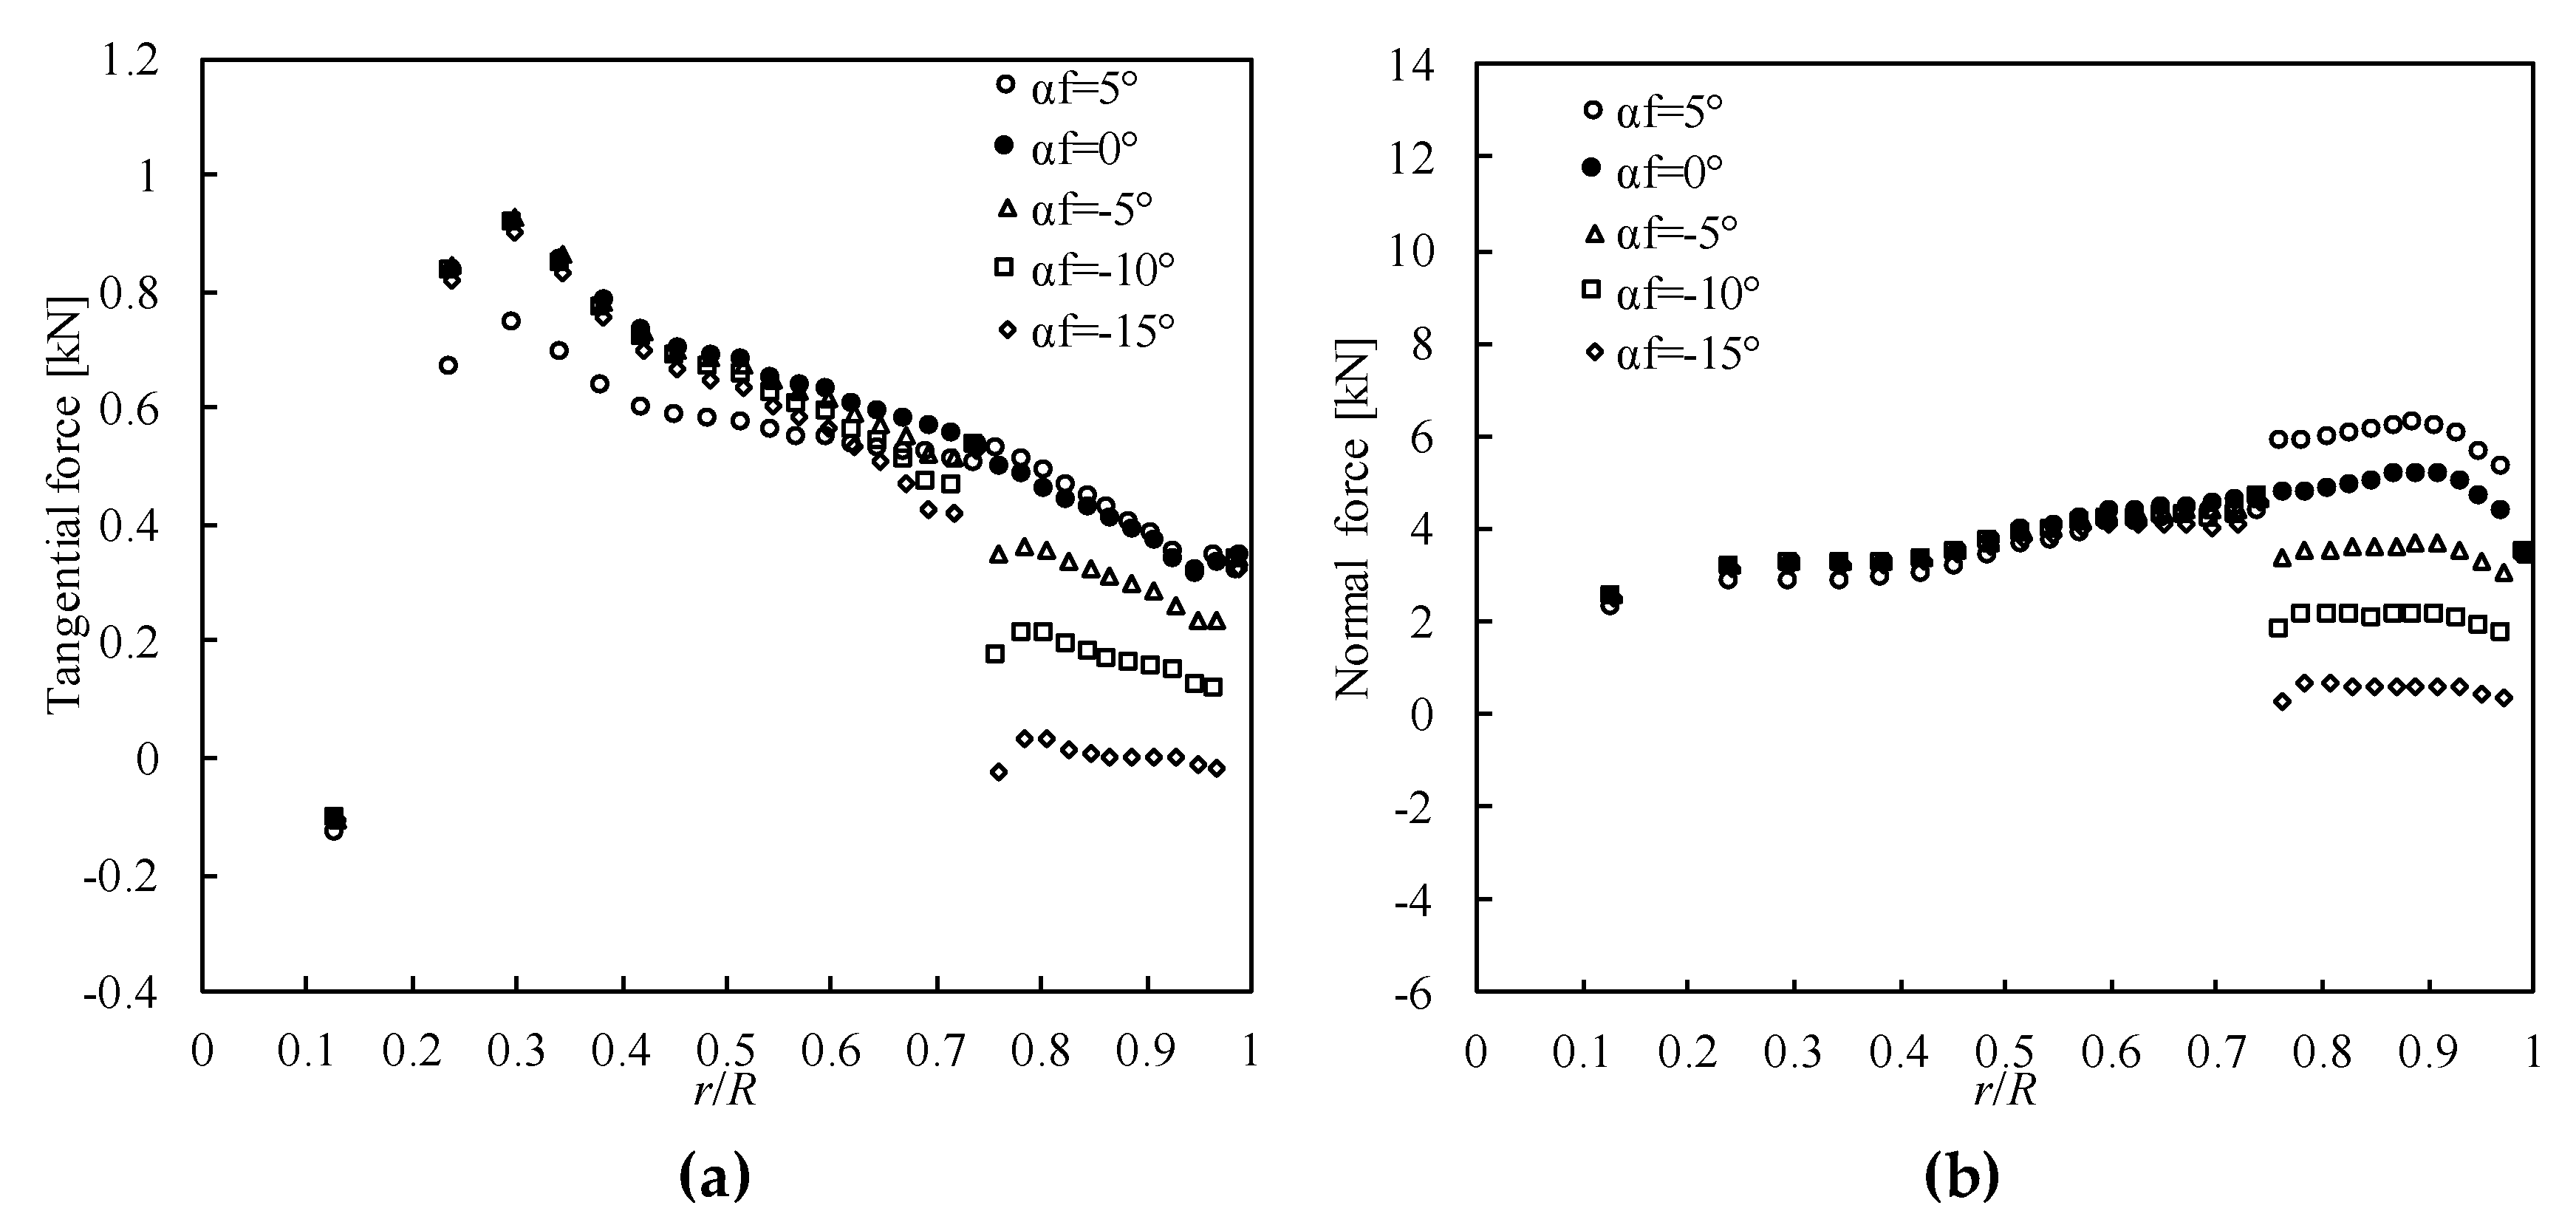
4. Aerodynamic Characteristics of Trailing Flaps at Different Deflection Angles and Wind Speeds
5. Unsteady Wind Conditions
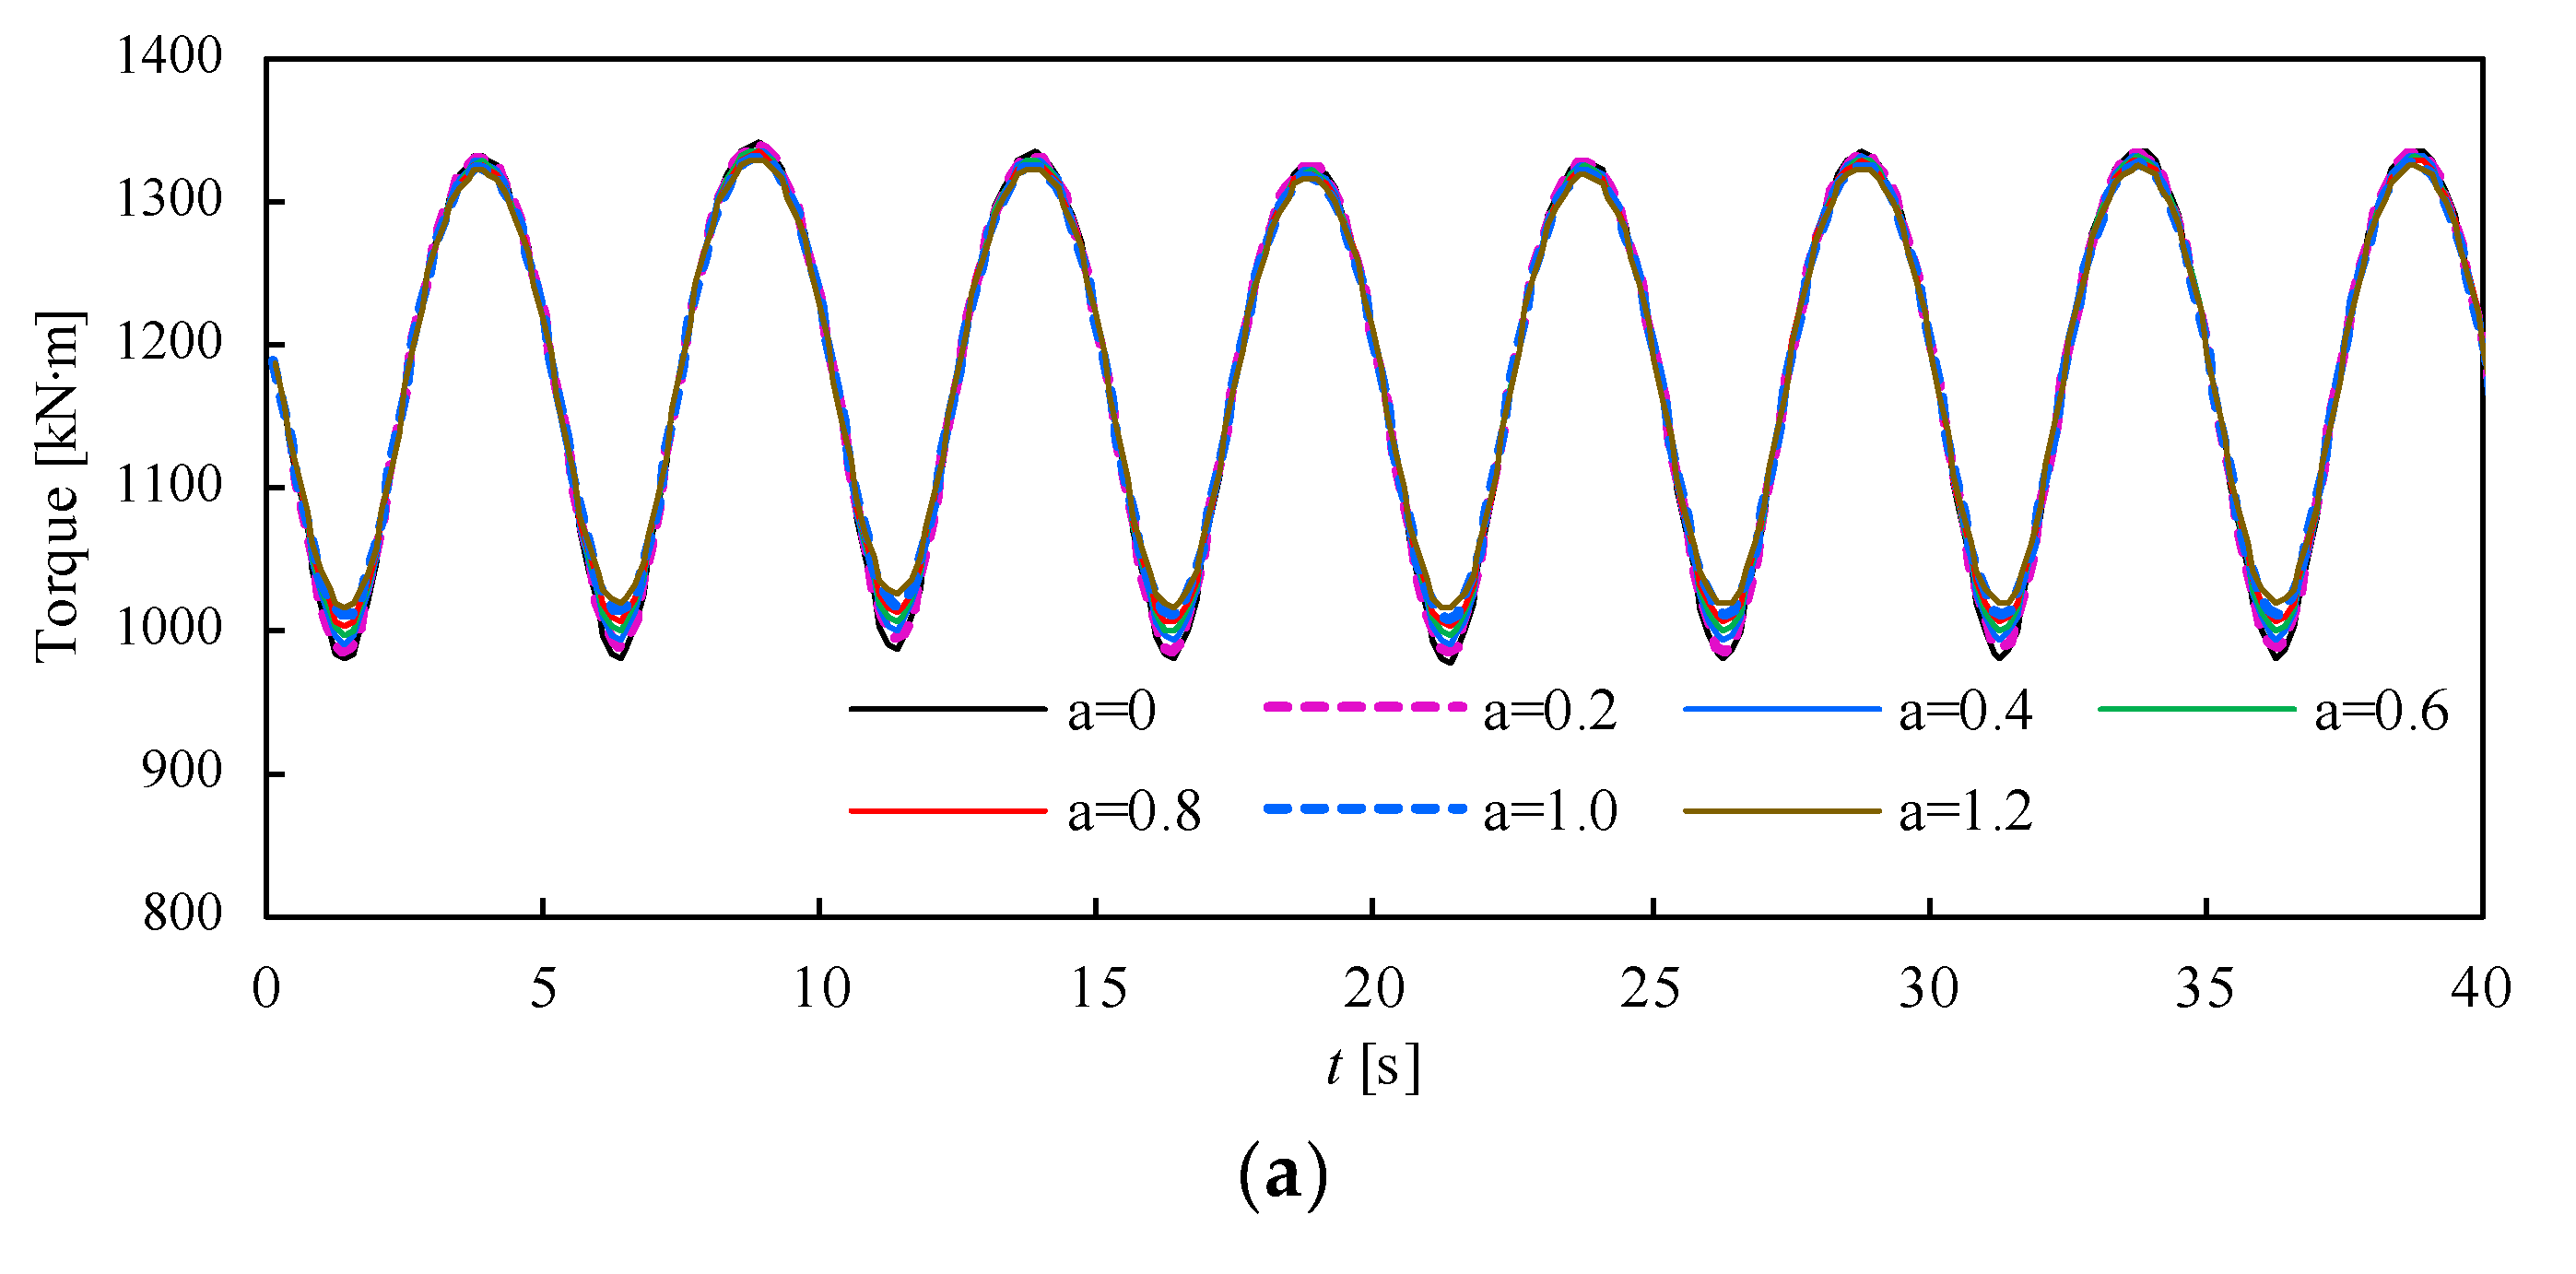
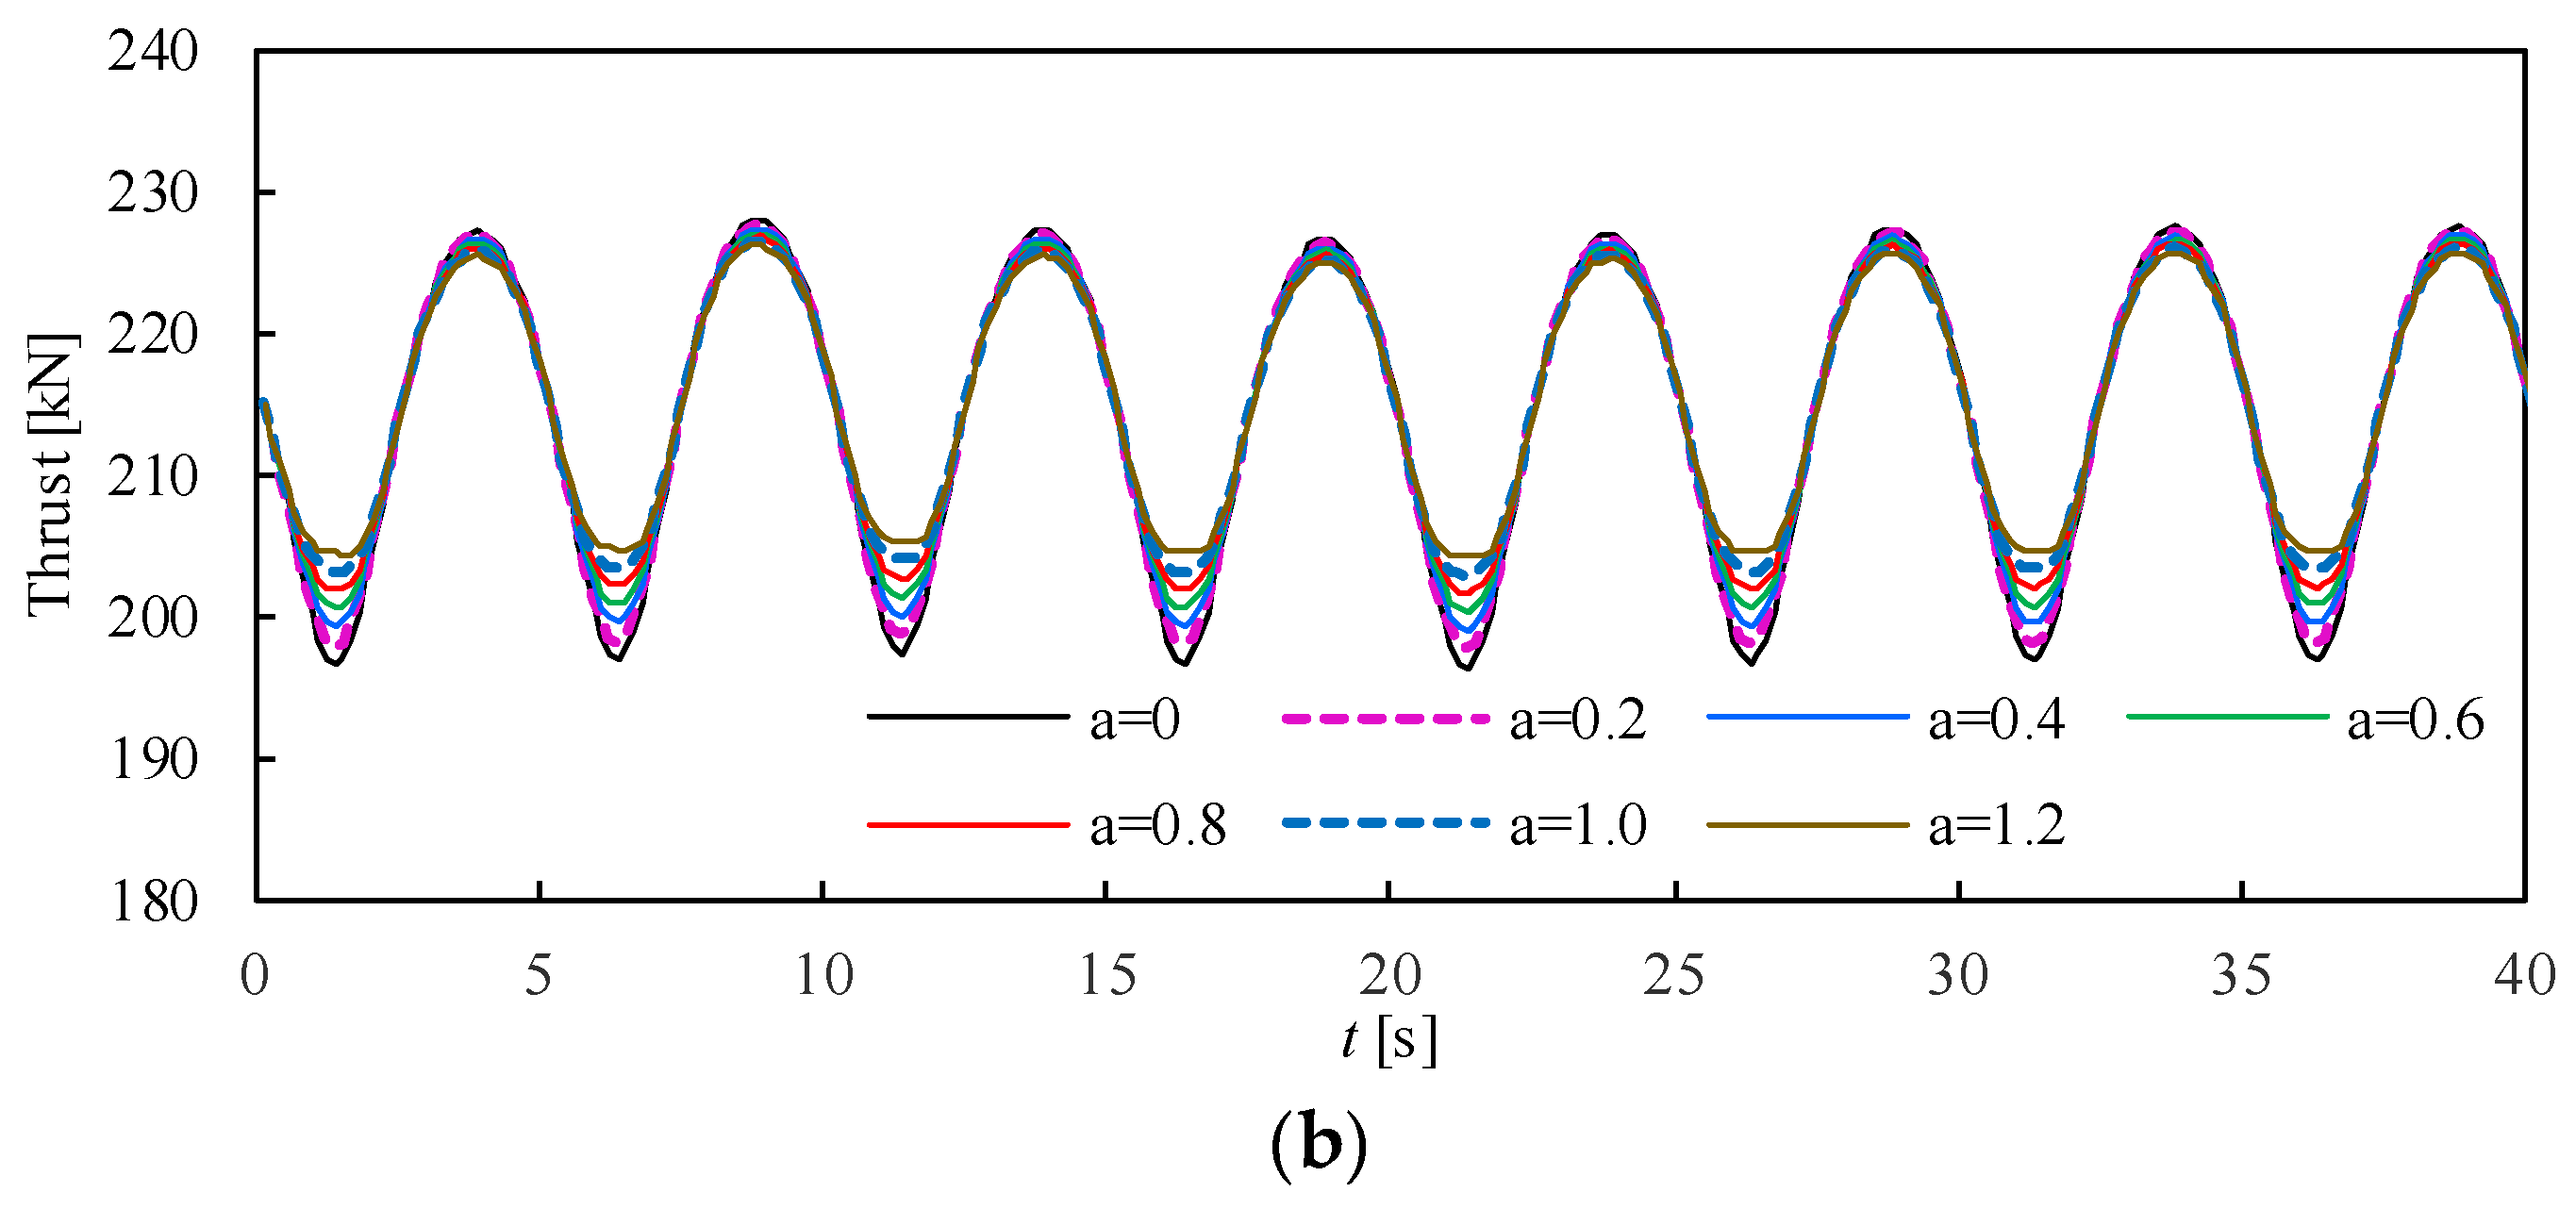
5.1. Wind Shear
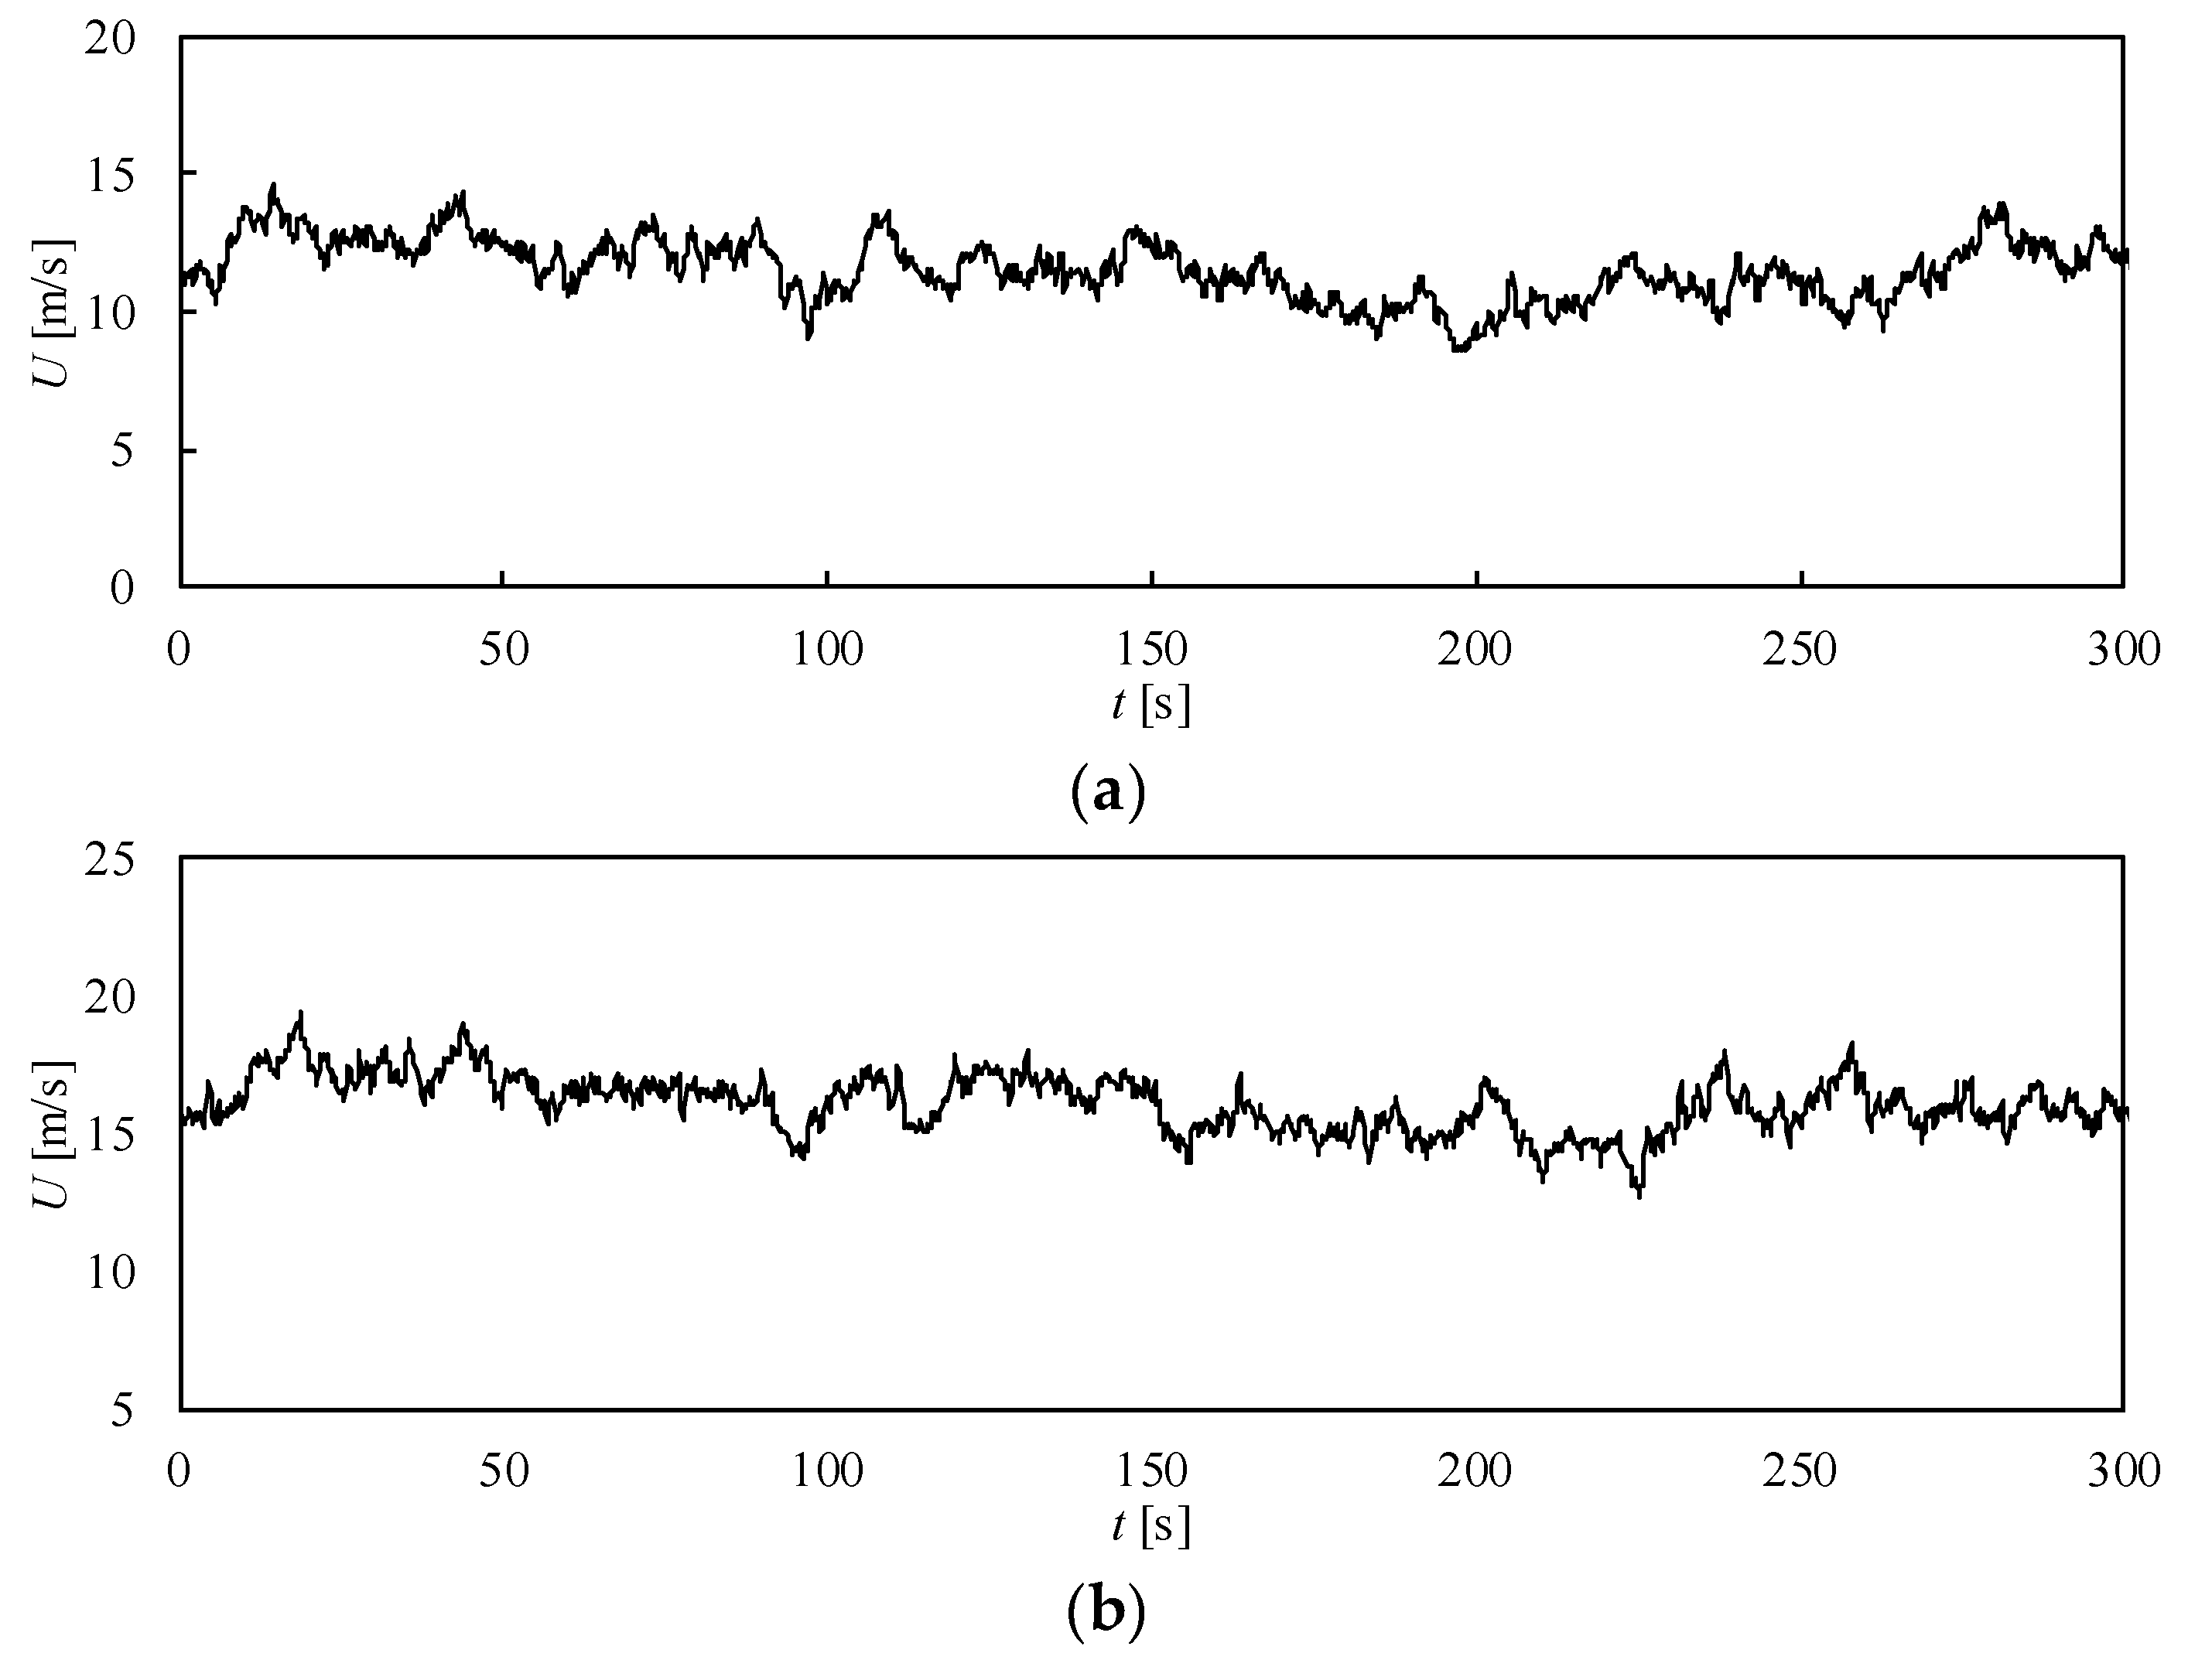
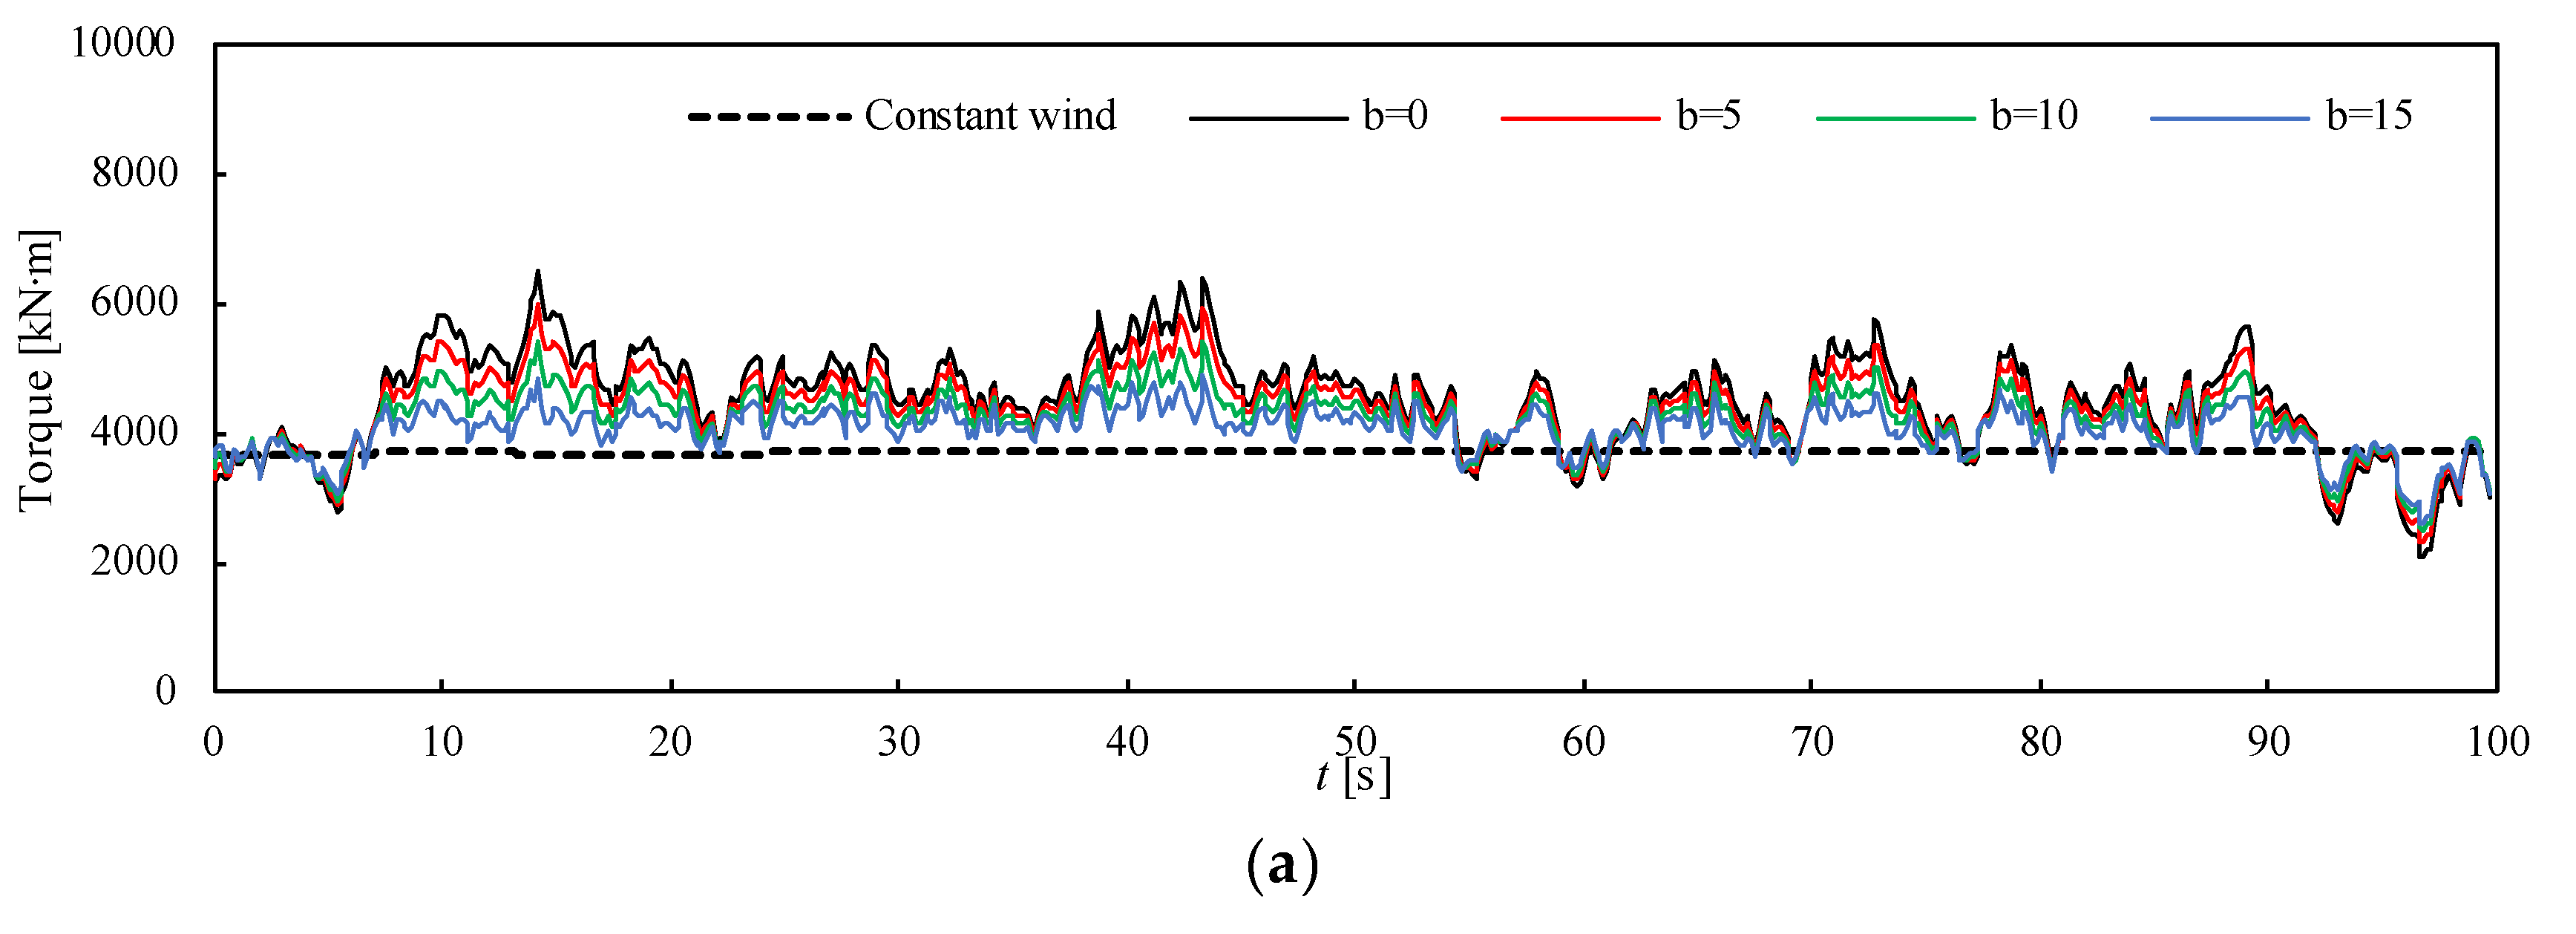
5.2. Turbulent Wind
6. The Trailing-Edge Flap Control Strategy
7. Result and Discussion
7.1. Calculation Results of Wind Shear
7.2. Calculation Results of Turbulent Wind
8. Conclusions
Author Contributions
Funding
Conflicts of Interest
References
- Li, Y.; Le, C.; Ding, H.; Zhang, P.; Zhang, J. Dynamic Response for a Submerged Floating Offshore Wind Turbine with Different Mooring Configurations. J. Mar. Sci. Eng. 2019, 7, 115. [Google Scholar] [CrossRef] [Green Version]
- Loth, E.; Steele, A.; Qin, C.; Ichter, B.; Selig, M.S.; Moriarty, P. Downwind pre-aligned rotors for extreme-scale wind turbines. Wind Energy 2017, 20, 1241–1259. [Google Scholar] [CrossRef]
- Vamsi, I.; Sabareesh, G.R.; Penumakala, P.K. Comparison of condition monitoring techniques is assessing fault severity for a wind turbine gearbox under non-stationary loading. Mech. Syst. Signal Process. 2019, 124, 1–20. [Google Scholar] [CrossRef]
- Barlas, T.K.; van Kuik, G.A.M. Review of state of the art in smart rotor control research for wind turbines. Prog. Aerosp. Sci. 2010, 46, 1–27. [Google Scholar] [CrossRef]
- Li, M.; He, Y.L.; Li, C.W. Study and analysis on collaborated control simulation for the new typed transmission system of wind turbine set. J. Mach. Des. 2008, 25, 36–40. [Google Scholar]
- Cheng, Y.; Xue, Z.; Jiang, T.; Wang, W.; Wang, Y. Numerical simulation on dynamic response of flexible multi-body tower blade coupling in large wind turbine. Energy 2018, 152, 601–612. [Google Scholar] [CrossRef]
- Xia, Y.; Sun, D.Y. Characteristic analysis on a new hydro-mechanical continuously variable transmission system. Mech. Mach. Theory 2018, 126, 457–467. [Google Scholar] [CrossRef]
- Jang, M.H.; Lee, J.H.; Chung, Y.D. A study of a hydraulic torque converter for the offshore wind turbine system. In Proceedings of the International Conference on Electrical Machines and Systems, Busan, Korea, 26–29 October 2013; pp. 2305–2308. [Google Scholar]
- Chopra, I. Review of state of art of smart structures and integrated systems. AIAA J. 2002, 40, 2145–2187. [Google Scholar] [CrossRef]
- Hansen, M.O.; Madsen, H.A. Review paper on wind turbine aerodynamics. J. Fluids Eng. 2011, 133, 114001. [Google Scholar] [CrossRef]
- Chen, H.; Qin, N. Trailing-edge flow control for wind turbine performance and load control. Renew. Energy 2017, 105, 419–435. [Google Scholar] [CrossRef]
- Roget, B.; Chopra, I. Wind-tunnel testing of rotor with individually controlled trailing-edge flaps for vibration reduction. J. Aircr. 2008, 45, 868–879. [Google Scholar] [CrossRef]
- Bak, C.; Gaunaa, M.; Andersen, P.B.; Buhl, T.; Hansen, P.; Clemmensen, K. Wind tunnel test on airfoil Risø-B1-18 with an Active Trailing Edge Flap. Wind Energy 2010, 13, 207–219. [Google Scholar] [CrossRef]
- Lee, T.; Su, Y.Y. Lift enhancement and flow structure of airfoil with joint trailing-edge flap and Gurney flap. Exp. Fluids 2011, 50, 1671–1684. [Google Scholar] [CrossRef]
- Lu, W.S.; Tian, Y.; Liu, P.Q. Aerodynamic optimization and mechanism design of flexible variable camber trailing-edge flap. Chin. J. Aeronaut. 2017, 30, 988–1003. [Google Scholar] [CrossRef]
- Lackner, M.A.; Kuik, G.V. A comparison of smart rotor control approaches using trailing edge flaps and individual pitch control. Wind Energy 2010, 13, 117–134. [Google Scholar] [CrossRef] [Green Version]
- Xu, B.F.; Feng, J.H.; Wang, T.G.; Yuan, Y.; Zhao, Z.Z.; Zhong, W. Trailing-edge flap control for mitigating rotor power fluctuations of a large-scale offshore floating wind turbine under the turbulent wind condition. Entropy 2018, 20, 676. [Google Scholar] [CrossRef] [Green Version]
- Xu, B.F.; Wang, T.G.; Yuan, Y.; Cao, J.F. Unsteady aerodynamic analysis for offshore floating wind turbines under different wind conditions. Philos. Trans. R. Soc. A Math. Phys. Eng. Sci. 2015, 373. [Google Scholar] [CrossRef]
- Sabale, A.; Gopal, N. Nonlinear aeroelastic analysis of large wind turbines under turbulent wind conditions. AIAA J. 2019, 57, 4416–4432. [Google Scholar] [CrossRef]
- Weissinger, J. The lift distribution of swept-back wings. In Technical Report NACA-TM-1120; National Advisory Committee for Aeronautics: Washington, DC, USA, 1947. [Google Scholar]
- Xu, B.F.; Wang, T.G.; Yuan, Y.; Zhao, Z.Z.; Liu, H.M. A simplified free vortex wake model of wind turbines for axial steady conditions. Appl. Sci. 2018, 8, 866. [Google Scholar] [CrossRef] [Green Version]
- Jonkman, J.; Butterfield, S.; Musial, W.; Scott, G. Definition of a 5 mw Reference Wind Turbine for Offshore System Development; Office of Scientific & Technical Information Technical Reports; National Renewable Energy Lab. (NREL): Golden, CO, USA, 2009. [Google Scholar]
- Xu, B.F.; Feng, J.H.; Xu, C.; Zhao, Z.Z.; Yuan, Y. Aerodynamic performance analysis of a trailing-edge flap for wind turbines. J. Phys. Conf. Ser. 2018, 1037, 022020. [Google Scholar]
- Zhang, W.G.; Wang, Y.F.; Liu, R.J. Unsteady aerodynamic modeling and control of the wind turbine with trailing edge flap. J. Renew. Sustain. Energy 2018, 20, 063304. [Google Scholar] [CrossRef]
- Large, W.G.; McWilliams, J.C.; Doney, S.C. Oceanic vertical mixing: A review and a model with a nonlocal boundary layer parameterization. Rev. Geophys. 1994, 32, 363. [Google Scholar] [CrossRef] [Green Version]
- Khosravi, M.; Sarkar, P.; Hu, H. An experimental investigation on the performance and the wake characteristics of a wind turbine subjected to surge motion. AIAA J. 2016, 138, 042602. [Google Scholar]
- Bossanyi, E.A. GH Bladed Theory Manual; Garrad Hassan and Partners Ltd.: Bristol, UK, 2009. [Google Scholar]
- Kitagawa, T.; Nomura, T. A wavelet-based method to generate artificial wind fluctuation data. J. Wind Eng. 2003, 91, 943–964. [Google Scholar] [CrossRef]


| Wind Speed (m/s) | Rotor Speed (rpm) | Pitch Angle (°) | Average Angle of Attack (°) |
|---|---|---|---|
| 8 | 9.16 | 0.00 | 7.27 |
| 9 | 10.37 | 0.00 | 7.60 |
| 10 | 11.48 | 0.00 | 7.69 |
| 11.4 | 12.1 | 0.00 | 8.39 |
| 12 | 12.1 | 3.83 | 5.07 |
| 14 | 12.1 | 8.70 | 1.91 |
| 16 | 12.1 | 12.06 | 0.28 |
| 18 | 12.1 | 14.92 | −0.85 |
© 2020 by the authors. Licensee MDPI, Basel, Switzerland. This article is an open access article distributed under the terms and conditions of the Creative Commons Attribution (CC BY) license (http://creativecommons.org/licenses/by/4.0/).
Share and Cite
Cai, X.; Wang, Y.; Xu, B.; Feng, J. Performance and Effect of Load Mitigation of a Trailing-Edge Flap in a Large-Scale Offshore Wind Turbine. J. Mar. Sci. Eng. 2020, 8, 72. https://0-doi-org.brum.beds.ac.uk/10.3390/jmse8020072
Cai X, Wang Y, Xu B, Feng J. Performance and Effect of Load Mitigation of a Trailing-Edge Flap in a Large-Scale Offshore Wind Turbine. Journal of Marine Science and Engineering. 2020; 8(2):72. https://0-doi-org.brum.beds.ac.uk/10.3390/jmse8020072
Chicago/Turabian StyleCai, Xin, Yazhou Wang, Bofeng Xu, and Junheng Feng. 2020. "Performance and Effect of Load Mitigation of a Trailing-Edge Flap in a Large-Scale Offshore Wind Turbine" Journal of Marine Science and Engineering 8, no. 2: 72. https://0-doi-org.brum.beds.ac.uk/10.3390/jmse8020072