Finding Coastal Megaclast Deposits: A Virtual Perspective


K.G. Razumovsky Moscow State University of Technologies and Management (the First Cossack University), 109004 Moscow, Russia
J. Mar. Sci. Eng. 2020, 8(3), 164; https://0-doi-org.brum.beds.ac.uk/10.3390/jmse8030164
Submission received: 7 February 2020
/
Revised: 25 February 2020
/
Accepted: 25 February 2020
/
Published: 3 March 2020
(This article belongs to the Special Issue Evaluation of Boulder Deposits Linked to Late Neogene Hurricane Events)
Abstract
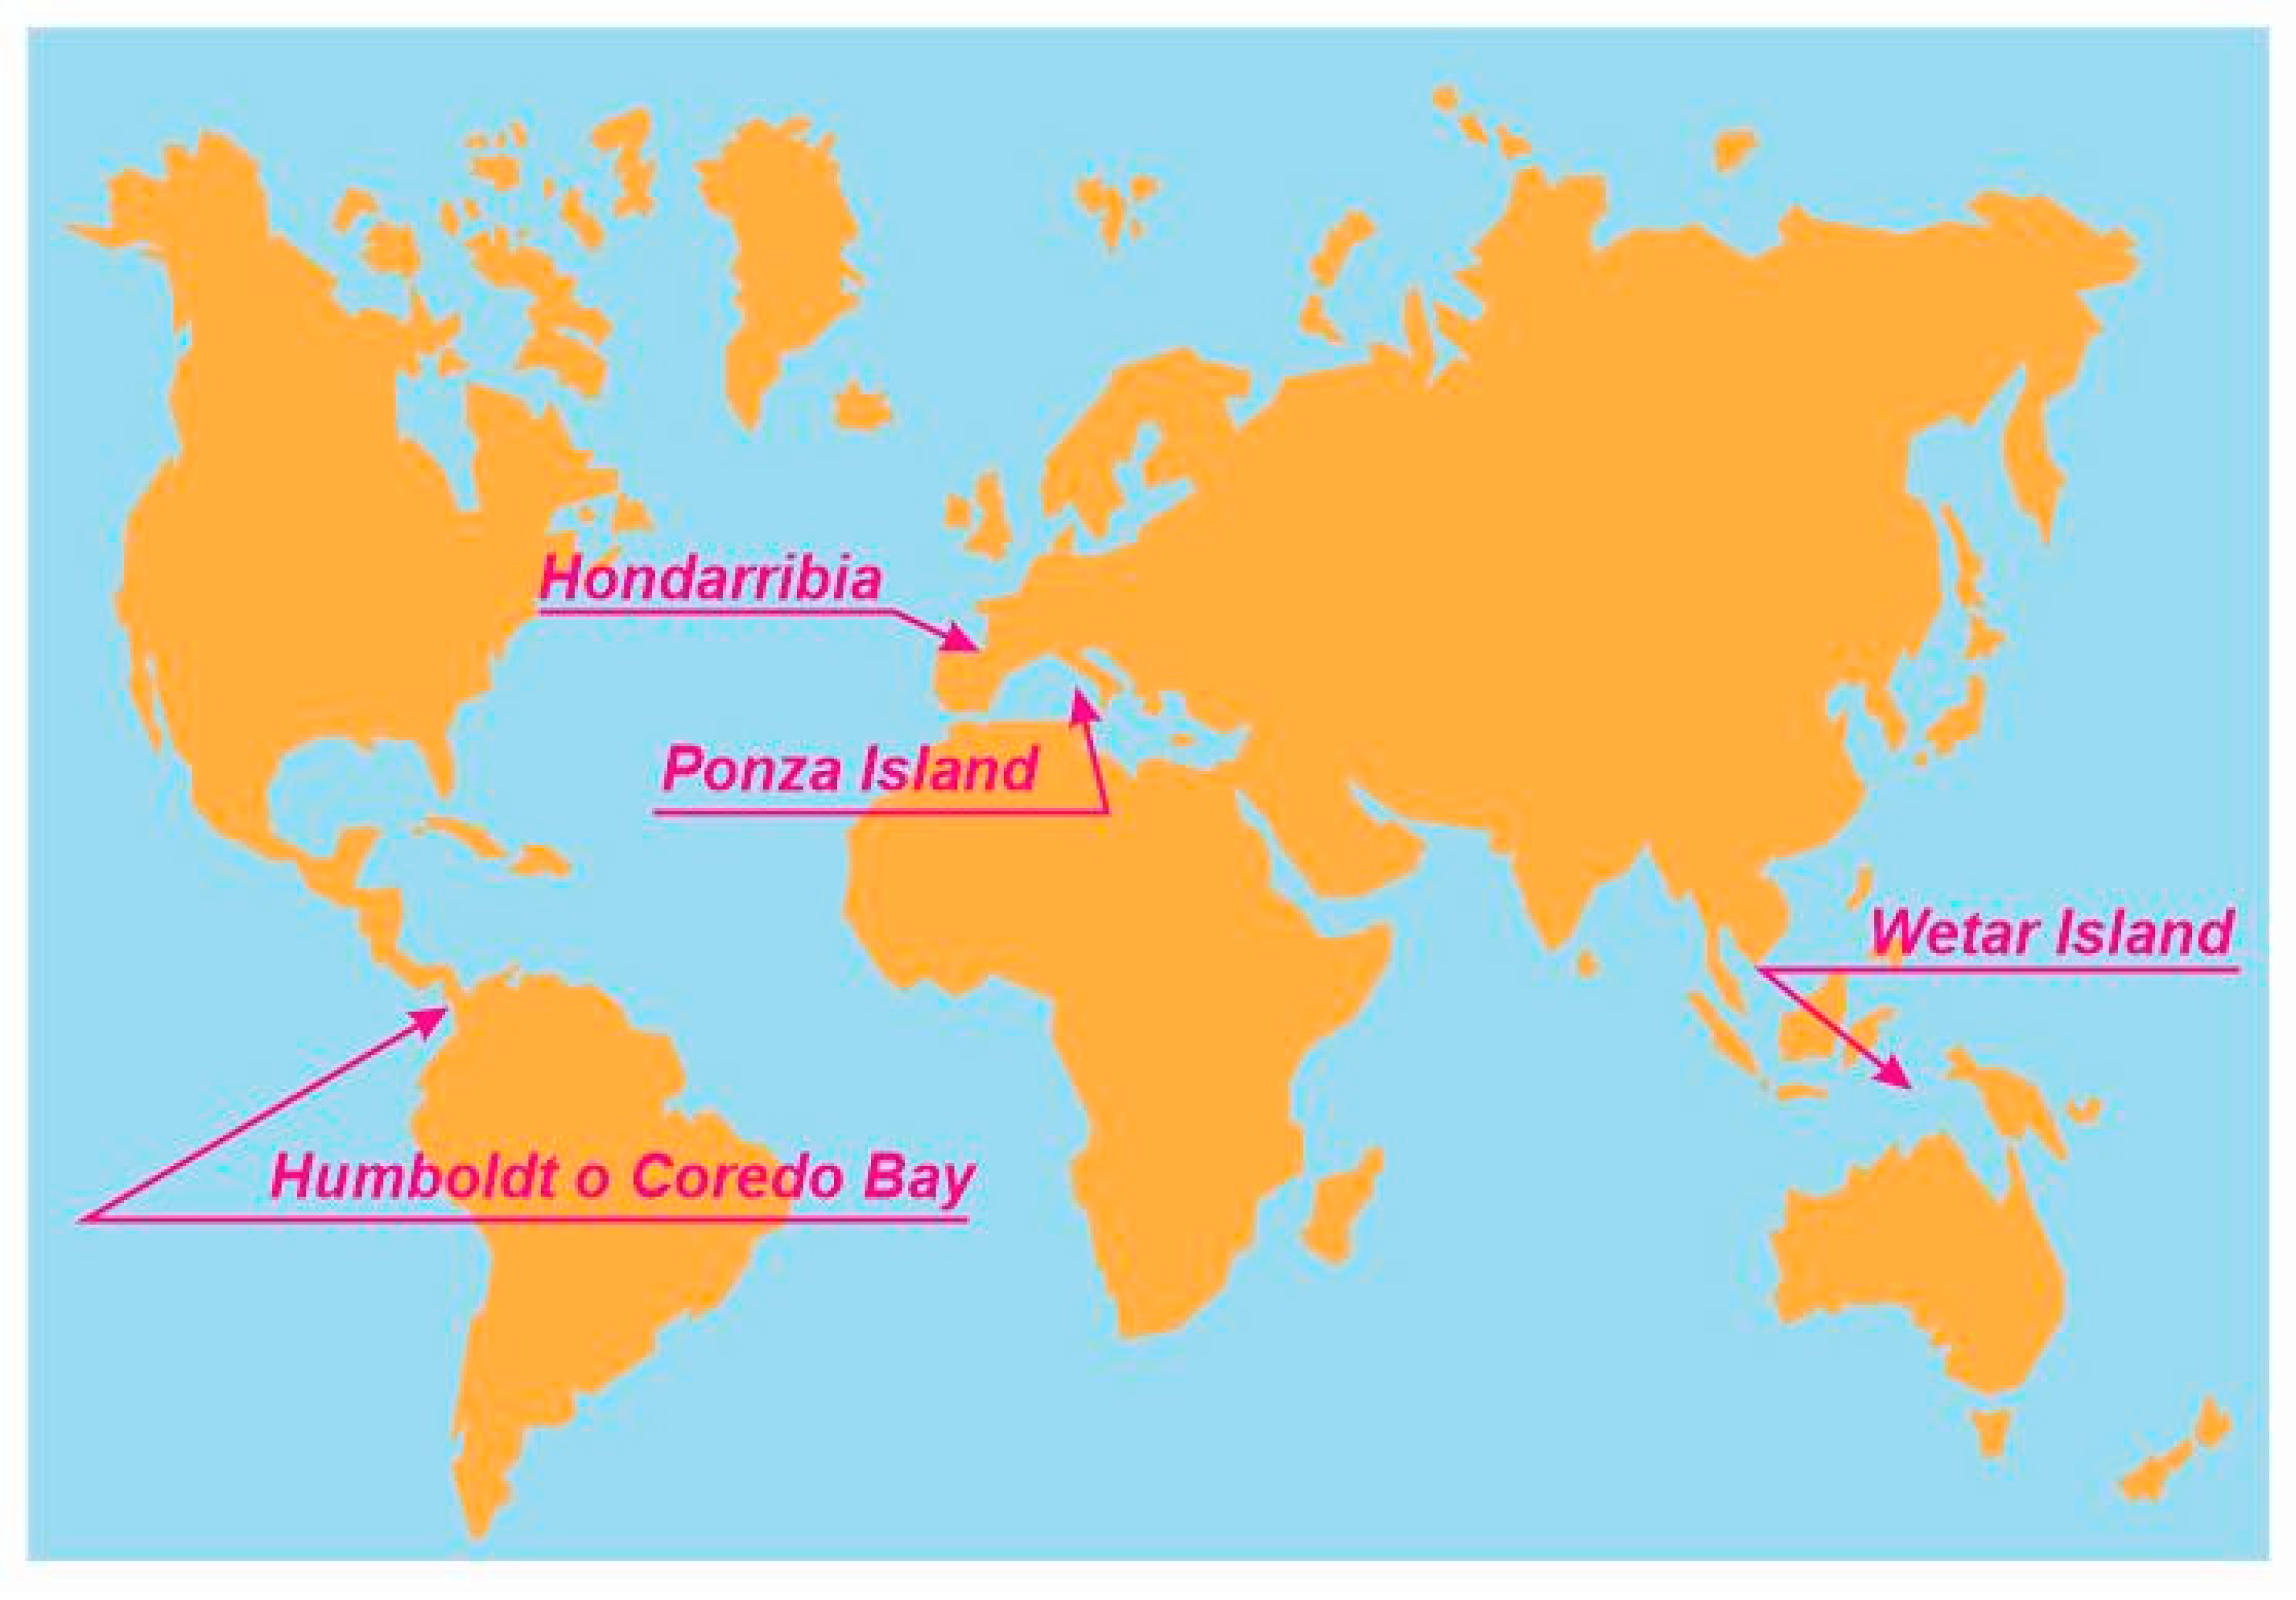
:Coastal megaclast deposits are dominated by detrital particles larger than 1 m in size. These attract significant attention of modern researchers because of the needs of sedimentary rock nomenclature development and interpretation of storm and tsunami signatures on seashores. If so, finding localities that exhibit coastal megaclast deposits is an important task. Field studies do not offer a quick solution, and, thus, remote sensing tools have to be addressed. The application of the Google Earth Engine has permitted to find four new localities, namely Hondarribia in northern Spain (Biscay Bay), the Ponza Island in Italy (Tyrrhenian Sea), the Wetar Island in eastern Indonesia (Banda Sea), and the Humboldt o Coredo Bay at the Colombia/Panama border (eastern Pacific). In these localities, coastal megaclast deposits consisting of blocks (1–10 m in size) and some megablocks (>10 m in size) are delineated and preliminary described in regard to the dominant size of particles, package density, mode of occurrence, etc. The limitations of such virtual surveys of coastal megaclast deposits are linked to an insufficiently high resolution of satellite images, as well as ‘masking’ effects of vegetation cover and cliff shadows. However, these limitations do not diminish the importance of the Google Earth Engine for finding these deposits. Consideration of some tourism-related information, including photos captured by tourists and bouldering catalogues, facilitates search for promising areas for subsequent virtual surveying of megaclast distribution. It is also established that the Google Earth Engine permits quantitative analysis of composition of coastal megaclast deposits in some areas, as well as to register decade-long dynamics or stability of these deposits, which is important to interpret their origin. The current opportunities for automatic detection of coastal megaclast deposits seem to be restricted.
1. Introduction
Coastal sediment dynamics is always highly complex, and, thus, it provides a lot of issues for geoscience investigations. An interest in nomenclature development for large clasts that started near the end of the 20th century [1] and attention to coastal hazards facilitated by the Indian Ocean Tsunami of 2004 [2] have shaped a new international research direction, namely megaclast studies [3]. Megaclasts of ocean and sea coasts have been investigated most intensively. These studies have been conducted in so different places of the world as Baja California in Mexico [4,5], North Eleuthera of the Bahamas [6,7], and Rabat in Morocco [8]. Although the works have tended to focus on only some regions like the Mediterranean (e.g., [9,10,11,12,13]), the global evidence of large clast accumulations has become huge already, and it continues growing. This evidence requires extension and generalization for further conceptual treatment. Previous reviews of rocky shores [14] and megaclasts [3] confirm such research is promising. Undoubtedly, coastal megaclast deposits of Quaternary age are of special importance because the evidence of such deposits from the earlier geological periods remains scarce [3,15].
Coastal megaclast deposits attract significant attention of modern researchers for two aspects. The first aspect is the development of large clast nomenclature. Somewhat coherent and somewhat alternative proposals were made by Blair and McPherson [1], Bruno and Ruban [16], Blott and Pye [17], and Terry and Goff [18]. Additionally, Cox et al. [10] offered a novel approach for measurements of roundness of megaclasts, and, thus, the noted nomenclature development should emphasize not only on grain-size categories, but also on various morphological parameters. The second aspect of coastal megaclast deposits is linked to genetic investigations and, particularly, interpretations of the evidence of past storms and tsunamis (storm-versus-tsunami origin of megaclasts is a popular and hotly-debated topic in the modern sedimentology) [4,5,6,7,8,9,10,11,12,13,19,20,21,22,23,24,25,26,27,28]. Irrespective of which of these aspects and particular opinions to follow, finding new localities coastal megaclast deposits is of utmost importance. The knowledge from the ‘classical’ localities like those studied in the Bahamas [6,7] and western Ireland [29,30,31,32,33,34,35] need extension and refinement with the information from many other localities of the world. Although megaclast studies are urgent and relatively cheap, the circle of the involved researchers remains too restricted to expect documentation of even a triple of all megaclast localities. Moreover, some of the latter can be situated in remote places travelling to where faces serious difficulties in regard to researchers time, safety, and expenses.
The dilemma of the high demand for the really global knowledge of megaclasts contrasting the geographical restriction of their research can be addressed with application of the modern remote sensing techniques. Particularly, the Google Earth Engine [36,37] seems to be promising due to by definition a big size of megaclasts that makes these well visible on satellite images. The extraterrestrial investigations of megaclasts have proven efficacy of similar approaches [16]. The objective of the present paper is to demonstrate the application of the Google Earth Engine for finding coastal megaclast deposits on the basis of several representative examples. This experience permits also to highlight perspectives and restrictions of this approach. In the other words, the focus of this paper is methodological, and it concerns chiefly virtual identification of localities, not comprehensive sedimentological description of deposits represented there. In this paper, it is also undertaken to summarize briefly the available information on megaclasts in some major regions of the Earth in order to demonstrate how finding new localities can fill geographical gaps in the knowledge of megaclast distribution along coasts.
2. Methodology
Large clasts are detrital sedimentary particles larger than 256 mm in size, according to the standard Udden–Wenthworth classification, or larger than 100 mm, according to the alternative classification proposed by Bruno and Ruban [16]. Boulders are large clasts with the size ranging between 0.10 and 1 m, and megaclasts are detrital sedimentary particles larger than 1 m in size [16]. However, it should be noted that different researchers proposed the different lower limit for this category of particles (= the different upper limit of boulders) [1,17,18]. Depending on their size, megaclasts can be subdivided into blocks (1–10 m), megablocks (10–100 m), and superblocks (>100 m) [16]. Coastal boulder deposits are distributed along coasts of seas, oceans, and great lakes and include a significant amount of large clasts (true boulders and megaclasts); these deposits associate often with rocky shores and reflect influences of storms and tsunamis and the relevant clast transport (inland, above high-water mark, and even to the cliff-top position) [13,20,27]. Synonymous terms are boulderite coined by Dewey and Ryan [21], boulder beach [19,38,39,40], and boulder field [8,41]. Finally, coastal megaclast deposits are coastal boulder deposits dominated by clasts larger than 1 m in size or, at least, bearing recognizable accumulations of such clasts.
The Google Earth Engine is a software that offers satellite images of different scales for the planetary surface and allows their analysis; it also incorporates well-justified cartographical basis, GIS technologies, and some other information, including photos provided by the users. This instrument can be applied successfully for solution of various geoscience tasks [36,37]. For instance, it has been used efficiently in landslide susceptibility mapping [42,43]. The most elementary function of the Google Earth Engine is visual surveying of the Earth surface at an appropriate resolution. Taking into account that megaclasts are >1 m in size, the resolution of the available satellite images permits finding them in almost all regions and describing them preliminarily when image resolution is especially high. A significant advantage of this approach is a no-cost, quick, and geographically unrestricted search for megaclast localities, including those in difficult-to-access places. Anyway, the efficacy of the Google Earth Engine in the search for coastal megaclast deposits needs testing, and the latter was addressed in the present study. The Google Earth Pro 7.3.2.5776 version (free software) of the Google Earth Engine was employed for this purpose. Images of the maximum appropriate resolution are preferred. In some cases, resolution can be increased a bit else, but this leads to smooth contours of natural objects, i.e., to poor-visibility of megaclasts.
In order to test the application of the Google Earth Engine to coastal megaclast deposits, four localities of the latter were considered. These were found as a result of tentative visual coastline surveying with the Google Earth Engine in those areas where the occurrence of megaclasts seems to be possible, but has not been reported earlier. The localities were Hondarribia in northern Spain (the Biscay Bay coast), the Ponza Island of Italy (Tyrrhenian Sea), the Wetar Island in eastern Indonesia (Banda Sea), and the Humboldt o Coredo Bay and vicinities near the border between Colombia and Panama (eastern Pacific coast; Figure 1). These localities represent different geographical domains, namely Atlantic Europe, the Mediterranean, Southeast Asia, and Central America. For each locality, two plots are selected provisionally for more representative approach testing. When possible, these plots were selected so to demonstrate local differences of coastal megaclast deposits. Although this paper focused on finding localities, preliminary qualitative descriptions of the studied coastal megaclast deposits were provided, as this study explored the very possibility of their ‘visibility’ with the Google Earth Engine. The descriptions avoid details relevant to remote sensing techniques, but emphasize on the general character of the deposits, which is the primary interest of sedimentologists. In other words, the descriptions were addressed to sedimentologists, not specialists in remote sensing. Importantly, these localities were selected to demonstrate the utility of satellite images with a different resolution.
3. Results
Four small case studies were undertaken in order to demonstrate the efficacy of the virtual examination of coastal megaclast deposits with the Google Earth Engine. Two examples deal with satellite images of exceptionally high resolution, and two other examples deal with satellite images of appropriate but somewhat limited resolution. In each case, it is also attempted to stress the relative importance of the new evidence to the regional knowledge of coastal megaclast deposits. For this purpose, the basic published information was summarized.
3.1. Example 1: Hondarribia (Spain; Biscay Bay)
The locality is situated in the vicinities of the town of Hondarribia in northern Spain (Figure 1), where the rocky shore of the Biscay Bay hosts a lot of megaclasts that form significant accumulations. Their origin is linked to the destruction of the Paleogene marine rocks exposed in cliffs and directly along the coastline [44]. Apparently, the main factors of megaclast accumulation are gravity processes and wave abrasion.
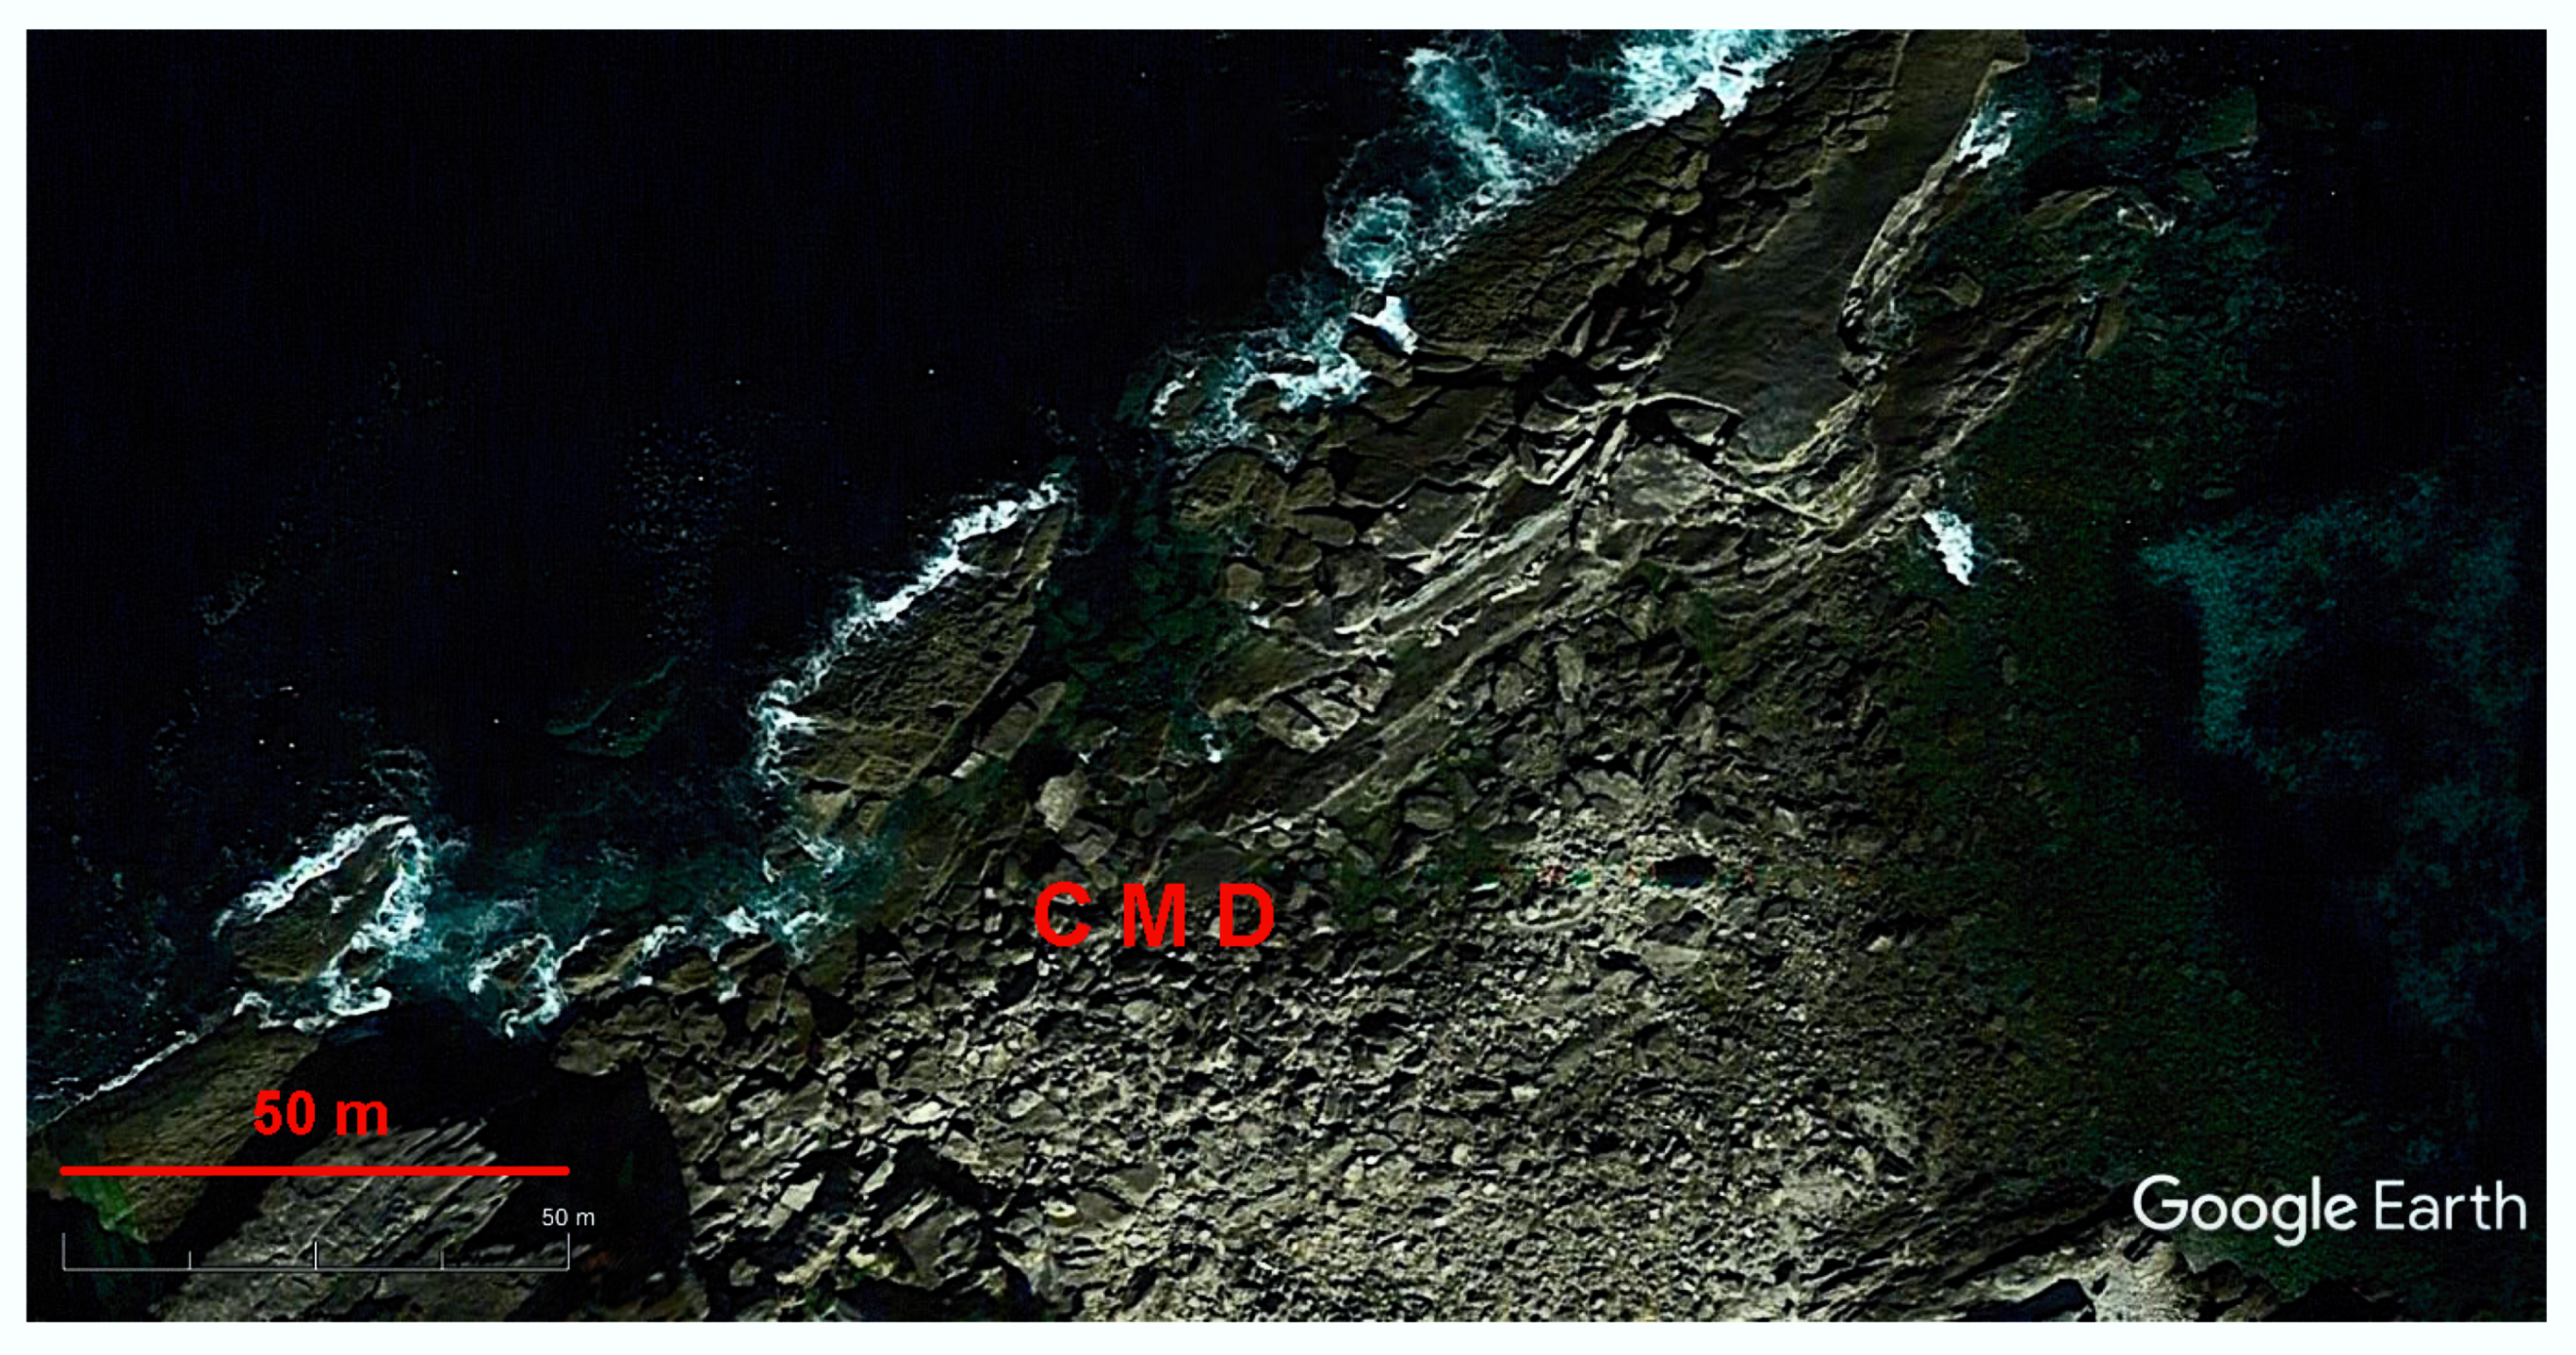
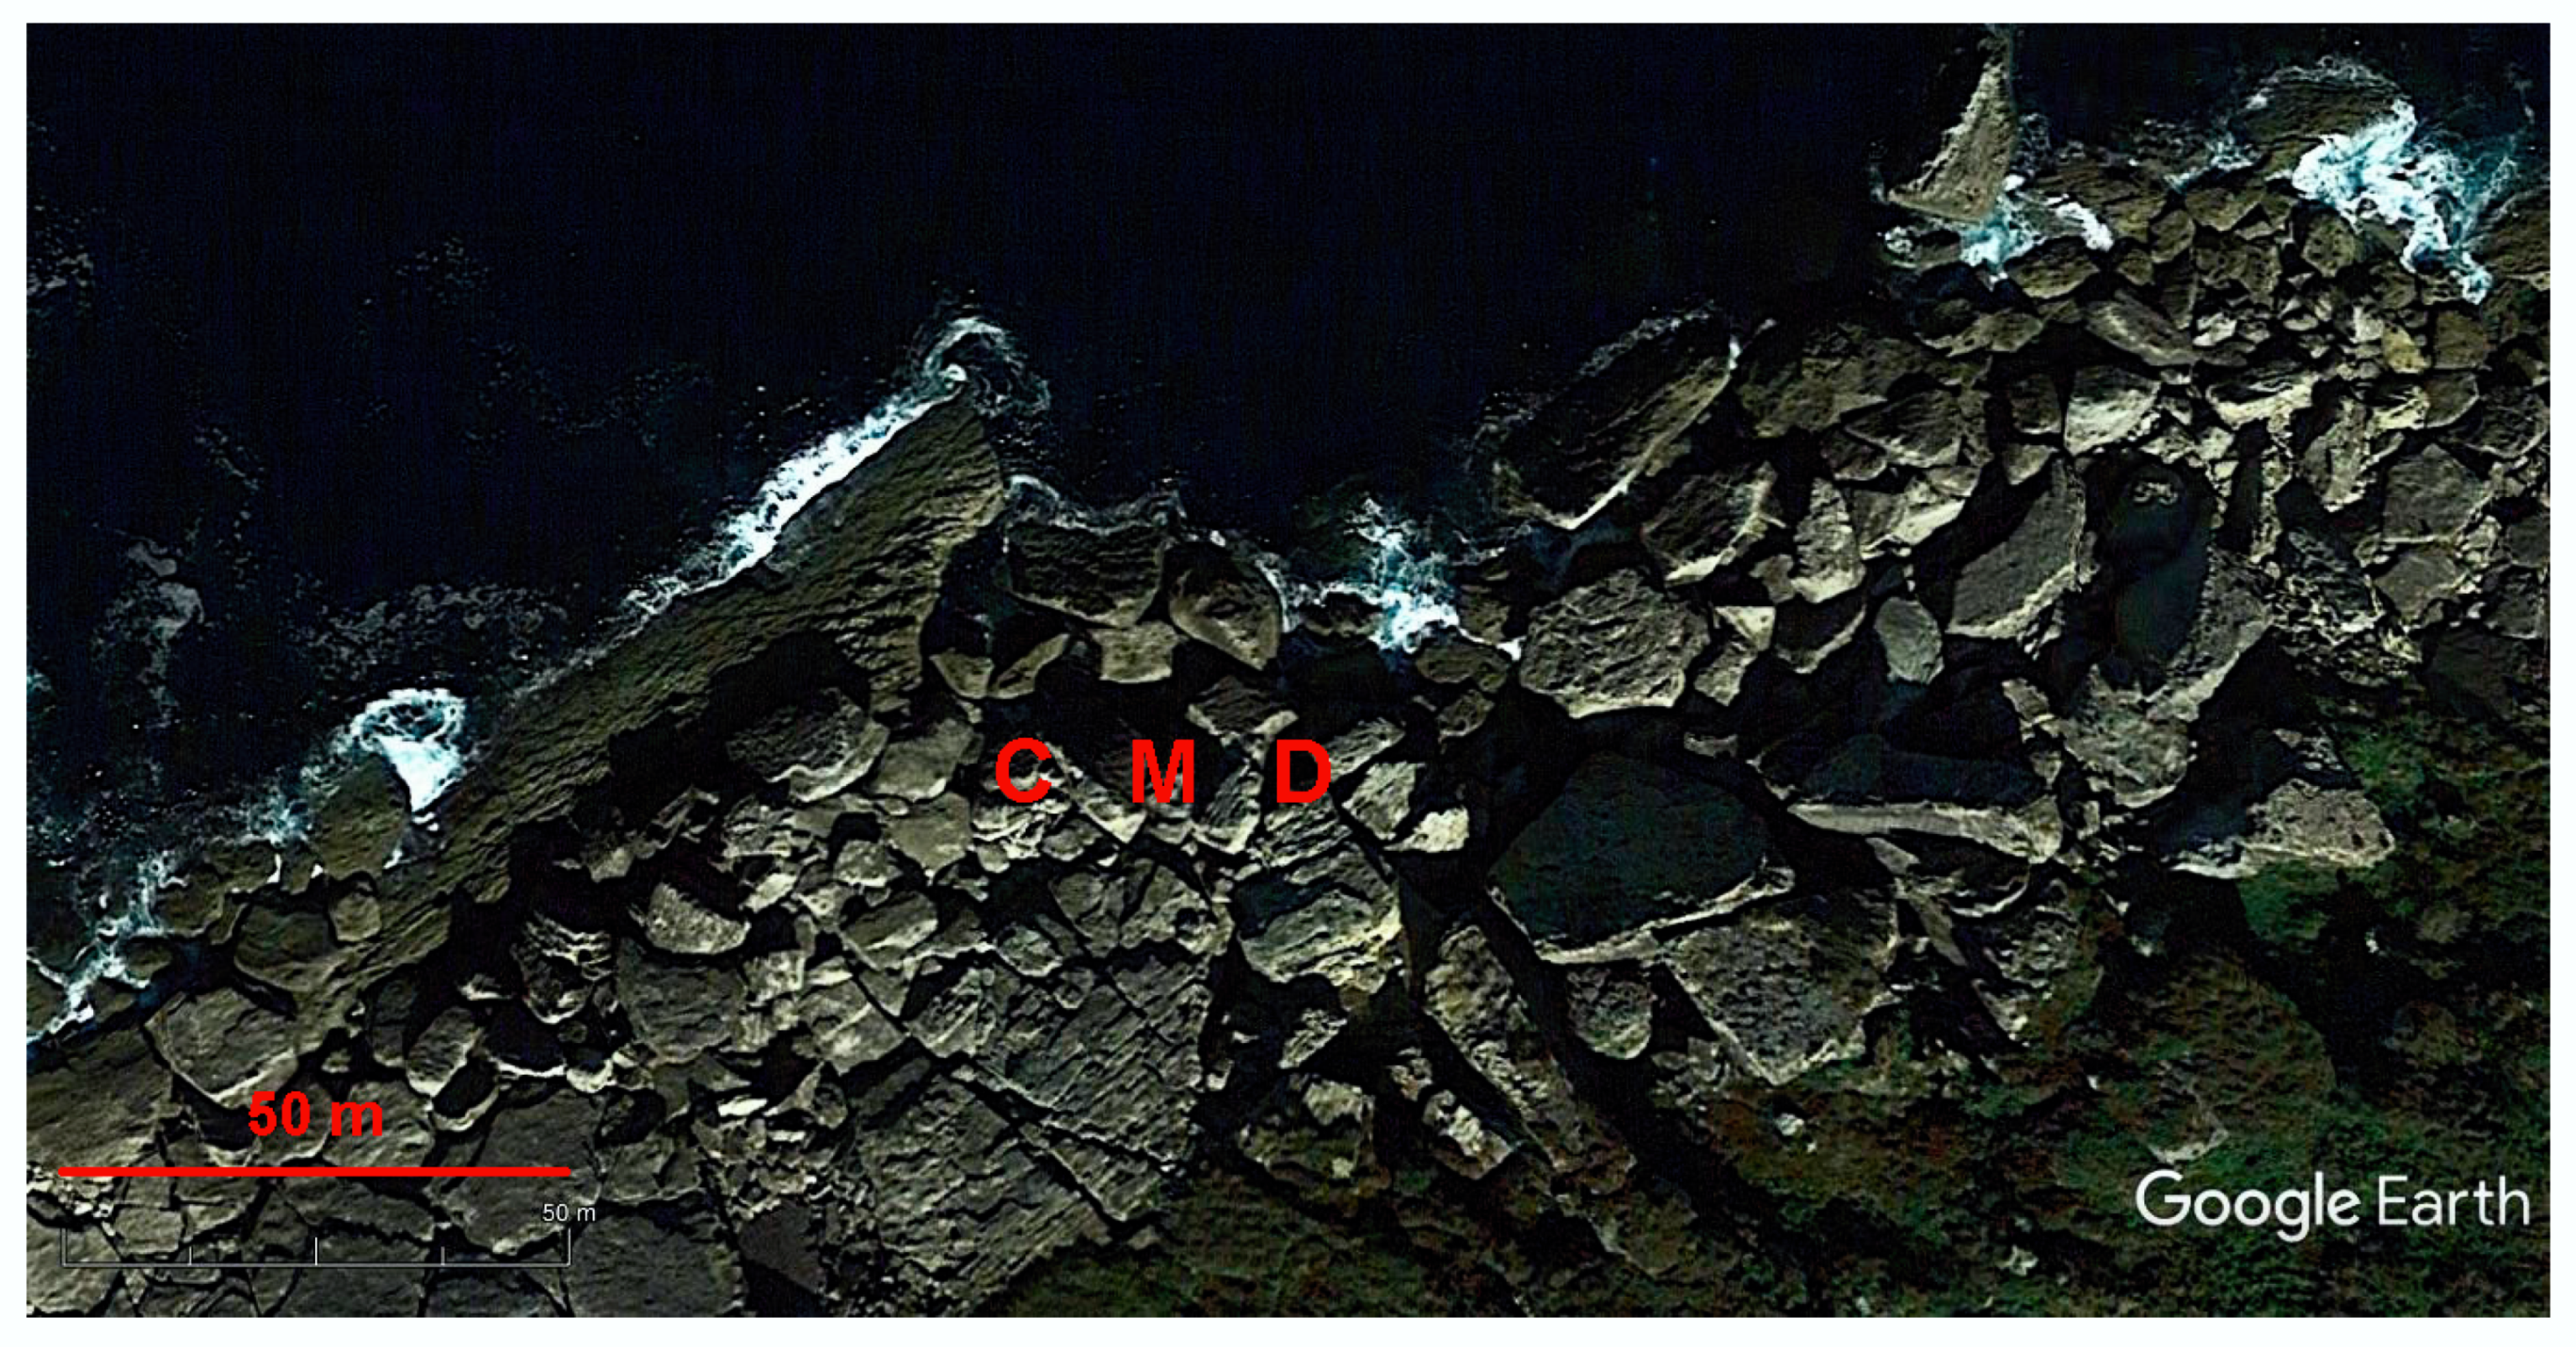
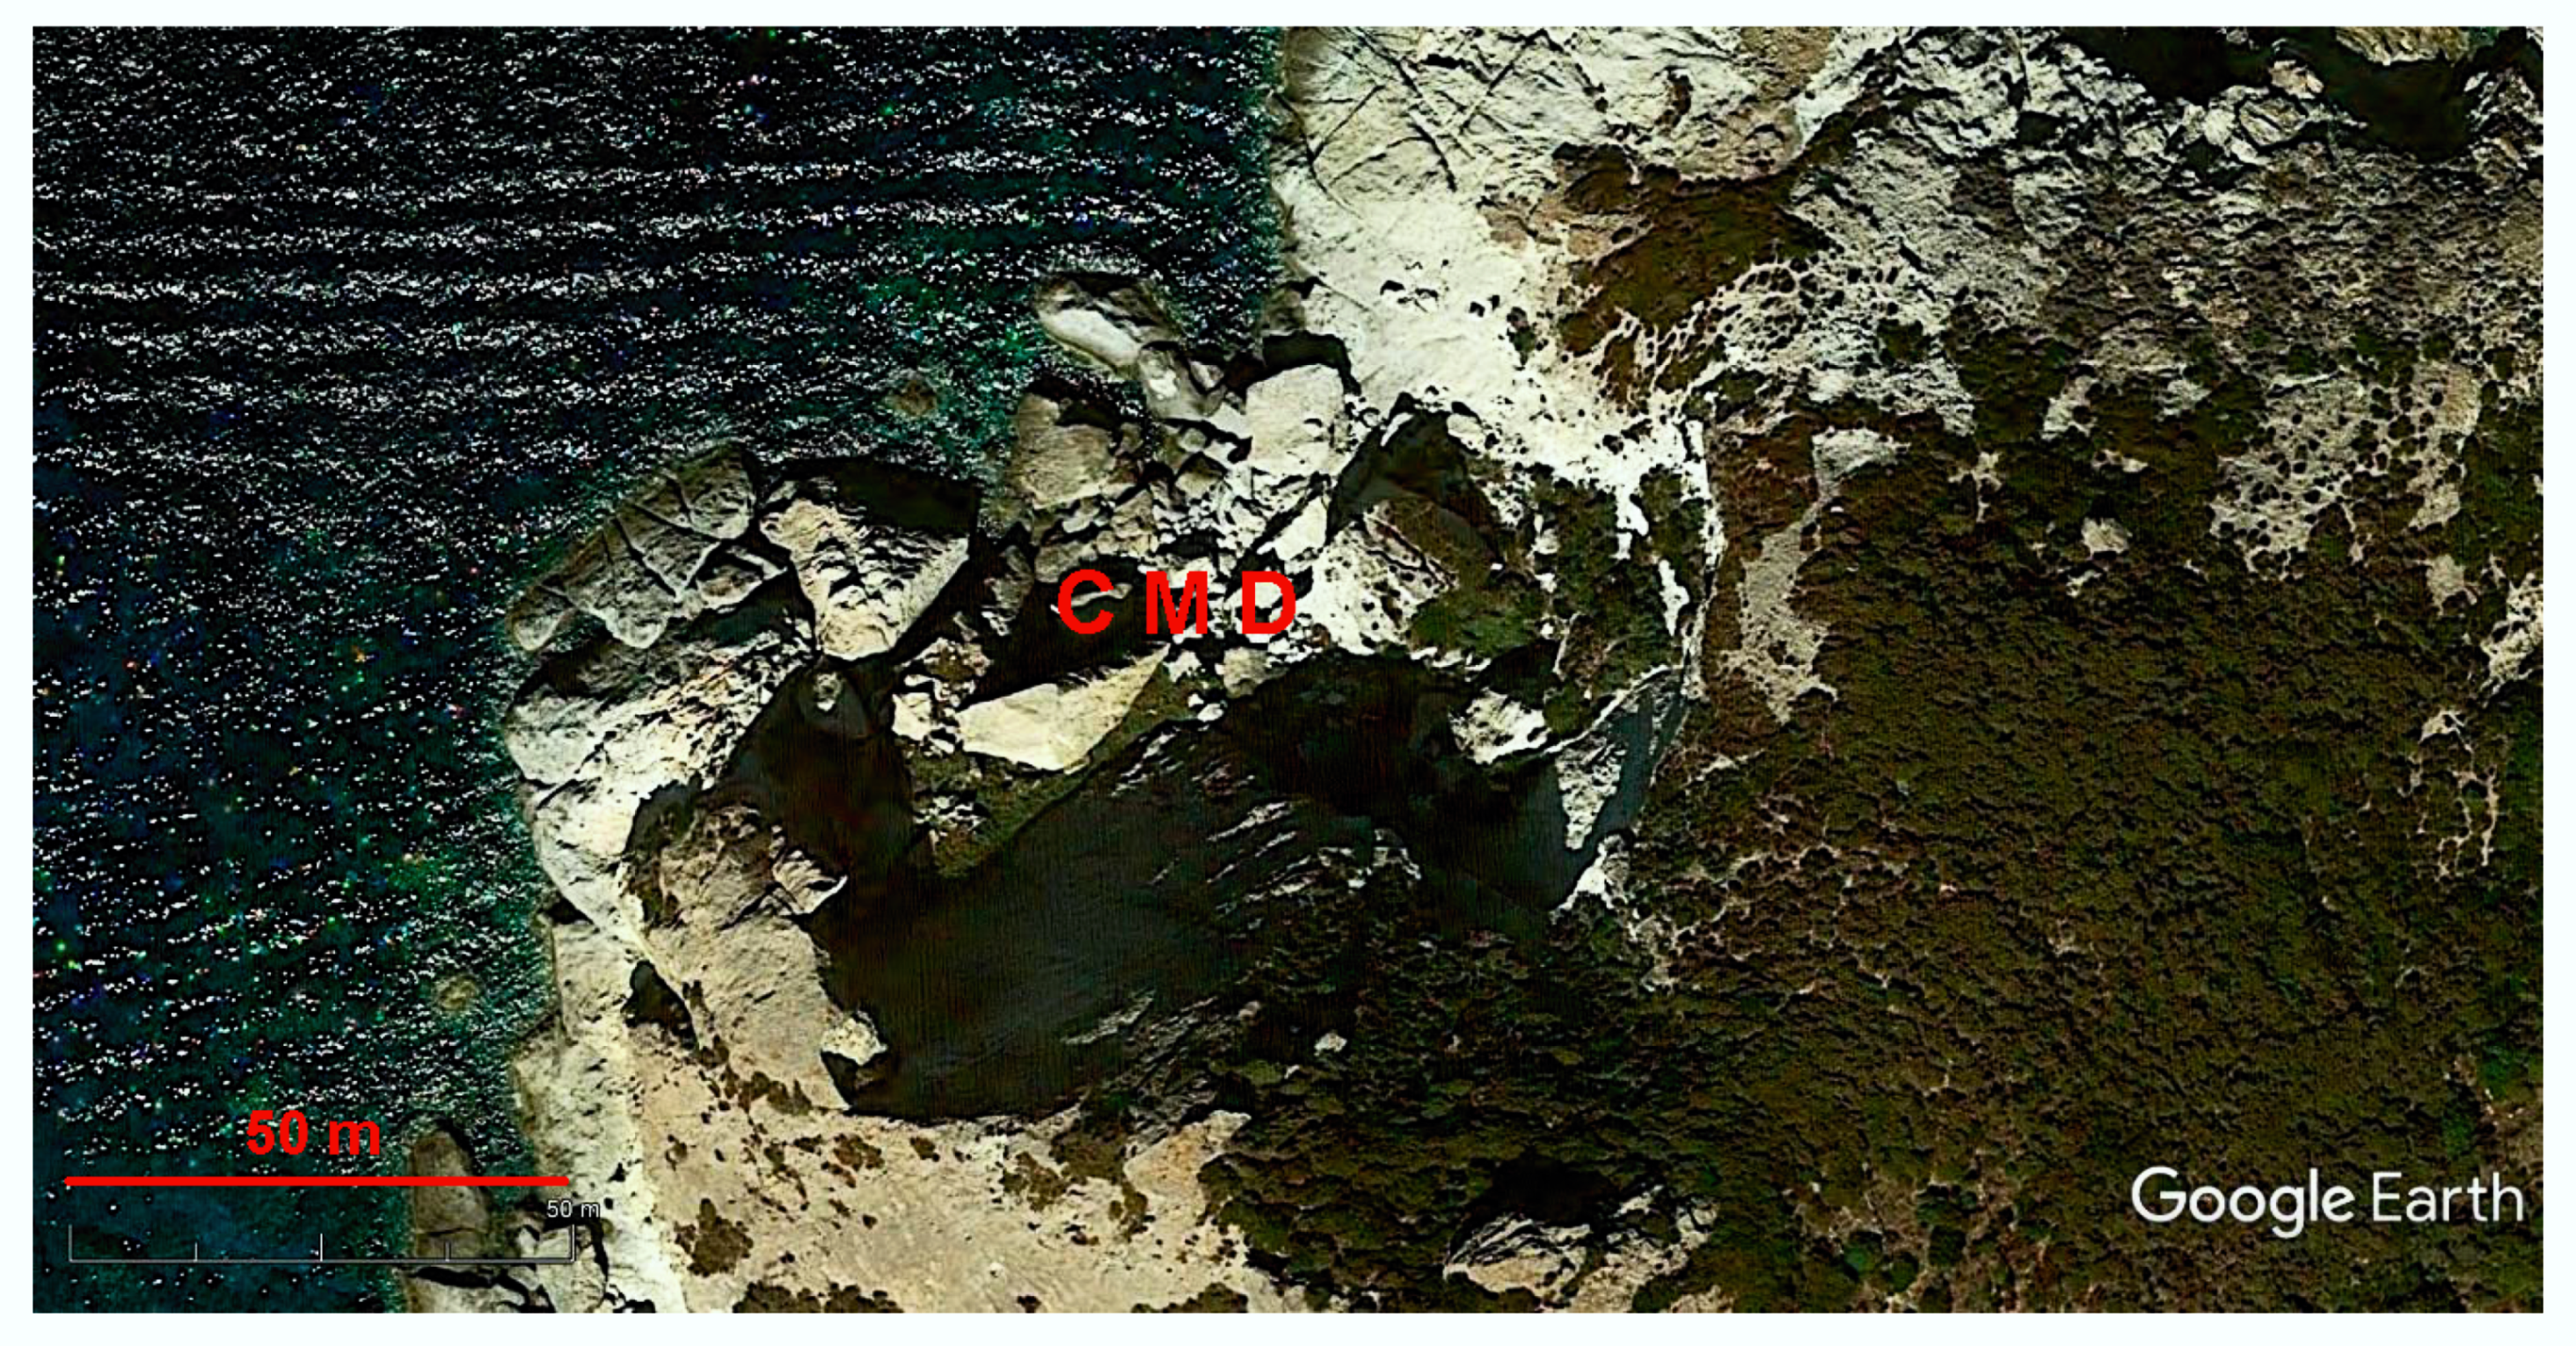
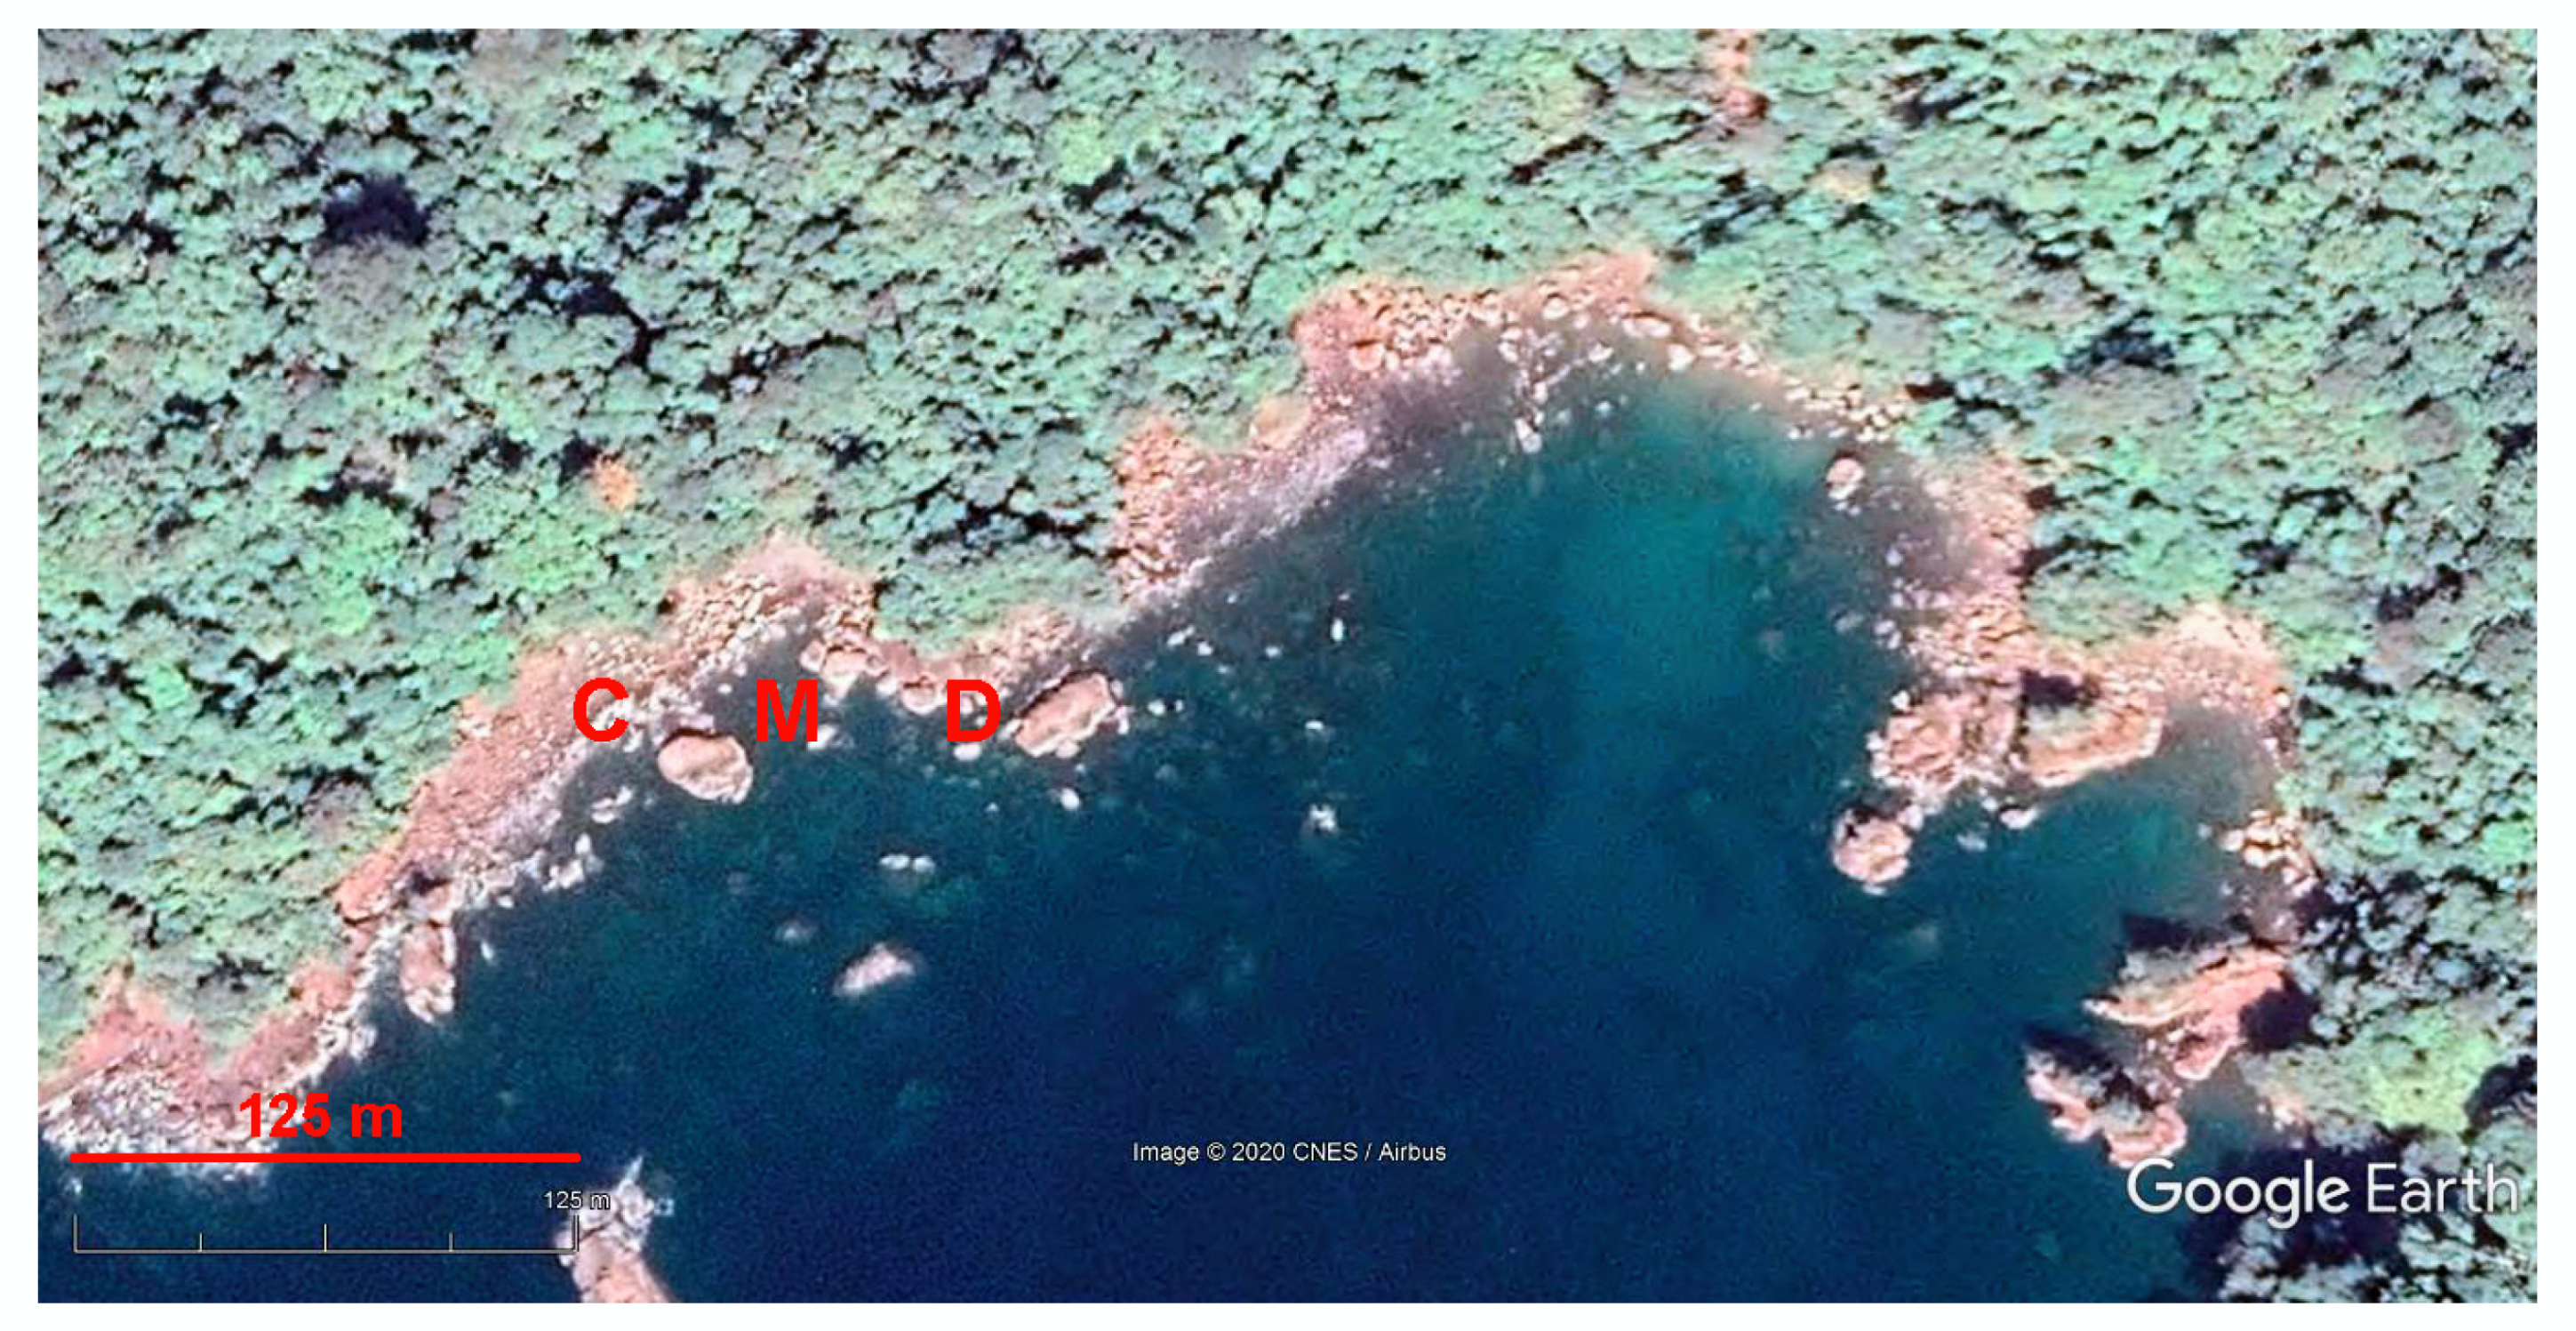
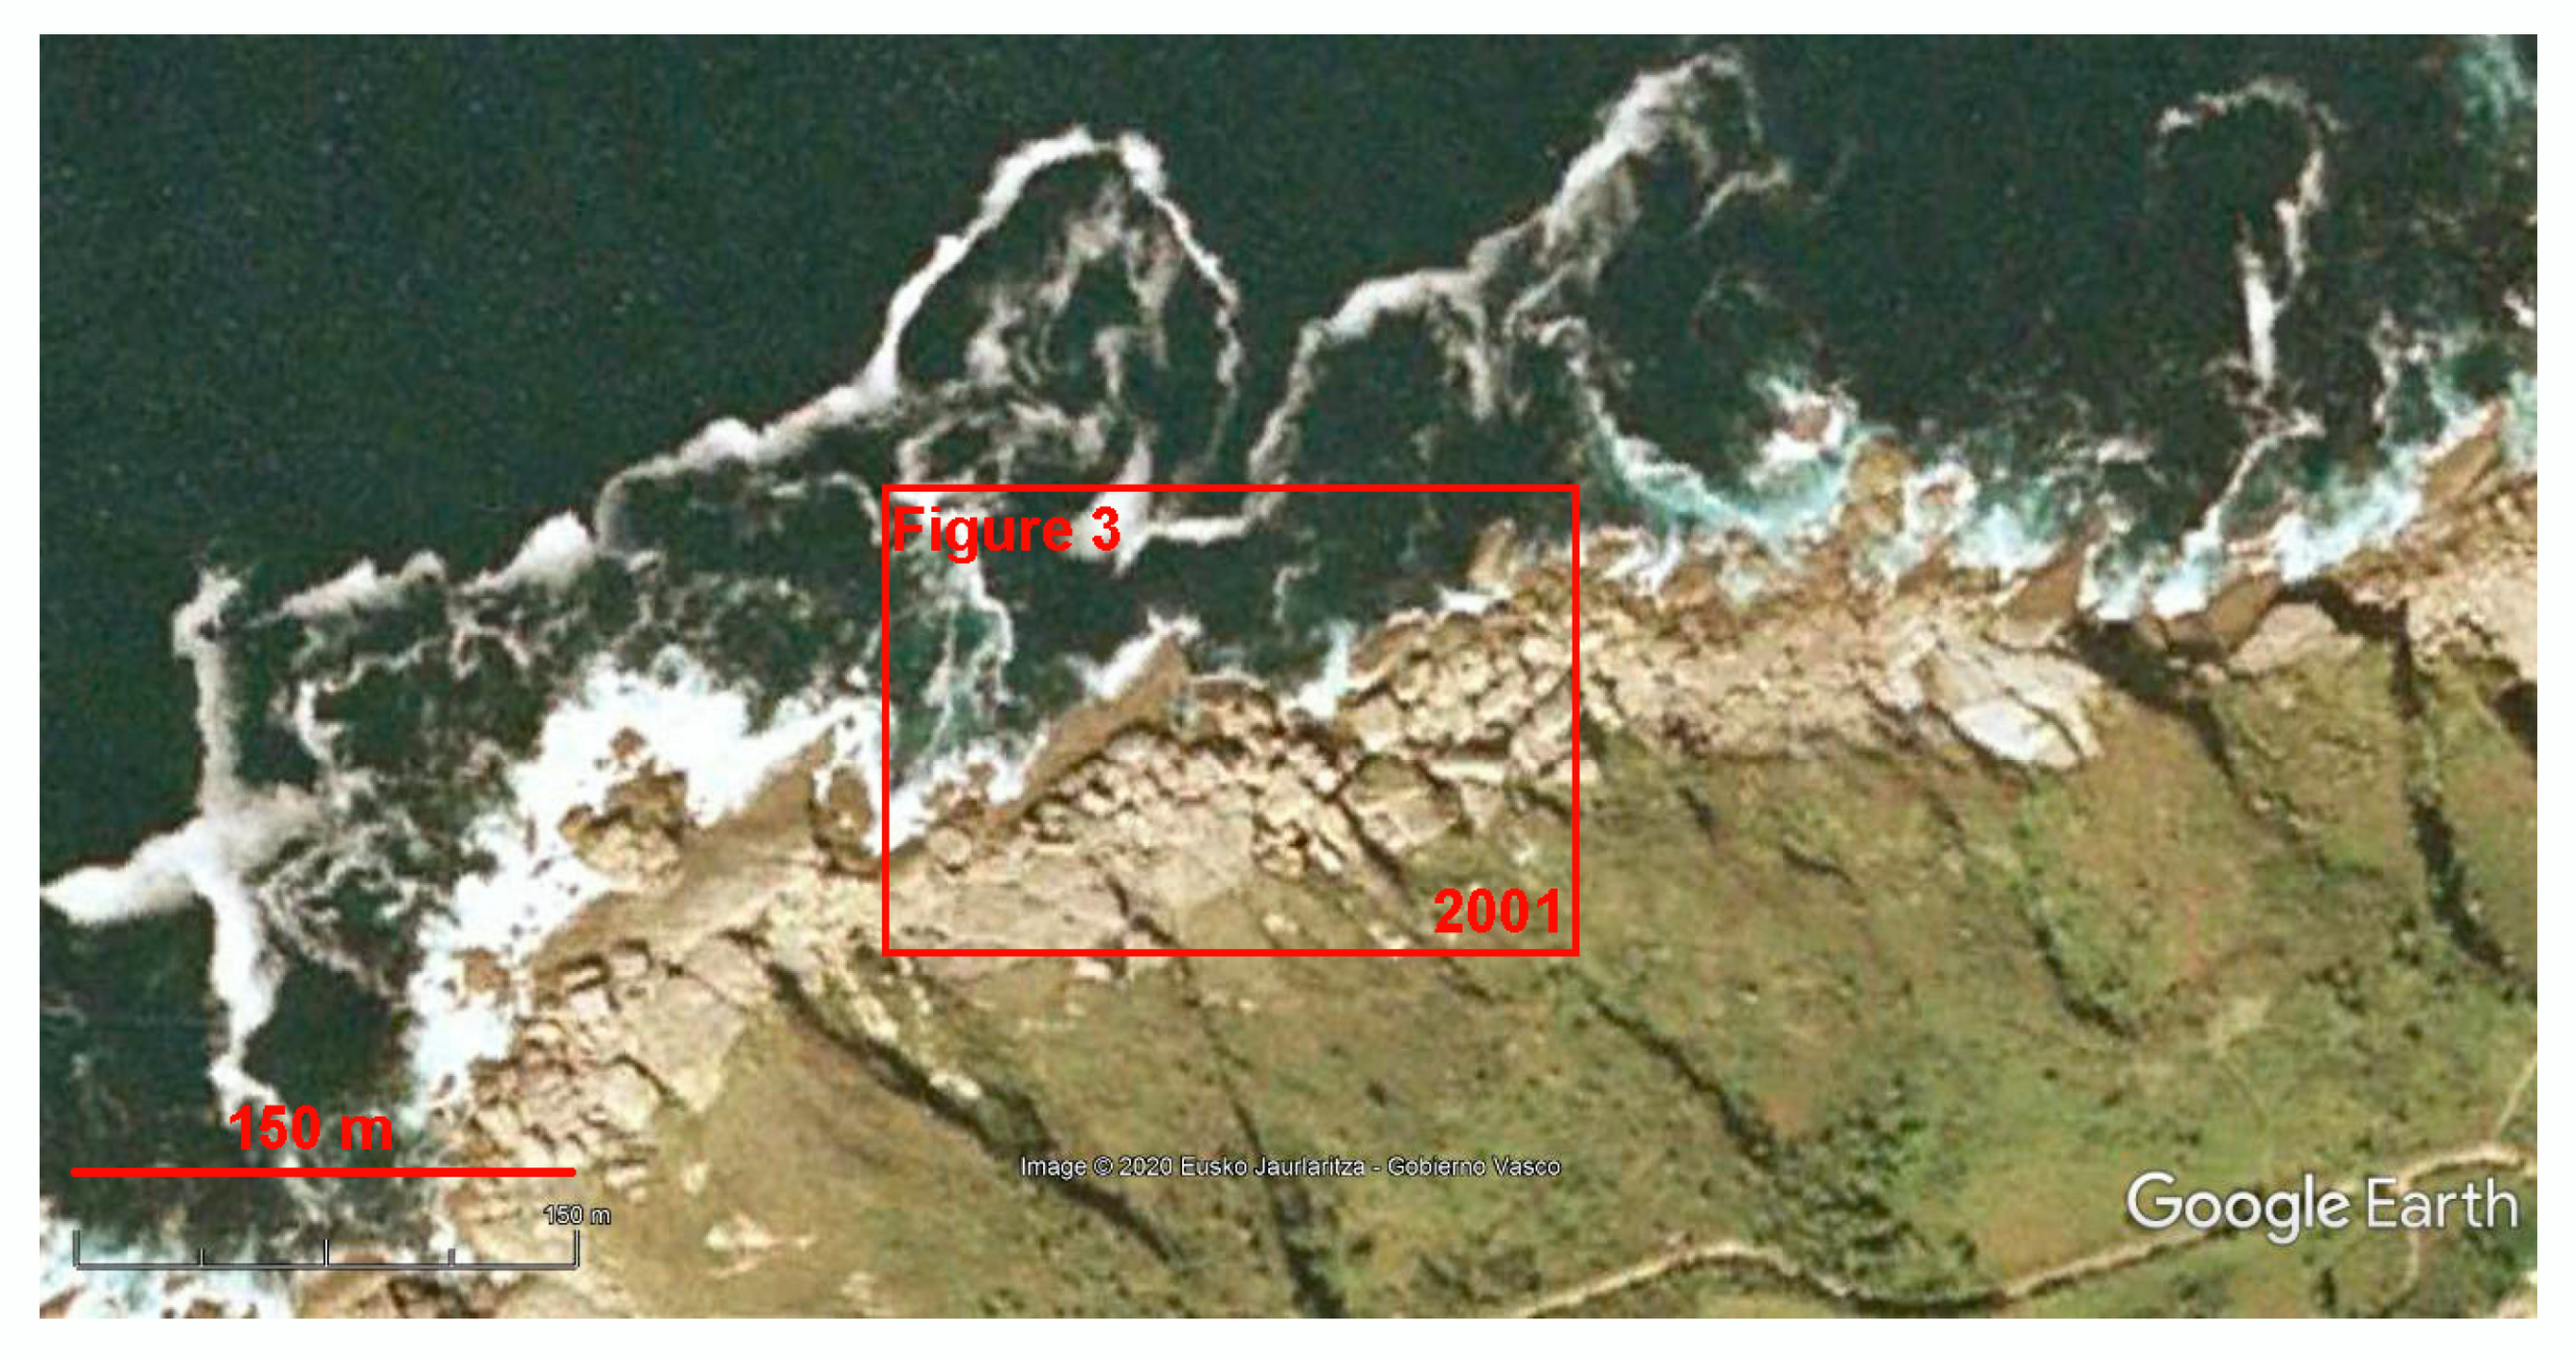
On the eastern plot, the coastal megaclast deposits were represented by the dense accumulation of angular blocks with the size of 1–5 m; the maximum size reached 7–8 m (Figure 2). Importantly, the deposits were spatially heterogeneous—the mean size of blocks increased locally (for instance, near the shoreline and close to parent rock exposures). Although the deposits covered almost the entire area, some ‘islands’ of parent rock exposures and semi-detached megaclasts were also visible. On the western plot, angular megaclasts were larger in size: these include blocks and megablocks; the size of the largest particle exceeded 25 m (Figure 3). Megablocks were more numerous in the right half of the plot. Parent rock exposures and semi-detached megaclasts occurred in the left half. On both plots, clasts >1 m in size were distinguished unequivocally, and the evidence was enough to confirm the presence of true coastal megaclast deposits. The resolution of the satellite view permitted us to distinguish blocks from megablocks; the presence of boulders was evident, although these could not be registered individually. Dense package of the deposits was well visible. Size and shape of individual blocks can be registered when their size exceeds 1–2 m. The spatial position and orientation of stones did not leave an impression of significant re-working, i.e., primary, undisturbed coastal megaclast deposits could be hypothesized.
The information from this locality fills an important gap in the knowledge of the geographical distribution of coastal megaclast deposits along the Atlantic coast of Europe. These deposits were reported previously from the British Isles [21,27,28,29,30,31,32,33,34,35,45,46,47,48,49,50,51], northern France (first of all, Brittany) [52,53,54,55,56], and the western and southwestern coasts of the Iberian Peninsula [57,58,59,60,61]. The Hondarribia locality represents the other domain, i.e., the Biscay Bay, the coasts of which are prone to severe storms creating and transporting megaclasts, similarly to the above-mentioned regions [62]. This may be the first megaclast locality reported from the Biscay Bay coast.
3.2. Example 2: Ponza Island (Italy; Tyrrhenian Sea)
The locality corresponds to the Ponza Island (Pontine Archipelago) that is situated in the Tyrrhenian Sea, near the western coast of central Italy (Figure 1). The Pliocene volcanic and volcaniclastic rocks are exposed in tall cliffs [63,64,65], the collapse of which leads to the formation and accumulation of numerous megaclasts. As rocky shores with cliffs dominate the island, the distribution of coastal megaclast deposits is significant there. Gravity processes and abrasion contribute to local megaclast formation.
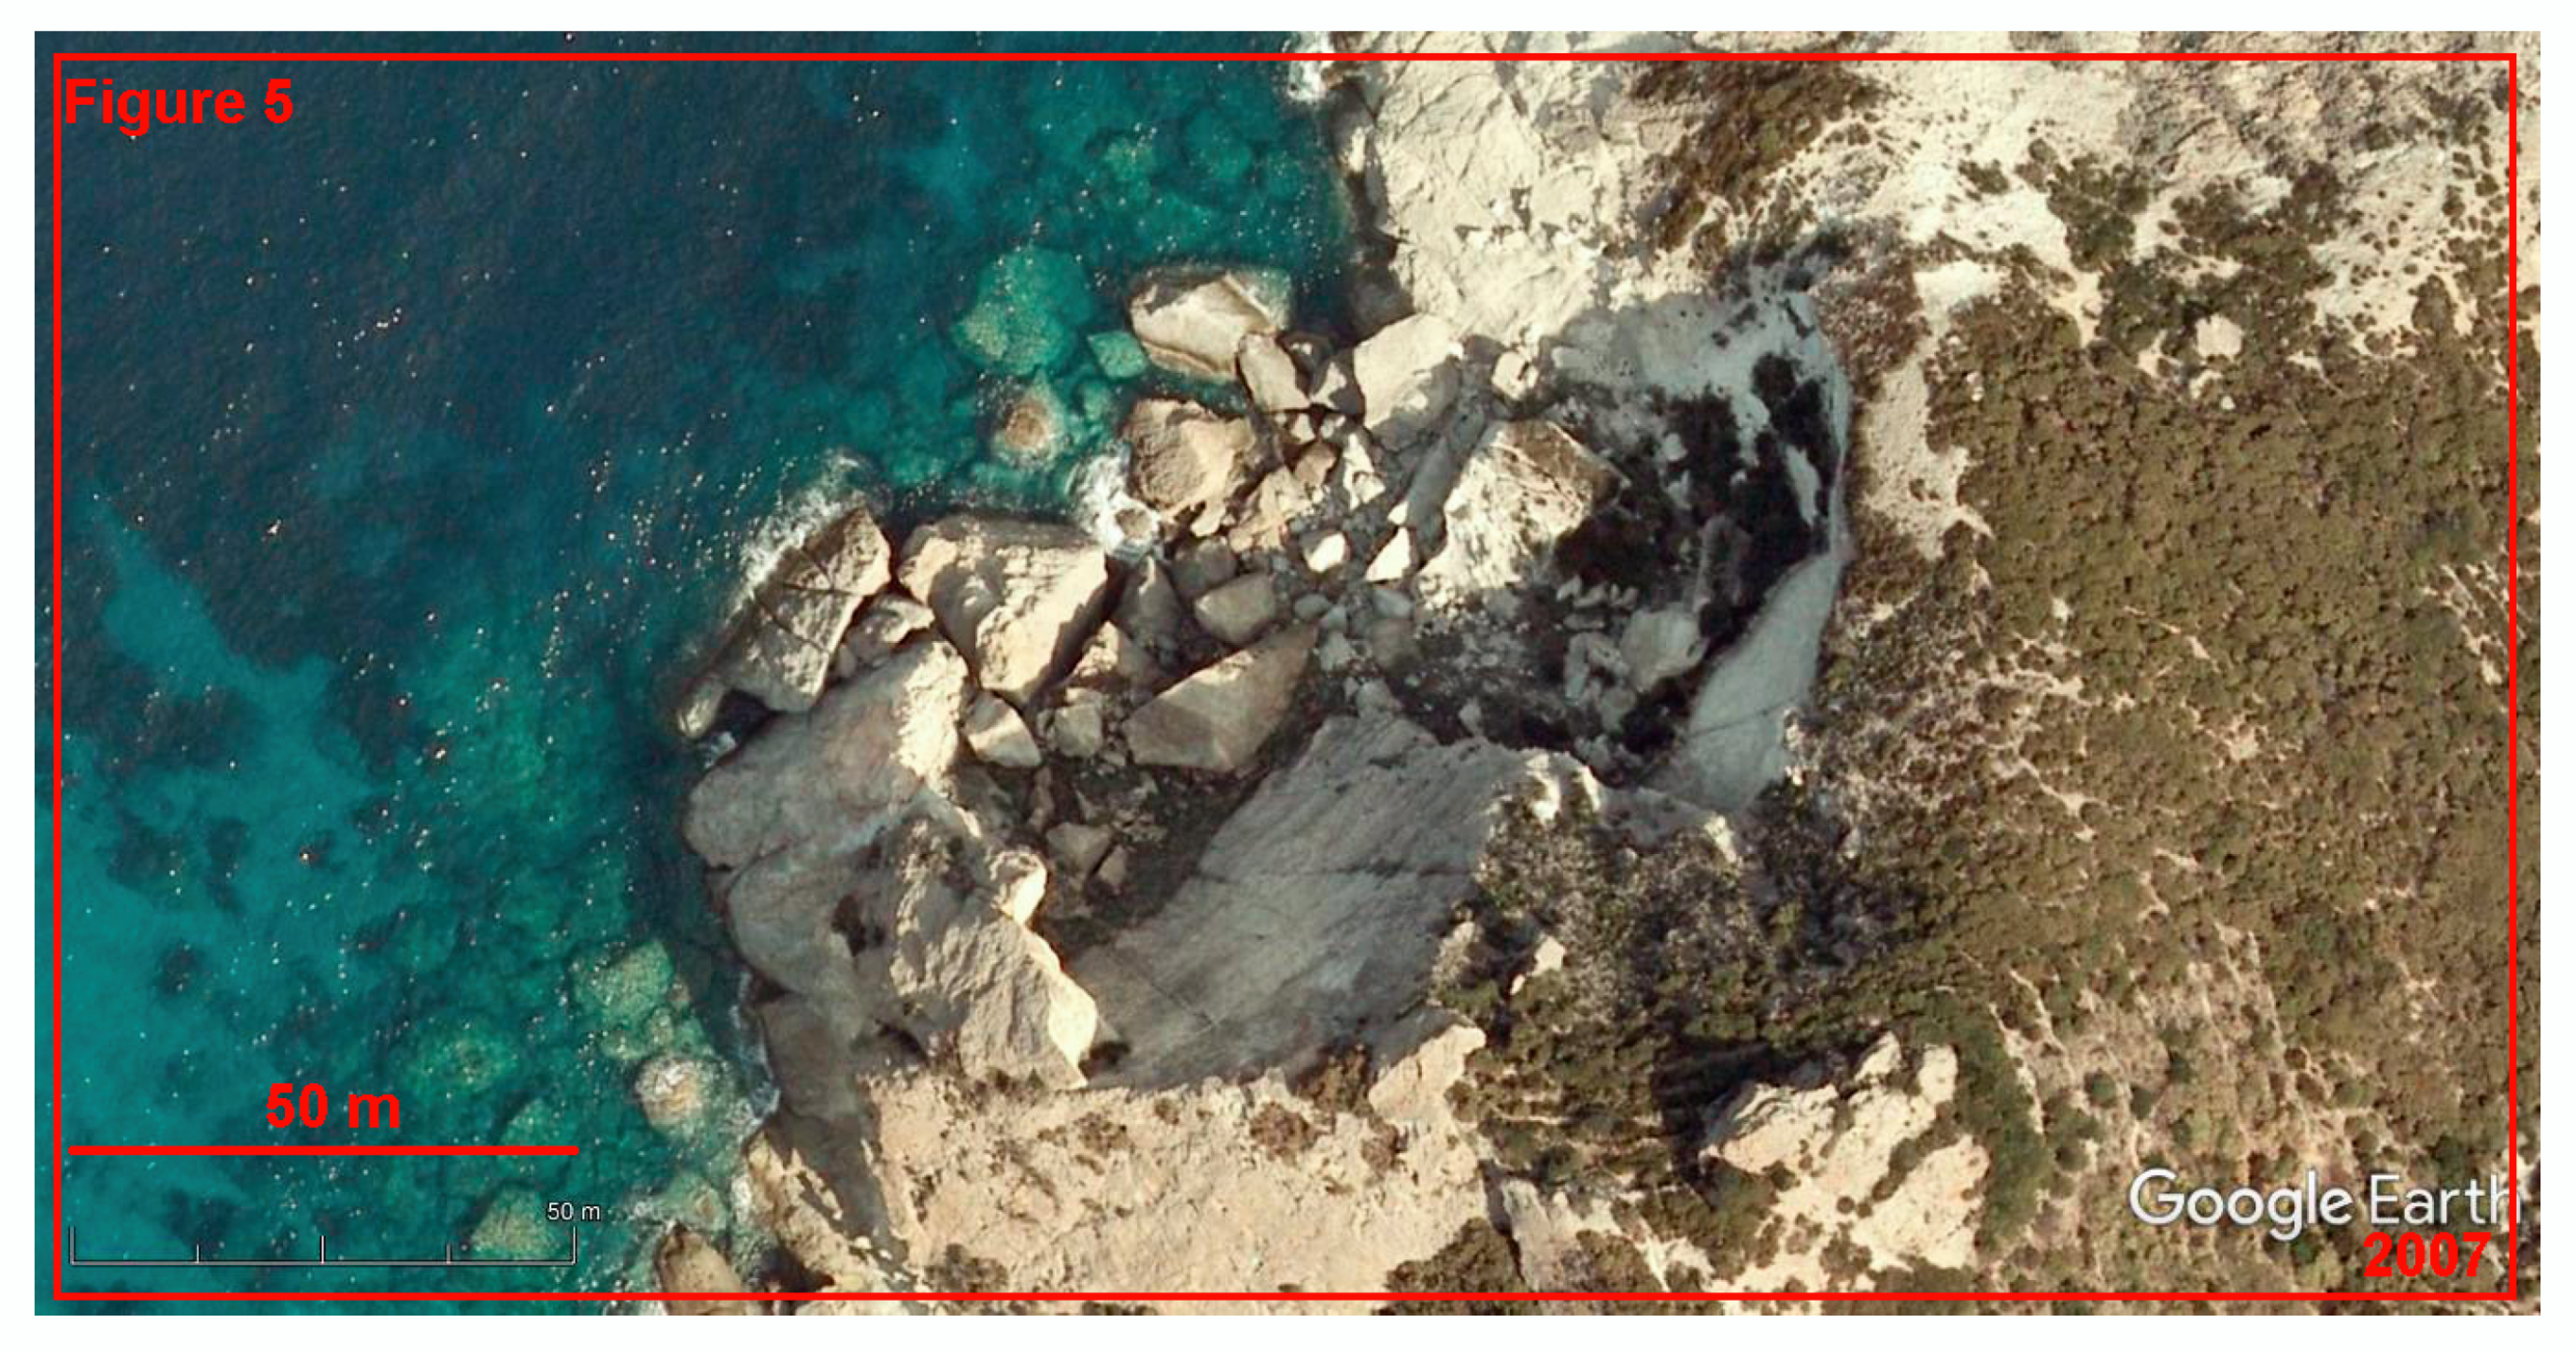
On the southern plot, the coastal megaclast deposits were represented by the accumulation of angular blocks with the common size of 1–5 m (Figure 4). Blocks of a bigger size and rare small megablocks (up to 12–13 m in size) occurred along the very shoreline, as well as in the northern part of the plot. Density of the deposit differed: it was significant near the shoreline, but megaclasts occurred individually or in small groups in the other places where they were either mixed with boulders or lay directly on the rock surface. On the northwestern plot, a small group of fully- and partially-detached megaclasts was observed (Figure 5). These include several megablocks with the size up to 40 m and numerous blocks in between. These megaclasts were angular, and some smoothed surfaces result from wave and wind ‘polishing’. On both plots, clasts >1 m in size were distinguished easily, and the delineation of true coastal megaclast deposits was easy. The resolution of satellite images permitted us to distinguish blocks from megablocks, the presence of boulders was evident, although these could not be registered individually. Different package density was visible. Size and shape of individual particles can be registered when their size exceeded 1–2 m. However, a shadow from the tall cliff on the northwestern plot ‘masked’ some megaclasts and did not permit us to characterize them on an individual basis (Figure 5). Some redeposition of megaclasts could not be excluded for the southern plot, but the view of the deposits on the northwestern plot leaves impression of a ‘fresh’ and then undisturbed rockfall.
The Mediterranean is a ‘classical’ region for studies of coastal megaclasts and boulder deposits [9,10,11,12,13]. Particularly, megaclast accumulations have been reported from the Western Mediterranean continental and island coasts [66,67,68]. However, Ponza Island is of special importance because of two reasons. First, it represents lenticular, almost round-island distribution of the coastal megaclast deposits. Second, the latter originates from volcanic and volcaniclastic rocks. Therefore, finding this locality with the Google Earth Engine extends the regional knowledge of coastal megaclast deposits.
3.3. Example 3: Wetar Island (Indonesia; Banda Sea)
The locality corresponds to the Banda Sea coast of the Wetar Island in eastern Indonesia (Figure 1). There, Cenozoic volcanic, volcaniclastic, and reefal carbonate deposits crop out [69]. Presumably, their destruction by wave abrasion and weathering leads to megaclast creation; it cannot be excluded that some megaclasts were formed as a result of slope collapse and subsequent downslope transport. This means that the origin of this new locality can be highly complex, but the role of abrasion seems to be leading.
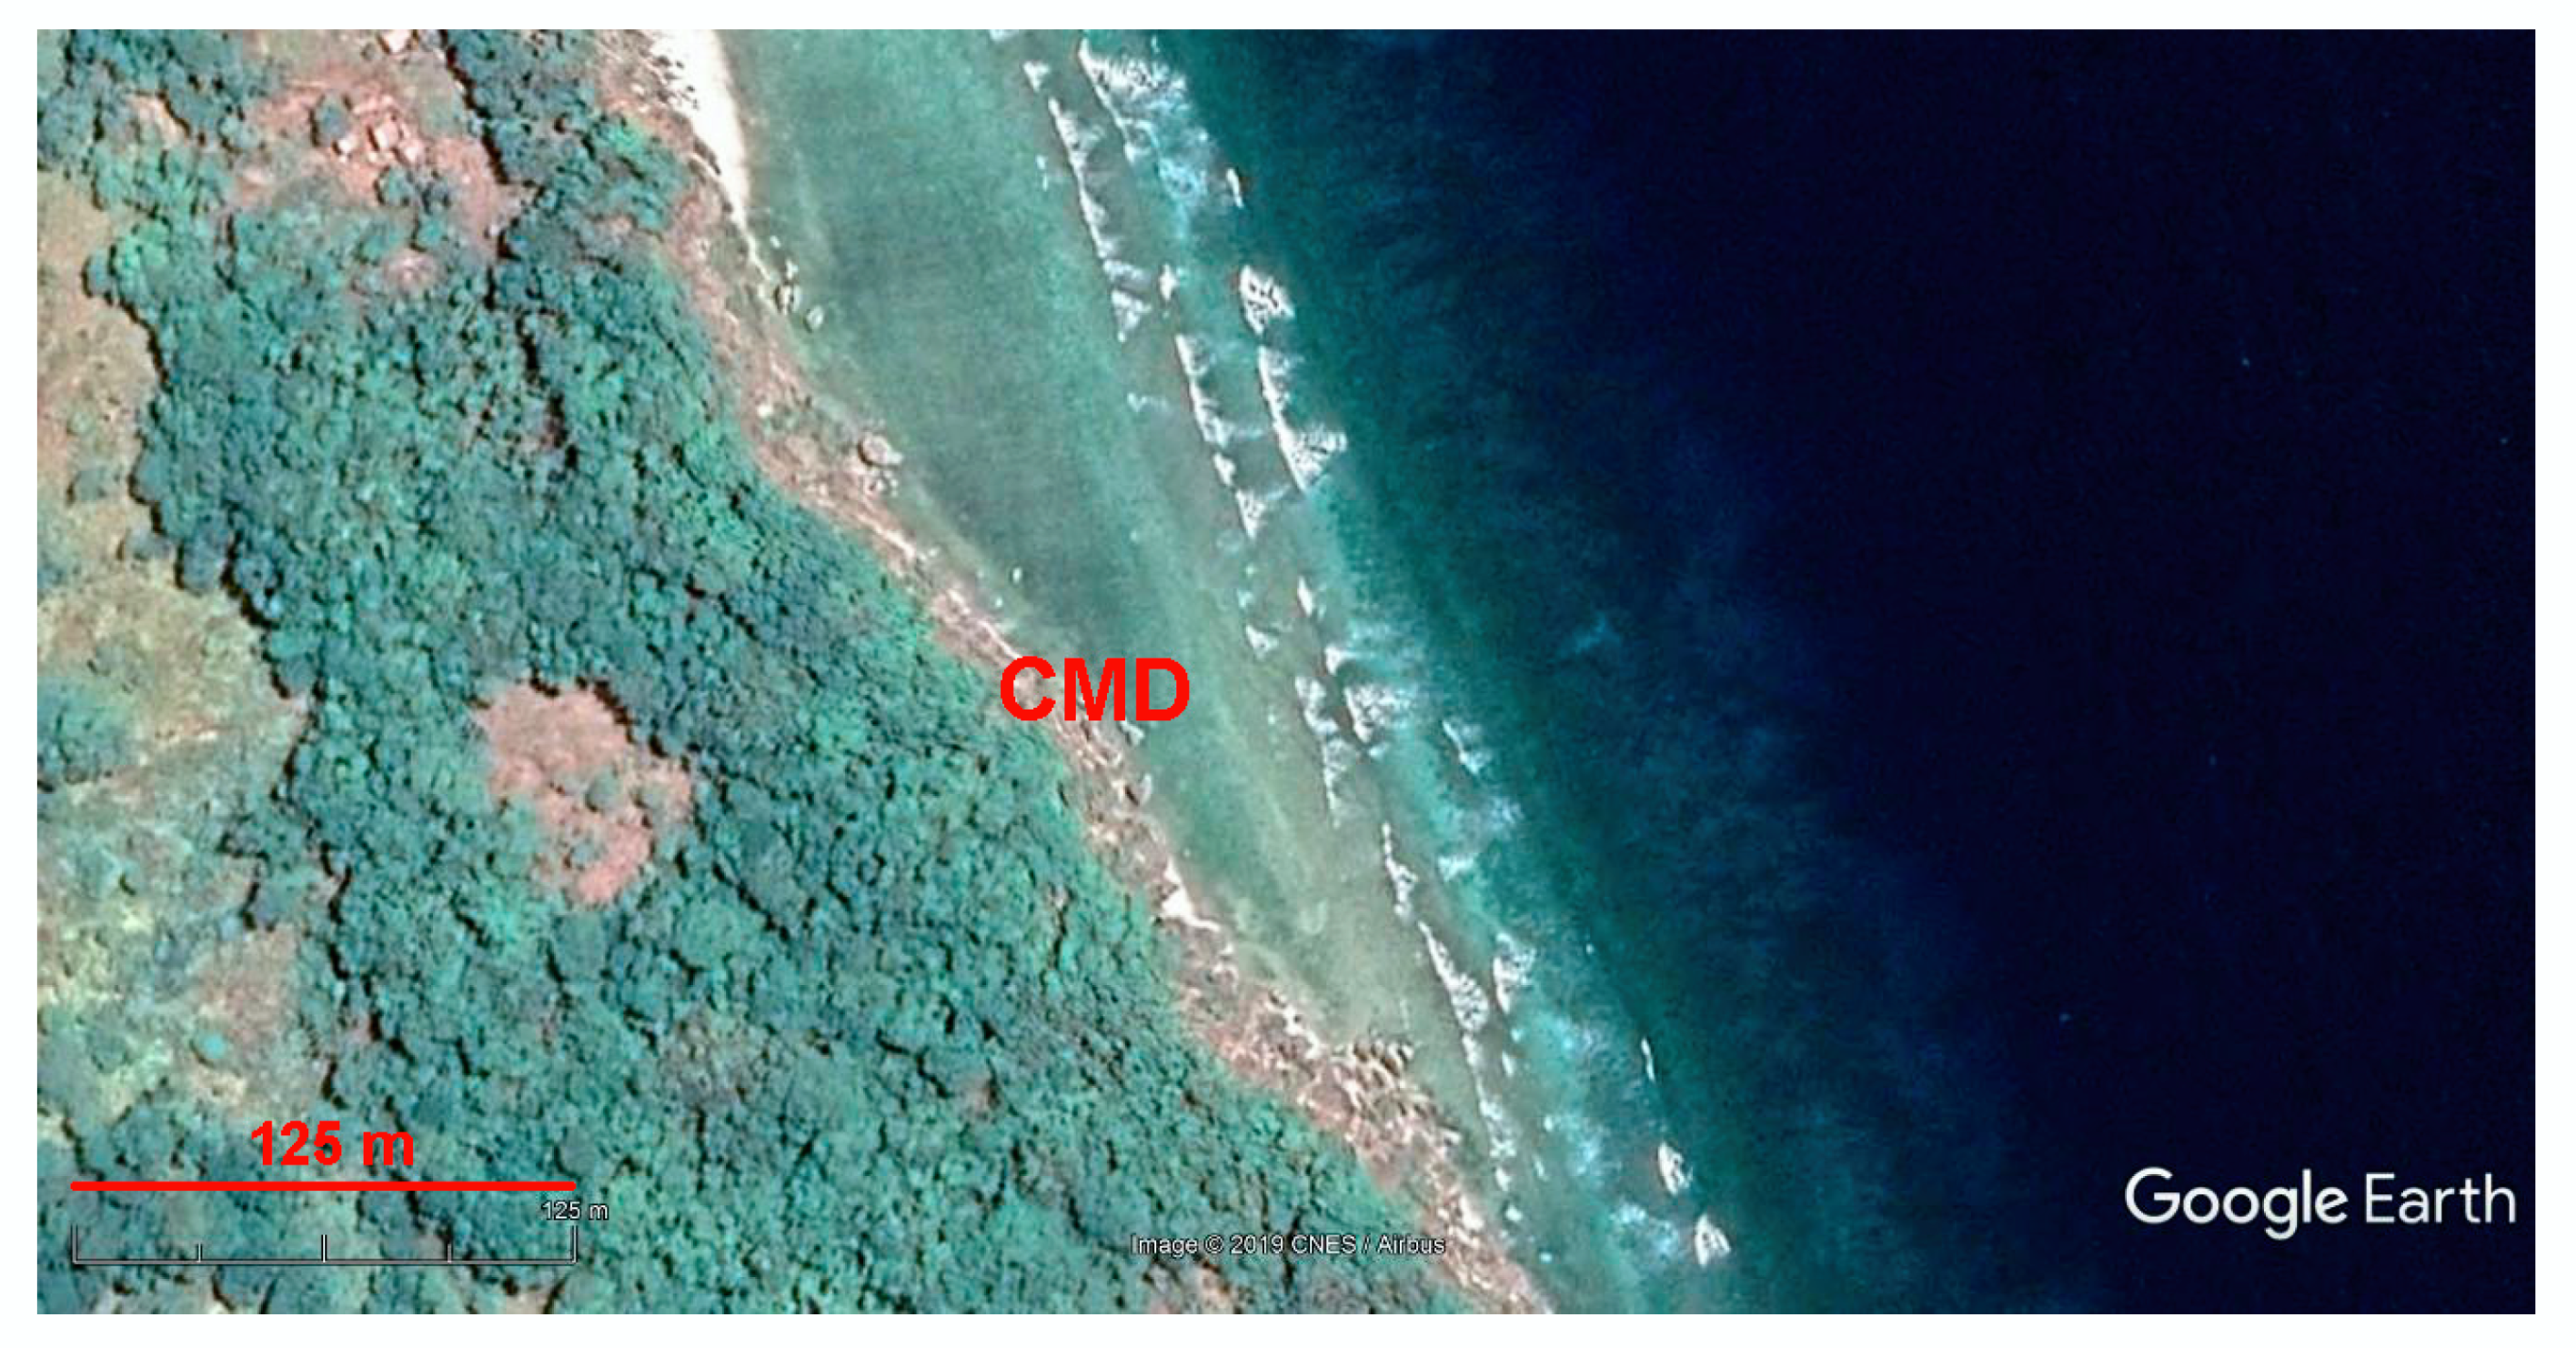
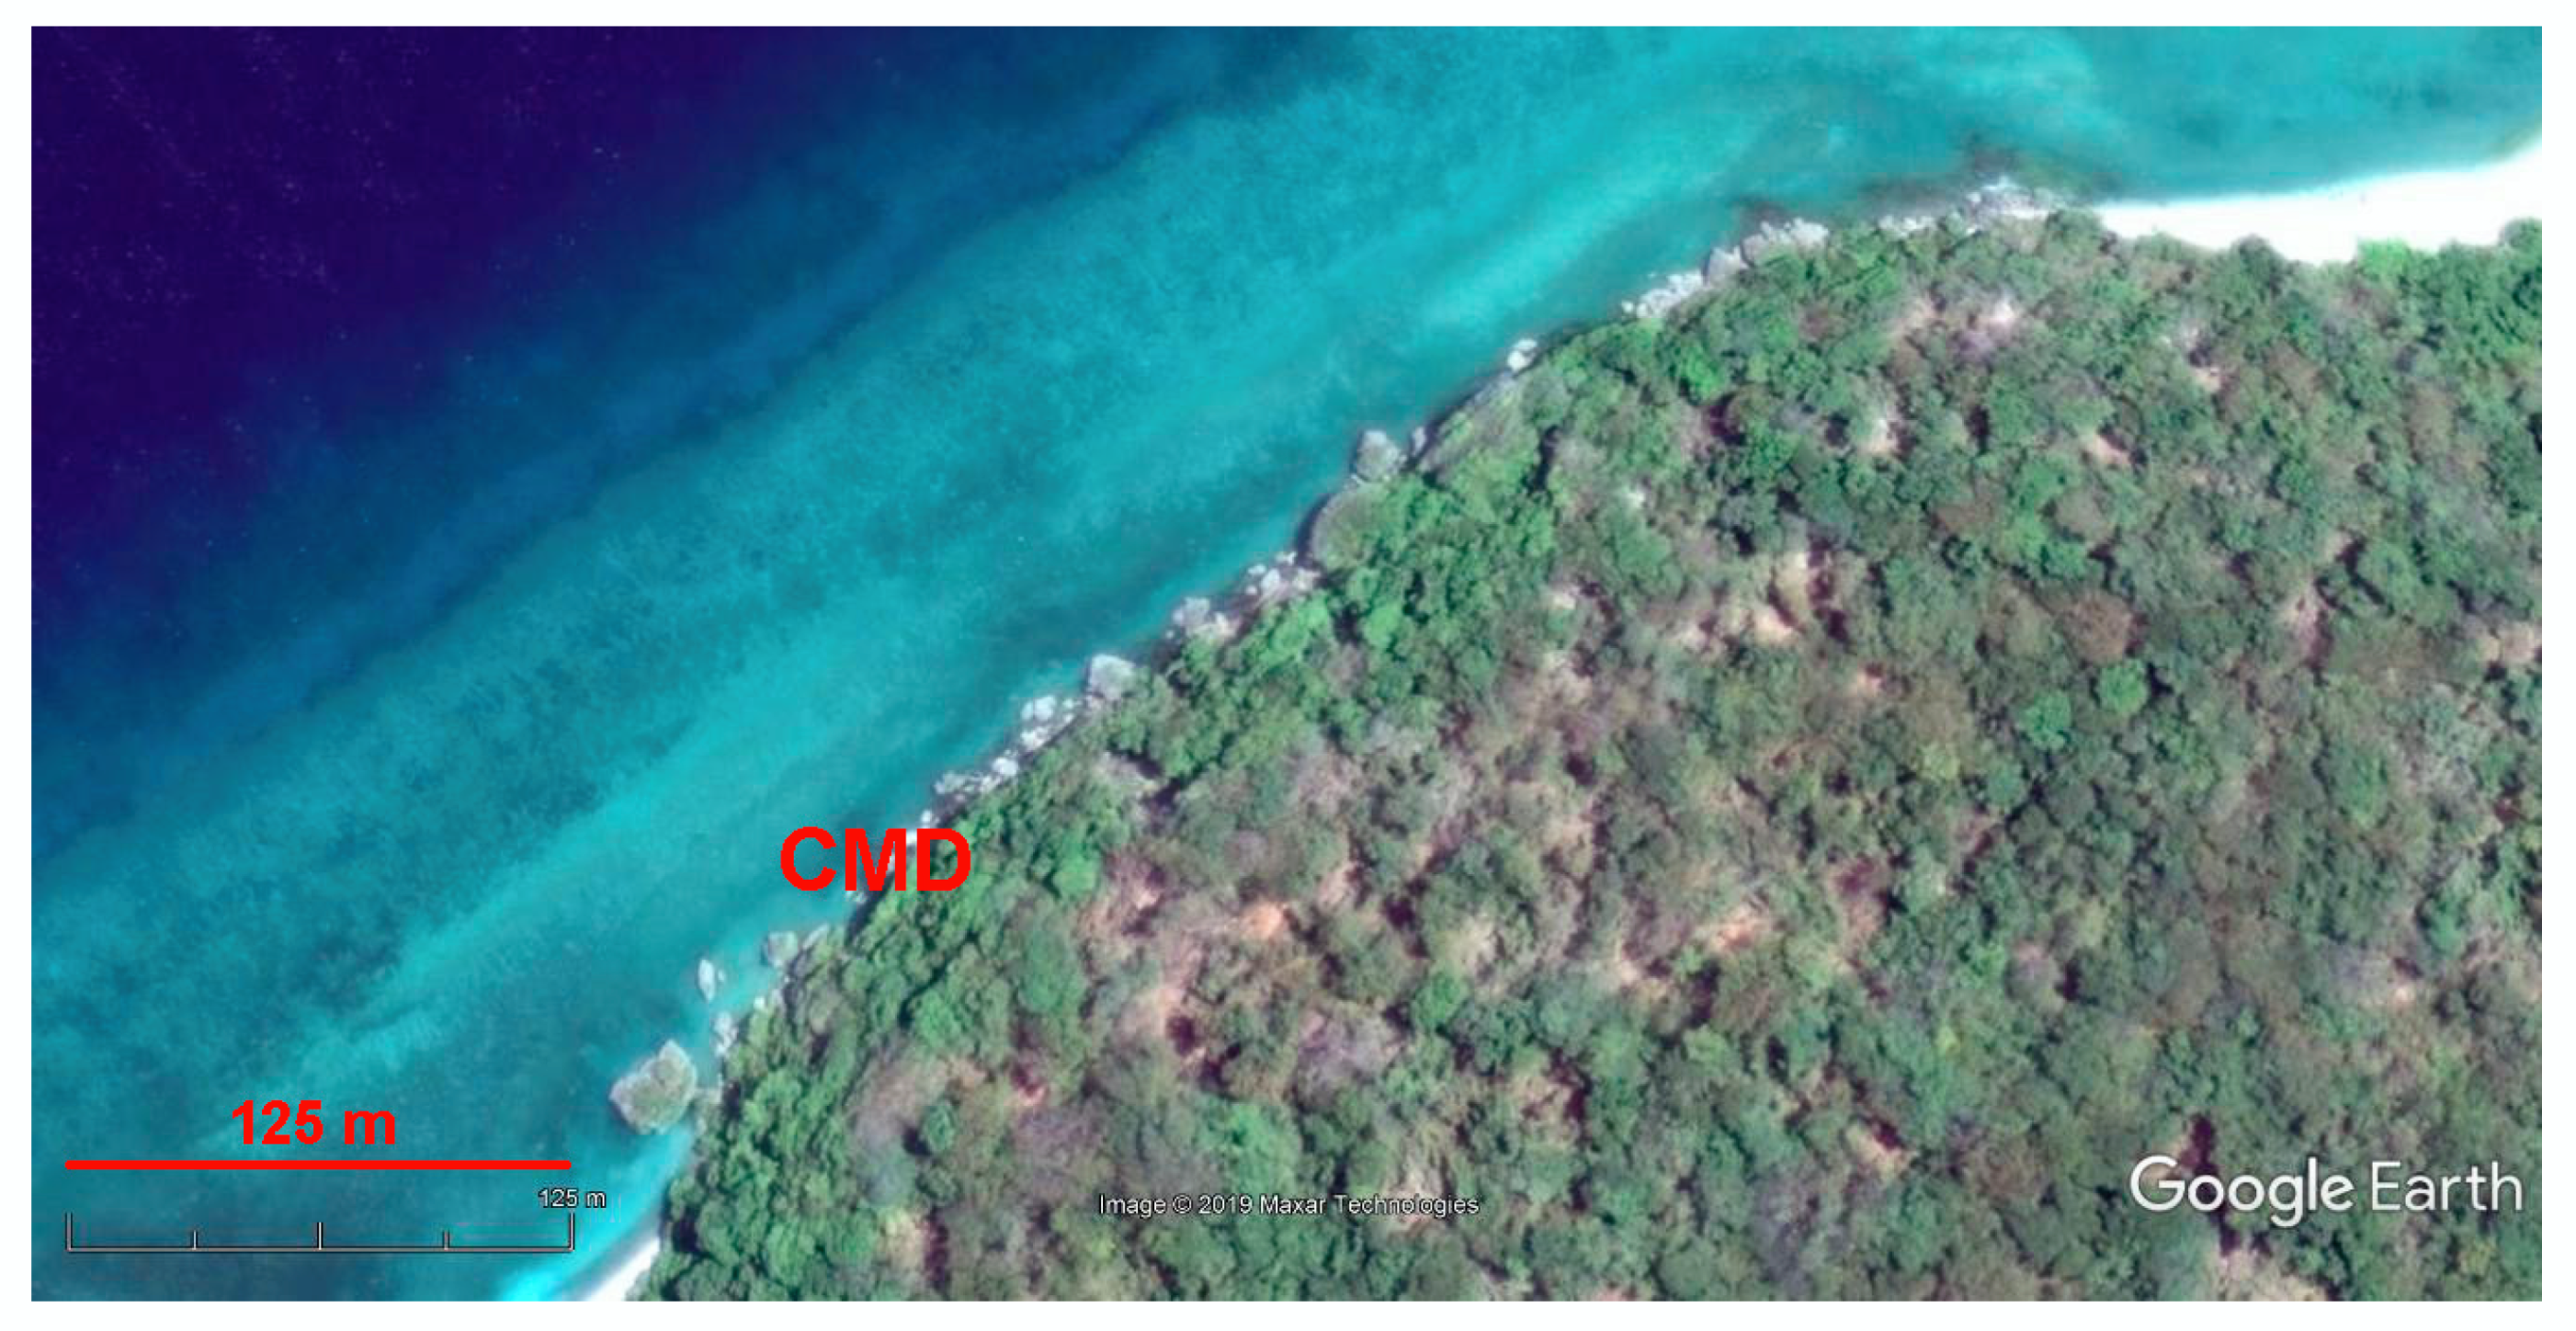
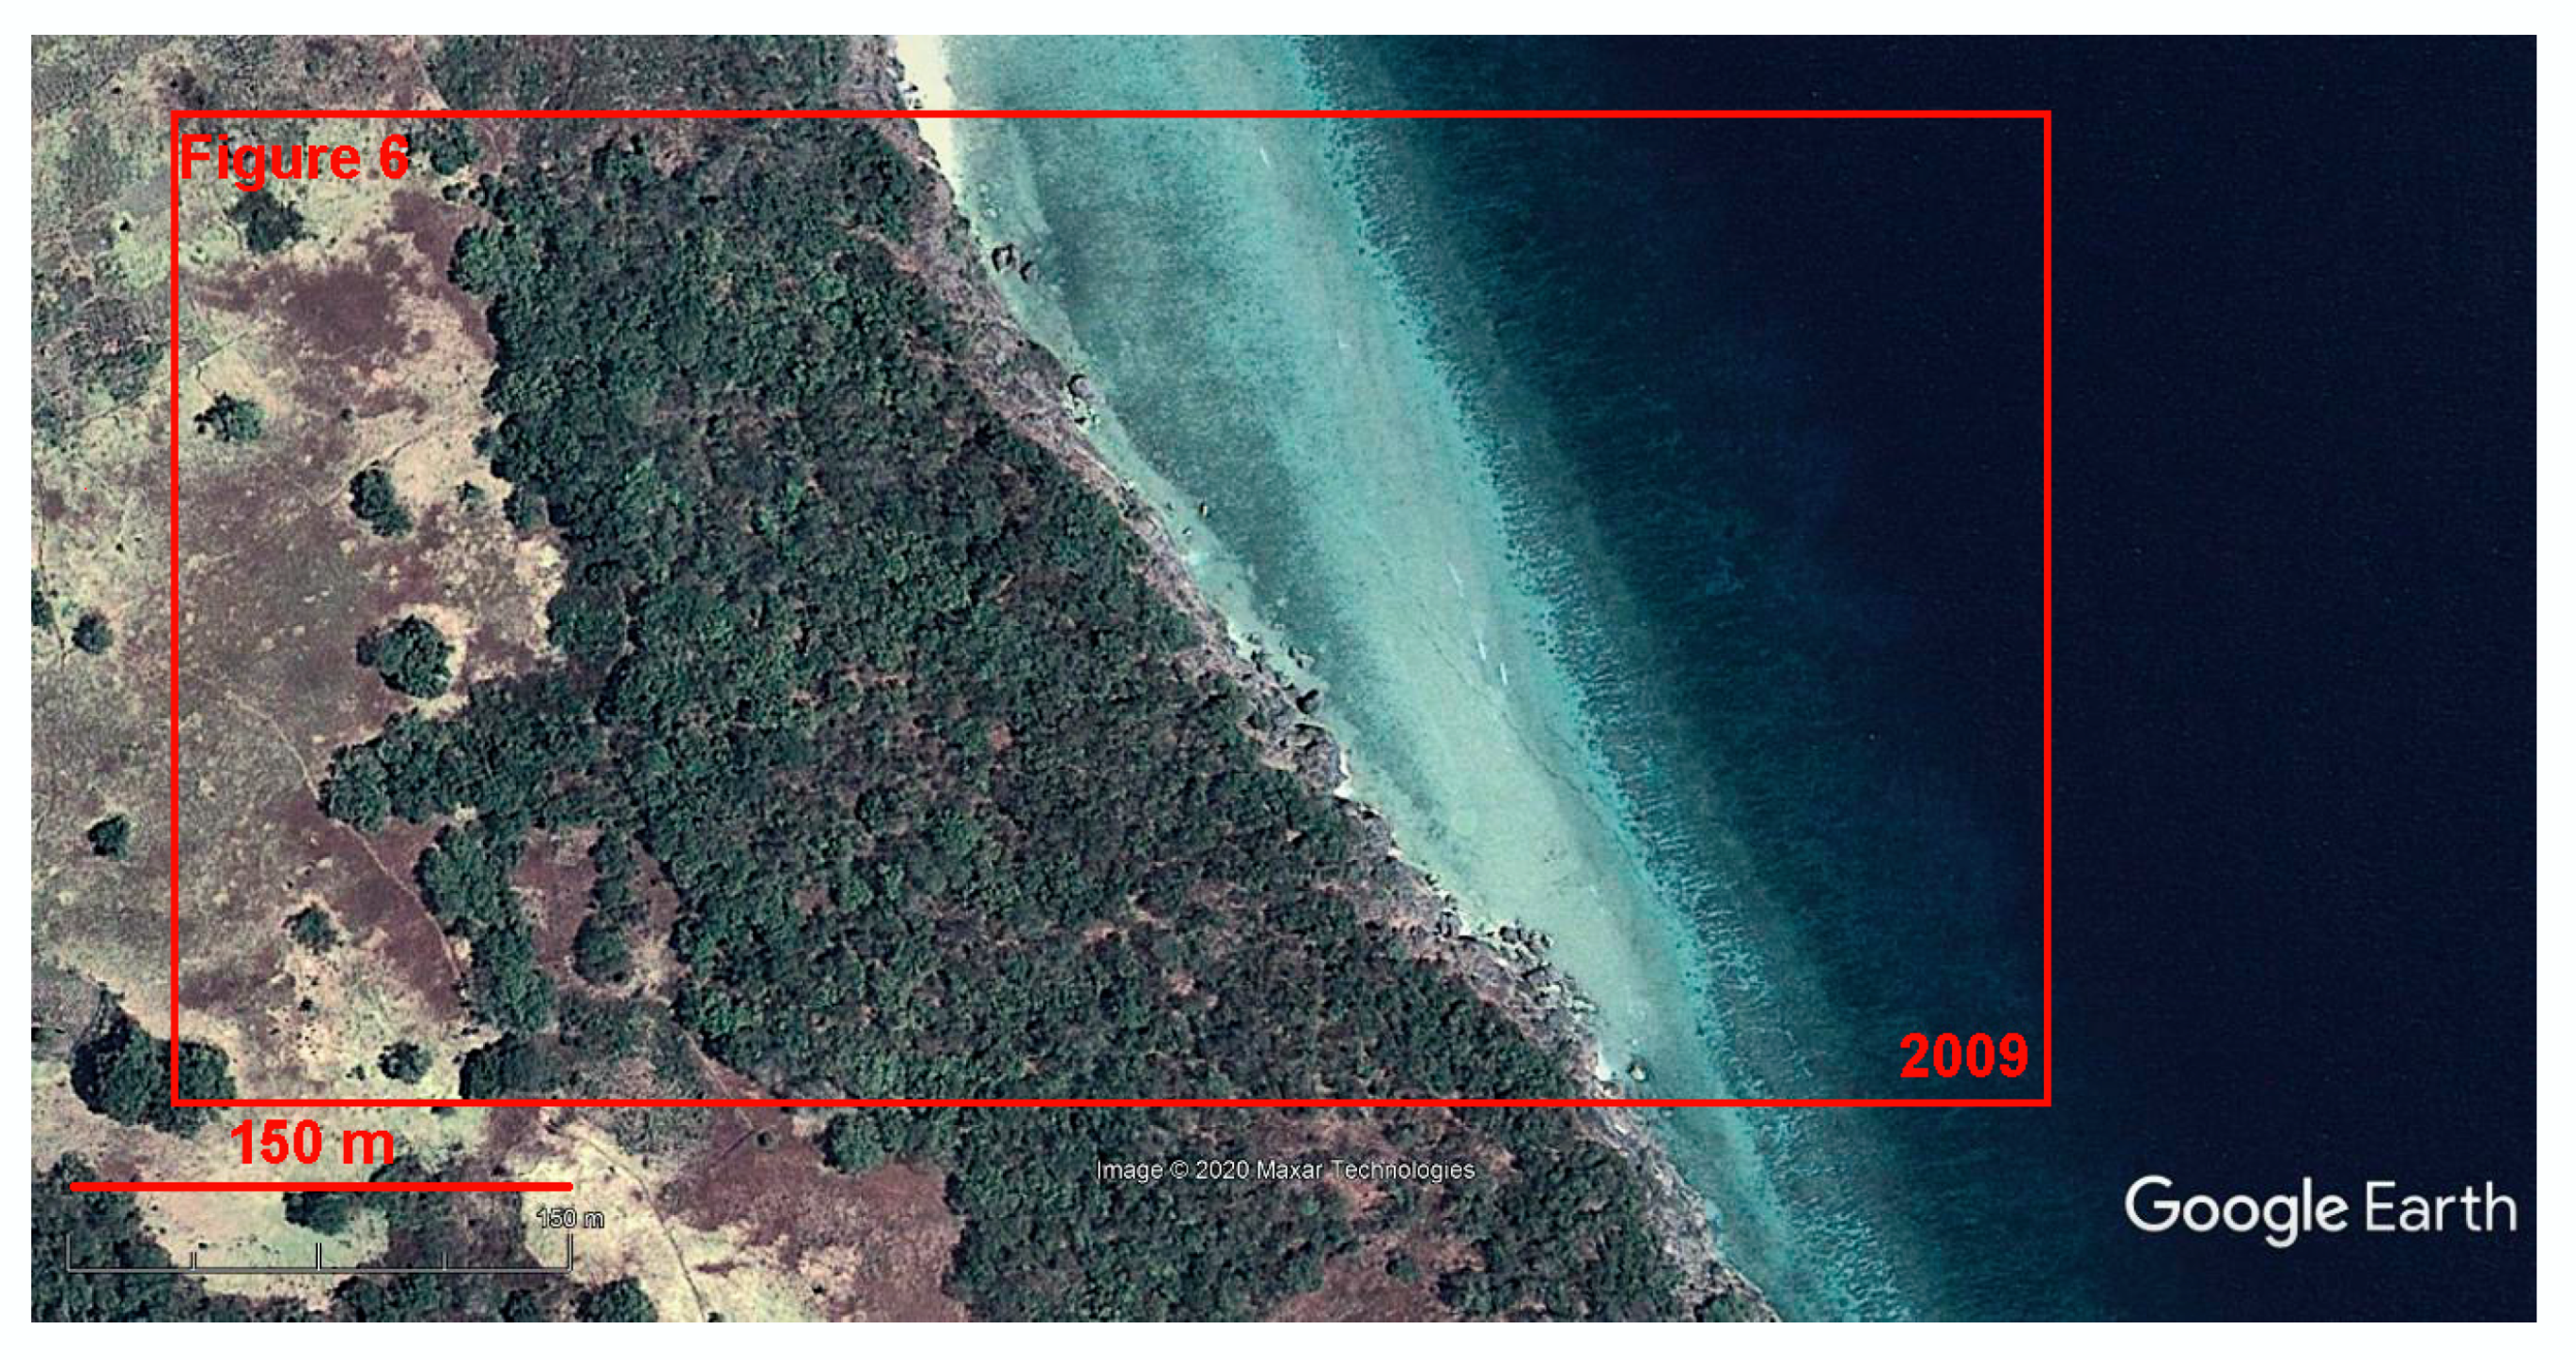
On the eastern plot, blocks with the maximum size of up to 10 m (the prevailing size was 3–5 m) occurred sporadically (Figure 6). These lay either individually or in small groups. The biggest stones were angular. The deposit package density was very low with regard to the distance between megaclasts (even when these occur in groups). These coastal megaclast deposits were restricted to the very shoreline. On the northeastern plot, the number of megaclasts was bigger (Figure 7). These were chiefly blocks of different size (commonly < 5 m), but there were also megablocks, the biggest of which reached 20 m in size. The particle angularity was well visible. The package density was moderate (even high in some places), but the deposits also occurred like a narrow ribbon along the shoreline. On the both plots, clasts >3 m in size were distinguished easily; the satellite image evidence is enough to confirm the presence of true coastal megaclast deposits. The resolution of the images permitted us to distinguish blocks from megablocks; boulders were not seen at all (it was unclear whether these exist). A different package density was visible without any difficulty. Size and shape of individual particles can be registered when their size exceeds 5 m. Better to say, these can be examined chiefly for large blocks and all megablocks. Dense vegetation cover of the island and, particularly, along the shoreline ‘masks’ the coastal megaclast deposits, but this does not preclude for megaclast accumulation tracing over the studied plots. The position and the orientation of megaclasts do not suggest against their resedimentation, and, if so, it cannot be excluded that high-energy events contributed to motion and destruction of these stones.
Coastal megaclasts have been reported earlier from many localities of Southeast Asia, including those of China, Taiwan, Thailand, Malaysia, Indonesia, and the Philippines [70,71,72,73,74,75,76,77,78,79,80,81,82,83,84,85,86,87,88,89,90,91,92,93,94]. Strong influences of tsunamis [95,96] and super-typhoons [97] contribute to the formation of such deposits. However, all this evidence has been obtained outside eastern Indonesia and chiefly on coasts open to either the Indian or Pacific Oceans. The Wetar Island locality sheds light on the coastal megaclast deposits formed in a distinct geographical setting, namely on the coast of a relatively small, intra-island sea, which makes addition to the regional knowledge of such deposits. Therefore, the Google Earth Engine permits extension of the available knowledge of megaclast occurrence in Southeast Asia.
3.4. Example 4: Humboldt o Coredo Bay (Colombia/Panama; Eastern Pacific)
The locality corresponds to the Humdoldt o Coredo Bay and its vicinities. It is situated on the Pacific coast of Central America, exactly at the border between Colombia and Panama, north of Jurado (Figure 1) where the Cretaceous-Eocene basement and volcanic arc complex dominate the local geological setting [98]. Wave destruction and weathering of hard parent rocks contributes to formation of multiple megaclasts. Apparently, abrasion is chiefly responsible for the origin of these deposits.
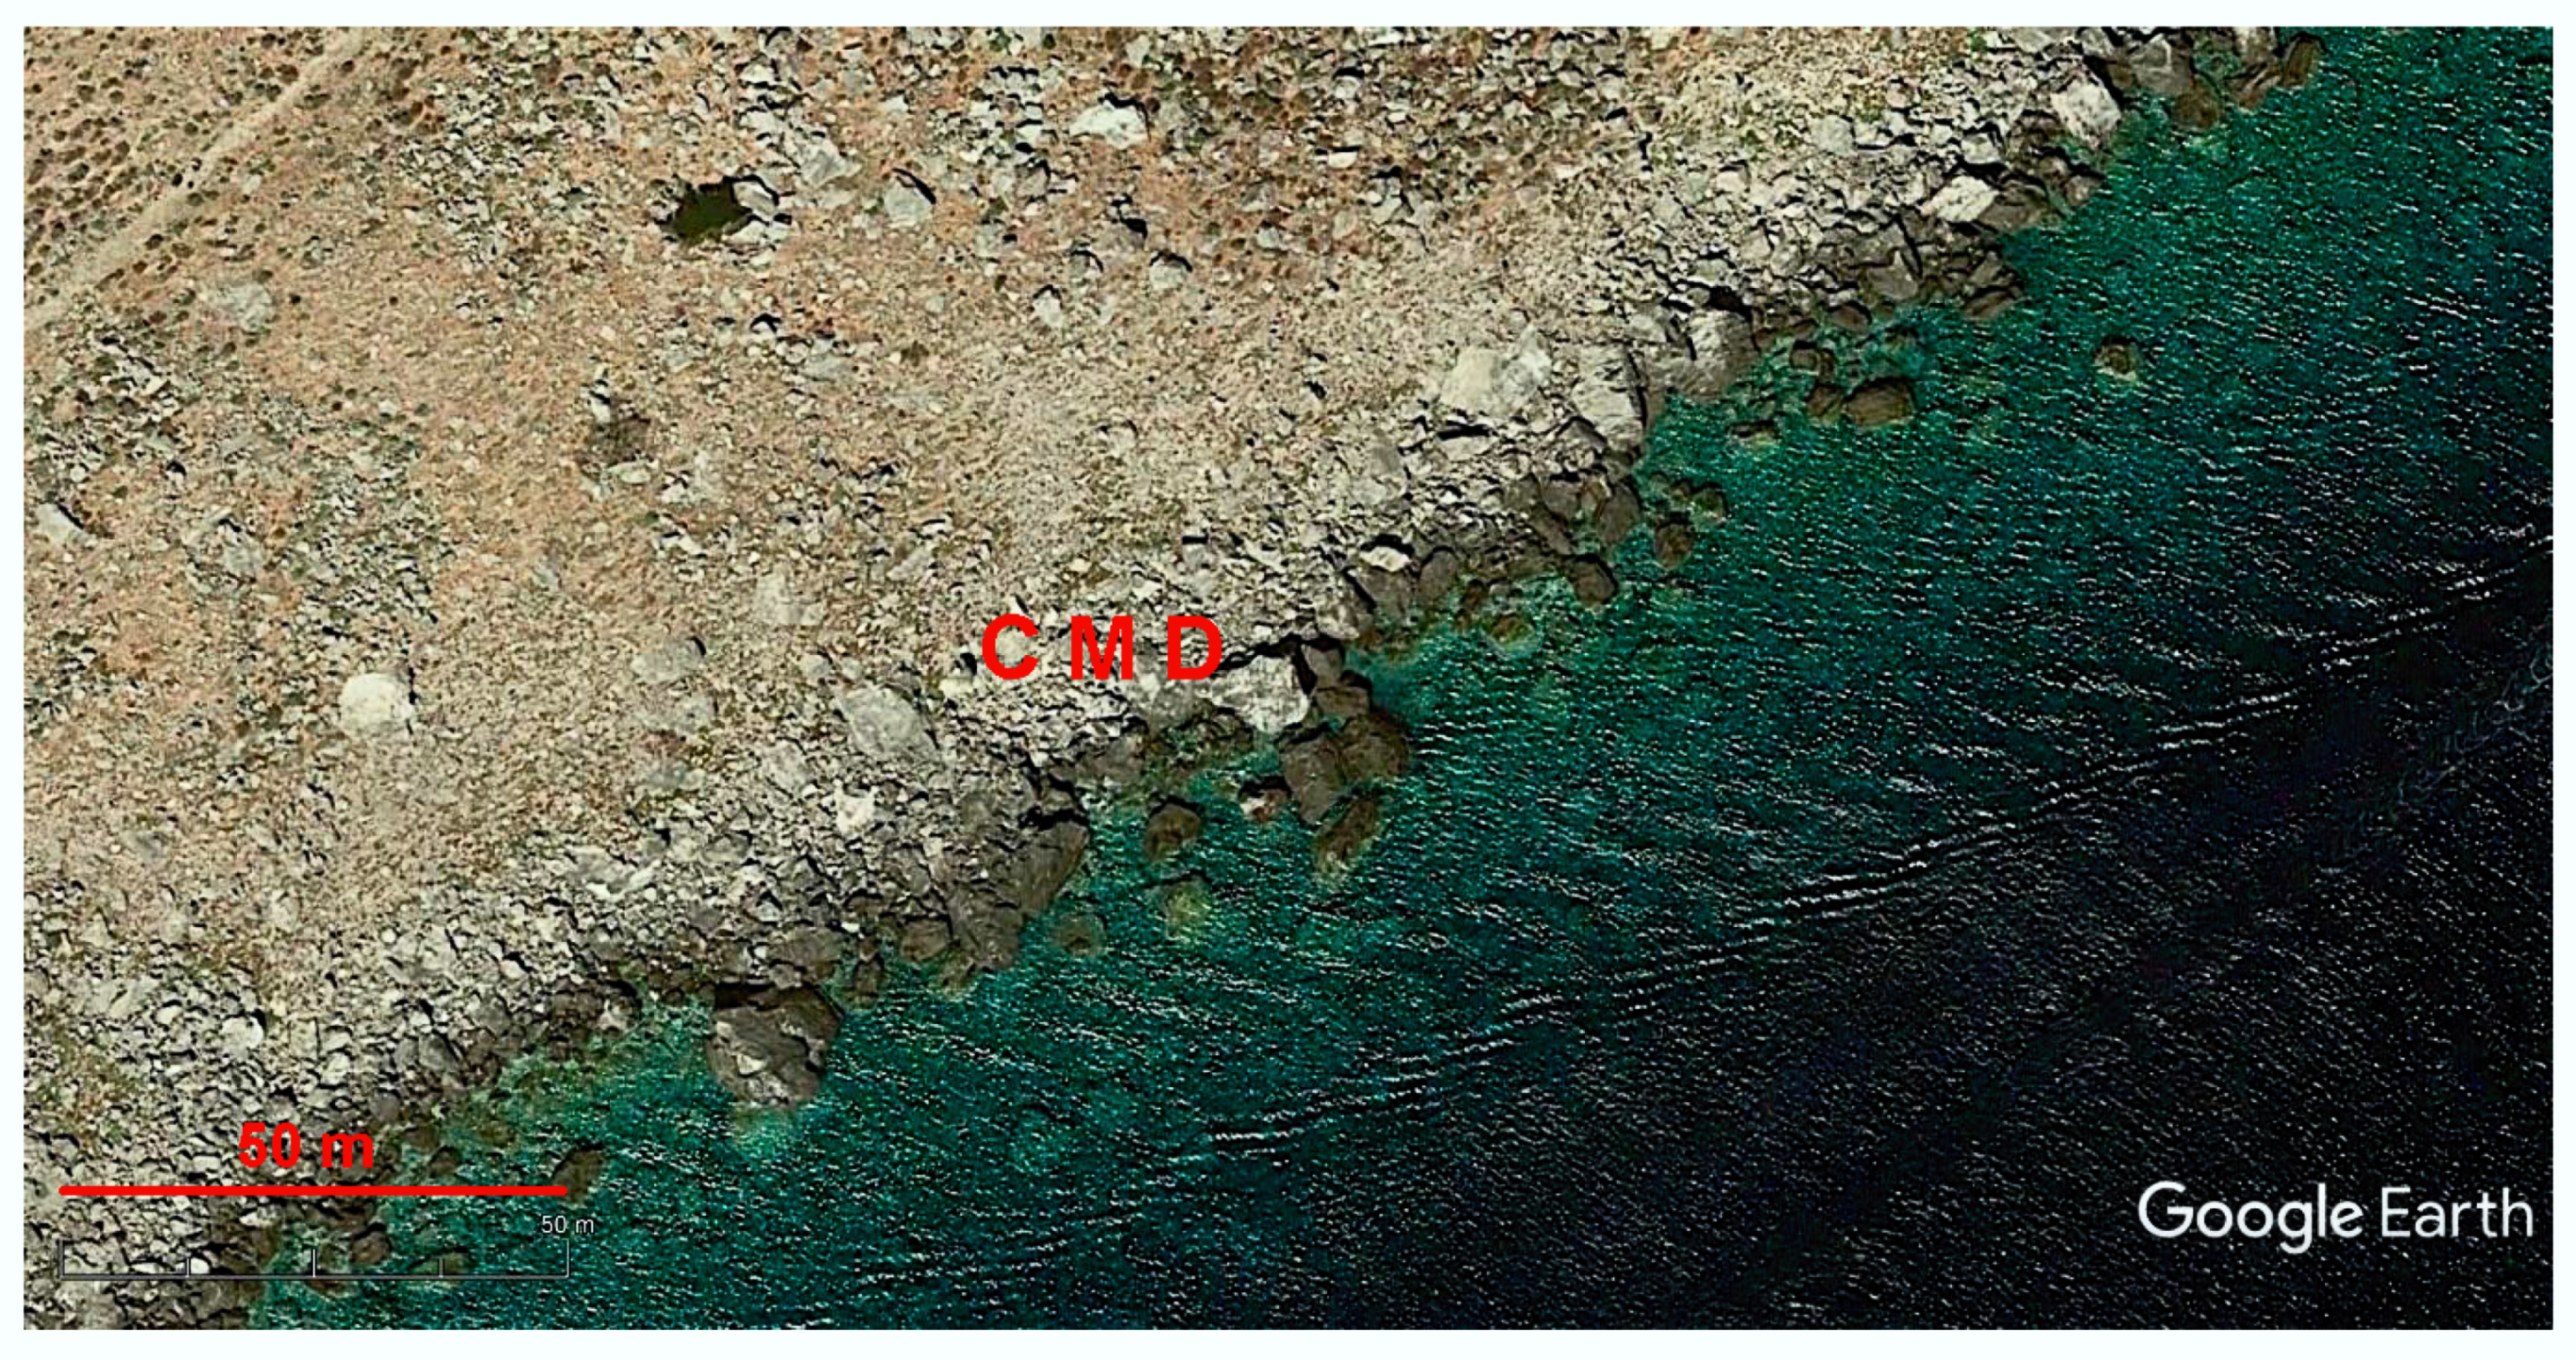
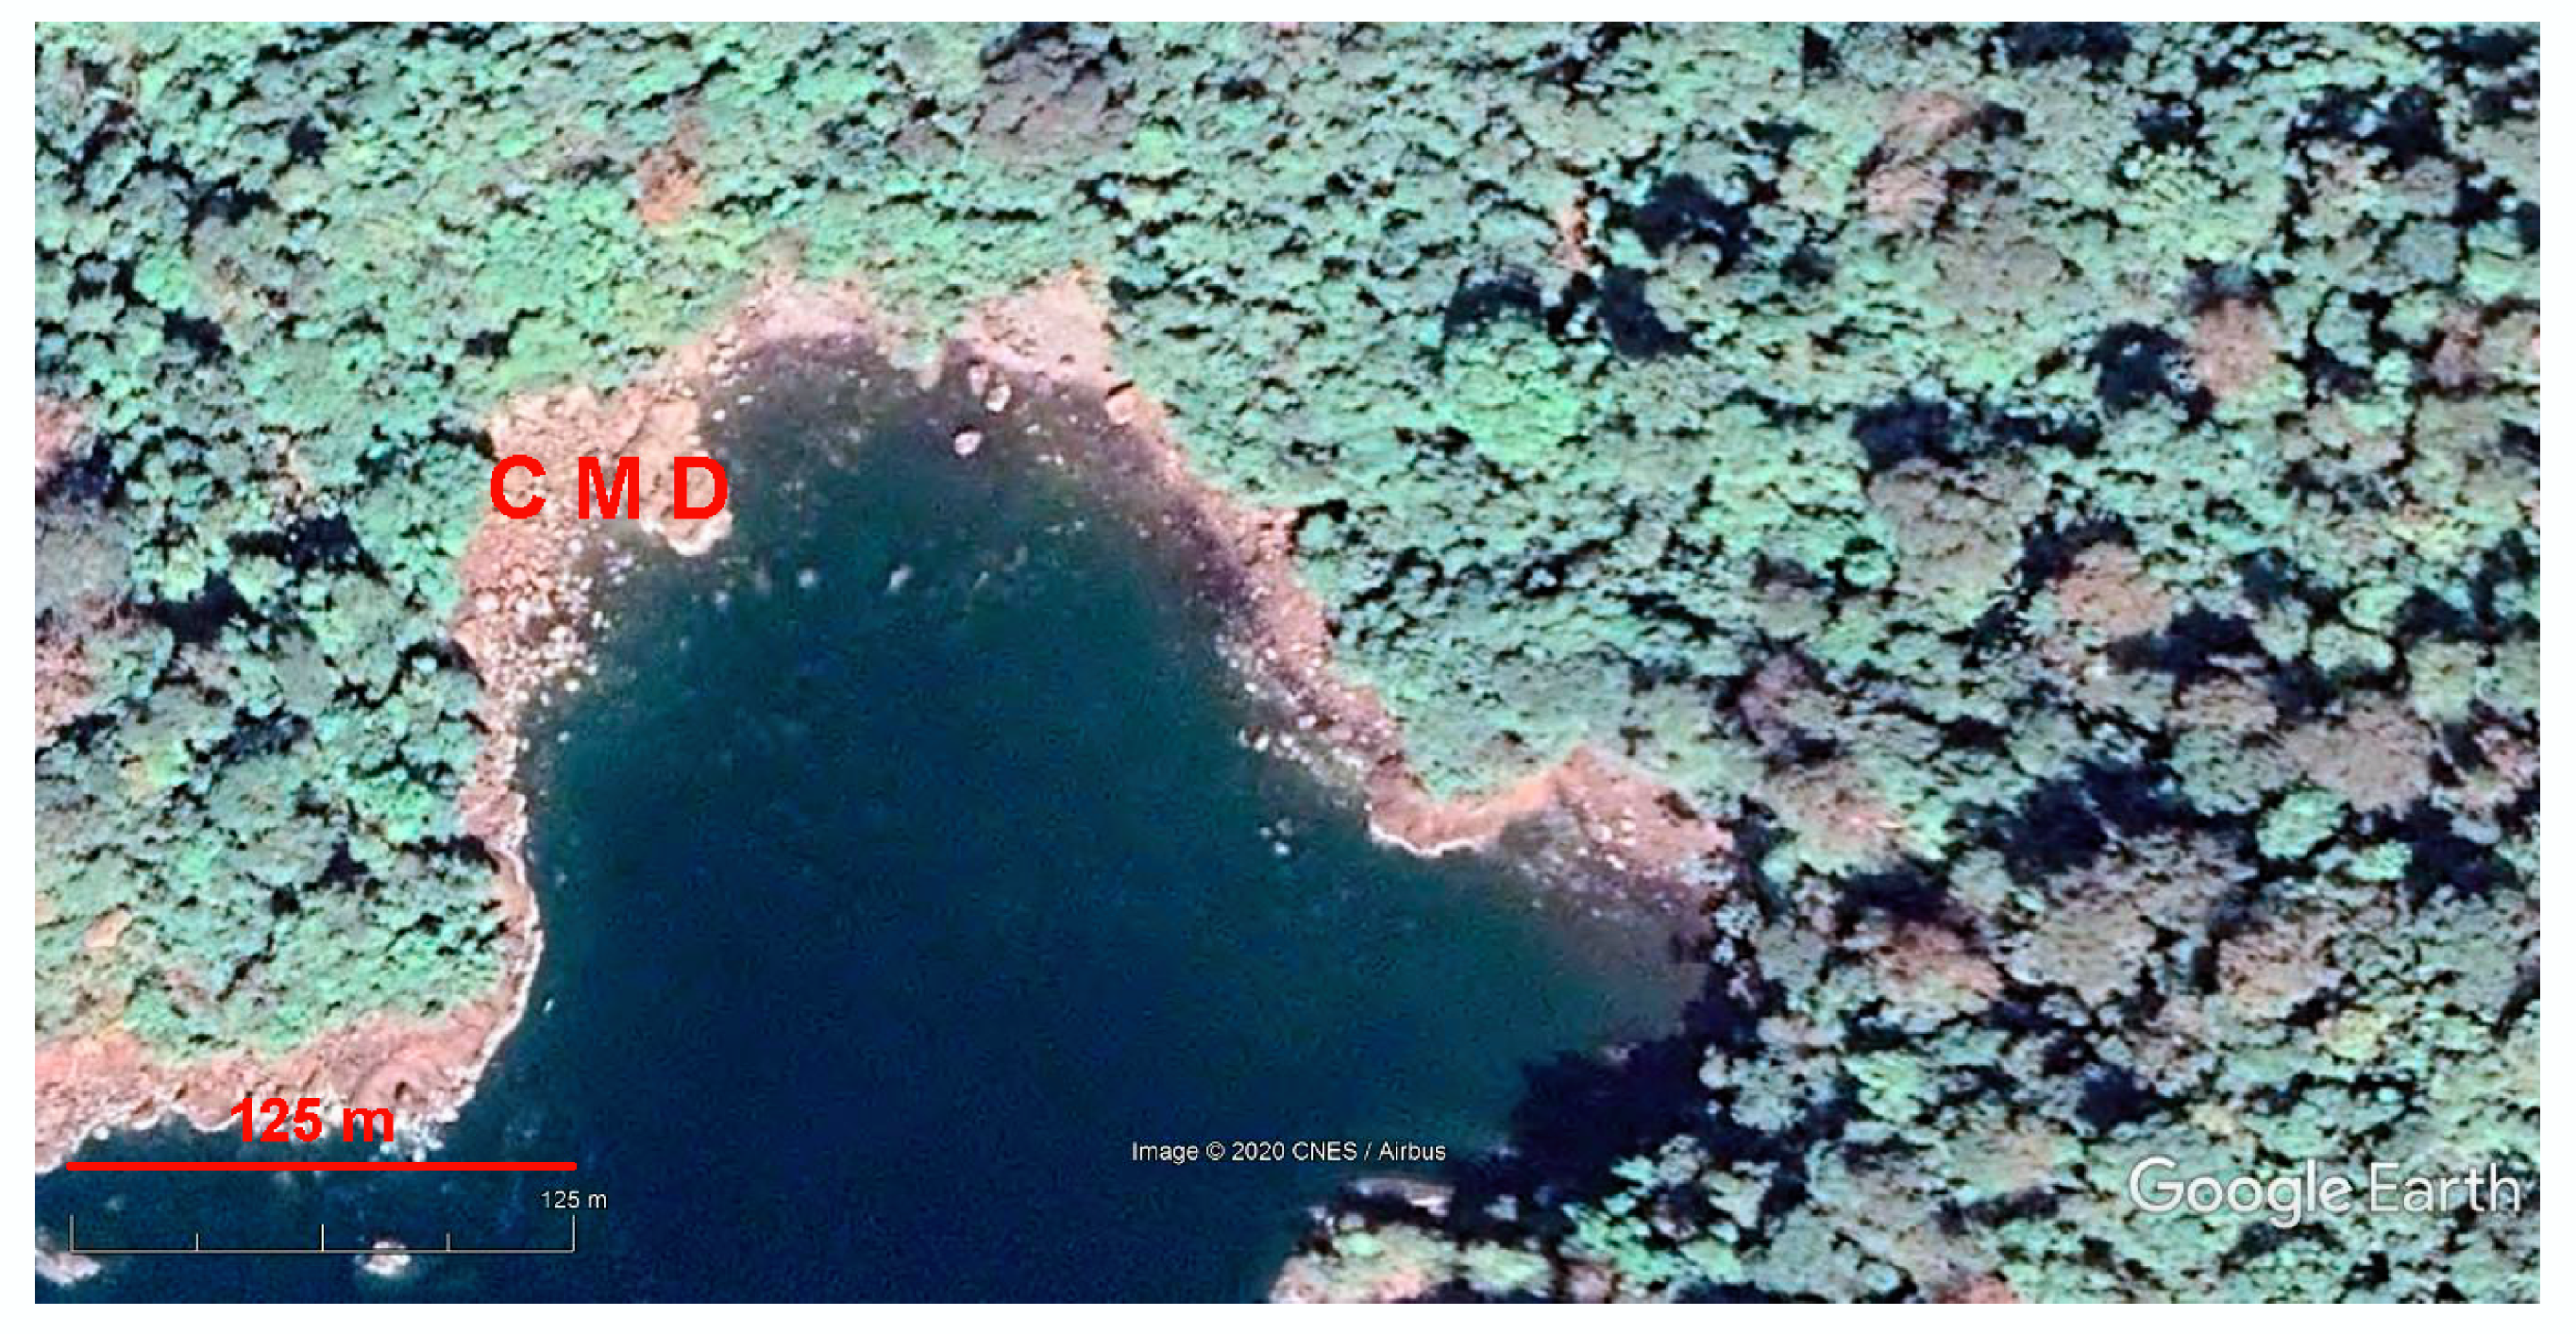
On the southern plot, small and medium blocks (typical size is <5 m) formed lenticular deposits around a small bay (Figure 8). The biggest particles were angular, but the shape of the majority of particles could not be recognized at the available resolution. The width of the ribbon of deposits differed, as well as their package density. A few huge blocks (but these did not reach the size of megablocks) lay individually in the central part of the plot. Generally, it is possible to record the deposits heterogeneity. On the northern plot, the coastal megaclast deposits were very similar to those described on the southern plot, with two exceptions: the mean size of blocks was bigger, and there were a few megablocks (up to 20 m in size or even more; Figure 9). On both plots, clasts >3 m in size were distinguished easily, and the presence of true coastal megaclast deposits was evident. The resolution of satellite images permitted us to distinguish blocks from megablocks; boulders were not seen at all, although these, presumably, exist. A different package density was visible without any difficulty. The size and shape of individual particles can be registered when their size exceeds 5 m (large blocks and megablocks). The difficulties were linked, first, to the ‘masking’ effect of the vegetation cover and, second, uncertainty with some features on the northern plot that could be either megaclasts or parent rock exposures (or semi-detached megaclasts). Presumably, the both difficulties will remain even in the case of a much higher resolution of satellite images. The spatial position and orientation of stones permitted us to hypothesize the absence of significant reworking, i.e., these seemed to be primary, undisturbed coastal megaclast deposits.
Previous megaclast studies on the Pacific coast of the Americas are scarce, and, particularly, focused on two geographical domains, namely the Baja California Peninsula in Mexico [4,5] and northern and central Chile [41,99,100]. If so, the information from the Humboldt o Coredo Bay locality fills significant gap in the regional knowledge of coastal megaclast deposits characterizing those of Central America. Finding this locality with the Google Earth Engine implies the existence of coastal megaclast deposits on the Pacific coast of Central America (probably, for the first time).
4. Discussion
4.1. Synthesis: Virtual Approach Opportinities and Limitations
The four examples given above illustrate the application of the Google Earth Engine to the identification and even preliminary description of coastal megaclast deposits. The approach seems to be promising. In all four cases, the deposits were identified and delineated without any difficulty and irrespective to the different resolution of satellite images. All study areas were new to megaclast research, and these were found on the basis of the only virtual exploration of the coastline, without consideration of any preliminary evidence. This approach can be used for visual surveying of the coasts and identification of localities suitable for subsequent field or virtual investigations (or both). Moreover, some basic characteristics of coastal megaclast deposits can be examined with the Google Earth Engine taken alone, although such a study cannot ‘replace’ in-depth field investigations to be undertaken further. These characteristics include the dominant particle size, package density, and spatial homogeneity versus heterogeneity of deposits. Individual, group, or lenticular occurrence of megaclasts can be also registered. As for the particle size, in all cases, it was not only possible to make a distinction of blocks from megablocks, but also to note the presence of smaller and larger blocks, i.e., to deal with subcategories of the main grain-size divisions. Some notions on the possible origin of the deposits are also possible. Importantly, the use of the Google Earth Engine permitted us a very quick survey of coasts. Apparently, one researcher can check up to a thousand kilometers of coastal zone for the presence of megaclast accumulations per 5–7 working hours. No field investigation can allow such a speed of work and so massive information gathering. Moreover, many areas will remain ‘untouched’ by megaclast research due to the relatively circle of the involved researchers and logistic restrictions. If so, it is better to know the position of the localities and to have the only preliminary characteristics of the deposits than to concentrate on only well-known and well-accessible localities studied for years.
As implied by the examples, virtual studies of coastal megaclast deposits with the Google Earth Engine face limitations of three kinds. First, the resolution of satellite images did not permit us to deal with boulders and other finer components of the deposits, and the presence of these components could not be proven in some cases. Second, the resolution of the satellite images available for the Hondarribia and Ponza Island localities allowed the size and shape documentation of all megaclasts, whereas the resolution of the satellite images of the Wetar Island and Humboldt o Coredo Bay localities permitted doing this for only huge blocks and megablocks, i.e., for the only part of the deposit. In the two latter cases, there were also difficulties with distinction between true megaclasts, semi-detached megaclasts, and exposures of parent rocks. This means that detailed investigations of coastal megaclast deposits and their quantitative descriptions with the Google Earth Engine are possible in only some cases. Third, there are local limitations of the approach like tall cliff shadows (the Ponza Island) or dense vegetation cover (Wetar Island and Humboldt o Coredo Bay). Anyway, all these limitations do not preclude from the documentation of the spatial occurrence of megaclast deposits along coasts of seas and oceans. When necessary, field studies can be undertaken later, and these studies can be coordinated effectively with the information obtained with the Google Earth Engine. In other words, the limitations are less important than the opportunities. Moreover, it is expected that the resolution of satellite images employed by the noted software will continue to increase in the nearest future.
4.2. Tourism Information as a Source for Geographical Justification of Virtual Surveys
The total world coastline is too lengthy taking into account continental and all island coasts, and even the Google Earth Engine does not make efficient its visual surveying for the purposes of the identification and description of megaclast deposits. The latter occurs locally, and it is sensible to focus on those areas, which seem to be promising for finding megaclasts. Some previous descriptions (‘occasional’ descriptions of megaclast deposits can be found in the literature) and geological, geomorphological, and geographical knowledge (for instance, the selection of coasts with tall cliffs and prone to severe storms, super-typhoons, and tsunamis) is helpful in many cases for the geographical justification of virtual surveys. However, some other, non-scientific evidence can be also considered.
The first opportunity is linked to photos provided by the users (first of all, tourists) of the Google Earth Engine, the geographical attachment of which is displayed directly on satellite images. Megaclasts and their accumulations are notable features, and these can be recognized easily on photos. Moreover, the latter can help in satellite image interpretation, i.e., for the correct description of the particle shape and package density, as well as for the distinction between true megaclasts, semi-detached megaclasts, and parent rock exposures; the content of boulders and finer components of deposits can be also registered. In the present study, the photos provided by the Google Earth Engine were helpful in the cases of the Hondarribia and Ponza Island localities. However, the number of the proper photos was limited for some remote, infrequently visited places, or these were not available at all.
The second opportunity that can be recommended for the geographical inventory of coastal boulder deposits is also relevant to tourism-linked information available online. Among various sport and tourism activities, bouldering has gained importance [101,102,103,104,105]. A lot of information on individual ‘boulders’ (these may be either isolated rocks, but also true megaclasts) has been accumulated. This information is easily accessible with the available on-line catalogues [106,107,108], and it permits finding coastal megaclasts and their groups, as well as their preliminary visual examination with the available images. For instance, there are typical coastal boulder deposits on the Ao Sane Beach in Phuket, Thailand [106]. These deposits consist of mixed angular blocks and boulders, and there are also angular blocks lying separately on a sandy substrate. In regard to the position of the later, resedimentation cannot be excluded. Such information can be of the utmost importance for finding promising areas to focus virtual surveys of coastal megaclast deposits.
4.3. Do Satellite Images Provide Data for the Quantitative Analysis of Coastal Megaclast Deposits?
Finding new localities of coastal megaclast deposits with the Google Earth Engine poses a question of more detailed analysis providing sedimentological information. The examples given above imply that some descriptions of such deposits are possible, but these are preliminary and too qualitative. Actually, in some cases, quantitative interpretations seem to be possible. For instance, grain-size distribution of megaclasts can be analyzed with statistical tools. There are four conditions that allow such an investigation. First, the resolution of satellite images of the study area should allow unequivocal recognition of particles with the size of 1–2 m (minimal size of megaclasts). Second, there should be not any ‘masking’ effects of shadows, vegetation, etc. Third, the majority of megaclasts should be oriented subhorizontally because vertical orientation does not permit the measurement of the maximum size. Fourth, megaclasts should form a relatively thin layer’ alternatively, the lowermost particles covered by the other blocks cannot be measured.
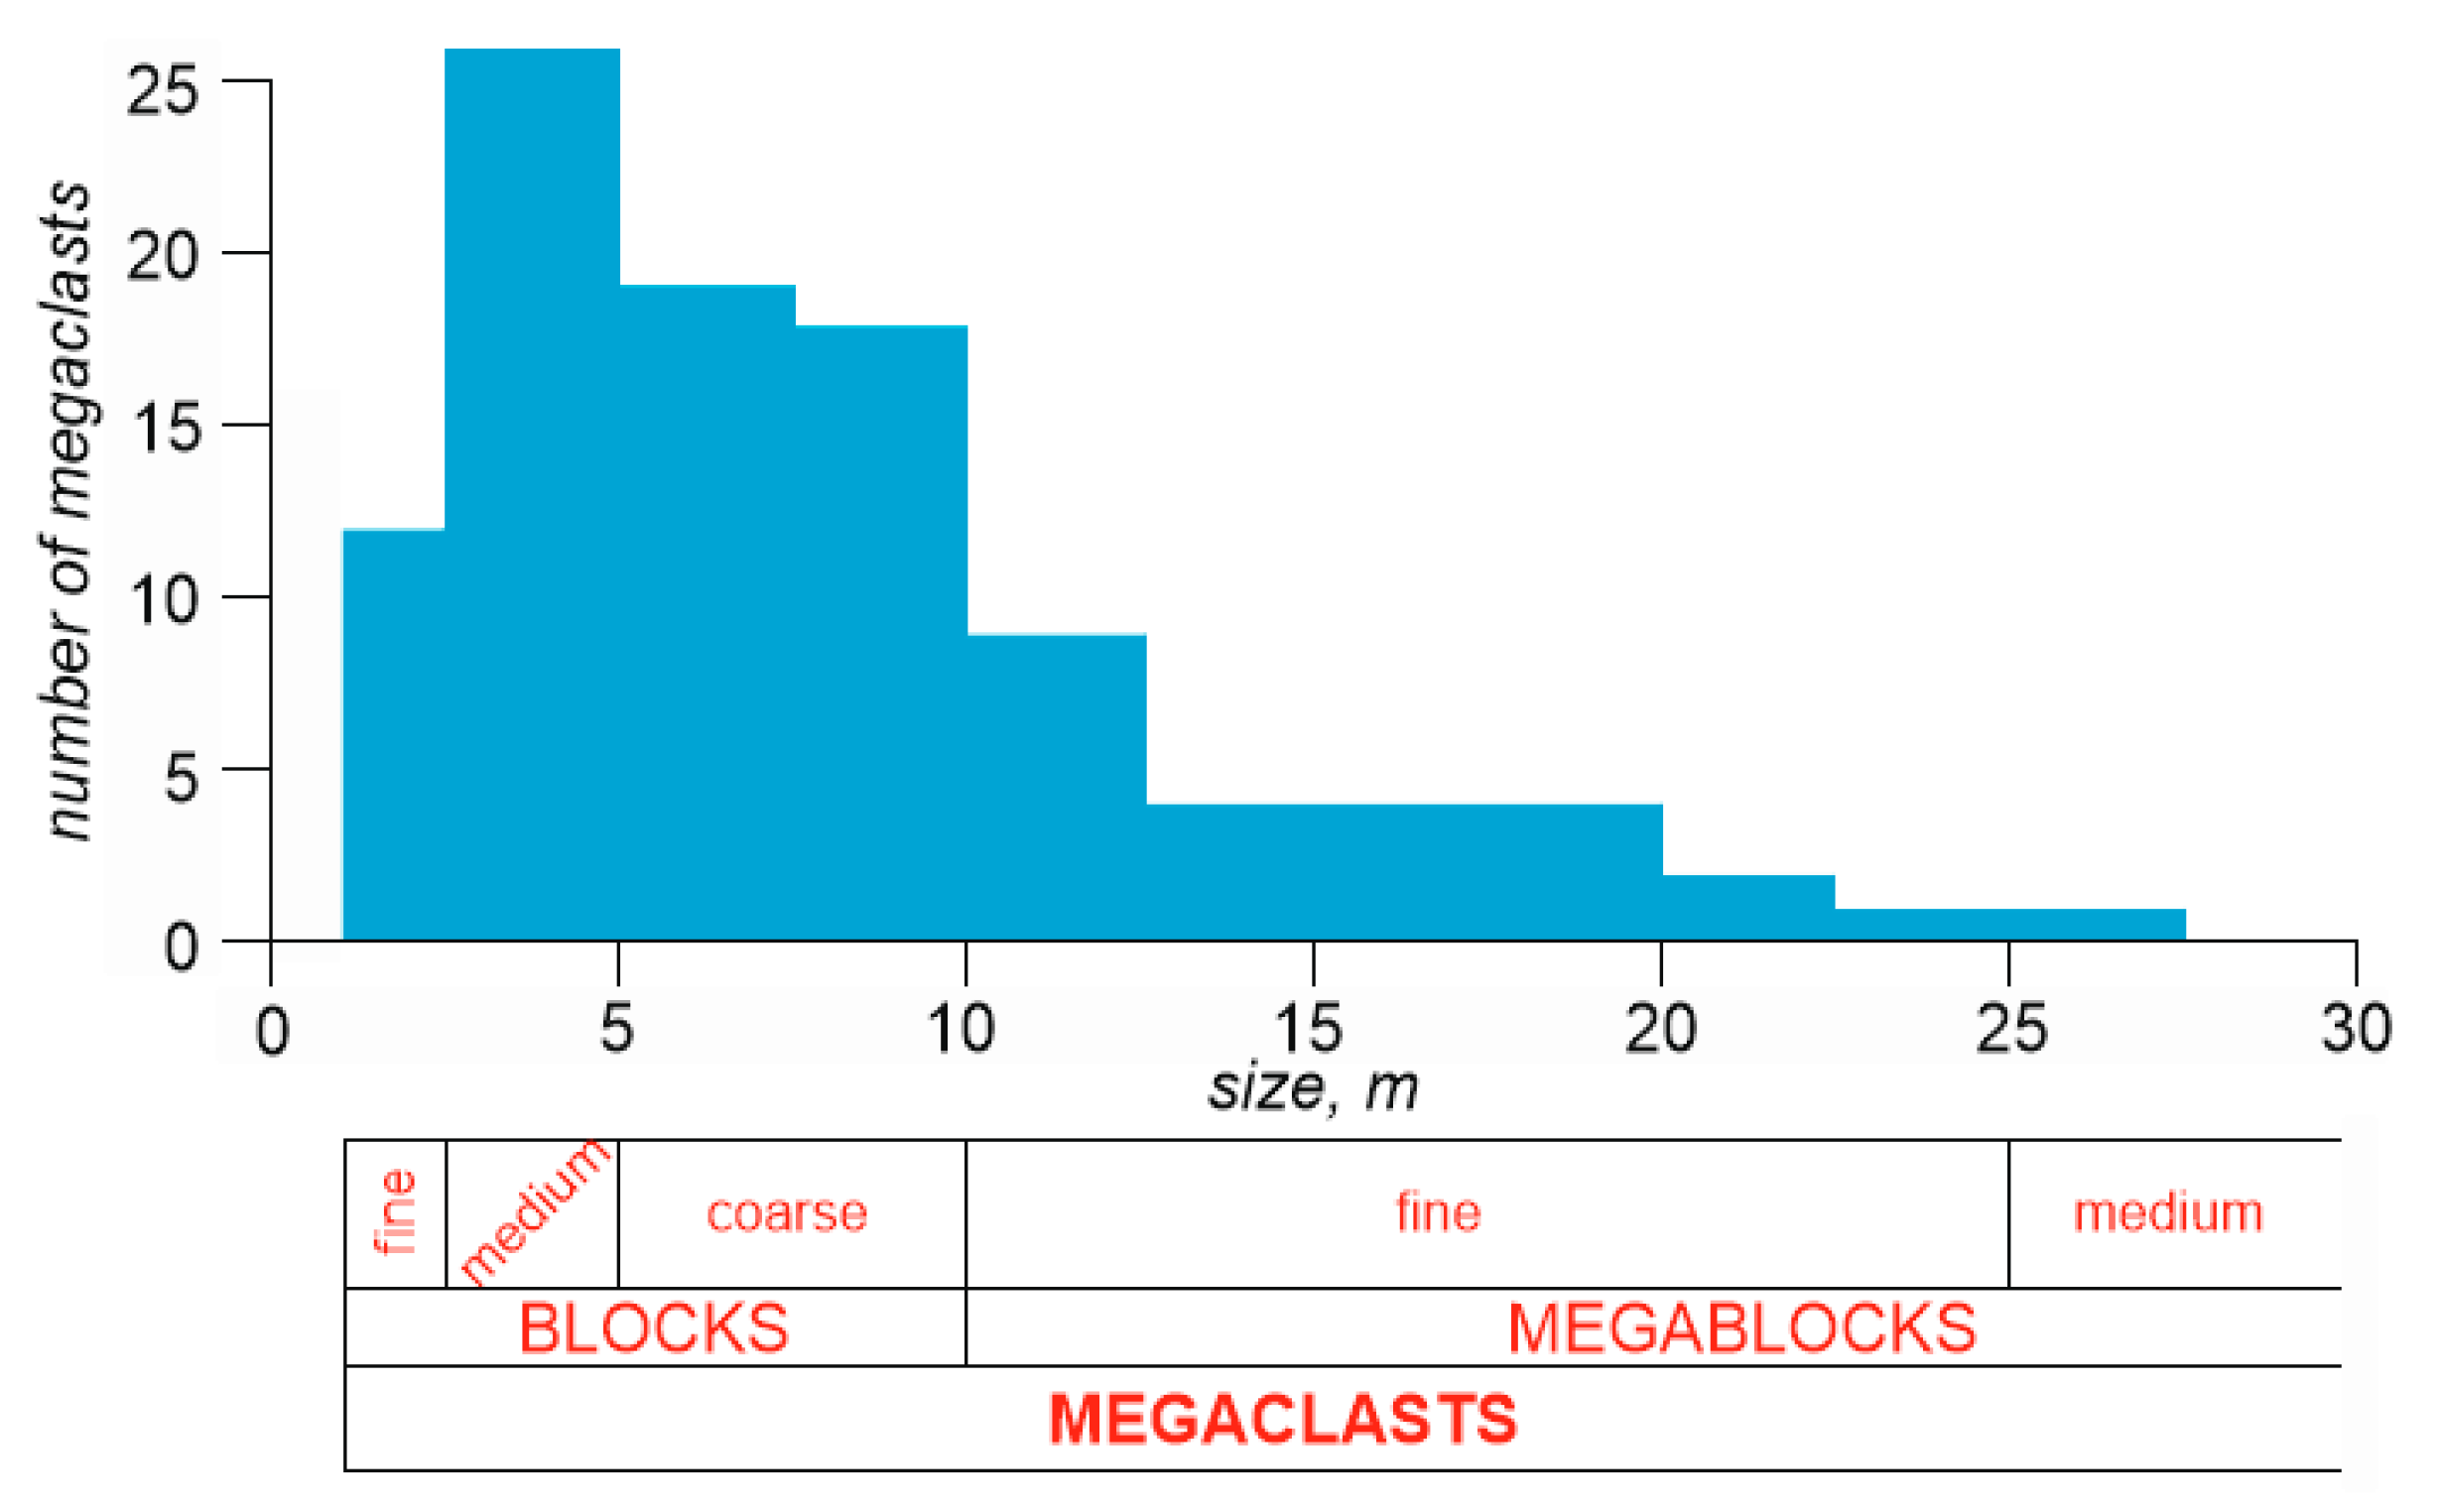
From the four examples considered in this study, the only Hondarribia locality satisfied all four conditions outlined above. To demonstrate the efficacy of satellite image analysis, the western plot of the locality (Figure 3) was considered. The Google Earth Engine provides the option of the measurement of objects directly on a satellite image. The maximum size of 100 megaclasts was measured with this tool on the chosen plot. Apparently, the measured particles constituted about 70% of all megaclasts visible on this plot. The size of megaclasts varied between 1.0 and 26.2 m. The mean size was 7.8 m, and the median size was 6.3 m. These values corresponded to coarse blocks, according to the classification of Bruno and Ruban [16]. The grain-size distribution of megaclasts is shown on a histogram (Figure 10). The majority of particles had the size of 2.5–5 m, i.e., these were medium blocks. However, coarse blocks (5–10 m) and fine megablocks (10–25 m) were the most common. Generally, these coastal boulder deposits included 37% of coarse blocks, 26% of medium blocks, 24% of fine megablocks, 12% of fine blocks, and 1% of medium megablocks, i.e., it was dominated by the particles with the size of 2.5–25 m, which indicates on a restricted sorting. Undoubtedly, this deposit also bore some finer components like boulders, gravels, and even sand, but these were invisible on the satellite image. Anyway, the dominance of the noted megaclasts in these deposits was indisputable.
4.4. Satellite Evidence of a Decade-Long Stability of Coastal Megaclast Deposits
The modern studies of megaclast focus much (even over-emphasize) on their origin and, particularly, their relevance to extreme events such as storms and tsunamis [4,5,6,7,8,9,10,11,12,13,19,20,21,22,23,24,25,26,27]. Evidently, these studies deal with the dynamics of the coastline and megaclasts themselves. The Google Earth Engine gives exceptional opportunity to contribute to such investigations, as a time series of satellite images is available. This means that direct comparison of the views of some areas at different time slices is possible. Three limitations are as follows. First, ‘old’ satellite images are not available for all areas and the date of these images differs for different areas. Second, the resolution of ‘old’ images can be lower than that of the current images. Third, due to a different time of image making, shadows, vegetation, and, importantly, water level may look differently. However, the third problem can be overcome in many cases.
In order to understand the importance of the analysis of the image time series for the understanding of the dynamics of coastal boulder deposits, the new localities identified in the present work were taken as examples. ‘Old’ satellite images (captured 10–20 years ago) of appropriate resolution are available for three of them (Hondarribia, Ponza Island, and Wetar Island—one plot was selected for analysis in each case). However, in the only case of the Ponza Island, the maximum appropriate resolution of the ‘old’ image was the same as that of the ‘new’ image. In two other cases (Hondarribia and Wetar Island), the resolution of the ‘old’ image was lower, but it allowed recognition of the principal features, i.e., megaclasts, via comparison to the higher-resolution ‘new’ image. Megaclasts from the western plot of the Hondarribia locality occupied the same position in 2001 (Figure 11) as in 2018 when the currently available image was captured (Figure 3). Apparently, the number of blocks and megablocks did not change, although some of them had worse visibility on the ‘old’ image because of the higher sea level (apparently, the time of tide). No changes were also found between 2007 (Figure 12) and 2017 (Figure 5) on the northwestern plot of the Ponza Island. Moreover, the ‘old’ image was of better quality in this case. The shadow from a tall cliff did not ‘mask’ a part of the deposits, and the better seawater transparency permitted us to document that up to a quarter of the deposits stretch to the submarine environment. Finally, nothing related to megaclasts changed on the eastern plot of the Wetar Island between 2009 (Figure 13) and 2019 (Figure 6).
The evidence presented above implies a decade-long stability of the coastal megaclast deposits in the new localities. Megaclasts were not destroyed, replaced, or over-turned despite that the regions are susceptible to severe weather conditions [62], and tsunamis cannot be excluded there [109,110]. Even if the periodicity of the high-energy events that can be responsible for changes of coastal megaclast deposits seems to be longer than a decade, the registered stability is notable. This is especially the case of the Hondarribia locality located on a high-energy coast of the Biscay Bay, for which a two-decade long comparison (Figure 3 and Figure 11) is possible. Apparently, severe storms of the 2000s and the 2010s [62] did not affect megaclasts of this locality.
It is sensible to add that the Google Earth Engine gives opportunity to get images with a high frequency (Sentinel 2 or SPOT 7 images). If so, some localities can be specially monitored in the case of any future severe storms or tsunamis to document the dynamics of coastal megaclast deposits.
4.5. Automatic Detection of Coastal Megaclast Deposits: the Current State of the Problem
The development of the Google Earth Engine has permitted to pose the question of the invention of advanced digital tools for automatic detection of particular features on satellite images. For instance, such tools are helpful in urban studies [111] and archaeology [112]. In geomorphological studies, two successfully tested approaches are notable. The first has been proposed by Luijendijk et al. [113] for the global-scale mapping of sandy beaches and establishing their dynamics. The second approach has been employed by Vos et al. [114] to document shoreline dynamics (some examples also deal with sandy beaches). The validity and the importance of the both above-mentioned studies are indisputable, and the availability of any similar approach would help in the global mapping of coastal megaclast deposits. It is not the purpose of the present work to develop such an advanced interpretative technique, but some limitations of the latter can be discussed in the light of the present findings.
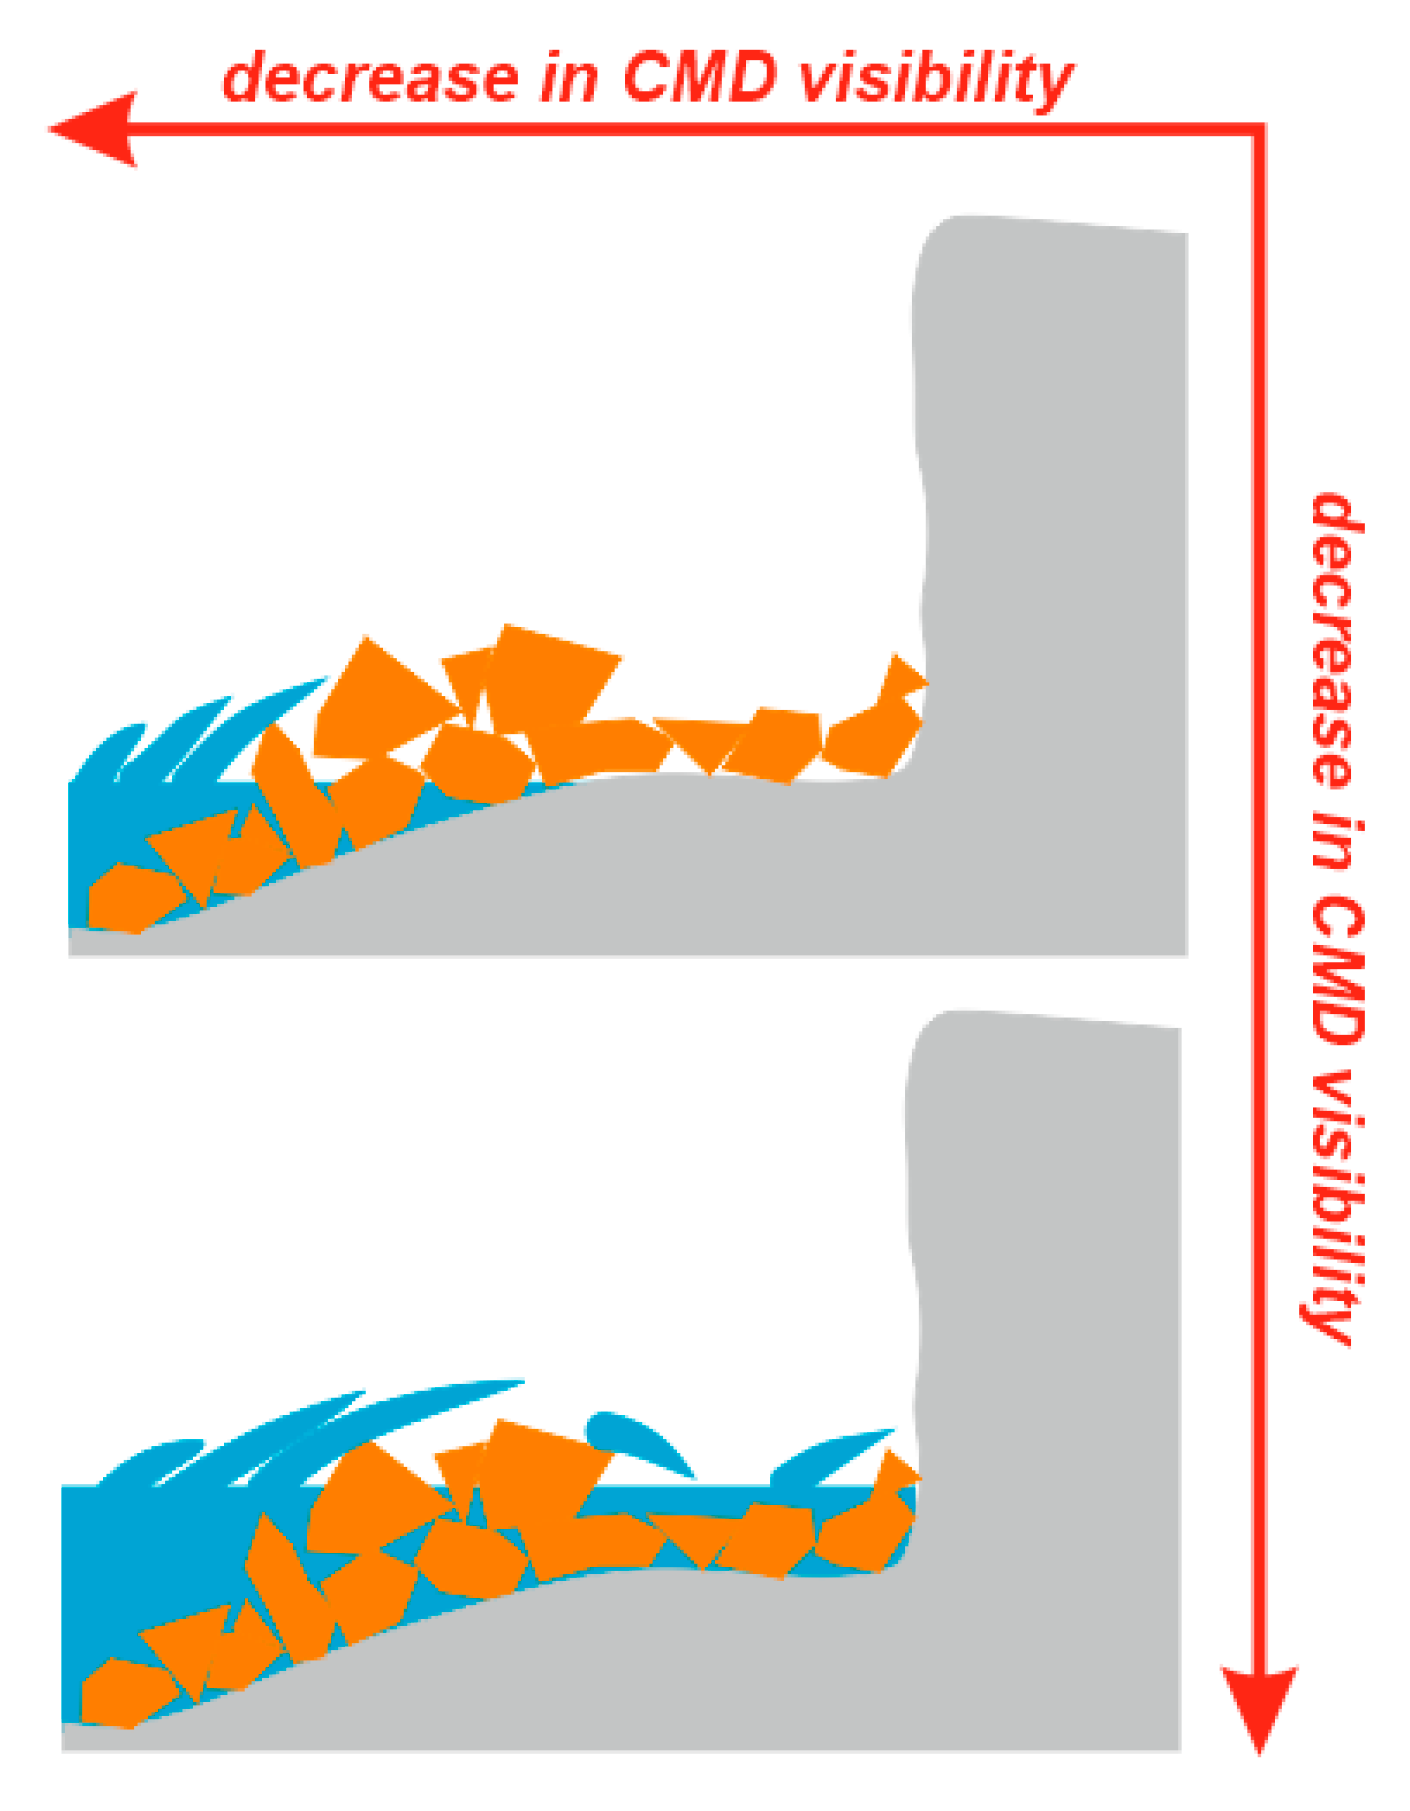
First of all, the main differences of coastal megaclast deposits from sandy beaches should be noted. These deposits are more localized and often narrow; these rarely form lengthy ‘belts’ like sandy beaches. The latter are often distinguished on satellite images by a white or yellow color, whereas coastal megaclast deposits may look very differently in each case. Importantly, these deposits are often not continuous particle packages, but individual stones or stone groups dispersed along the coastline (this is especially well visible at the Weater Island locality—Figure 6 and Figure 7). To make a clear distinction between true megaclasts and semi-detached megaclasts or rock exposures is not always easy, especially when the surface of a given area is not flat. When sandy beaches are detected, the objects of study are beaches themselves, and the researchers do not to pay attention to sand particles that cannot be determined from the space. In contract, studies of coastal megaclast deposits require attention to giant particles. That is why such studies depend stronger on image resolution. The experience with the Ponza Island (Figure 5 and Figure 12) implies water transparency influences on the detection of megaclasts that are fully or partly drowned, whereas the evidence from the Hondarribia locality (Figure 3 and Figure 11) indicates on the importance of the sea level, i.e., tides. As a result, visibility of coastal megaclast deposits decreases under certain conditions (Figure 14).
The above-said does not suggest against the necessity of techniques for automated detection of coastal megaclast deposits, but reveals serious barriers for the invention of such techniques. Moreover, it should be stressed that the studies of Luijendijk et al. [113] are aimed at making global- or regional-scale conclusions. In contrast, what do the megaclast researchers actually need are particular localities, especially providing representative examples of coastal megaclast deposits from different parts of the world. In regard to this, simple visual surveys of shorelines with the Google Earth Engine provide reasonable information.
5. Conclusions
The use of the Google Earth Engine has permitted to us find four new localities of coastal megaclast deposits in Atlantic Europe, the Mediterranean, Southeast Asia, and Central America. The dominance of blocks and subordinate number of megablocks, as well as their chiefly angular shape are visible on satellite images. More detailed, quantitative investigations are possible on the basis of the both field and virtual studies of these localities. Despite some limitations, the Google Earth Engine seems to be an almost ideal instrument for quick tracing the geographical distribution of megaclast deposits along the coasts of seas and oceans, which is important for the coordination of further research. The growth of tourism and voluminous online representation of the relevant photos facilitate finding areas promising for identification of megaclast localities. The novelty of this study is triple, i.e., the potential of virtual search for coastal megaclast deposits was proven, four new localities found, and the knowledge of megaclast spatial occurrence in several large regions was summarized (it was also explained how geographical gaps in this knowledge could be filled with virtual finding of new localities). More generally, this work did not argue for ‘replacing’ field studies by virtual surveys. In contrast, it demonstrated how to find efficiently new localities for further field studies. In the other words, finding localities as a research task is separated from in-depth sedimentological investigations.
This paper dealt with four, almost randomly selected localities. Further virtual surveys of the coastal zones will permit to extend the relevant knowledge, as well as to improve the methods of the satellite image analysis. One of the central problems is the precise megaclast size and shape description, as satellite images show the only 2D projection of these features, which can be oriented differently. It is important problem to think how some tools proposed earlier [115,116,117] can be coupled with the use of the Google Earth Engine in coastal megaclast studies. It cannot be excluded that satellite images can be used for automatic detection of megaclast-promising areas in the future.
Author Contributions
D.A.R. is the only author of this work, and he is fully responsible for its content. The Author has read and agree to the published version of the manuscript.
Funding
This research received no external funding.
Acknowledgments
The author gratefully thanks M.E. Johnson (USA) for his kind invitation to contribute to this special issue and various support, as well as all reviewers for their helpful suggestions.
Conflicts of Interest
The author declares no conflict of interest.
References
- Blair, T.C.; McPherson, J.G. Grain-size and textural classification of coarse sedimentary particles. J. Sediment. Res. 1999, 69, 6–19. [Google Scholar] [CrossRef]
- Ruban, D.A. Research in tsunami-related sedimentology during 2001–2010: Can a single natural disaster re-shape the science? GeoActa 2011, 10, 79–85. [Google Scholar]
- Ruban, D.A.; Ponedelnik, A.A.; Yashalova, N.N. Megaclasts: Term Use and Relevant Biases. Geosciences 2019, 9, 14. [Google Scholar] [CrossRef] [Green Version]
- Johnson, M.E.; Ledesma-Vazquez, J.; Guardado-France, R. Coastal Geomorphology of a Holocene Hurricane Deposits on a Pleistocene Marine Terrace from Isla Carmen (Baja California Sur, Mexico). J. Mar. Sci. Eng. 2018, 6, 108. [Google Scholar] [CrossRef] [Green Version]
- Johnson, M.E.; Guardado-France, R.; Johnson, E.M.; Ledesma-Vazquez, J. Geomorphology of a Holocene Hurricane Deposit Eroded from Rhyolite Sea Cliffs on Ensenada Almeja (Baja California Sur, Mexico). J. Mar. Sci. Eng. 2019, 7, 193. [Google Scholar] [CrossRef] [Green Version]
- Hearty, P.J.; Tormey, B.R. Sea-level change and superstorms; geologic evidence from the last interglacial (MIS 5e) in the Bahamas and Bermuda offers ominous prospects for a warming Earth. Mar. Geol. 2017, 390, 347–365. [Google Scholar] [CrossRef]
- Mylroie, J.E. Superstorms: Comments on Bahamian Fenestrae and Boulder Evidence from the Last Interglacial. J. Coast. Res. 2018, 34, 1471–1483. [Google Scholar] [CrossRef]
- Medina, F.; Mhammdi, N.; Chiguer, A.; Akil, M.; Jaaidi, E.B. The Rabat and Larache boulder fields; new examples of high-energy deposits related to storms and tsunami waves in north-western Morocco. Nat. Hazards 2011, 59, 725. [Google Scholar] [CrossRef]
- Biolchi, S.; Denamiel, C.; Devoto, S.; Korbar, T.; Macovaz, V.; Scicchitano, G.; Vilibic, I.; Furlani, S. Impact of the October 2018 storm Vaia on coastal boulders in the northern Adriatic Sea. Water 2019, 11, 2229. [Google Scholar] [CrossRef] [Green Version]
- Causon Deguara, J.; Gauci, R. Evidence of extreme wave events from boulder deposits on the south-east coast of Malta (Central Mediterranean). Nat. Hazards 2017, 86, 543–568. [Google Scholar] [CrossRef]
- Scheffers, A.; Scheffers, S. Tsunami deposits on the coastline of west Crete (Greece). Earth Planet. Sci. Lett. 2007, 259, 613–624. [Google Scholar] [CrossRef]
- Scicchitano, G.; Monaco, C.; Tortorici, L. Large boulder deposits by tsunami waves along the Ionian coast of south-eastern Sicily (Italy). Mar. Geol. 2007, 238, 75–91. [Google Scholar] [CrossRef]
- Shah-Hosseini, M.; Saleem, A.; Mahmoud, A.-M.A.; Morhange, C. Coastal boulder deposits attesting to large wave impacts on the Mediterranean coast of Egypt. Nat. Hazards 2016, 83, 849–865. [Google Scholar] [CrossRef]
- Johnson, M.E. Uniformitarianism as a guide to rocky-shore ecosystems in the geological record. Can. J. Earth Sci. 2006, 43, 1119–1147. [Google Scholar] [CrossRef]
- Ruban, D.A. Coastal Boulder Deposits of the Neogene World: A Synopsis. J. Mar. Sci. Eng. 2019, 7, 446. [Google Scholar] [CrossRef] [Green Version]
- Bruno, D.E.; Ruban, D.A. Something more than boulders: A geological comment on the nomenclature of megaclasts on extraterrestrial bodies. Planet. Space Sci. 2017, 135, 37–42. [Google Scholar] [CrossRef]
- Blott, S.J.; Pye, K. Particle size scales and classification of sediment types based on particle size distributions: Review and recommended procedures. Sedimentology 2012, 59, 2071–2096. [Google Scholar] [CrossRef]
- Terry, J.P.; Goff, J. Megaclasts: Proposed revised nomenclature at the coarse end of the Udden-Wentworth grain-size scale for sedimentary particles. J. Sediment. Res. 2014, 84, 192–197. [Google Scholar] [CrossRef]
- Chen, B.; Chen, Z.; Stephenson, W.; Finlayson, B. Morphodynamics of a boulder beach, Putuo Island, SE China coast: The role of storms and typhoon. Mar. Geol. 2011, 283, 106–115. [Google Scholar] [CrossRef]
- Cox, R.; O’Boyle, L.; Cytrynbaum, J. Imbricated Coastal Boulder Deposits are Formed by Storm Waves, and Can Preserve a Long-Term Storminess Record. Sci. Rep. 2019, 9, 10784. [Google Scholar] [CrossRef]
- Dewey, J.F.; Ryan, P.D. Storm, rogue wave, or tsunami origin for megaclast deposits in western Ireland and North Island, New Zealand? Proc. Natl. Acad. Sci. USA 2017, 114, E10639–E10647. [Google Scholar] [CrossRef] [Green Version]
- Hoffmann, G.; Grützner, C.; Schneider, B.; Preusser, F.; Reicherter, K. Large Holocene tsunamis in the northern Arabian Sea. Mar. Geol. 2020, 419, 106068. [Google Scholar] [CrossRef]
- Lorang, M.S. A wave-competence approach to distinguish between boulder and megaclast deposits due to storm waves versus tsunamis. Mar. Geol. 2011, 283, 90–97. [Google Scholar] [CrossRef]
- Noormets, R.; Crook, K.A.W.; Felton, E.A. Sedimentology of rocky shorelines: 3. Hydrodynamics of megaclast emplacement and transport on a shore platform, Oahu, Hawaii. Sediment. Geol. 2004, 172, 41–65. [Google Scholar] [CrossRef]
- Nott, J. Waves, coastal boulder deposits and the importance of the pre-transport setting. Earth Planet. Sci. Lett. 2003, 210, 269–276. [Google Scholar] [CrossRef]
- Scheffers, A.M.; Kinis, S. Stable imbrication and delicate/unstable settings in coastal boulder deposits: Indicators for tsunami dislocation? Quat. Int. 2014, 332, 73–84. [Google Scholar] [CrossRef]
- Williams, D.M.; Hall, A.M. Cliff-top megaclast deposits of Ireland, a record of extreme waves in the North Atlantic - Storms or tsunamis? Mar. Geol. 2004, 206, 101–117. [Google Scholar] [CrossRef]
- Cox, R.; Lopes, W.A.; Jahn, K.L. Quantitative roundness analysis of coastal boulder deposits. Mar. Geol. 2018, 396, 114–141. [Google Scholar] [CrossRef]
- Cox, R. Very large boulders were moved by storm waves on the west coast of Ireland in winter 2013–2014. Mar. Geol. 2019, 412, 217–219. [Google Scholar] [CrossRef]
- Cox, R.; Jahn, K.L.; Watkins, O.G.; Cox, P. Extraordinary boulder transport by storm waves (west of Ireland, winter 2013–2014), and criteria for analysing coastal boulder deposits. Earth-Sci. Rev. 2018, 177, 623–636. [Google Scholar] [CrossRef]
- Cronin, A.; Devoy, R.; Bartlett, D.; Nuyts, S.; O’Dwyer, B. Investigation of an elevated sands unit at Tralispean Bay, South-West Ireland—potential high-energy marine event. Ir. Geogr. 2018, 51, 229–260. [Google Scholar]
- Erdmann, W.; Kelletat, D.; Kuckuck, M. Boulder ridges and washover features in Galway Bay, Western Ireland. J. Coast. Res. 2017, 33, 997–1021. [Google Scholar] [CrossRef]
- Erdmann, W.; Scheffers, A.M.; Kelletat, D.H. Holocene Coastal Sedimentation in a Rocky Environment: Geomorphological Evidence from the Aran Islands and Galway Bay (Western Ireland). J. Coast. Res. 2018, 34, 772–792. [Google Scholar] [CrossRef]
- Scheffers, A.; Kelletat, D.; Haslett, S.; Scheffers, S.; Browne, T. Coastal boulder deposits in Galway Bay and the Aran Islands, western Ireland. Z. Geomorphol. 2010, 54, 247–279. [Google Scholar] [CrossRef]
- Scheffers, A.; Scheffers, S.; Kelletat, D.; Browne, T. Wave-emplaced coarse debris and megaclasts in Ireland and Scotland: Boulder transport in a high-energy littoral environment. J. Geol. 2009, 117, 553–573. [Google Scholar] [CrossRef]
- Gorelick, N.; Hancher, M.; Dixon, M.; Ilyushchenko, S.; Thau, D.; Moore, R. Google Earth Engine: Planetary-scale geospatial analysis for everyone. Remote Sens. Environ. 2017, 202, 18–27. [Google Scholar] [CrossRef]
- Mutanga, O.; Kumar, L. Google Earth Engine applications. Remote Sens. 2019, 11, 591. [Google Scholar] [CrossRef] [Green Version]
- Gómez-Pazo, A.; Pérez-Alberti, A.; Trenhaile, A. Recording inter-annual changes on a boulder beach in Galicia, NW Spain using an unmanned aerial vehicle. Earth Surf. Process. Landf. 2019, 44, 1004–1014. [Google Scholar] [CrossRef]
- Green, A.; Cooper, A.; Salzmann, L. Longshore size grading on a boulder beach. J. Sediment. Res. 2016, 86, 1123–1128. [Google Scholar] [CrossRef]
- Lorang, M.S. Predicting threshold entrainment mass for a boulder beach. J. Coast. Res. 2000, 16, 432–445. [Google Scholar]
- Abad, M.; Izquierdo, T.; Caceres, M.; Bernardez, E.; Rodriguez-Vidal, J. Coastal boulder deposit as evidence of an ocean-wide prehistoric tsunami originated on the Atacama Desert coast (northern Chile). Sedimentology 2019. [Google Scholar] [CrossRef]
- Broeckx, J.; Vanmaercke, M.; Duchateau, R.; Poesen, J. A data-based landslide susceptibility map of Africa. Earth-Sci. Rev. 2018, 185, 102–121. [Google Scholar] [CrossRef]
- Depicker, A.; Jacobs, L.; Delvaux, D.; Havenith, H.-B.; Maki Mateso, J.-C.; Govers, G.; Dewitte, O. The added value of a regional landslide susceptibility assessment: The western branch of the East African Rift. Geomorphology 2020, 353, 106886. [Google Scholar] [CrossRef]
- Abalos, B. Geologic Map of the Basque Cantabrian Basin and a new tectonic interpretation of the Basque Arc. Int. J. Earth Sci. 2016, 105, 2327–2354. [Google Scholar] [CrossRef]
- Cox, R.; Zentner, D.B.; Kirchner, B.J.; Cook, M.S. Boulder ridges on the Aran Islands (Ireland): Recent movements caused by storm waves, not tsunamis. J. Geol. 2012, 120, 249–272. [Google Scholar] [CrossRef] [Green Version]
- Hall, A.M.; Hansom, J.D.; Jarvis, J. Patterns and rates of erosion produced by high energy wave processes on hard rock headlands: The Grind of the Navir, Shetland, Scotland. Mar. Geol. 2008, 248, 28–46. [Google Scholar] [CrossRef] [Green Version]
- Hall, A.M.; Hansom, J.D.; Williams, D.M.; Jarvis, J. Distribution, geomorphology and lithofacies of cliff-top storm deposits: Examples from the high-energy coasts of Scotland and Ireland. Mar. Geol. 2006, 232, 131–155. [Google Scholar] [CrossRef]
- Hastewell, L.J.; Schaefer, M.; Bray, M.; Inkpen, R. Intertidal boulder transport: A proposed methodology adopting Radio Frequency Identification (RFID) technology to quantify storm induced boulder mobility. Earth Surf. Process. Landf. 2019, 44, 681–698. [Google Scholar] [CrossRef] [Green Version]
- Herterich, J.G.; Cox, R.; Dias, F. How does wave impact generate large boulders? Modelling hydraulic fracture of cliffs and shore platforms. Mar. Geol. 2018, 339, 34–46. [Google Scholar] [CrossRef]
- McKenna, J.; Jackson, D.W.T.; Cooper, J.A.G. In situ exhumation from bedrock of large rounded boulders at the Giant’s Causeway, Northern Ireland: An alternative genesis for large shore boulders (mega-clasts). Mar. Geol. 2011, 283, 25–35. [Google Scholar] [CrossRef]
- Sommerville, A.A.; Hansom, J.D.; Sanderson, D.C.W.; Housley, R.A. Optically stimulated luminescence dating of large storm events in Northern Scotland. Quat. Sci. Rev. 2003, 22, 1085–1092. [Google Scholar] [CrossRef]
- Autret, R.; Dodet, G.; Suanez, S.; Roudaut, G.; Fichaut, B. Long–term variability of supratidal coastal boulder activation in Brittany (France). Geomorphology 2018, 304, 184–200. [Google Scholar] [CrossRef]
- Fichaut, B.; Suanez, S. Quarrying, transport and deposition of cliff-top storm deposits during extreme events: Banneg Island, Brittany. Mar. Geol. 2011, 283, 36–55. [Google Scholar] [CrossRef]
- Pierre, G. Processes and rate of retreat of the clay and sandstone sea cliffs of the northern Boulonnais (France). Geomorphology 2006, 73, 64–77. [Google Scholar] [CrossRef]
- Regnauld, H.; Oszwald, J.; Planchon, O.; Pignatelli, C.; Piscitelli, A.; Mastronuzzi, G.; Audevard, A. Polygenetic (tsunami and storm) deposits? A case study from Ushant Island, western France. Z. Geomorphol. 2010, 54, 197–217. [Google Scholar] [CrossRef]
- Suanez, S.; Fichaut, B.; Magne, R. Cliff-top storm deposits on Banneg Island, Brittany, France: Effects of giant waves in the Eastern Atlantic Ocean. Sediment. Geol. 2009, 220, 12–28. [Google Scholar] [CrossRef]
- Costa, P.J.M.; Andrade, C.; Freitas, M.C.; Oliveira, M.A.; da Silva, C.M.; Omira, R.; Taborda, R.; Baptista, M.A.; Dawson, A.G. Boulder deposition during major tsunami events. Earth Surf. Process. Landf. 2011, 36, 2054–2068. [Google Scholar] [CrossRef]
- Horacio, J.; Munoz-Narciso, E.; Trenhaile, A.S.; Perez-Alberti, A. Remote sensing monitoring of a coastal-valley earthflow in northwestern Galicia, Spain. Catena 2019, 178, 276–287. [Google Scholar] [CrossRef]
- Kortekaas, S.; Dawson, A.G. Distinguishing tsunami and storm deposits: An example from Martinhal, SW Portugal. Sediment. Geol. 2007, 200, 208–221. [Google Scholar] [CrossRef]
- Oliveira, M.A.; Andrade, C.; Freitas, M.C.; Costa, P.; Taborda, R.; Janardo, C.; Neves, R. Transport of large boulders quarried from shore platforms of the Portuguese west coast. J. Coast. Res. 2011, 64, 1871–1875. [Google Scholar]
- Ruiz, F.; Rodriguez-Ramirez, A.; Caceres, L.M.; Vidal, J.R.; Carretero, M.I.; Abad, M.; Olias, M.; Pozo, M. Evidence of high-energy events in the geological record: Mid-Holocene evolution of the southwestern Donana National Park (SW Spain). Palaeogeogr. Palaeoclimatol. Palaeoecol. 2005, 229, 212–229. [Google Scholar] [CrossRef]
- European Severe Weather Database. Available online: https://www.eswd.eu (accessed on 6 February 2020).
- Aubourg, C.; Giordano, G.; Mattei, M.; Speranza, F. Magma flow in sub-aqueous rhyolitic dikes inferred from magnetic fabric analysis (Ponza Island, W. Italy). Phys. Chem. Earth 2002, 27, 1263–1272. [Google Scholar] [CrossRef]
- Bellucci, F.; Grimaldi, M.; Lirer, L.; Rapolla, A. Structure and geological evolution of the island of Ponza, Italy: Inferences from geological and gravimetric data. J. Volcanol. Geotherm. Res. 1997, 79, 87–96. [Google Scholar] [CrossRef]
- DeRita, D.; Giordano, G.; Cecili, A. A model of submarine rhyolite dome growth: Ponza Island (central Italy). J. Volcanol. Geotherm. Res. 2001, 107, 221–239. [Google Scholar] [CrossRef]
- Carobene, L.; Cevasco, A.; Firpo, M. Aspects of the Quaternary evolution of the coast between Cogoleto and Varazze (western Liguria). Alp. Mediterr. Quat. 2010, 23, 163–180. [Google Scholar]
- Pepe, F.; Corradino, M.; Parrino, N.; Besio, G.; Presti, V.L.; Renda, P.; Calcagnile, L.; Quarta, G.; Sulli, A.; Antonioli, F. Boulder coastal deposits at Favignana Island rocky coast (Sicily, Italy): Litho-structural and hydrodynamic control. Geomorphology 2018, 303, 191–209. [Google Scholar] [CrossRef]
- Piscitelli, A.; Milella, M.; Hippolyte, J.-C.; Shah-Hosseini, M.; Morhange, C.; Mastronuzzi, G. Numerical approach to the study of coastal boulders: The case of Martigues, Marseille, France. Quat. Int. 2017, 439, 52–64. [Google Scholar] [CrossRef]
- Scotney, P.M.; Roberts, S.; Herrington, R.J.; Boyce, A.J.; Burgess, R. The development of volcanic massive sulfide and barite-gold orebodies on Wetar Island, Indonesia. Miner. Depos. 2005, 40, 76–99. [Google Scholar] [CrossRef]
- Boesl, F.; Engel, M.; Eco, R.C.; Galang, J.B.; Gonzalo, L.A.; Llanes, F.; Quix, E.; Bruckner, H. Digital mapping of coastal boulders—High-resolution data acquisition to infer past and recent transport dynamics. Sedimentology 2019, in press. [Google Scholar] [CrossRef]
- Etienne, S.; Buckley, M.; Paris, R.; Nandasena, A.K.; Clark, K.; Strotz, L.; Chague-Goff, C.; Goff, J.; Richmond, B. The use of boulders for characterising past tsunamis: Lessons from the 2004 Indian Ocean and 2009 South Pacific tsunamis. Earth-Sci. Rev. 2011, 107, 76–90. [Google Scholar] [CrossRef]
- Feldens, P.; Schwarzer, K.; Sakuna, D.; Szczucinski, W.; Sompongchaiyakul, P. Sediment distribution on the inner continental shelf off Khao Lak (Thailand) after the 2004 Indian Ocean tsunami. Earth Planets Space 2012, 64, 875–887. [Google Scholar] [CrossRef] [Green Version]
- Fujino, S.; Sieh, K.; Meltzner, A.J.; Yulianto, E.; Chiang, H.-W. Ambiguous correlation of precisely dated coral detritus with the tsunamis of 1861 and 1907 at Simeulue Island, Aceh Province, Indonesia. Mar. Geol. 2014, 357, 384–391. [Google Scholar] [CrossRef]
- Goto, K.; Chavanich, S.A.; Imamura, F.; Kunthasap, P.; Matsui, T.; Minoura, K.; Sugawara, D.; Yanagisawa, H. Distribution, origin and transport process of boulders deposited by the 2004 Indian Ocean tsunami at Pakarang Cape, Thailand. Sediment. Geol. 2007, 202, 821–837. [Google Scholar] [CrossRef]
- Goto, K.; Okada, K.; Imamura, F. Numerical analysis of boulder transport by the 2004 Indian Ocean tsunami at Pakarang Cape, Thailand. Mar. Geol. 2010, 26, 97–105. [Google Scholar] [CrossRef]
- Haslett, S.K.; Wong, B.R. An evaluation of boulder deposits along a granite coast affected by the 2004 Indian Ocean tsunami using revised hydrodynamic equations: Batu Ferringhi, Penang, Malaysia. J. Geol. 2019, 127, 527–541. [Google Scholar] [CrossRef]
- Kennedy, A.B.; Mori, N.; Yasuda, T.; Shimozono, T.; Tomiczek, T.; Donahue, A.; Shimura, T.; Imai, Y. Extreme block and boulder transport along a cliffed coastline (Calicoan Island, Philippines) during Super Typhoon Haiyan. Mar. Geol. 2017, 383, 65–77. [Google Scholar] [CrossRef] [Green Version]
- Kennedy, A.B.; Mori, N.; Zhang, Y.; Yasuda, T.; Chen, S.-E.; Tajima, Y.; Pecor, W.; Toride, K. Observations and Modeling of Coastal Boulder Transport and Loading during Super Typhoon Haiyan. Coast. Eng. J. 2016, 58, 1640004. [Google Scholar] [CrossRef]
- Lau, A.Y.A.; Terry, J.P.; Switzer, A.D.; Pile, J. Advantages of beachrock slabs for interpreting high-energy wave transport: Evidence from Ludao island in south-eastern Taiwan. Geomorphology 2015, 228, 263–274. [Google Scholar] [CrossRef]
- May, S.M.; Engel, M.; Brill, D.; Cuadra, C.; Lagmay, A.M.F.; Santiago, J.; Suarez, J.K.; Reyes, M.; Bruckner, H. Block and boulder transport in Eastern Samar (Philippines) during Supertyphoon Haiyan. Earth Surf. Dyn. 2015, 3, 543–558. [Google Scholar] [CrossRef] [Green Version]
- Paris, R.; Fournier, J.; Poizot, E.; Etienne, S.; Morin, J.; Lavigne, F.; Wassmer, P. Boulder and fine sediment transport and deposition by the 2004 tsunami in Lhok Nga (western Banda Aceh, Sumatra, Indonesia): A coupled offshore-onshore model. Mar. Geol. 2010, 268, 43–54. [Google Scholar] [CrossRef]
- Paris, R.; Wassmer, P.; Sartohadi, J.; Lavigne, F.; Barthomeuf, B.; Desgages, E.; Grancher, D.; Baumert, P.; Vautier, F.; Brunstein, D.; et al. Tsunamis as geomorphic crises: Lessons from the December 26, 2004 tsunami in Lhok Nga, West Banda Aceh (Sumatra, Indonesia). Geomorphology 2009, 104, 59–72. [Google Scholar] [CrossRef]
- Scheucher, L.E.A.; Vortisch, W. Sedimentological and geomorphological effects of the Sumatra-Andaman Tsunami in the area of Khao Lak, southern Thailand. Environ. Earth Sci. 2011, 63, 785–796. [Google Scholar] [CrossRef]
- Soria, J.L.A.; Switzer, A.D.; Pilarczyk, J.E.; Tang, H.; Weiss, R.; Siringan, F.; Manglicmot, M.; Gallentes, A.; Lau, A.Y.A.; Cheong, A.Y.L.; et al. Surf beat-induced overwash during Typhoon Haiyan deposited two distinct sediment assemblages on the carbonate coast of Hernani, Samar, central Philippines. Mar. Geol. 2018, 396, 215–230. [Google Scholar] [CrossRef]
- Szczucinski, W. The post-depositional changes of the onshore 2004 tsunami deposits on the Andaman Sea coast of Thailand. Nat. Hazards 2012, 60, 115–133. [Google Scholar] [CrossRef] [Green Version]
- Terry, J.P.; Dunne, K.; Jankaew, K. Prehistorical frequency of high-energy marine inundation events driven by typhoons in the Bay of Bangkok (Thailand), interpreted from coastal carbonate boulders. Earth Surf. Process. Landf. 2016, 41, 553–562. [Google Scholar] [CrossRef]
- Terry, J.P.; Goff, J. Strongly aligned coastal boulders on Ko Larn island (Thailand): A proxy for past typhoon-driven high-energy wave events in the Bay of Bangkok. Geogr. Res. 2019, 57, 344–358. [Google Scholar] [CrossRef]
- Terry, J.P.; Goff, J.; Jankaew, K. Major typhoon phases in the upper Gulf of Thailand over the last 1.5 millennia, determined from coastal deposits on rock islands. Quat. Int. 2018, 487, 87–98. [Google Scholar] [CrossRef]
- Terry, J.P.; Jankaew, K.; Dunne, K. Coastal vulnerability to typhoon inundation in the Bay of Bangkok, Thailand? Evidence from carbonate boulder deposits on Ko Larn island. Estuar. Coast. Shelf Sci. 2015, 165, 261–269. [Google Scholar] [CrossRef]
- Terry, J.P.; Oliver, G.J.H.; Friess, D.A. Ancient high-energy storm boulder deposits on Ko Samui, Thailand, and their significance for identifying coastal hazard risk. Palaeogeogr. Palaeoclimatol. Palaeoecol. 2016, 454, 282–293. [Google Scholar] [CrossRef]
- Xu, X.; Gao, S.; Zhou, L.; Yang, B. Sedimentary records of extreme wave events on the northeastern Hainan Island coast, southern China. Haiyang Xuebao 2019, 41, 48–63. [Google Scholar]
- Yang, W.; Sun, L.; Yang, Z.; Gao, S.; Gao, Y.; Shao, D.; Mei, Y.; Zang, J.; Wang, Y.; Xie, Z. Nan’ao, an archaeological site of Song dynasty destroyed by tsunami. Chin. Sci. Bull. 2019, 64, 107–120. [Google Scholar] [CrossRef] [Green Version]
- Yawsangratt, S.; Szczucinski, W.; Chaimanee, N.; Jagodzinski, R.; Lorenc, S.; Chatprasert, S.; Saisuttichai, D.; Tepsuwan, T. Depositional effects of 2004 tsunami and hypothetical paleotsunami near Thap Lamu Navy Base in Phang Nga Province, Thailand. Pol. J. Environ. Stud. 2009, 18, 17–23. [Google Scholar]
- Zhou, L.; Gao, S.; Jia, J.; Zhang, Y.; Yang, Y.; Mao, L.; Fang, X.; Shulmeister, J. Extracting historic cyclone data from coastal dune deposits in eastern Hainan Island, China. Sediment. Geol. 2019, 392, 105524. [Google Scholar] [CrossRef]
- Gusiakov, V.K.; Dunbar, P.K.; Arcos, N. Twenty-Five Years (1992–2016) of Global Tsunamis: Statistical and Analytical Overview. Pure Appl. Geophys. 2019, 176, 2795–2807. [Google Scholar] [CrossRef]
- Løvholt, F.; Glimsdal, S.; Harbitz, C.B.; Zamora, N.; Nadim, F.; Peduzzi, P.; Dao, H.; Smebye, H. Tsunami hazard and exposure on the global scale. Earth-Sci. Rev. 2012, 110, 58–73. [Google Scholar] [CrossRef]
- Kang, N.-Y.; Kim, D.; Elsner, J.B. The contribution of super typhoons to tropical cyclone activity in response to ENSO. Sci. Rep. 2019, 9, 5046. [Google Scholar] [CrossRef]
- Barat, F.; Mercier de Lépinay, B.; Sosson, M.; Müller, C.; Baumgartner, P.O.; Baumgartner-Mora, C. Transition from the Farallon Plate subduction to the collision between South and Central America: Geological evolution of the Panama Isthmus. Tectonophysics 2014, 622, 145–167. [Google Scholar] [CrossRef]
- Bahlburg, H.; Spiske, M. Sedimentology of tsunami inflow and backflow deposits: Key differences revealed in a modern example. Sedimentology 2012, 59, 1063–1086. [Google Scholar] [CrossRef]
- Bahlburg, H.; Nentwig, V.; Kreutzer, M. The September 16, 2015 Illapel tsunami, Chile—Sedimentology of tsunami deposits at the beaches of La Serena and Coquimbo. Mar. Geol. 2018, 396, 43–53. [Google Scholar] [CrossRef]
- Evers, C.; Doering, A. Lifestyle Sports in East Asia. J. Sport Soc. Issues 2019, 43, 343–352. [Google Scholar] [CrossRef] [Green Version]
- Magiera, A.; Roczniok, R. The climbing preferences of advanced rock climbers. Hum. Mov. 2013, 14, 254–264. [Google Scholar] [CrossRef]
- Schwartz, F.; Taff, B.D.; Lawhon, B.; Pettebone, D.; Esser, S.; D’Antonio, A. Leave No Trace bouldering ethics: Transitioning from the gym to the crag. J. Outdoor Recreat. Tour. 2019, 25, 16–23. [Google Scholar] [CrossRef]
- Tessler, M.; Clark, T.A. The impact of bouldering on rock-associated vegetation. Biol. Conserv. 2016, 204, 426–433. [Google Scholar] [CrossRef]
- Van der Merwe, J.H.; Joubert, U. Managing environmental impact of bouldering as a niche outdoor-climbing activity. S. Afr. J. Res. Sport, Phys. Educ. Recreat. 2014, 36, 229–251. [Google Scholar]
- 27 Crags. Available online: https://27crags.com/ (accessed on 6 February 2020).
- Climb Europe. Available online: https://www.climb-europe.com/EuropeanRockClimbingAreas.html (accessed on 6 February 2020).
- Climbing Away. Available online: https://climbingaway.fr/en/rock-climbing-areas/world-map-of-rock-climbing-areas (accessed on 6 February 2020).
- Liu, Z.Y.-C.; Harris, R.A. Discovery of possible mega-thrust earthquake along the Seram Trough from records of 1629 tsunami in eastern Indonesian region. Nat. Hazards 2014, 72, 1311–1328. [Google Scholar] [CrossRef] [Green Version]
- Tinti, S.; Maramai, A.; Graziani, L. A new version of the European tsunami catalogue: Updating and revision. Nat. Hazards Earth Syst. Sci. 2001, 1, 255–262. [Google Scholar] [CrossRef] [Green Version]
- Khanal, N.; Uddin, K.; Matin, M.A.; Tenneson, K. Automatic detection of spatiotemporal urban expansion patterns by fusing OSM and Landsat data in Kathmandu. Remote Sens. 2019, 11, 2296. [Google Scholar] [CrossRef] [Green Version]
- Liss, B.; Howland, M.D.; Levy, T.E. Testing Google Earth Engine for the automatic identification and vectorization of archaeological features: A case study from Faynan, Jordan. J. Archaeol. Sci. Rep. 2017, 15, 299–304. [Google Scholar] [CrossRef] [Green Version]
- Luijendijk, A.; Hagenaars, G.; Ranasinghe, R.; Baart, F.; Donchyts, G.; Aarninkhof, S. The State of the World’s Beaches. Sci. Rep. 2018, 8, 6641. [Google Scholar] [CrossRef]
- Vos, K.; Splinter, K.D.; Harley, M.D.; Simmons, J.A.; Turner, I.L. CoastSat: A Google Earth Engine-enabled Python toolkit to extract shorelines from publicly available satellite imagery. Environ. Model. Softw. 2019, 122, 104528. [Google Scholar] [CrossRef]
- Moreno Chávez, G.; Sarocchi, D.; Arce Santana, E.; Borselli, L.; Rodríguez-Sedano, L.A. Using Kinect to analyze pebble to block-sized clasts in sedimentology. Comput. Geosci. 2014, 72, 18–32. [Google Scholar] [CrossRef]
- Ríha, K.; Krupka, A.; Costa, P.J.M. Image analysis applied to quartz grain microtextural provenance studies. Comput. Geosci. 2019, 125, 98–108. [Google Scholar] [CrossRef]
- Tunwal, M.; Mulchrone, K.F.; Meere, P.A. Image based Particle Shape Analysis Toolbox (IPSAT). Comput. Geosci. 2020, 135, 104391. [Google Scholar] [CrossRef]
Figure 1.
New localities of coastal megaclast deposits considered in this paper.

Figure 2.
The eastern plot of the Hondarribia locality (the view provided by the Google Earth Engine). CMD labels coastal megaclast deposits (the same is on the following figures).
Figure 2.
The eastern plot of the Hondarribia locality (the view provided by the Google Earth Engine). CMD labels coastal megaclast deposits (the same is on the following figures).

Figure 3.
The western plot of the Hondarribia locality (the view provided by the Google Earth Engine).
Figure 3.
The western plot of the Hondarribia locality (the view provided by the Google Earth Engine).

Figure 4.
The southern plot of the Ponza Island locality (the view provided by the Google Earth Engine).
Figure 4.
The southern plot of the Ponza Island locality (the view provided by the Google Earth Engine).

Figure 5.
The northwestern plot of the Ponza Island locality (the view provided by the Google Earth Engine).
Figure 5.
The northwestern plot of the Ponza Island locality (the view provided by the Google Earth Engine).

Figure 6.
The eastern plot of the Wetar Island locality (the view provided by the Google Earth Engine).
Figure 6.
The eastern plot of the Wetar Island locality (the view provided by the Google Earth Engine).

Figure 7.
The northeastern plot of the Wetar Island locality (the view provided by the Google Earth Engine).
Figure 7.
The northeastern plot of the Wetar Island locality (the view provided by the Google Earth Engine).

Figure 8.
The southern plot of the Humboldt o Coredo Bay locality (the view provided by the Google Earth Engine).
Figure 8.
The southern plot of the Humboldt o Coredo Bay locality (the view provided by the Google Earth Engine).

Figure 9.
The northern plot of the Humboldt o Coredo Bay locality (the view provided by the Google Earth Engine).
Figure 9.
The northern plot of the Humboldt o Coredo Bay locality (the view provided by the Google Earth Engine).

Figure 10.
Grain-size distribution of megaclasts on the western plot of the Hondarribia locality.

Figure 11.
Satellite view of the western plot of the Hondarribia locality in 2001 (the view provided by the Google Earth Engine).
Figure 11.
Satellite view of the western plot of the Hondarribia locality in 2001 (the view provided by the Google Earth Engine).

Figure 12.
Satellite view of the northwestern plot of the Ponza Island locality in 2009 (the view provided by the Google Earth Engine).
Figure 12.
Satellite view of the northwestern plot of the Ponza Island locality in 2009 (the view provided by the Google Earth Engine).

Figure 13.
Satellite view of the eastern plot of the Wetar Island locality in 2007 (the view provided by the Google Earth Engine).
Figure 13.
Satellite view of the eastern plot of the Wetar Island locality in 2007 (the view provided by the Google Earth Engine).

Figure 14.
Dependence of coastal megaclast deposit visibility on satellite images on the sea-level position.
Figure 14.
Dependence of coastal megaclast deposit visibility on satellite images on the sea-level position.

© 2020 by the author. Licensee MDPI, Basel, Switzerland. This article is an open access article distributed under the terms and conditions of the Creative Commons Attribution (CC BY) license (http://creativecommons.org/licenses/by/4.0/).
Share and Cite
MDPI and ACS Style
Ruban, D.A. Finding Coastal Megaclast Deposits: A Virtual Perspective. J. Mar. Sci. Eng. 2020, 8, 164. https://0-doi-org.brum.beds.ac.uk/10.3390/jmse8030164
AMA Style
Ruban DA. Finding Coastal Megaclast Deposits: A Virtual Perspective. Journal of Marine Science and Engineering. 2020; 8(3):164. https://0-doi-org.brum.beds.ac.uk/10.3390/jmse8030164
Chicago/Turabian StyleRuban, Dmitry A. 2020. "Finding Coastal Megaclast Deposits: A Virtual Perspective" Journal of Marine Science and Engineering 8, no. 3: 164. https://0-doi-org.brum.beds.ac.uk/10.3390/jmse8030164
Note that from the first issue of 2016, this journal uses article numbers instead of page numbers. See further details here.