Parametric Knocking Performance Investigation of Spark Ignition Natural Gas Engines and Dual Fuel Engines


Abstract
:1. Introduction
2. Model Description
- (1)
- The cylinder is modelled by employing two zones—the burnt zone and the unburnt zone.
- (2)
- The pressure at any time is considered to be uniform within the cylinder.
- (3)
- Each cylinder zone has its own uniform temperature. There is no heat transferred between the two zones.
- (4)
- Gas in each zone is assumed to be homogenously distributed and the basic species are considered as ideal but non-perfect gases.
- (5)
- Blowby and valves leakage in the engine cylinders are not considered.
2.1. Fuel Injector Model
2.1.1. NG Injector Model for the Investigated SI NG Engine
2.1.2. NG and Pilot Diesel Injector Models for the Investigated DF Engine
2.2. Combustion Model
2.3. Heat Transfer Model
2.4. Knocking Prediction Model
2.5. Model Layout
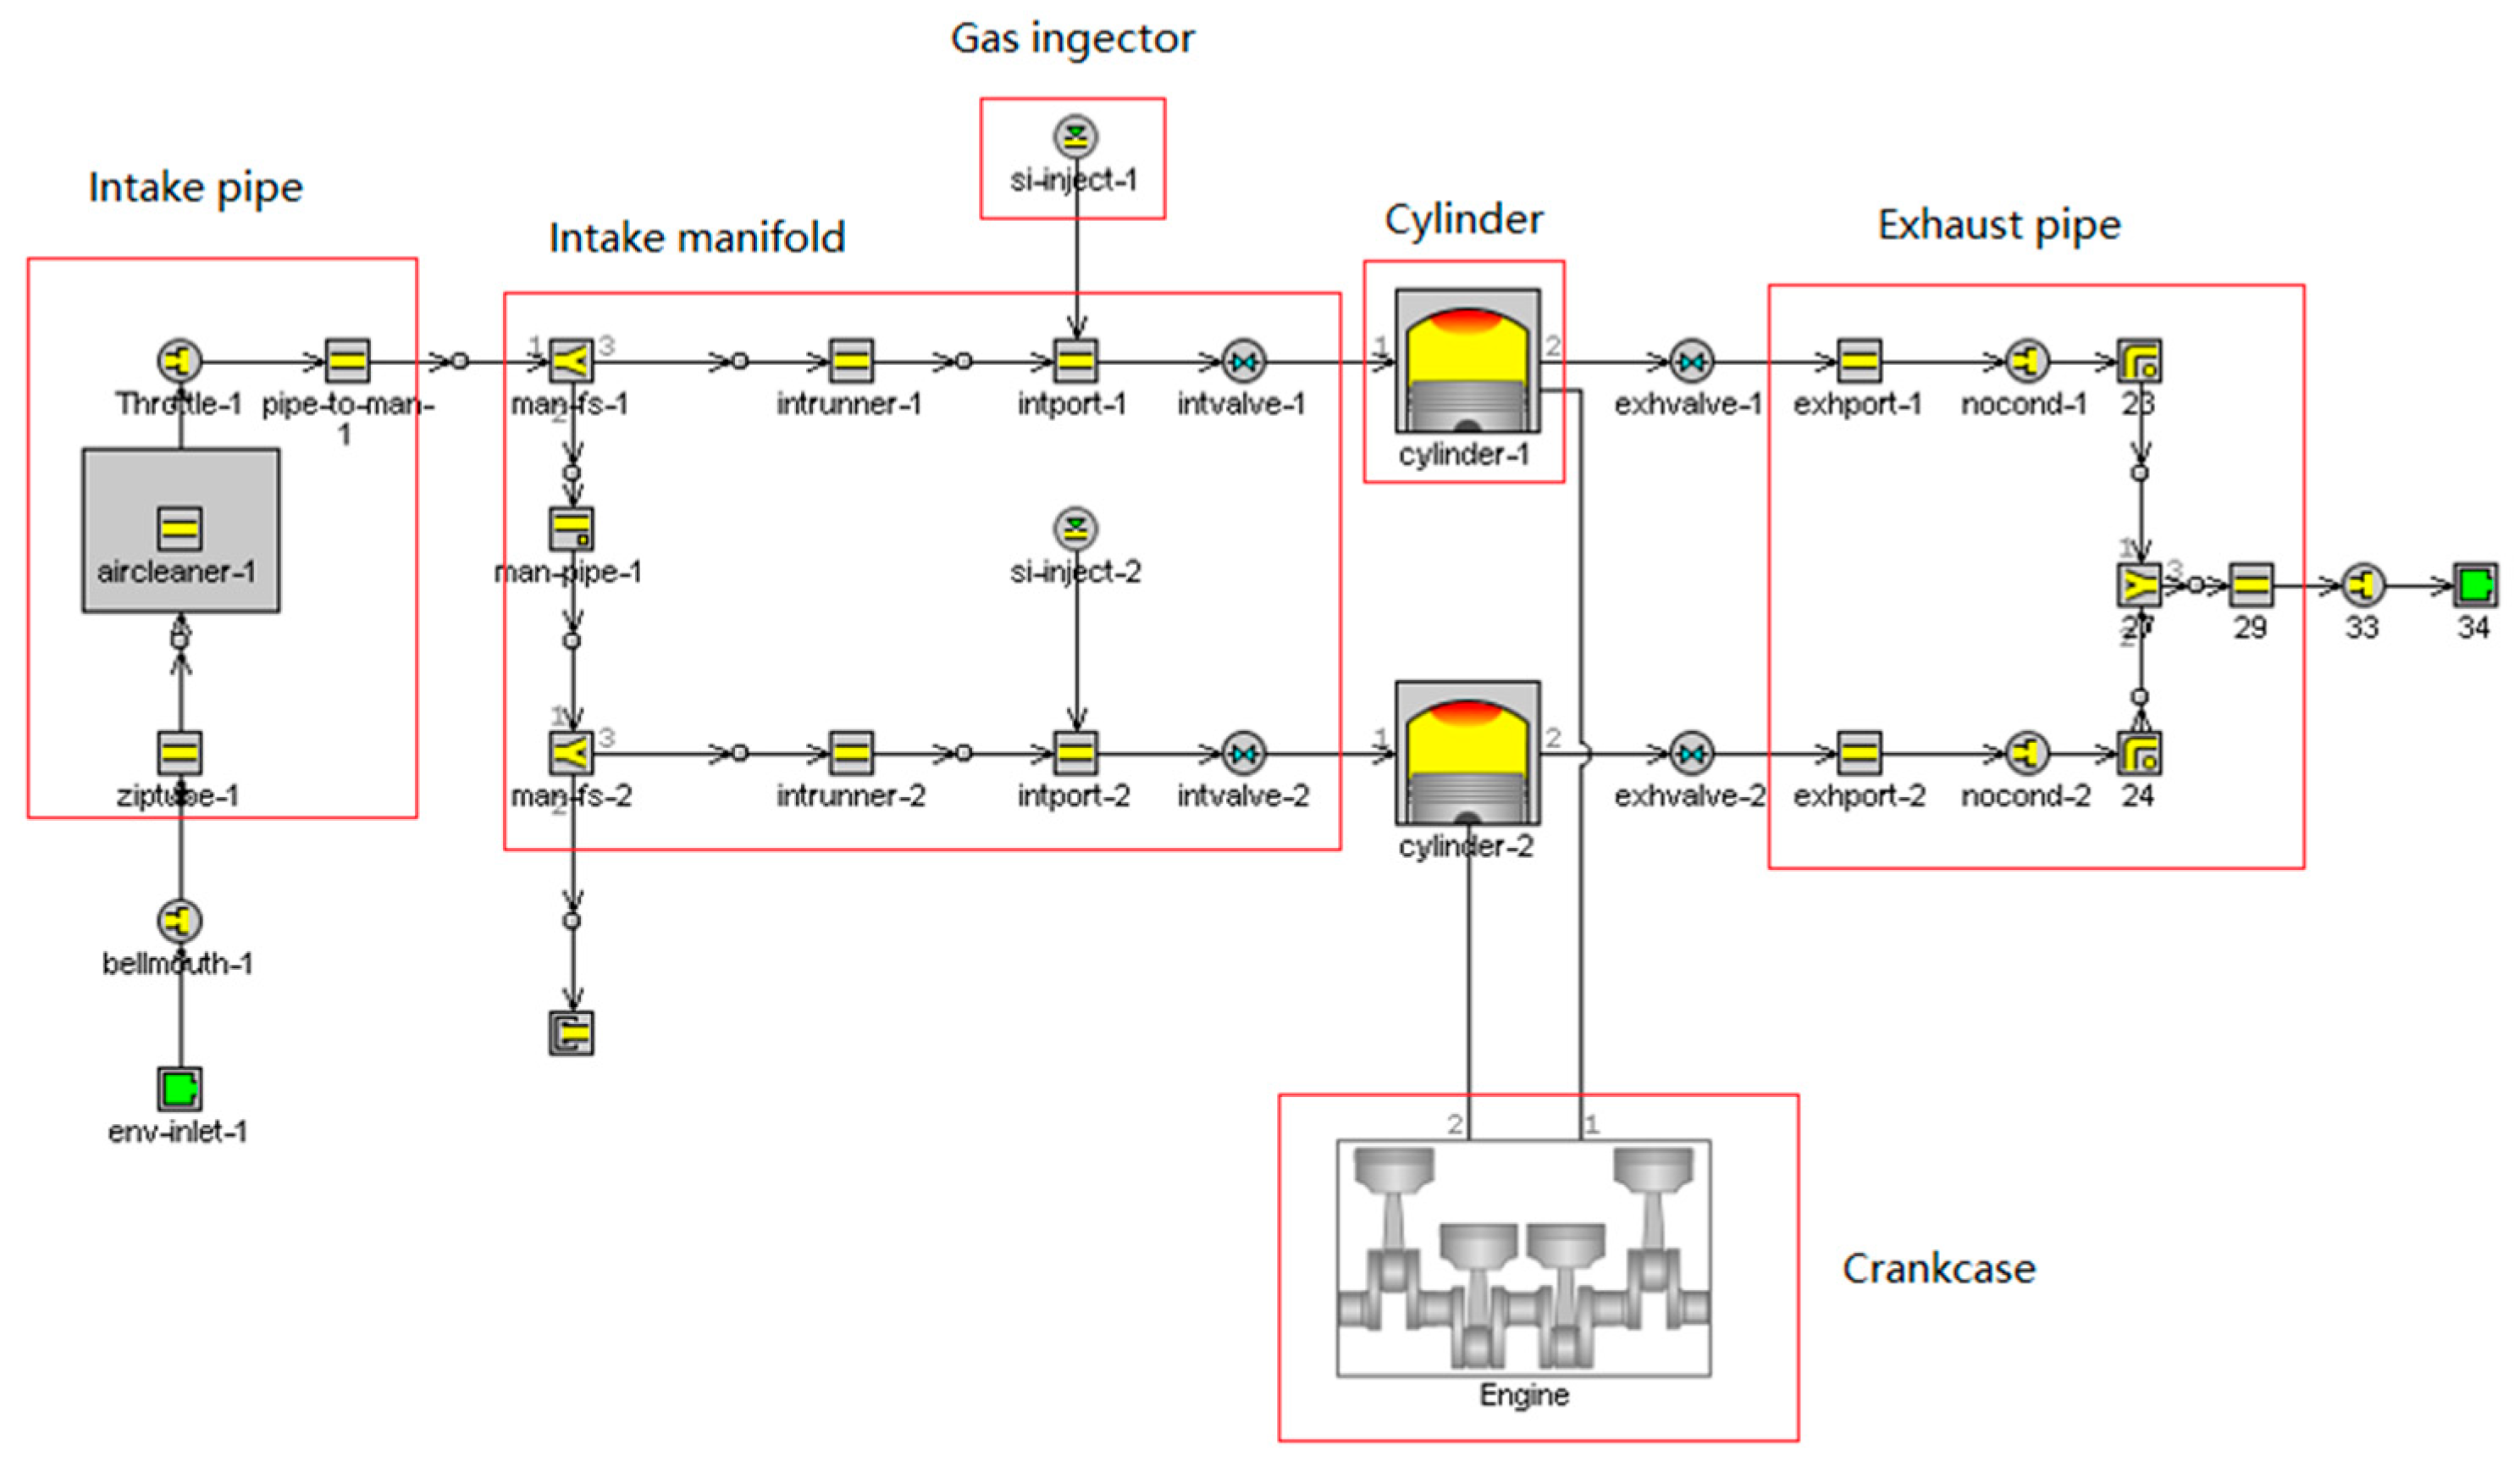
2.5.1. Engine A
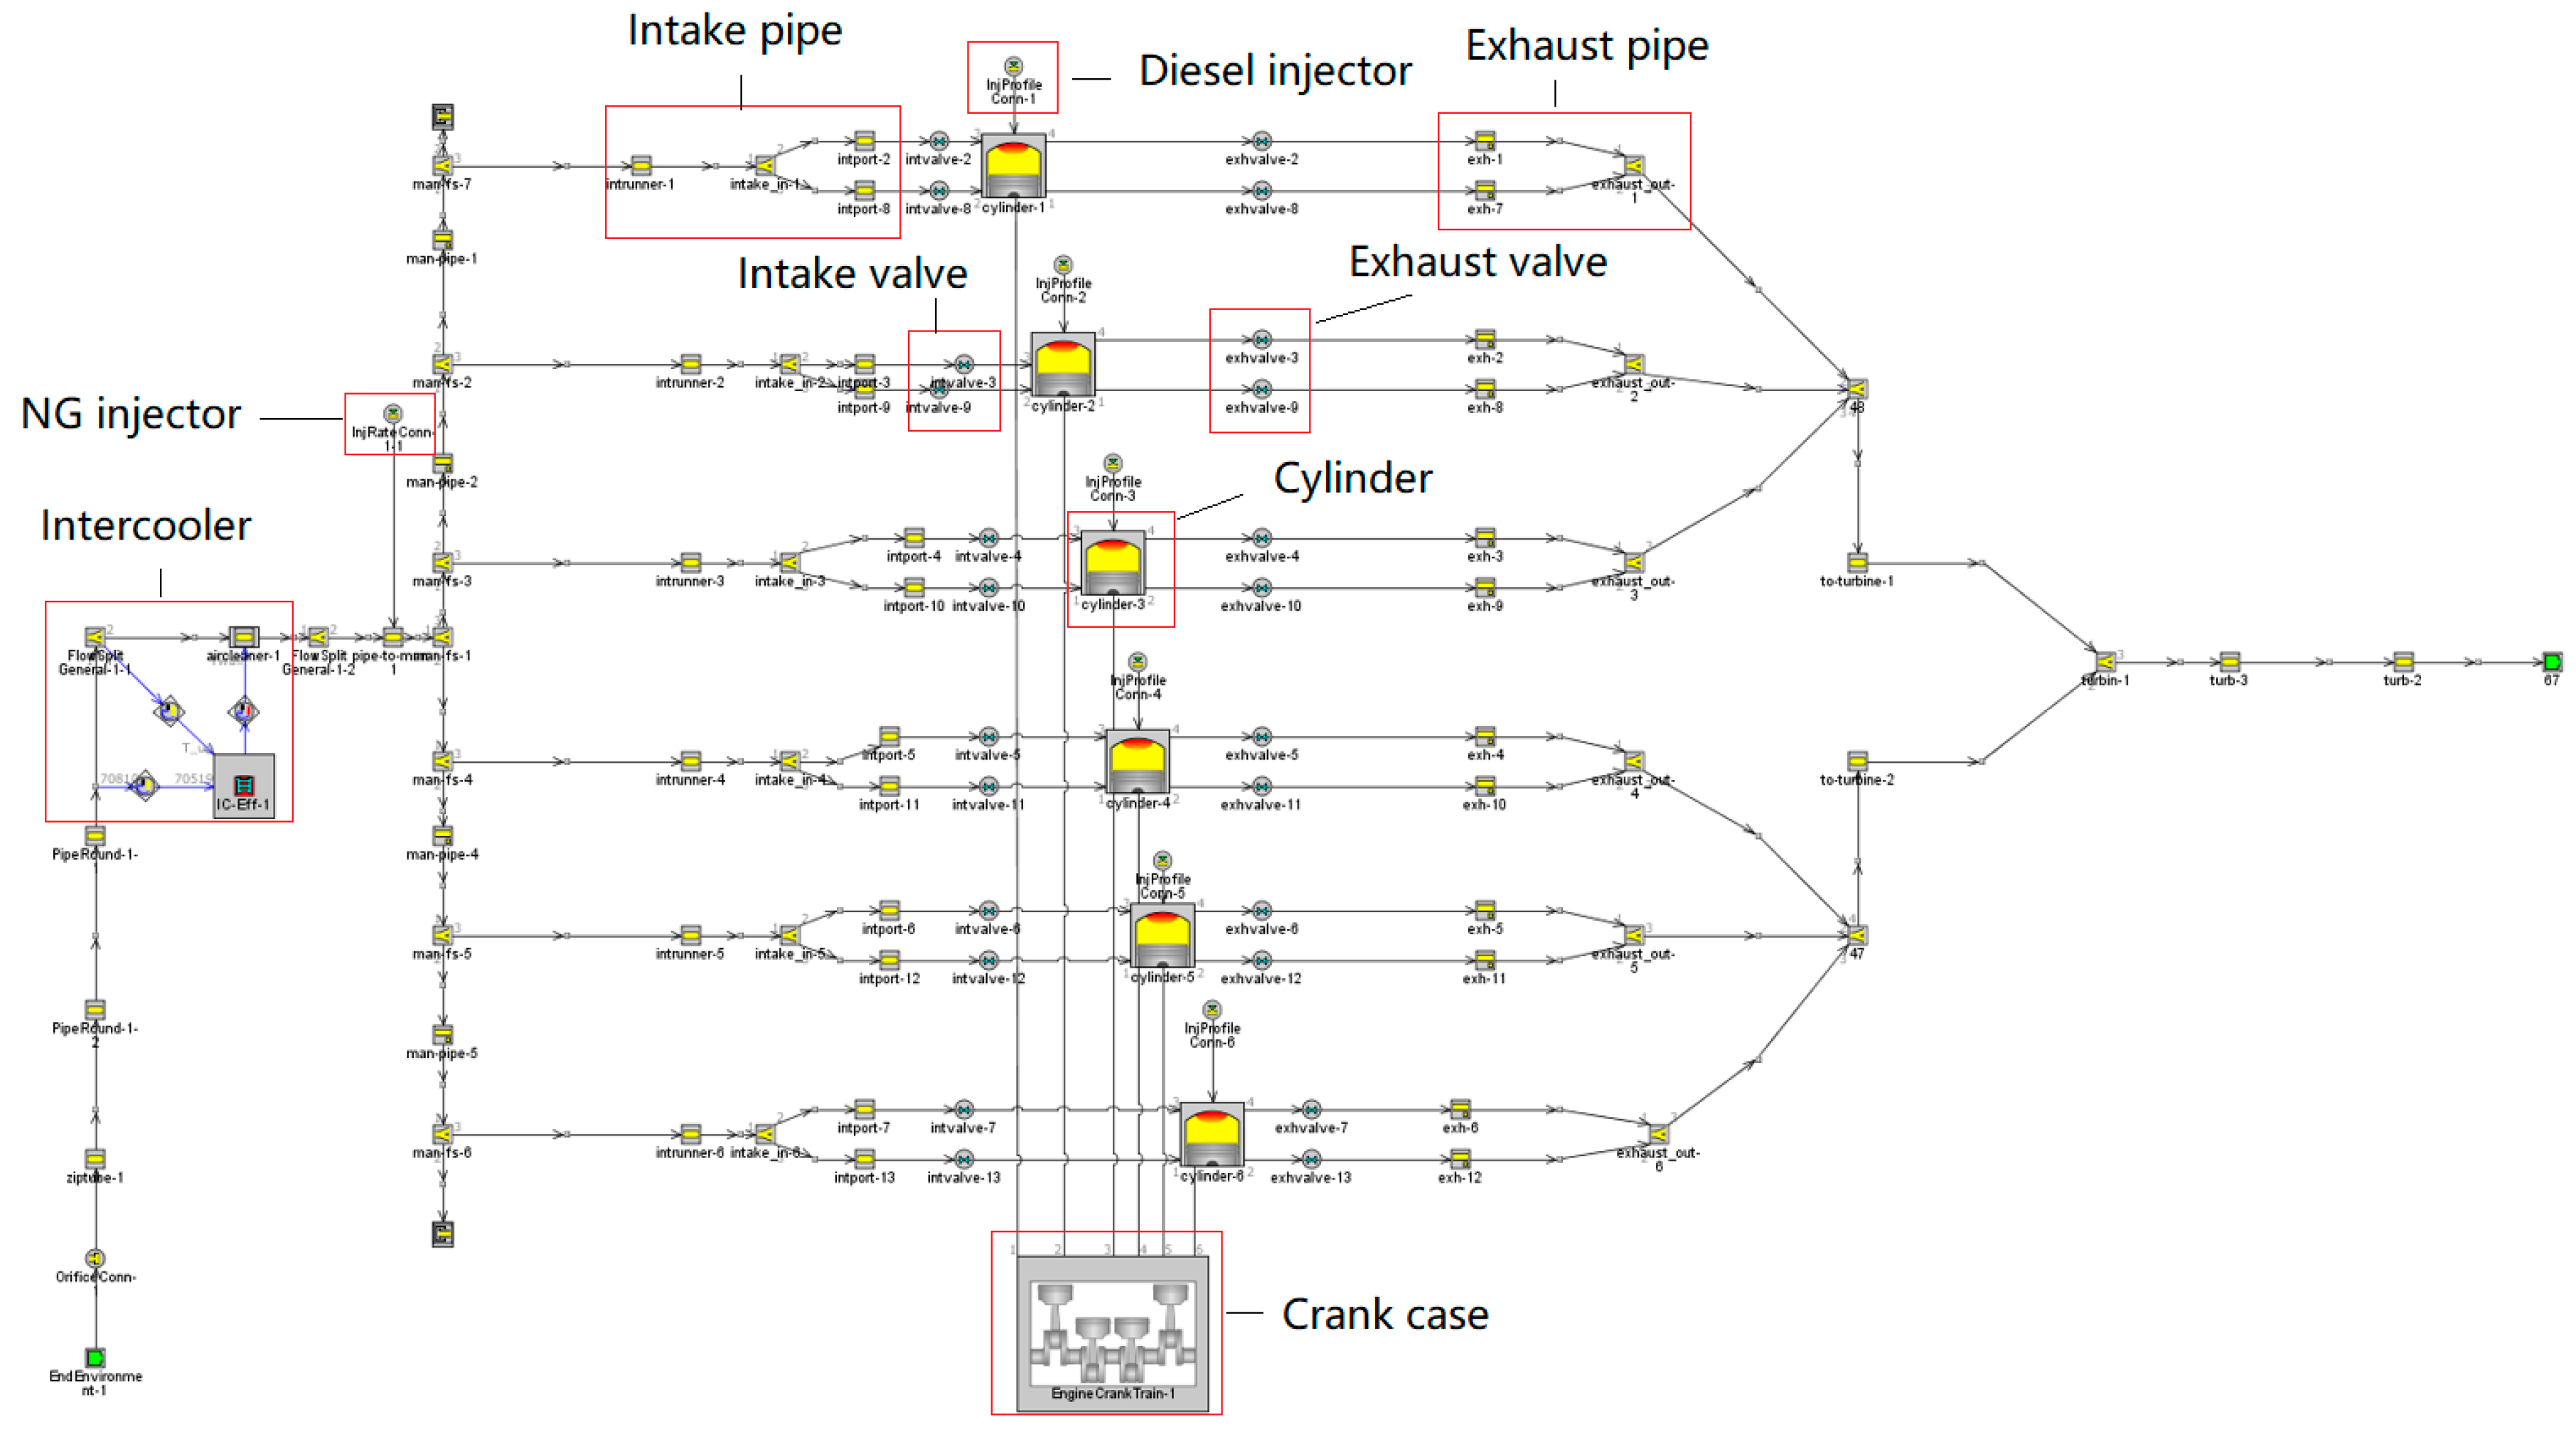
2.5.2. Engine B
3. Engine Setup and Model Validation
3.1. Experimental Set up
3.2. Model Validation
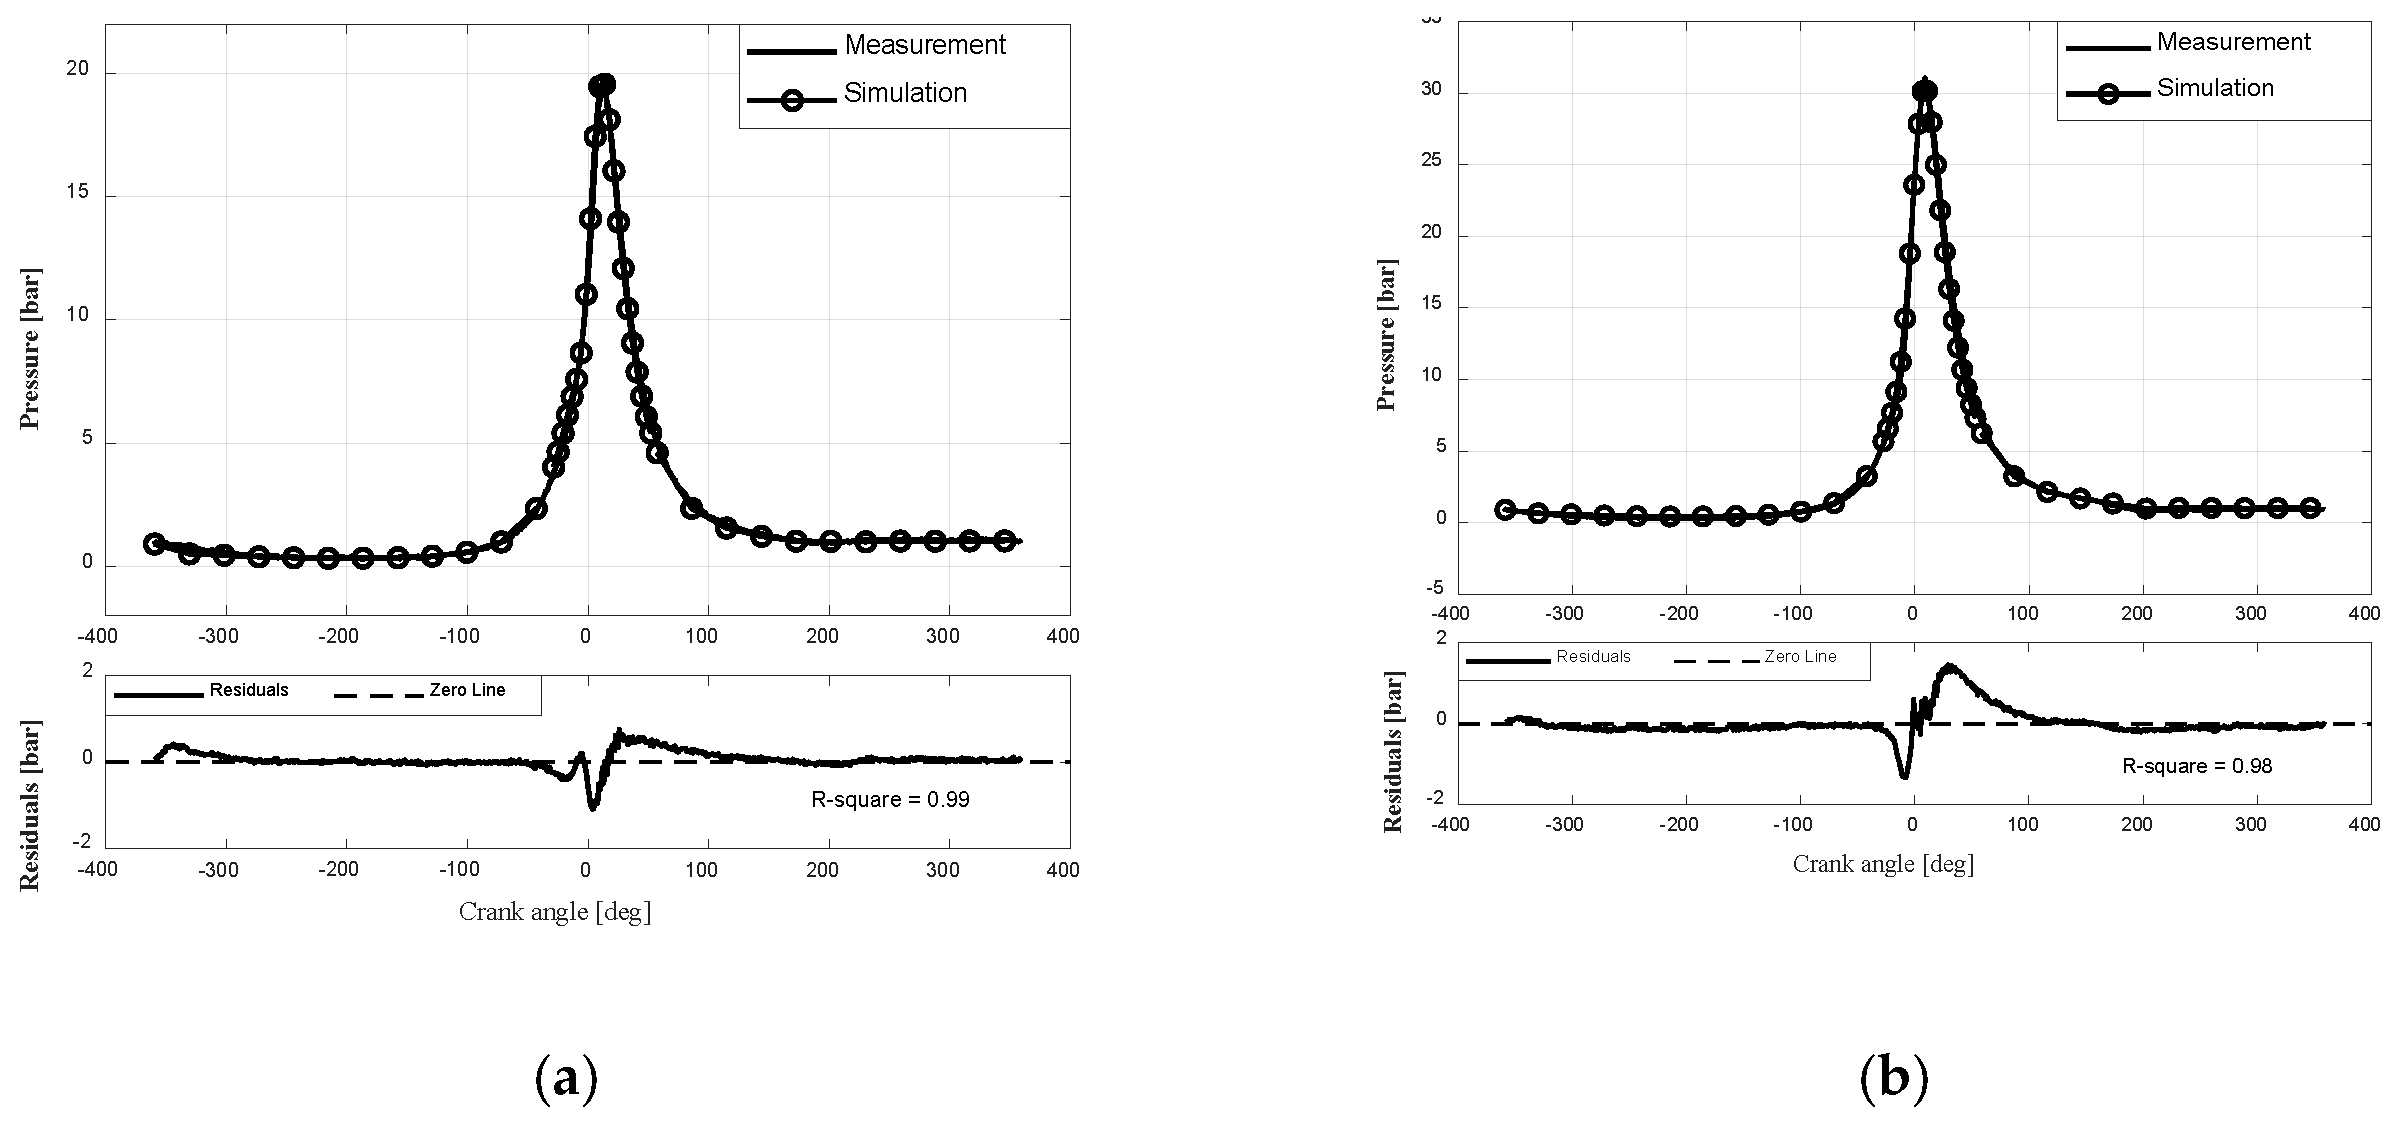
3.2.1. Engine A
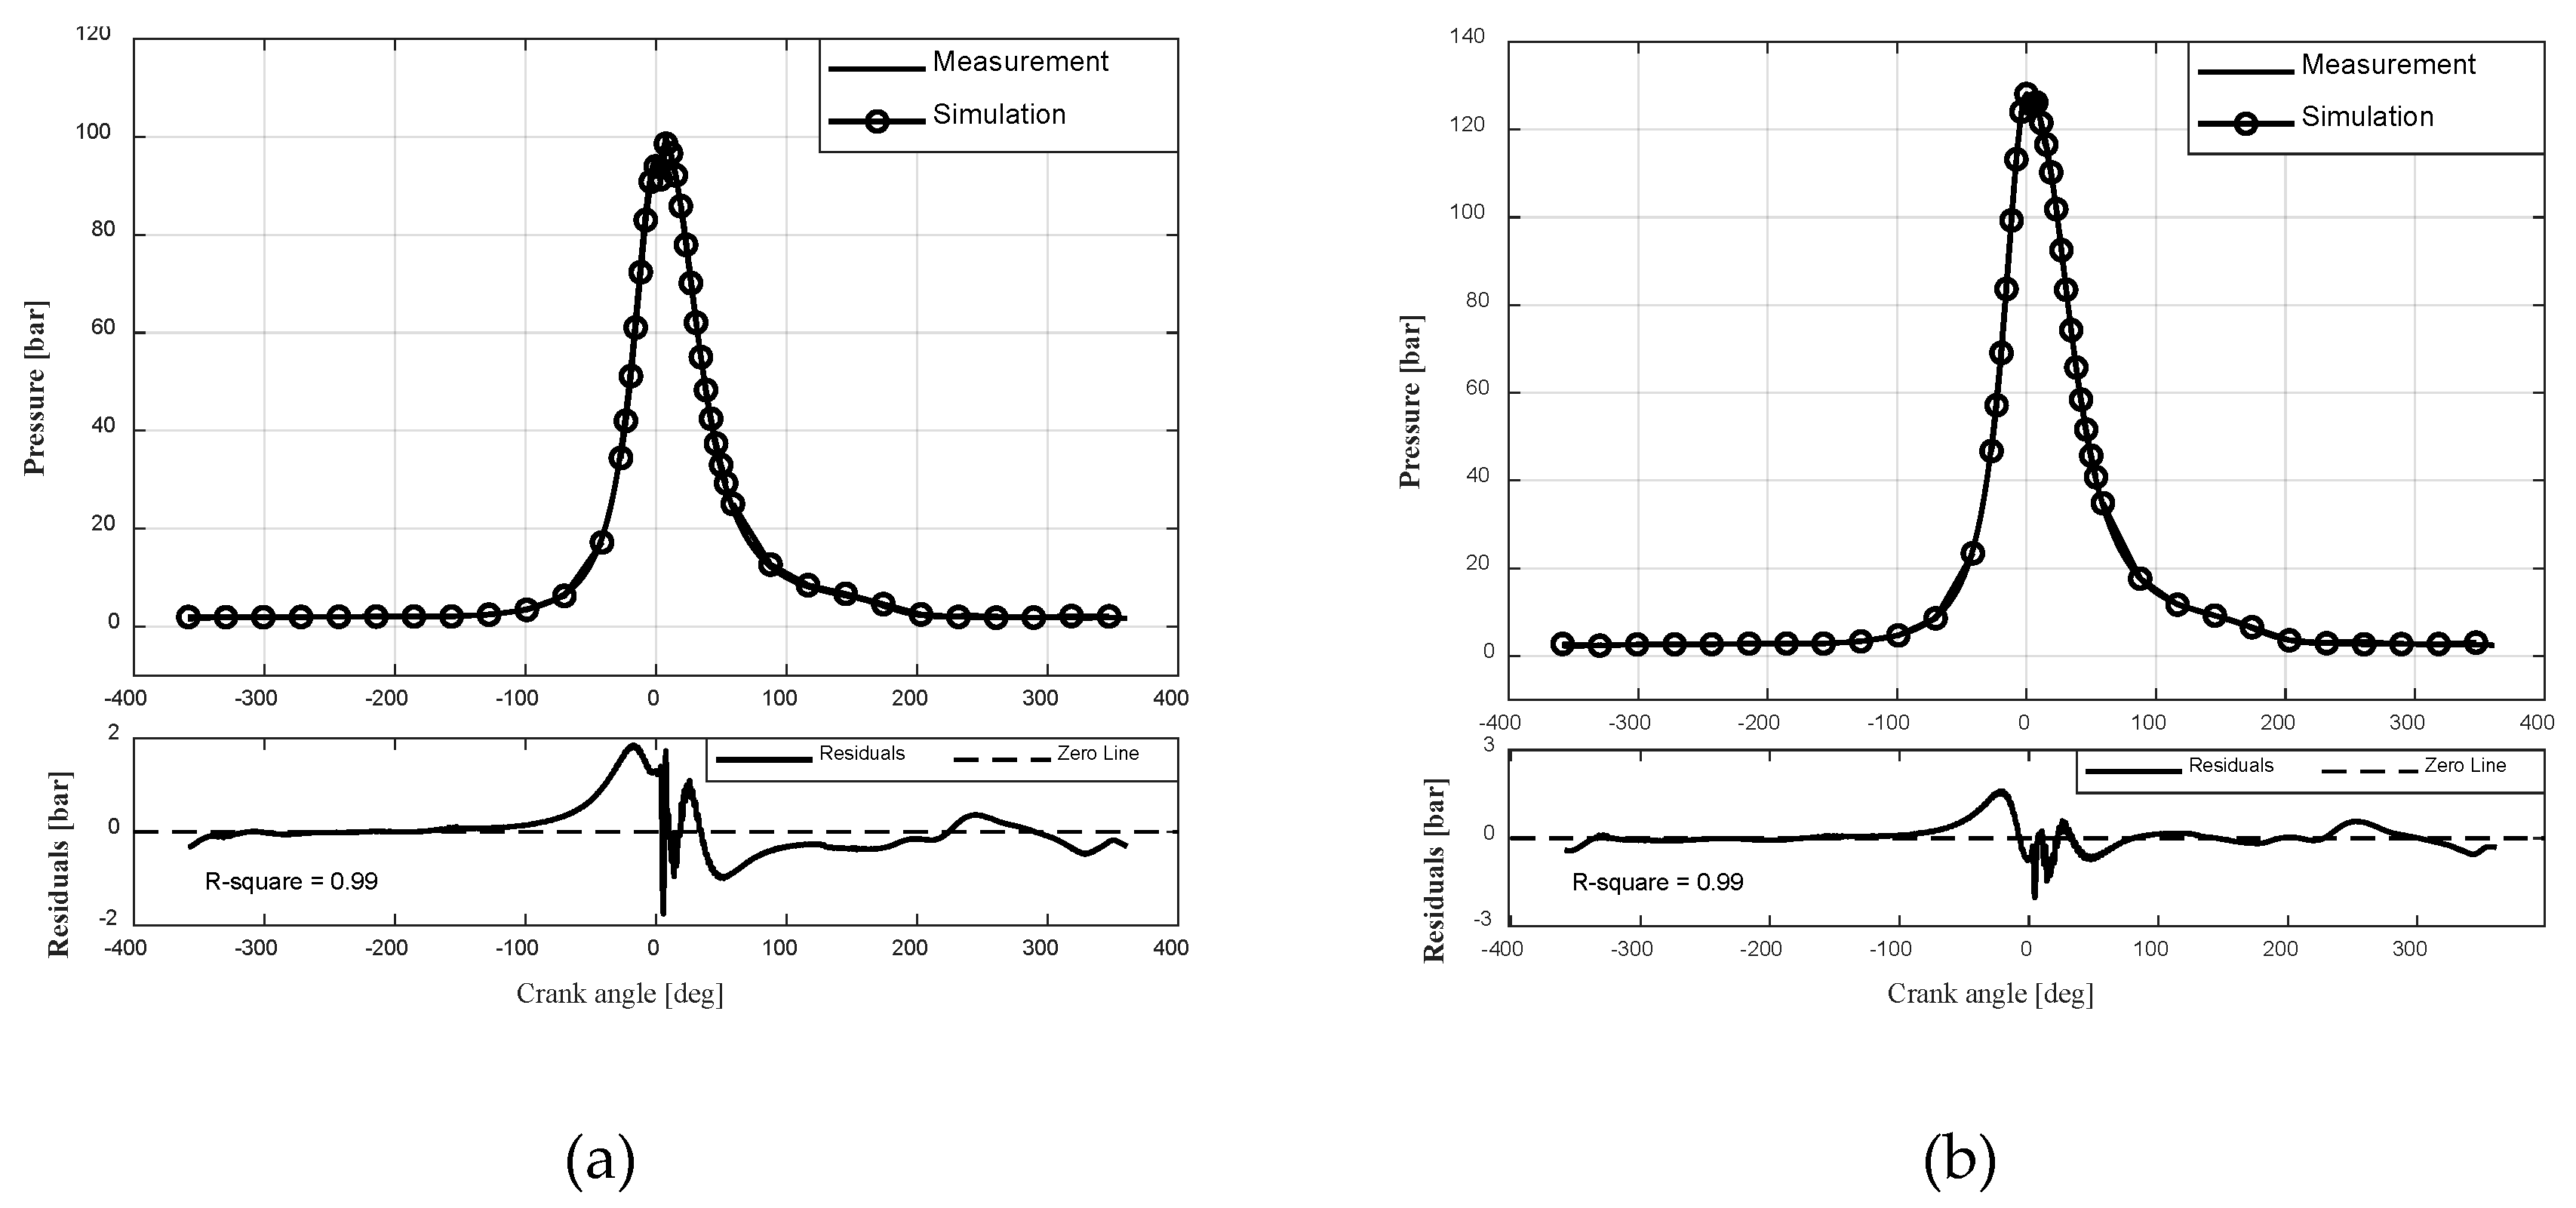
3.2.2. Engine B
4. Knocking Performance Parametric Investigation
4.1. Engine A
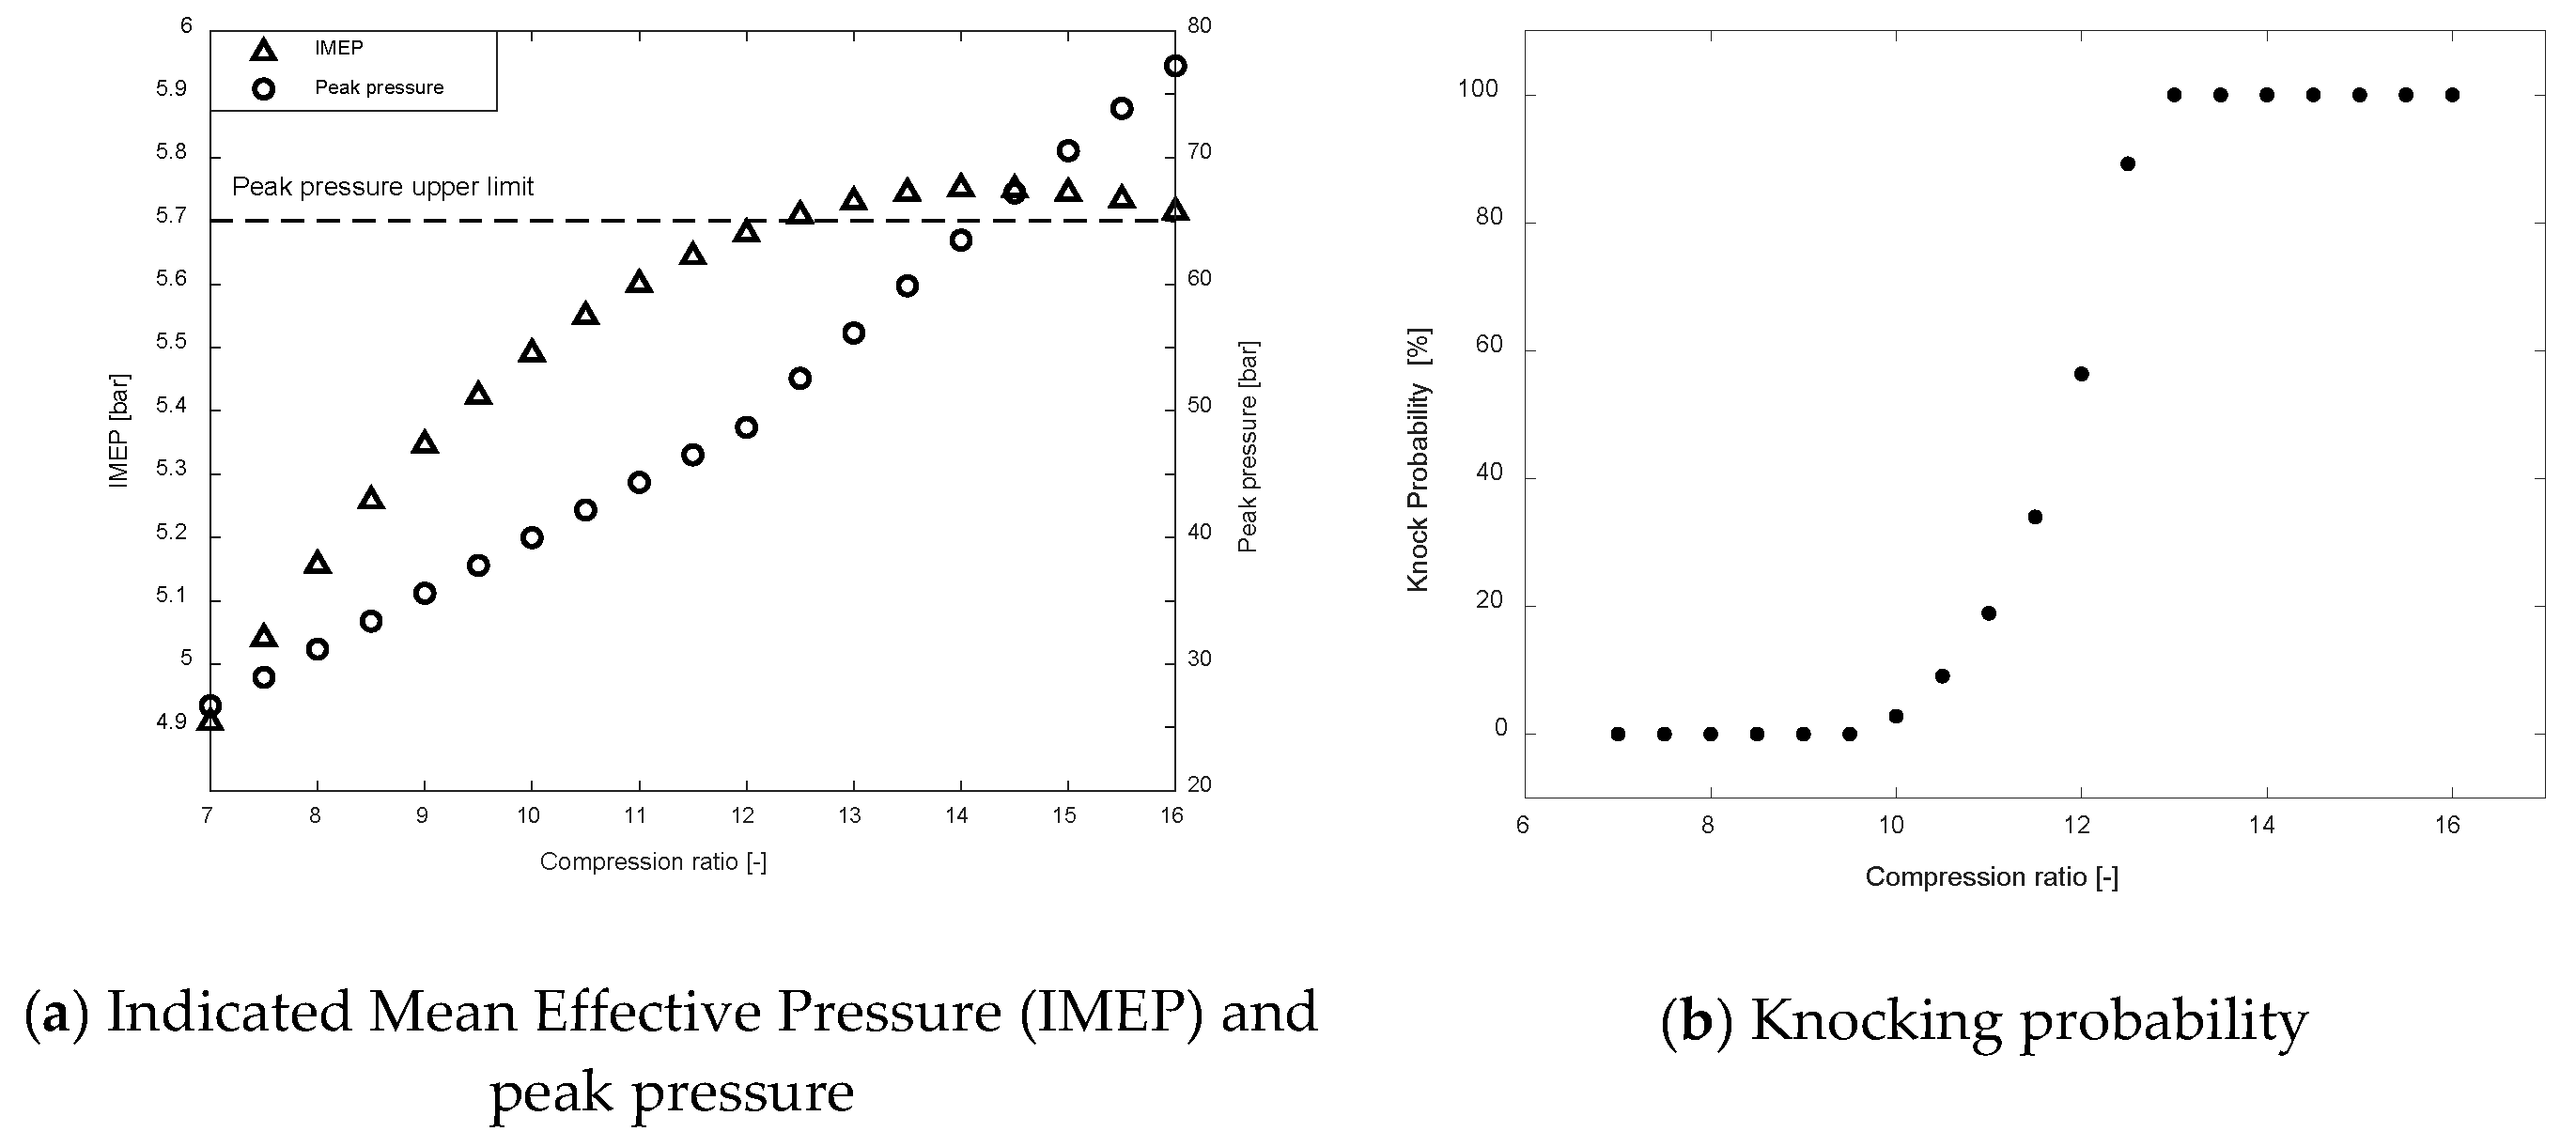
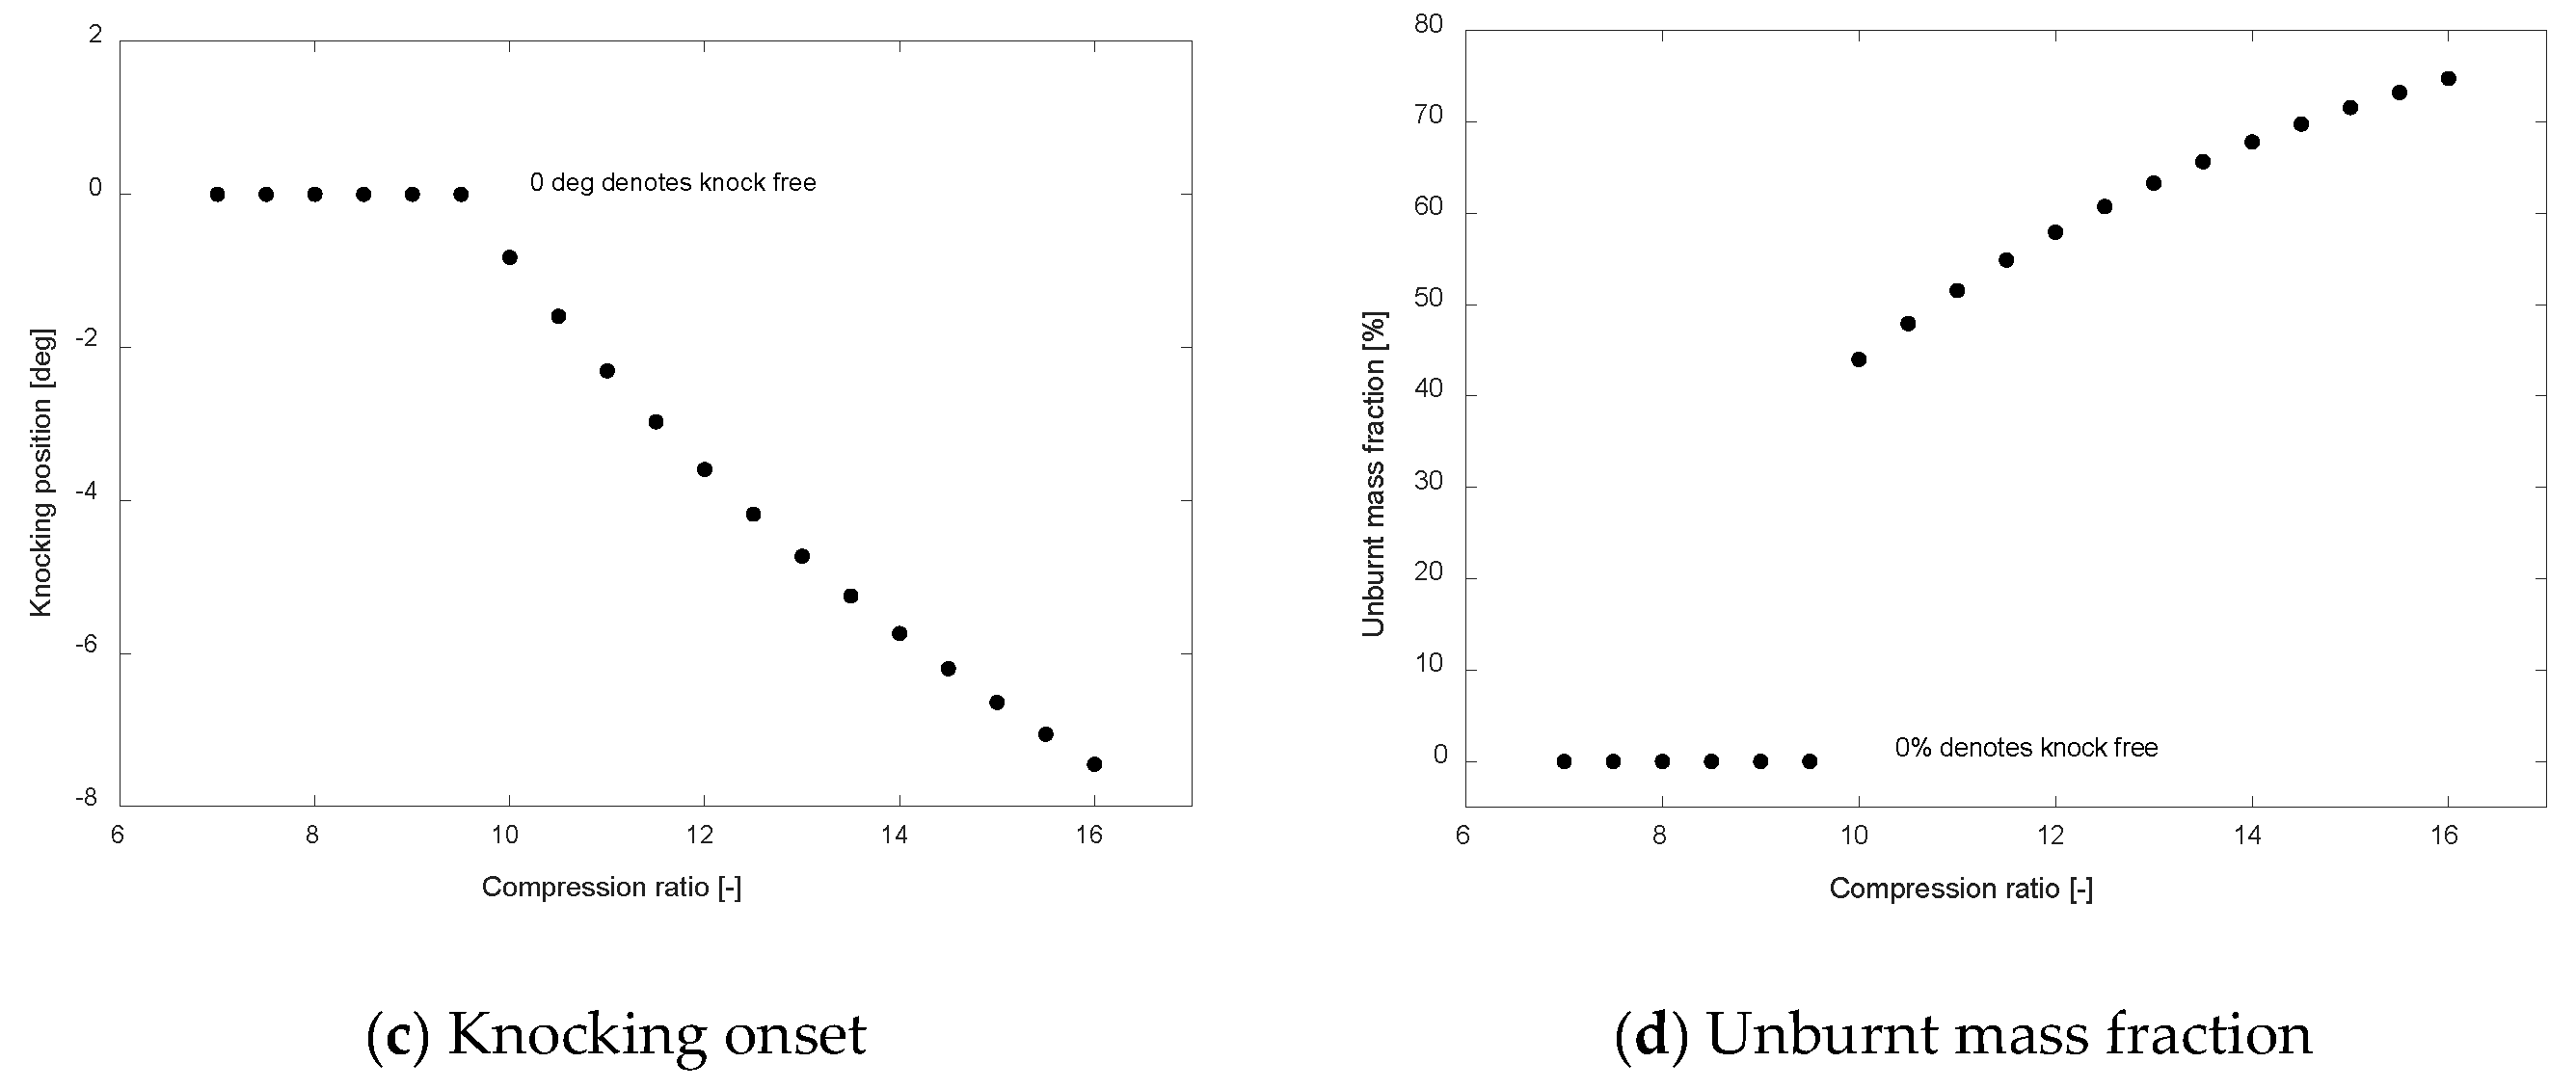
4.1.1. Compression Ratio Effect on Knocking Performance
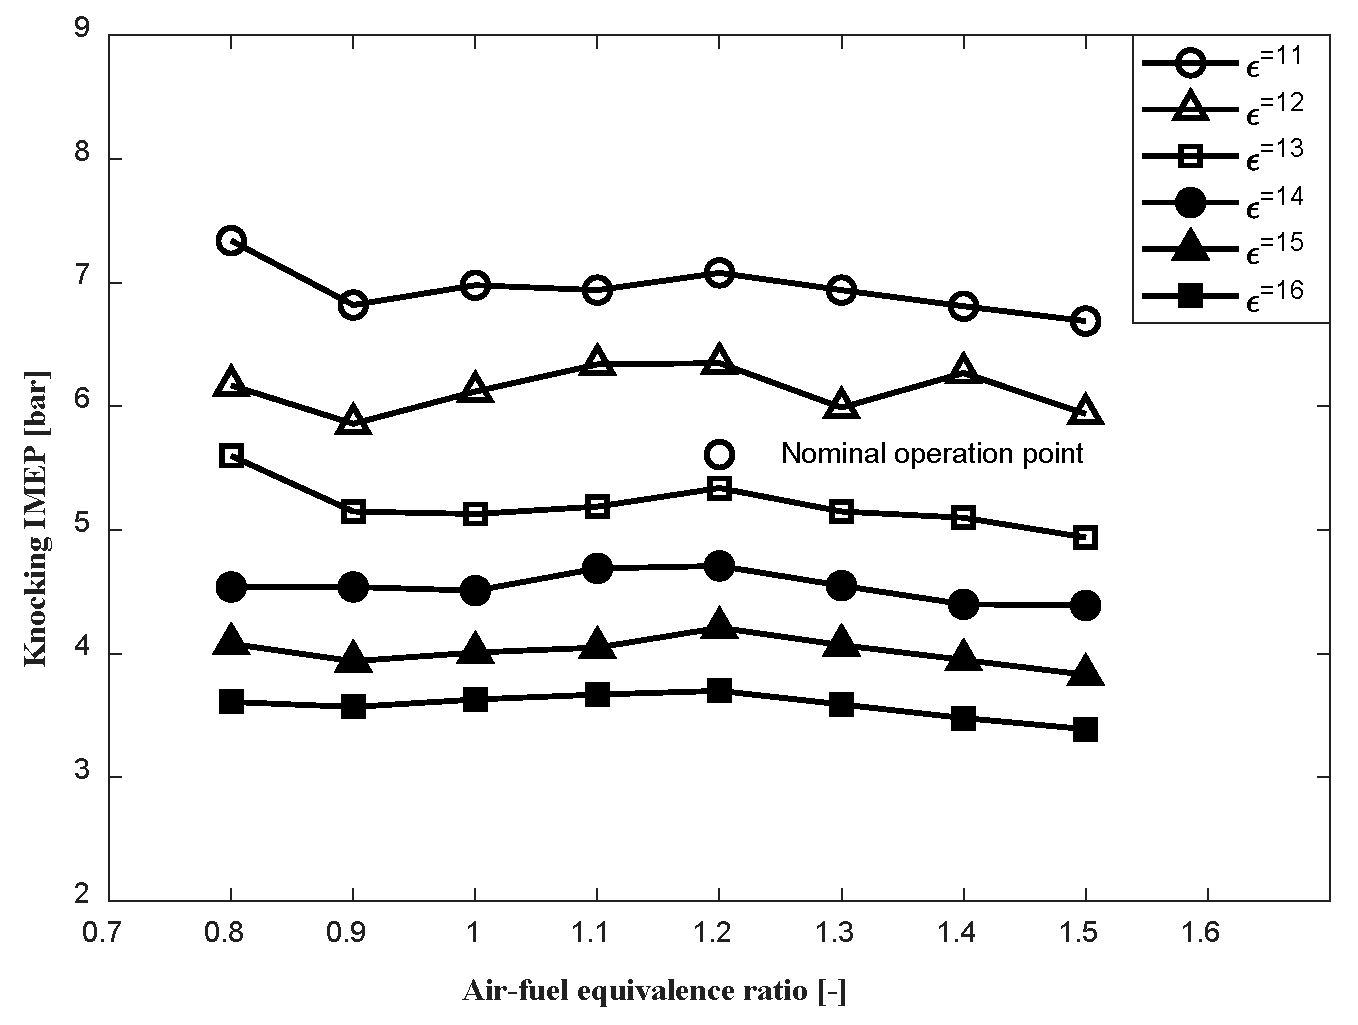
4.1.2. Air-Fuel Equivalence Ratio Effect on Knocking Performance
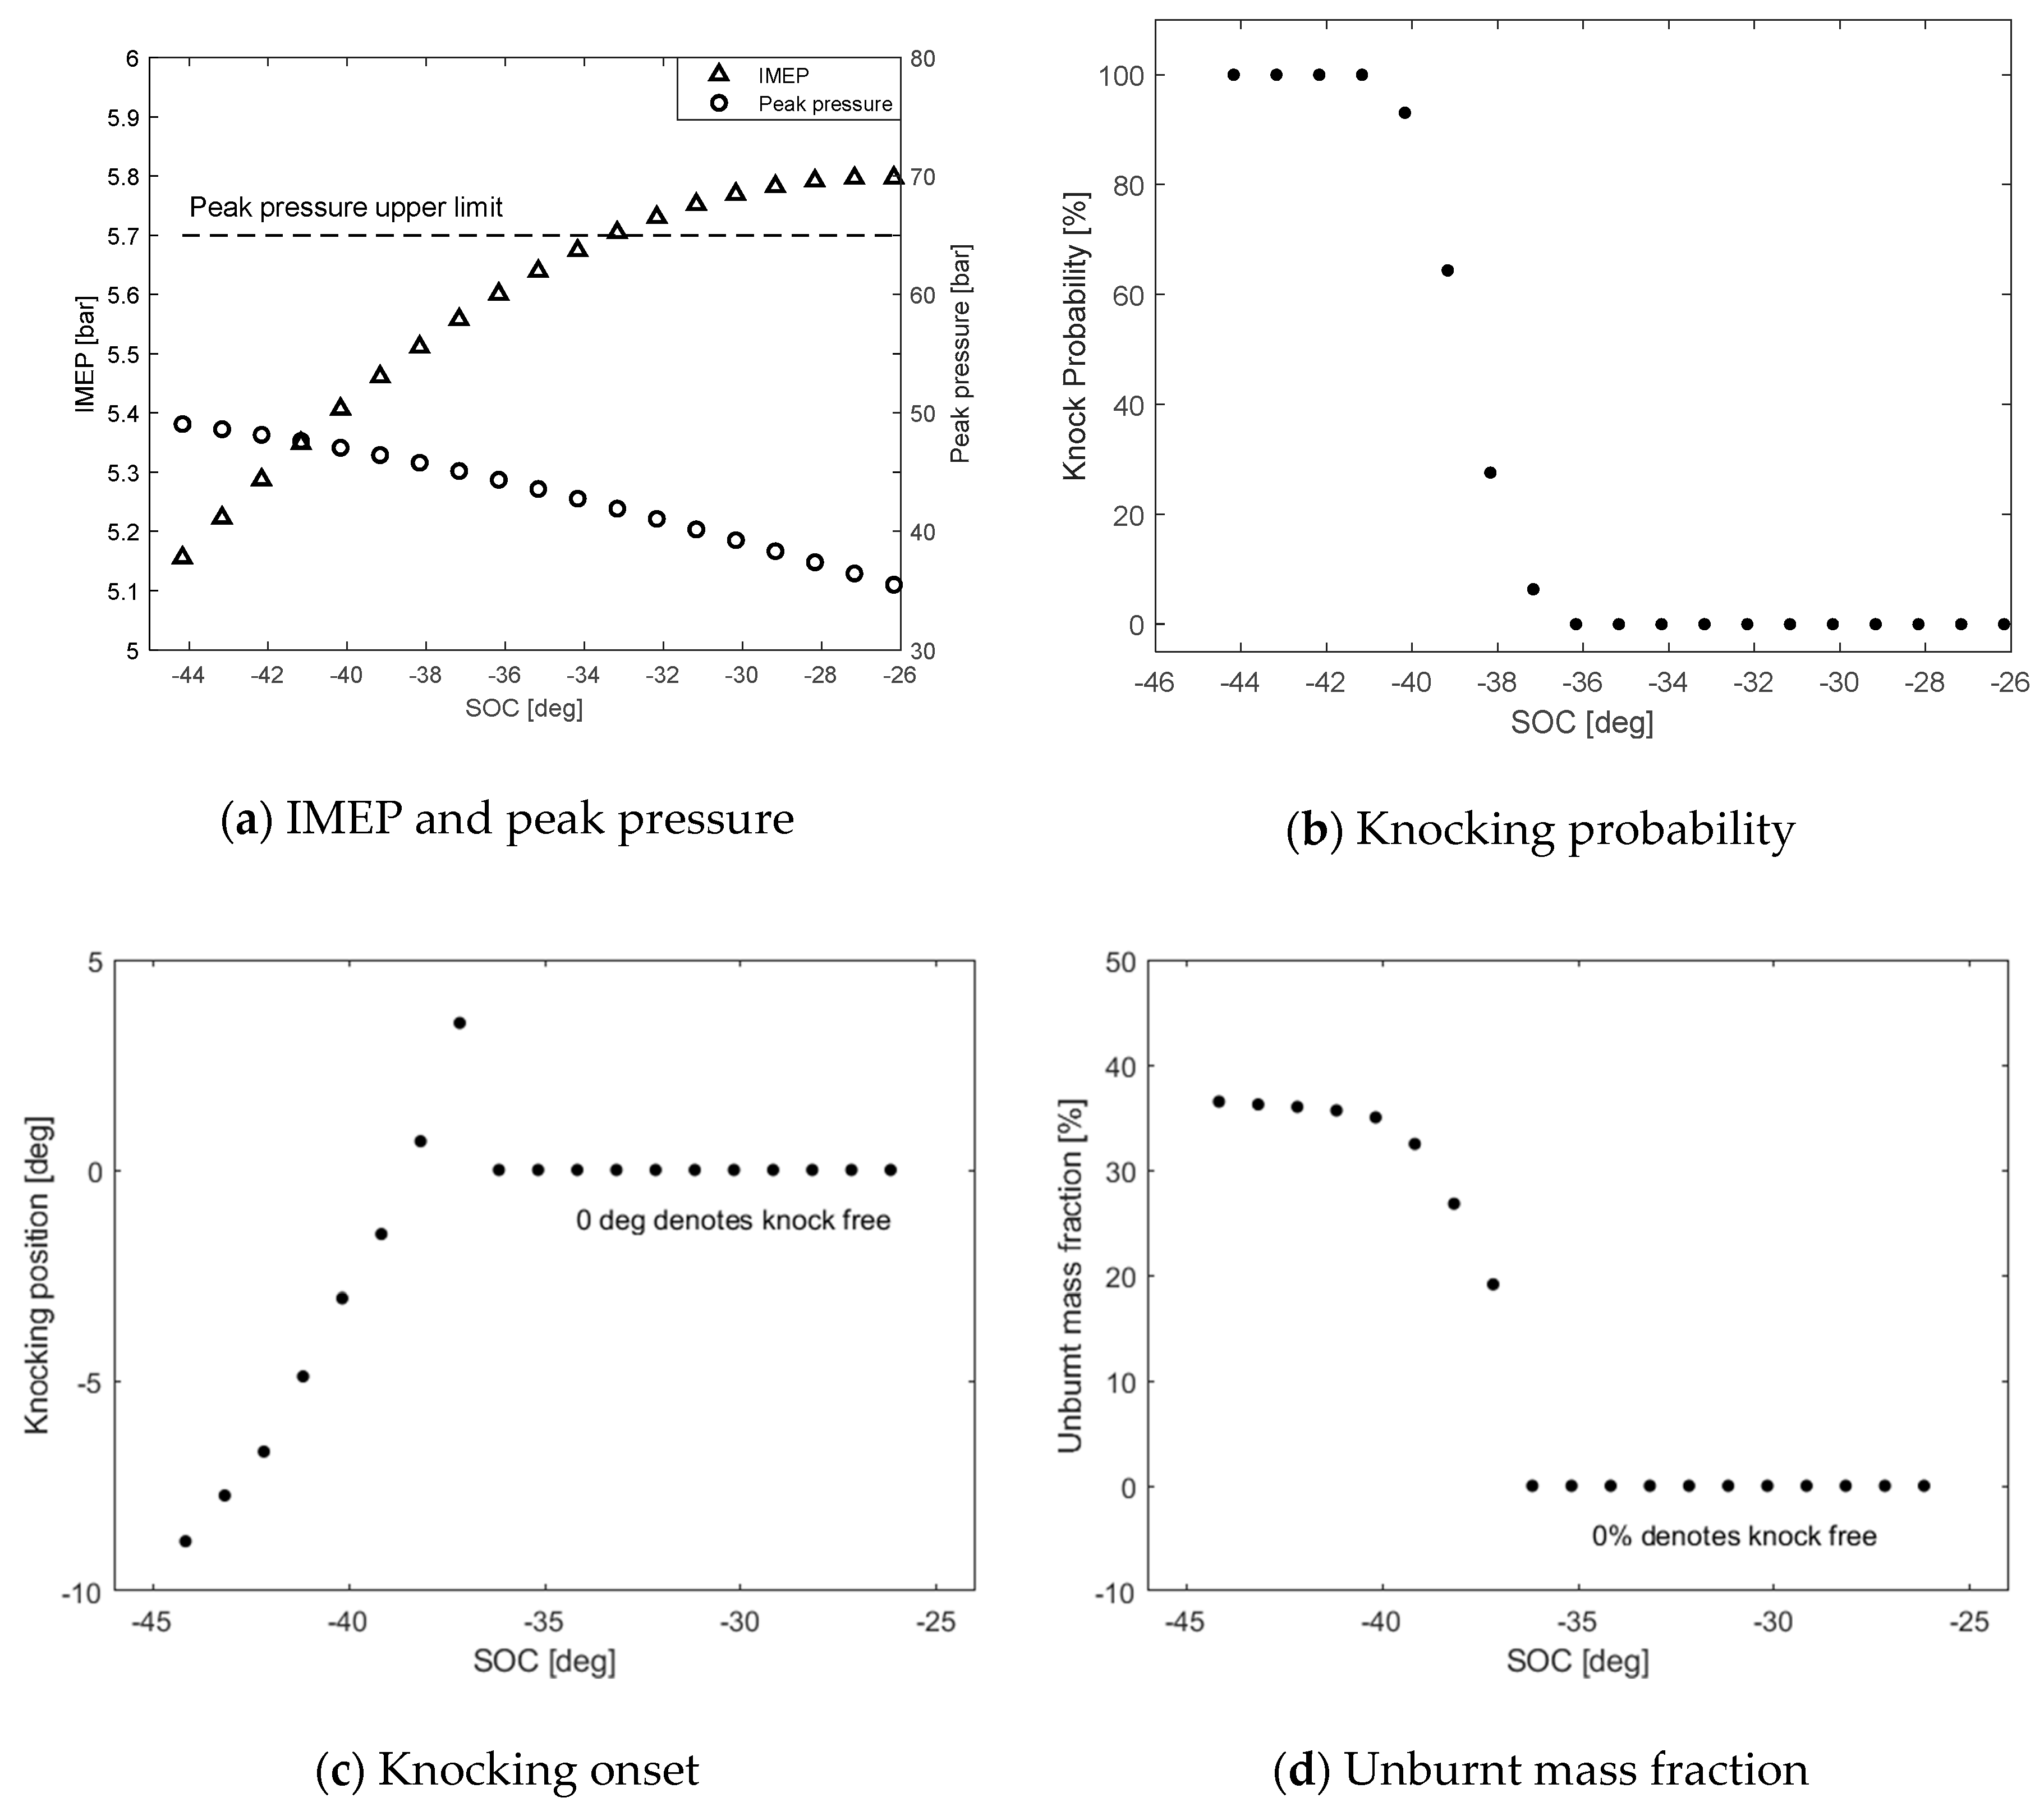
4.1.3. Ignition Timing Effect on Knocking Performance
4.2. Engine B
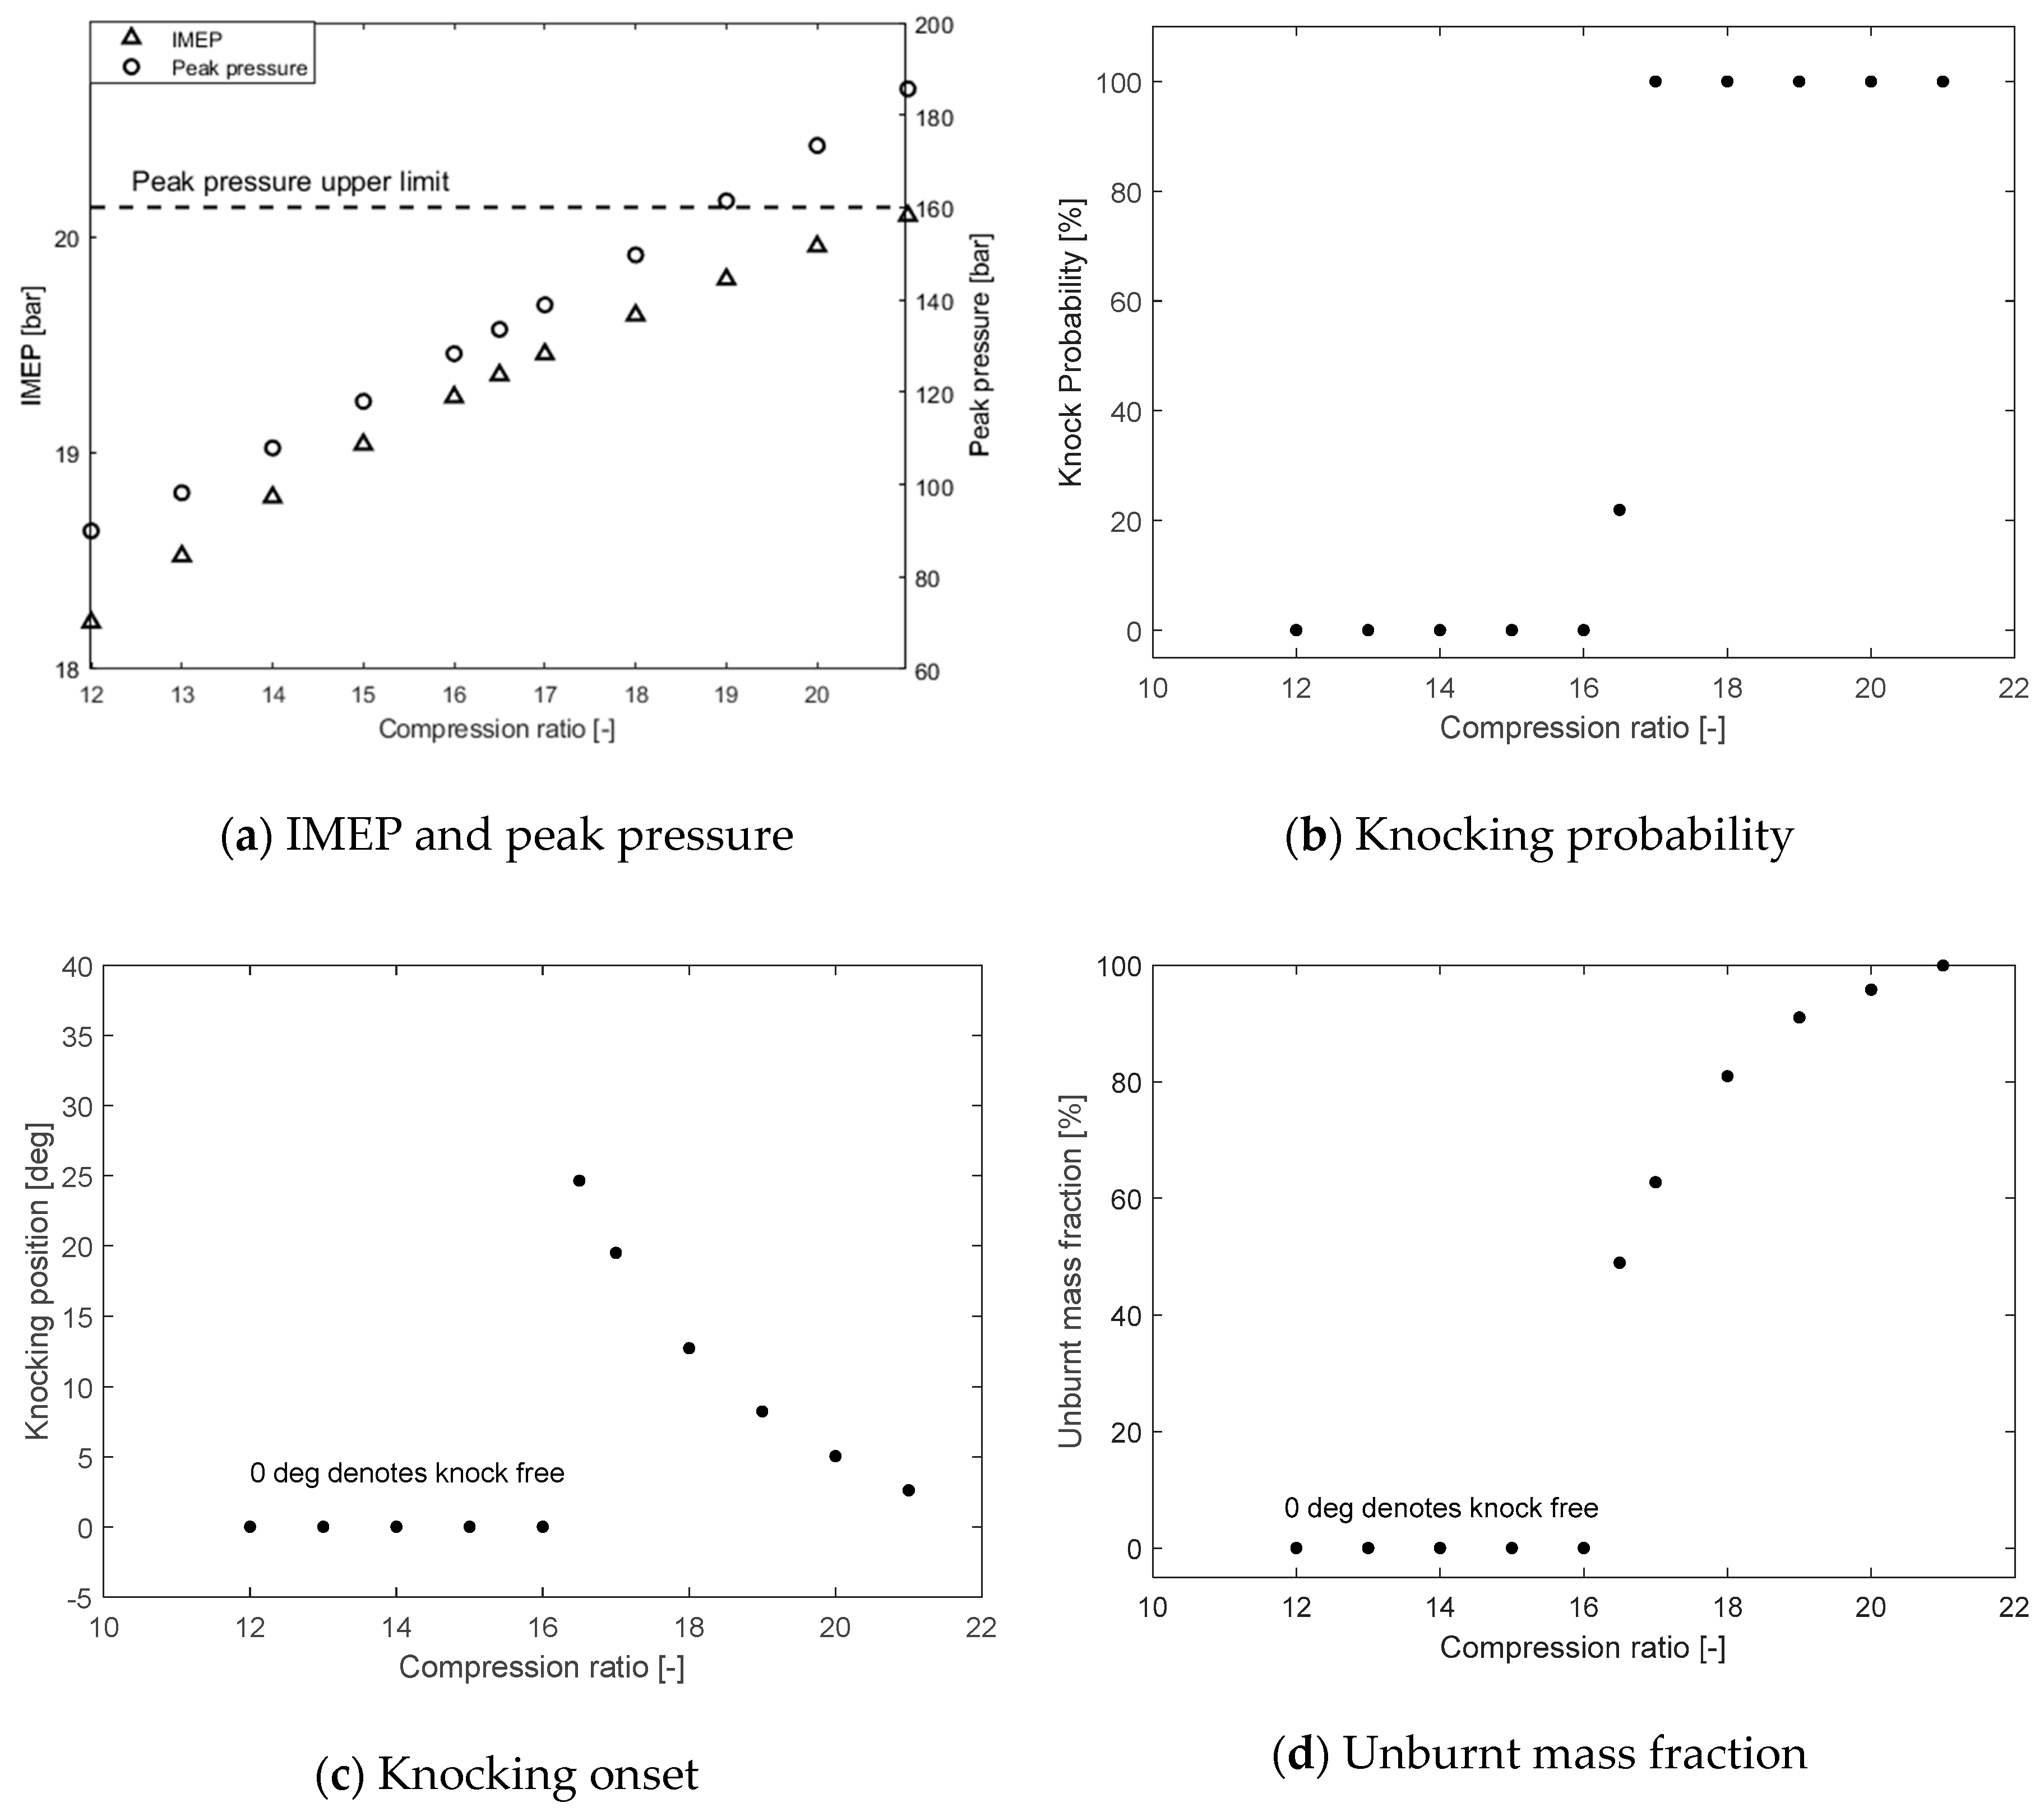
4.2.1. Compression Ratio Effect on Knocking Performance
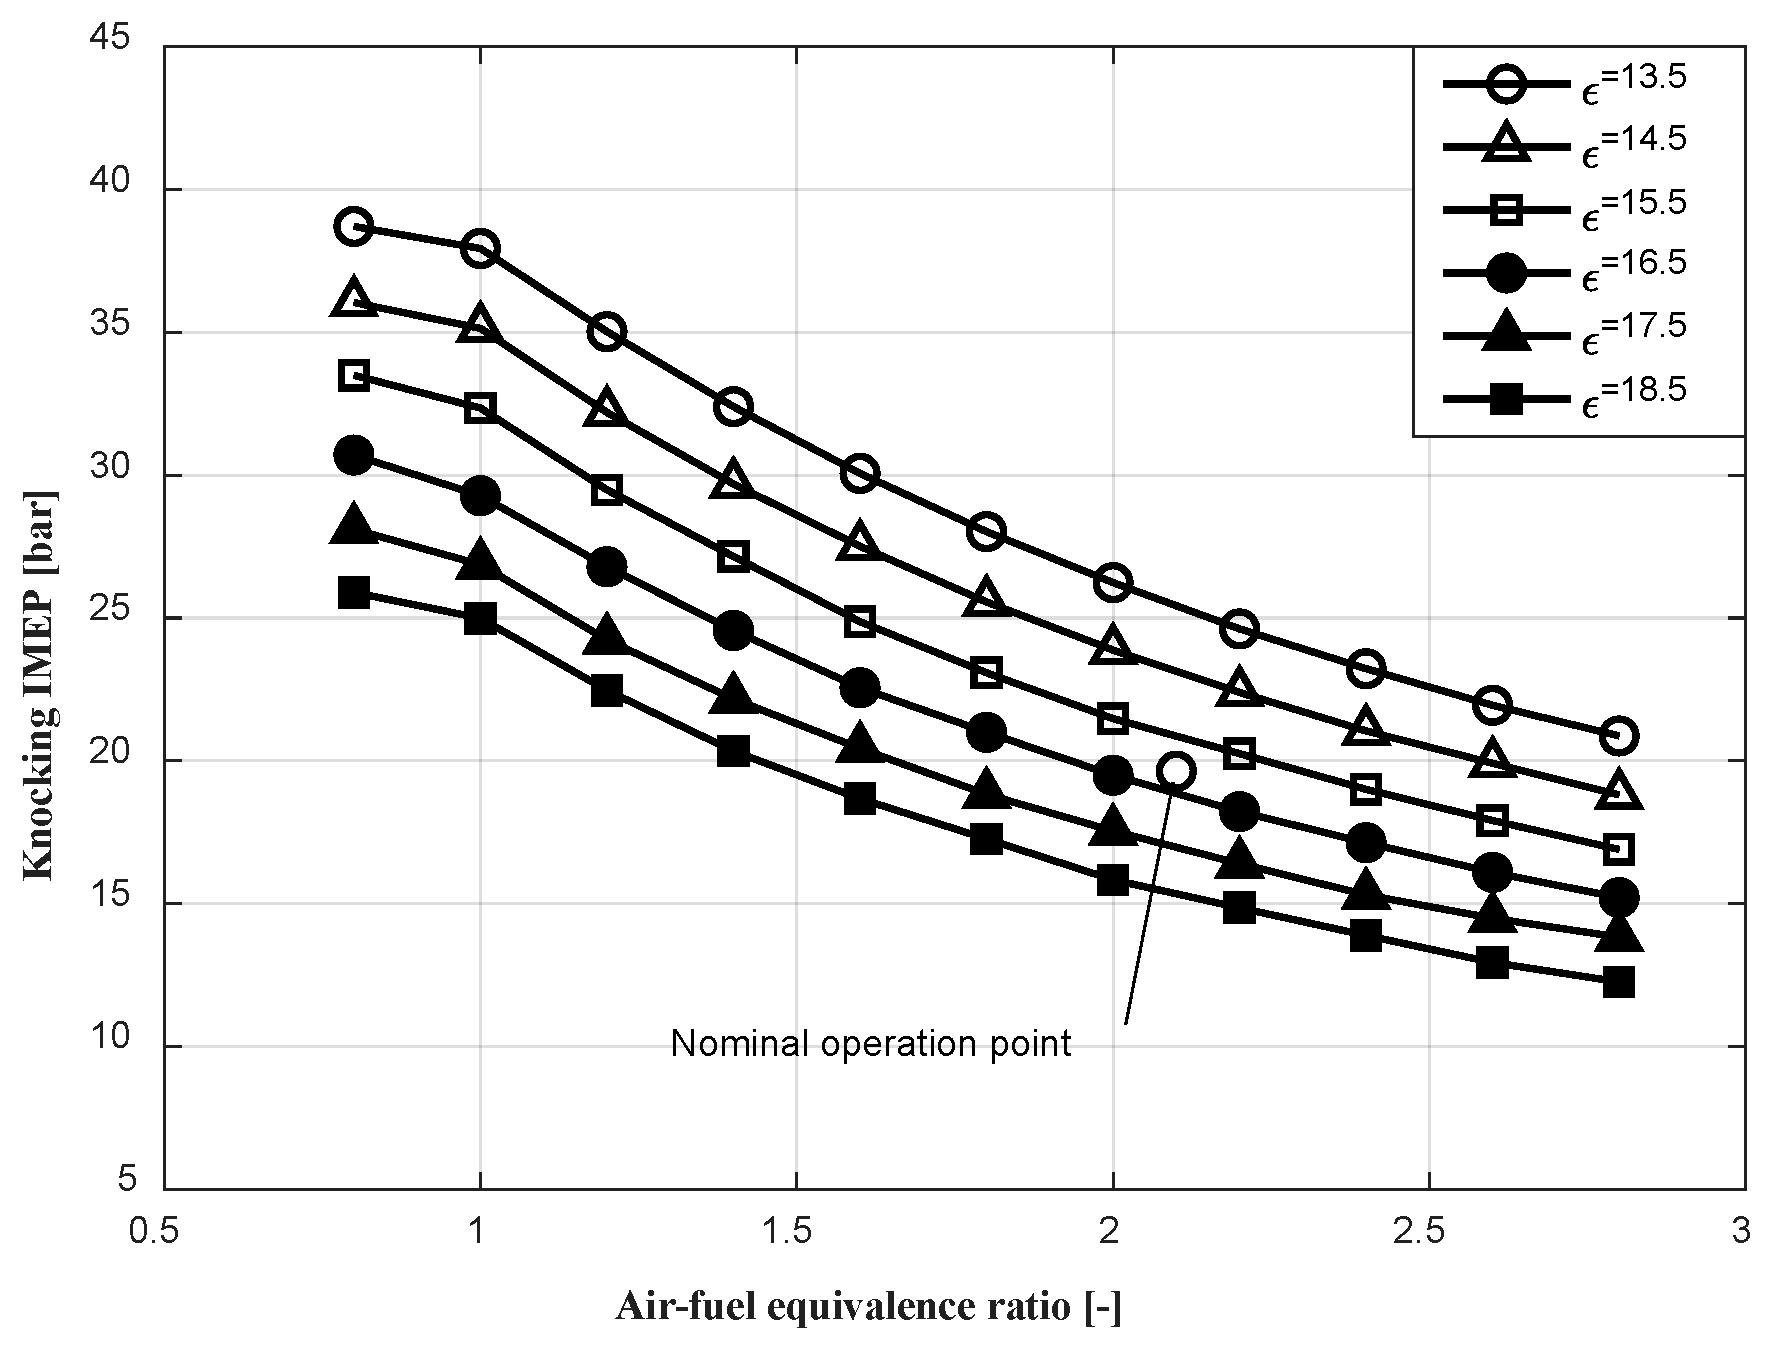
4.2.2. Air-fuel Equivalence Ratio Effect on Knocking Performance
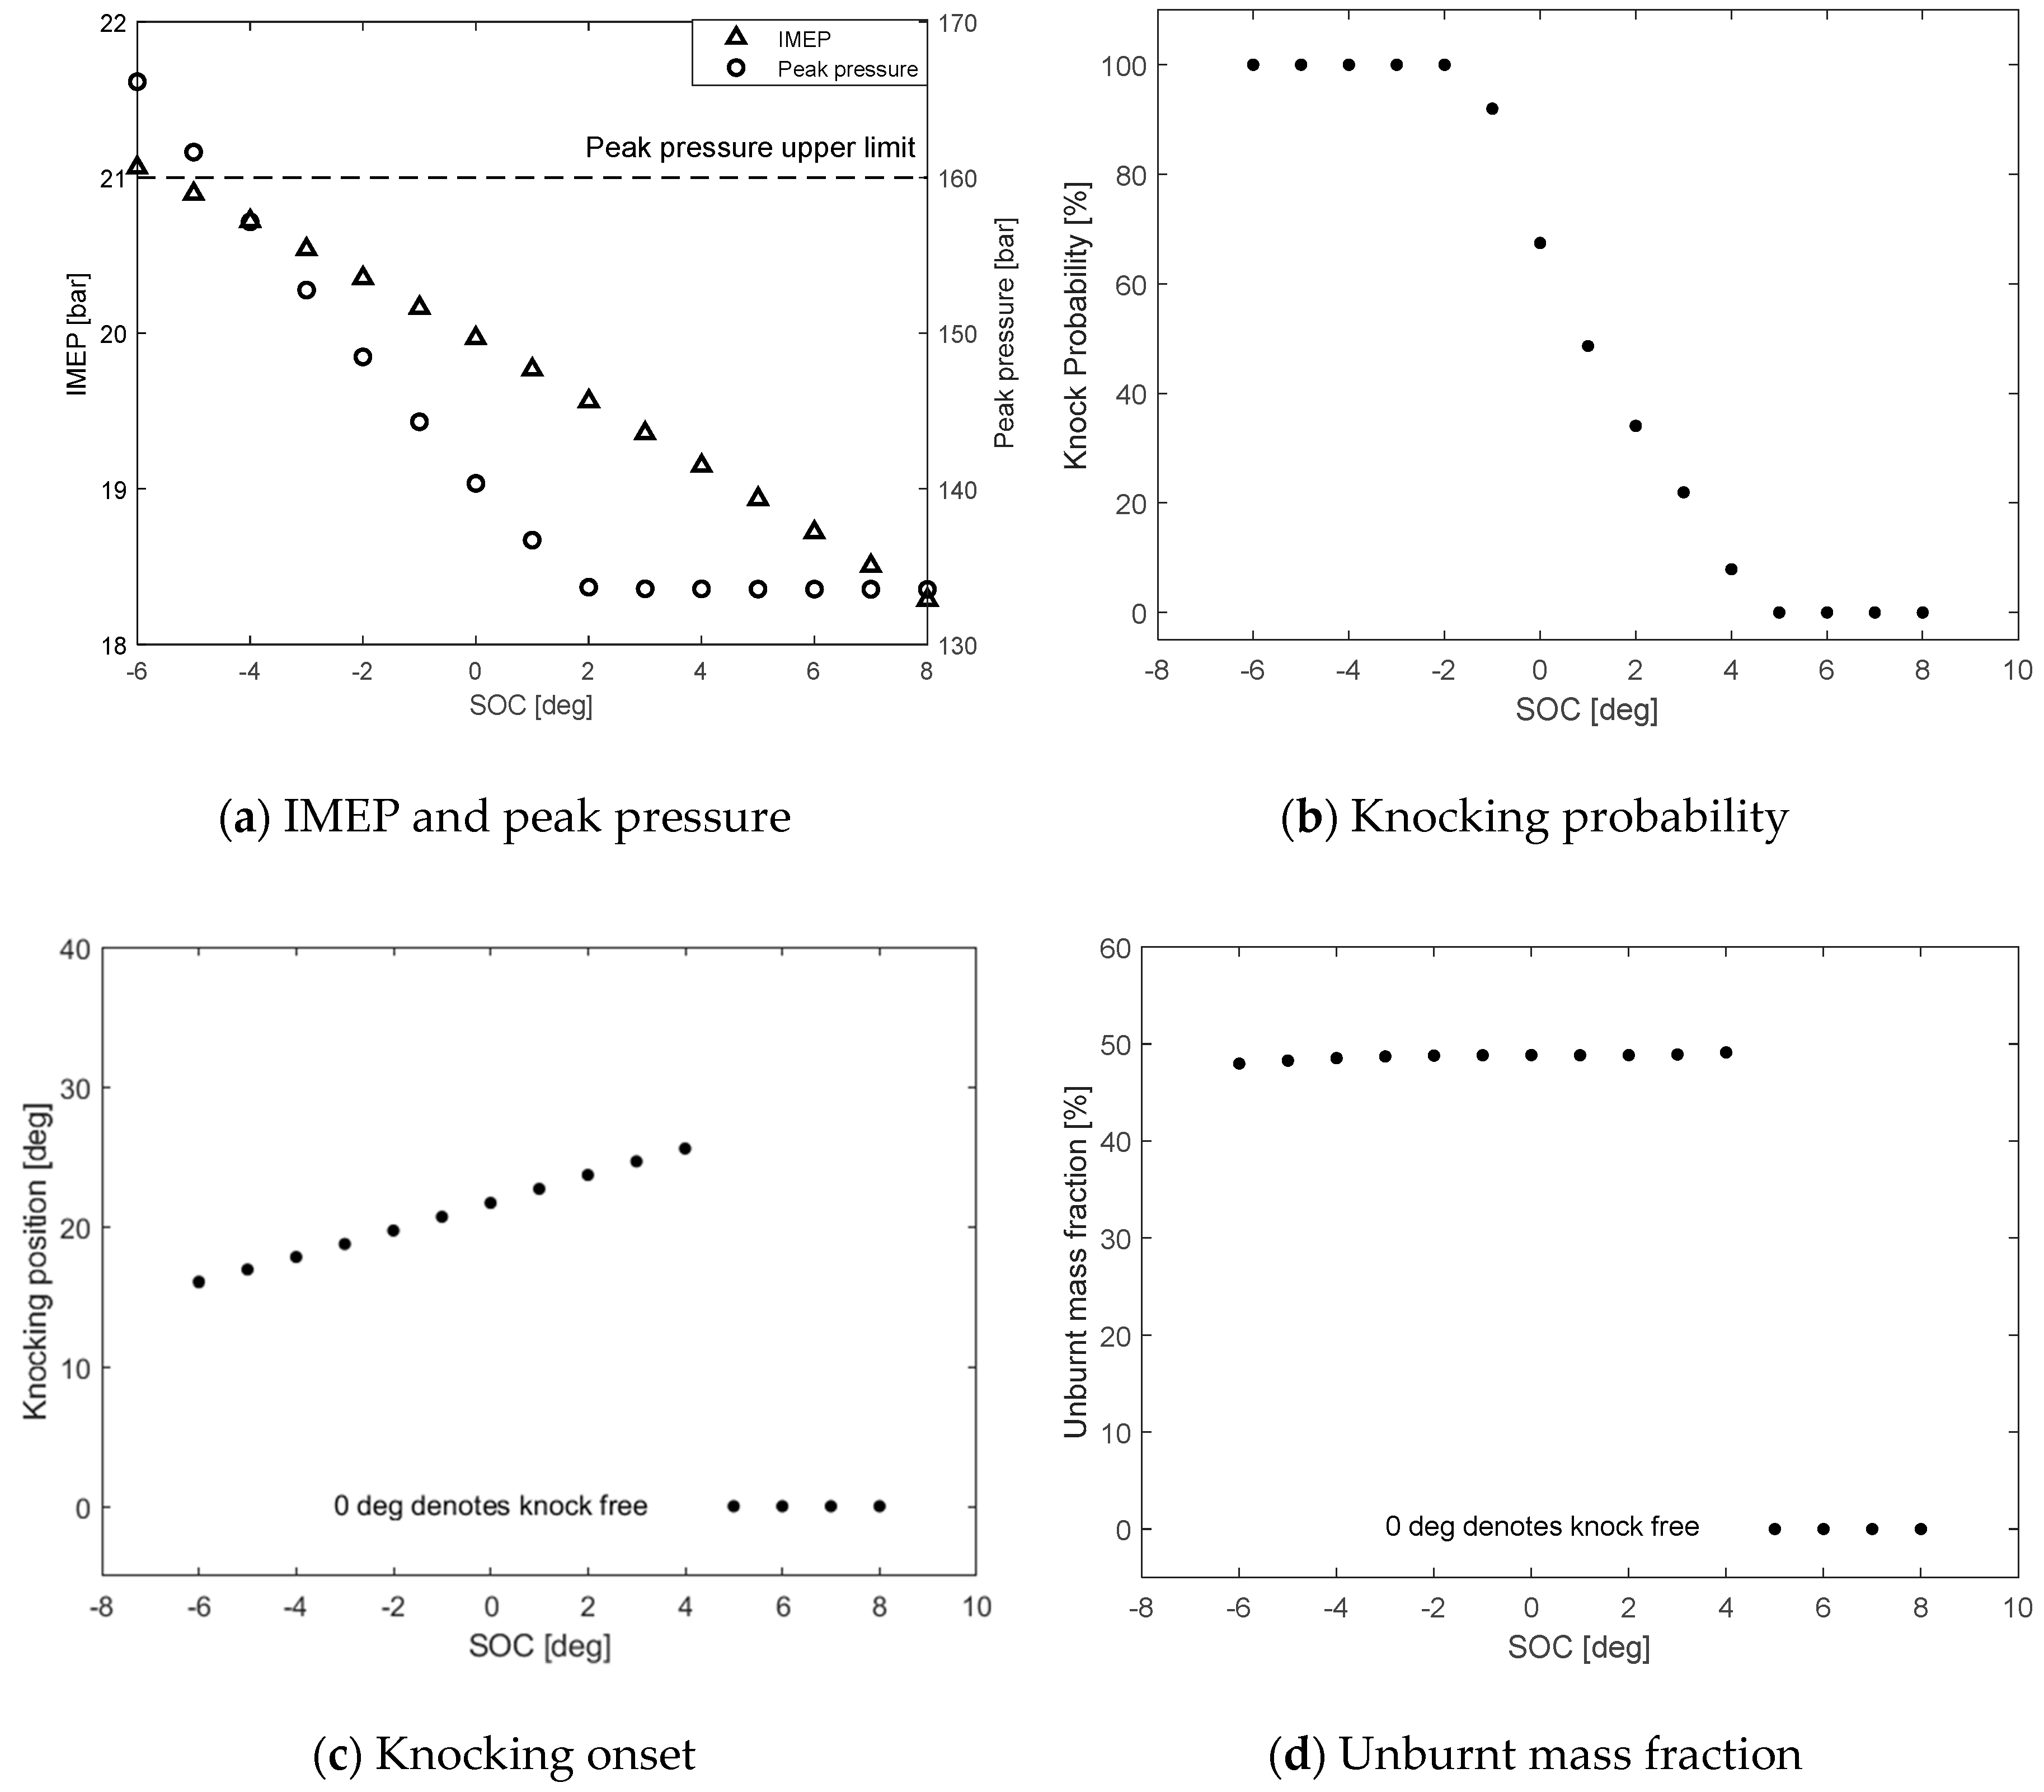
4.2.3. Ignition Timing Effect on Knocking Performance
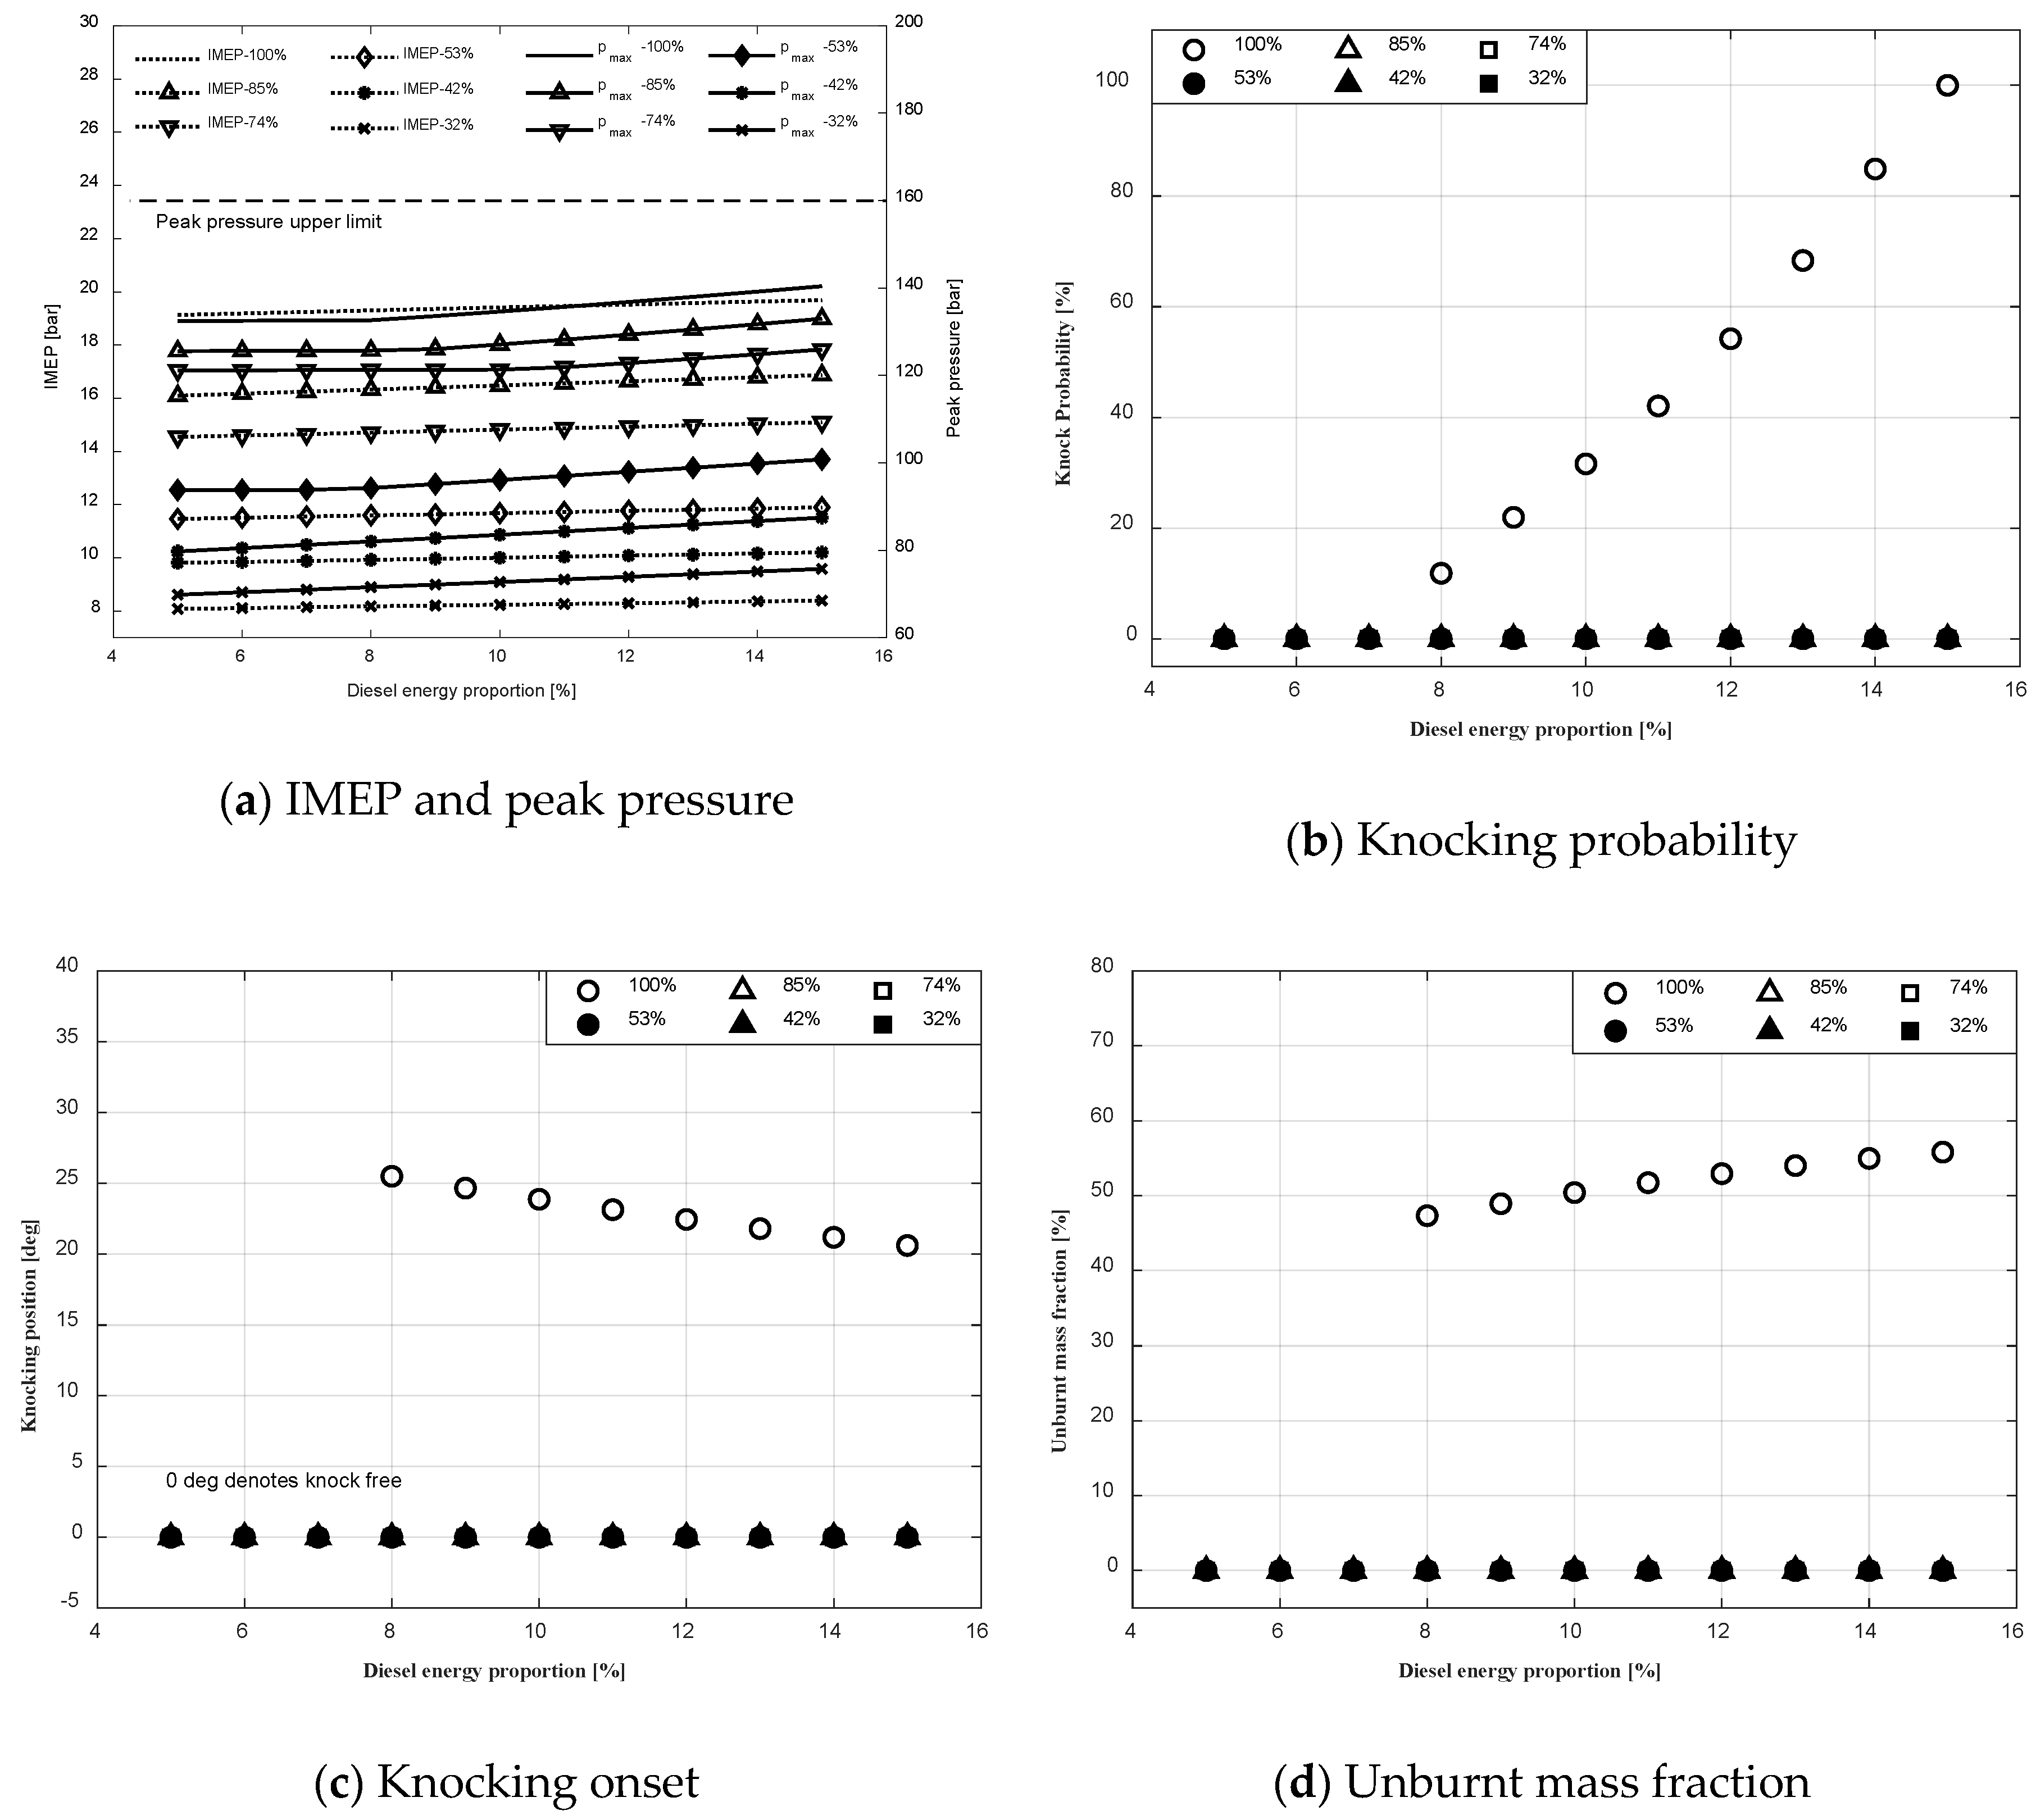
4.2.4. Pilot Fuel Energy Proportion Effect on Knocking Performance
5. Discussion
6. Conclusions
- Increasing the compression ratio results in higher cylinder peak pressure and IMEP for the SI natural Engine and the DF engine, and therefore increases the knocking occurrence tendency. The compression ratio upper limits of Engine A and Engine B are 11 and 16.5, respectively.
- The knocking boundary for the SI natural gas engines does not exhibit an explicit variation trend with the air-fuel equivalence ratio, whilst that of the DF engine indicates a descending trend with the increase in the air-fuel equivalence ratio. The nominal air-fuel equivalence ratio for the Engine B is suggested to be reduced below 2, however experimental verification for this knocking limit is required.
- The ignition timing delay exhibits a diminishing effect on the IMEP and peak pressure of both the investigated engines. The knocking occurrence for the Engine A and the Engine B could be suppressed by retarding the ignition timing after −38°CA and 3°CA, respectively.
- A higher energy proportion (between 5% and 15%) of the pilot fuel increases the knocking tendency and intensity of DF engines at high loads. It is suggested to maintain the pilot fuel energy ratio less than 9% for Engine B.
- Prior to attempting to improve the performance of an engine (SI NG or DF) by increasing the compression ratio or advancing ignition timing, knocking behaviour analysis must be performed by considering the knocking occurrence, onset position and intensity as well as the cylinder peak pressure upper limit.
- The ignition timing of the SI natural gas engines and DF engines must be controlled precisely after the knocking limit in order to suppress knocking occurrence.
- When operating at high load conditions, the pilot fuel mass of DF engine is suggested to remain at a low level to avoid deteriorating the knocking behaviour.
Author Contributions
Funding
Acknowledgments
Conflicts of Interest
References
- Thomson, H.; Corbett, J.J.; Winebrake, J.J. Natural gas as a marine fuel. Energy Policy 2015, 87, 153–167. [Google Scholar] [CrossRef] [Green Version]
- Zhen, X. The engine knock analysis—An overview. Appl. Energy 2012, 92, 628–636. [Google Scholar] [CrossRef]
- Chen, H.; He, J.; Zhong, X. Engine combustion and emission fuelled with natural gas: A review. J. Energy Inst. 2019, 92, 1123–1136. [Google Scholar] [CrossRef]
- Doug, W. Gas-diesel and dual-fuel engines. In Pounder’s Marine Diesel Engines, 8th ed.; Woodyard, D., Ed.; Butterworth-Heinemann: Oxford, UK, 2004; pp. 48–63. [Google Scholar]
- Shamekhi, A.; Khatibzadeh, N.; Shamekhi, A.H. Performance and emissions characteristics investigation of a bi-fuel SI engine fuelled by CNG and gasoline. In Proceedings of the ASME 2006 Internal Combustion Engine Division Spring Technical Conference, Aachen, Germany, 7–10 May 2006; American Society of Mechanical Engineers: New York, NY, USA, 2006. [Google Scholar]
- Yang, L.-P. Analysis of the dynamic characteristics of combustion instabilities in a pre-mixed lean-burn natural gas engine. Appl. Energy 2016, 183, 746–759. [Google Scholar] [CrossRef]
- Cordiner, S. Numerical and Experimental Analysis of Combustion and Exhaust Emissions in a Dual-Fuel Diesel/Natural Gas Engine. Energy Fuels 2008, 22, 1418–1424. [Google Scholar] [CrossRef]
- Korakianitis, T.; Namasivayam, A.M.; Crookes, R.J. Natural-gas fueled spark-ignition (SI) and compression-ignition (CI) engine performance and emissions. Prog. Energy Combust. Sci. 2011, 37, 89–112. [Google Scholar] [CrossRef]
- Huang, J.; Crookes, R.J. Assessment of simulated biogas as a fuel for the spark ignition engine. Fuel 1998, 77, 1793–1801. [Google Scholar] [CrossRef]
- Cho, H.M.; He, B.-Q. Spark ignition natural gas engines—A review. Energy Convers. Manag. 2007, 48, 608–618. [Google Scholar] [CrossRef]
- Evans, R.L.; Blaszczyk, J. A comparative study of the performance and exhaust emissions of a spark ignition engine fuelled by natural gas and gasoline. Proc. Inst. Mech. Eng. Part D J. Automob. Eng. 2005, 211, 39–47. [Google Scholar] [CrossRef]
- Chen, G.T. Research on Supercharging Performance of 190 Series 6-Cylinder Gas Engine. Appl. Mech. Mater. 2014, 543–547, 282–285. [Google Scholar] [CrossRef]
- Kesgin, U. Effect of turbocharging system on the performance of a natural gas engine. Energy Convers. Manag. 2005, 46, 11–32. [Google Scholar] [CrossRef]
- Zeng, K. Combustion characteristics of a direct-injection natural gas engine under various fuel injection timings. Appl. Therm. Eng. 2006, 26, 806–813. [Google Scholar] [CrossRef]
- Bhandari, K. Performance and emissions of natural gas fueled internal combustion engine: A review. J. Sci. Ind. Res. 2005, 64, 333–338. [Google Scholar]
- Kahraman, N. Investigation of combustion characteristics and emissions in a spark-ignition engine fuelled with natural gas–hydrogen blends. Int. J. Hydrog. Energy 2009, 34, 1026–1034. [Google Scholar] [CrossRef]
- Crookes, R.; Korakianitis, T.; Namasivayam, A. A systematic experimental assessment of the use of rapeseed methyl ester (RME) as a compression ignition engine fuel during conventional and dual-fuel operation. In Proceedings of the TAE 7th International Colloquium on Fuels, Stuttgart, Germany, 14–15 January 2009. [Google Scholar]
- Papagiannakis, R. Theoretical study of the effects of engine parameters on performance and emissions of a pilot ignited natural gas diesel engine. Energy 2010, 35, 1129–1138. [Google Scholar] [CrossRef]
- Li, W.; Liu, Z.; Wang, Z. Experimental and theoretical analysis of the combustion process at low loads of a diesel natural gas dual-fuel engine. Energy 2016, 94, 728–741. [Google Scholar] [CrossRef]
- Zhang, D. 8—Direct injection natural gas engines. In Advanced Direct Injection Combustion Engine Technologies and Development; Zhao, H., Ed.; Woodhead Publishing: Southampton, UK, 2010; pp. 199–228. [Google Scholar]
- Gharehghani, A. A computational study of operating range extension in a natural gas SI engine with the use of hydrogen. Int. J. Hydrog. Energy 2015, 40, 5966–5975. [Google Scholar] [CrossRef]
- Das, A.; Watson, H. Development of a natural gas spark ignition engine for optimum performance. Proc. Inst. Mech. Eng. Part D J. Automob. Eng. 1997, 211, 361–378. [Google Scholar] [CrossRef]
- Chen, S.K.; Beck, N.J. Gas Engine Combustion Principles and Applications; SAE Technical Paper; SAE: Warrendale, PA, USA, 2001. [Google Scholar]
- Heywood, J.B. Internal Combustion Engine Fundamental; Mcgraw-Hill: New York, NY, USA, 1988; Volume 9, p. 457. [Google Scholar]
- Yao, C.; Yao, A.; Xu, H. Mechanism of Internal Combustion Engine Detonation and Its Damage to Combustion Chamber Components; Science Press: Beijing, China, 2015. [Google Scholar]
- Wang, Z.; Liu, H.; Reitz, R.D. Knocking combustion in spark-ignition engines. Prog. Energy Combust. Sci. 2017, 61, 78–112. [Google Scholar] [CrossRef]
- Takahata, S. A Study of Autoignition Behavior and Knock Intensity in a SI Engine under Different Engine Speed by Using In-Cylinder Visualization. 2017; SAE Technical Paper; Available online: https://www.sae.org/publications/technical-papers/content/2017-32-0050/ (accessed on 21 June 2020).
- Schießl, R.; Maas, U. Analysis of end gas temperature fluctuations in an SI engine by laser-induced fluorescence. Combust. Flame 2003, 133, 19–27. [Google Scholar] [CrossRef]
- Corti, E.; Forte, C. Statistical Analysis of Indicating Parameters for Knock Detection Purposes; SAE Technical Paper; SAE: Warrendale, PA, USA, 2009. [Google Scholar]
- Worret, R. Application of Different Cylinder Pressure Based Knock Detection Methods in Spark Ignition Engines; SAE Technical Paper; SAE: Warrendale, PA, USA, 2002. [Google Scholar]
- Feng, H. Analysis of auto-ignition characteristics of low-alcohol/iso-octane blends using combined chemical kinetics mechanisms. Fuel 2018, 234, 836–849. [Google Scholar] [CrossRef]
- Zhen, X.; Wang, Y. Numerical analysis of knock during HCCI in a high compression ratio methanol engine based on LES with detailed chemical kinetics. Energy Convers. Manag. 2015, 96, 188–196. [Google Scholar] [CrossRef]
- Sazhin, S. The Shell autoignition model: A new mathematical formulation. Combust. Flame 1999, 117, 529–540. [Google Scholar] [CrossRef]
- Wang, Z.; Li, F.; Wang, Y. A generalized kinetic model with variable octane number for engine knock prediction. Fuel 2017, 188, 489–499. [Google Scholar] [CrossRef]
- Pan, J.; Shu, G.; Wei, H. Research on in-cylinder pressure oscillation characteristic during knocking combustion in spark-ignition engine. Fuel 2014, 120, 150–157. [Google Scholar] [CrossRef]
- Livengood, J.; Wu, P.C. Correlation of Autoignition Phenomena in Internal Combustion Engines and Rapid Compression Machines; The 5th Symposium (International) on Combustion: Baltimore, MD, USA, 1955. [Google Scholar]
- Douaud, A.; Eyzat, P. Four-octane-number method for predicting the anti-knock behavior of fuels and engines. SAE Trans. 1978, 87, 294–308. [Google Scholar]
- Franzke, D. Beitrag zur Ermittlung eines Klopfkriteriums der Ottomotorischen Verbrennung und zur Vorausberechnung der Klopfgrenze. Ph.D. Thesis, Technische Universität München, München, Germany, 1981. [Google Scholar]
- Hann, S. Prediction of burn rate, knocking and cycle-to-cycle variations of binary compressed natural gas substitutes in consideration of reaction kinetics influences. Int. J. Engine Res. 2018, 19, 21–32. [Google Scholar] [CrossRef]
- Hoepke, B. EGR effects on boosted SI engine operation and knock integral correlation. SAE Int. J. Engines 2012, 5, 547–559. [Google Scholar] [CrossRef]
- Chen, L. A predictive model for knock onset in spark-ignition engines with cooled EGR. Energy Convers. Manag. 2014, 87, 946–955. [Google Scholar] [CrossRef]
- Bares, P. Knock probability estimation through an in-cylinder temperature model with exogenous noise. Mech. Syst. Signal Process. 2018, 98, 756–769. [Google Scholar] [CrossRef]
- Song, H.; Song, H.H. Correlated ignition delay expression of two-stage ignition fuels for Livengood-Wu model-based knock prediction. Fuel 2020, 260, 116404. [Google Scholar] [CrossRef]
- Demir, U. Evaluation of zero dimensional codes in simulating IC engines using primary reference fuel. Appl. Therm. Eng. 2015, 76, 18–24. [Google Scholar] [CrossRef]
- Rothe, M. Knock Behavior of SI-Engines: Thermodynamic Analysis of Knock Onset Locations and Knock Intensities; SAE Technical Paper; SAE: Warrendale, PA, USA, 2006. [Google Scholar]
- Kawahara, N.; Tomita, E. Visualization of auto-ignition and pressure wave during knocking in a hydrogen spark-ignition engine. Int. J. Hydrog. Energy 2009, 34, 3156–3163. [Google Scholar] [CrossRef]
- Xiang, L.; Song, E.; Ding, Y. A Two-Zone Combustion Model for Knocking Prediction of Marine Natural Gas SI Engines. Energies 2018, 11, 561. [Google Scholar] [CrossRef] [Green Version]
- Liu, J.; Dumitrescu, C.E. Lean-Burn Characteristics of a Heavy-Duty Diesel Engine Retrofitted to Natural-Gas Spark Ignition. J. Eng. Gas Turbines Power-Trans. ASME 2019, 141. [Google Scholar] [CrossRef]
- Javaheri, A. Investigation of Natural Gas Composition Effects on Knock Phenomenon in SI Gas Engines Using Detailed Chemistry. Appl. Mech. Mater. 2014, 493, 239–244. [Google Scholar] [CrossRef]
- Kaprielian, L. Multi-Zone Quasi-Dimensional Combustion Models for Spark-Ignition Engines; SAE Technical Paper; SAE: Warrendale, PA, USA, 2013. [Google Scholar]
- Xu, S. A phenomenological combustion analysis of a dual-fuel natural-gas diesel engine. Proc. Inst. Mech. Eng. Part D J. Automob. Eng. 2017, 231, 66–83. [Google Scholar] [CrossRef]
- Priesching, P. About Describing the Knocking Combustion in Gasoline and Gas Engines by CFD Methods; SAE Technical Paper; SAE: Warrendale, PA, USA, 2015. [Google Scholar]
- Maghbouli, A. A multi-dimensional CFD-chemical kinetics approach in detection and reduction of knocking combustion in diesel-natural gas dual-fuel engines using local heat release analysis. SAE Int. J. Engines 2013, 6, 777–787. [Google Scholar] [CrossRef]
- Abagnale, C. Combined numerical-experimental study of dual fuel diesel engine. Energy Procedia 2014, 45, 721–730. [Google Scholar] [CrossRef] [Green Version]
- Maurya, R.K.; Mishra, P. Parametric investigation on combustion and emissions characteristics of a dual fuel (natural gas port injection and diesel pilot injection) engine using 0-D SRM and 3D CFD approach. Fuel 2017, 210, 900–913. [Google Scholar] [CrossRef]
- Montoya, J.P.G.; Diaz, G.J.A.; Arrieta, A.A.A. Effect of equivalence ratio on knocking tendency in spark ignition engines fueled with fuel blends of biogas, natural gas, propane and hydrogen. Int. J. Hydrog. Energy 2018, 43, 23041–23049. [Google Scholar] [CrossRef]
- Noda, T. Development of Transient Knock Prediction Technique by Using a Zero-Dimensional Knocking Simulation with Chemical Kinetics; SAE Technical Paper; SAE: Warrendale, PA, USA, 2004. [Google Scholar]
- Gamma Technologies. GT-SUITE Manual. Eng. Perform. 2014, 2, 17–19. [Google Scholar]
- Stoumpos, S. Marine dual fuel engine modelling and parametric investigation of engine settings effect on performance-emissions trade-offs. Ocean Eng. 2018, 157, 376–386. [Google Scholar] [CrossRef] [Green Version]
- Merker, G.P. Simulating Combustion: Simulation of Combustion and Pollutant Formation for Engine-Development; Springer Science & Business Media: Berlin/Heidelberg, Germany, 2005; Volume 7. [Google Scholar]
- Ghojel, J. Review of the development and applications of the Wiebe function: A tribute to the contribution of Ivan Wiebe to engine research. Int. J. Engine Res. 2010, 11, 297–312. [Google Scholar] [CrossRef]
- Vibe, I. Semi-empirical expression for combustion rate in engines. In Proceedings of the Conference on Piston Engines; USSR Academy of Sciences: Moscow, Russia, 1956. [Google Scholar]
- Witt, A. Analyse der Thermodynamischen Verluste Eines Ottomotors Unter den Randbedingungen Variabler Steuerzeiten. Ph.D. Thesis, Technische Universität Graz, Graz, Austria, 1999. [Google Scholar]
- Aklouche, F. Predictive model of the diesel engine operating in dual-fuel mode fuelled with different gaseous fuels. Fuel 2018, 220, 599–606. [Google Scholar] [CrossRef]
- Nilsson, Y.; Frisk, E.; Nielsen, L. Weak knock characterization and detection for knock control. Proc. Inst. Mech. Eng. Part D J. Automob. Eng. 2009, 223, 107–129. [Google Scholar] [CrossRef]
- Yin, T. Optimization of Compression Ratio of a Boosted PFI SI Engine with Cooled EGR; SAE Technical Paper; SAE: Warrendale, PA, USA, 2014. [Google Scholar]
- AVL. Pressure Sensor for Combustion Analysis—GU22CK; AVL: Graz, Austria, 2016. [Google Scholar]
- KISTLER. Measurement and Evaluation System for Combustion Analysis on Test Benches and in Vegicles—KiBox to Go 2893B; KISTLER: Winterthur, Switzerland, 2019. [Google Scholar]
- AVL. AVL Fuel Mass Flow Meter and Fuel Temperature Control. 2019. Available online: https://www.avl.com/-/avl-fuel-mass-flow-meter-and-fuel-temperature-control (accessed on 11 May 2020).
- Endress+Hauser. Proline Promass 83F Coriolis Flowmeter. 2019. Available online: https://www.uk.endress.com/en/field-instruments-overview/flow-measurement-product-overview/Product-Coriolis-flowmeter-Proline-Promass-83F (accessed on 11 May 2020).
- ABB. Thermal Mass Flowmeter: Sensyflow FMT700-P and FMT700-P Compact. 2019. Available online: https://new.abb.com/products/measurement-products/flow/thermal-mass-flowmeters/sensyflow-fmt700-p (accessed on 11 May 2020).
- AVL. Pressure Sensor for Combustion Analysis—LP11DA; AVL: Graz, Austria, 2016. [Google Scholar]
- AVL. AMA i60 Exhaust Measurement System. 2013. Available online: https://www.avl.com/-/avl-fuel-mass-flow-meter-and-fuel-temperature-control (accessed on 11 May 2020).
- Bonalivi. GS5969 E Natural Gas Chromatographic Analyzer. Available online: https://www.bonalivi.com/products/gs5969-e (accessed on 11 May 2020).
- PetroChina. 2020. Available online: http://www.petrochina.com.cn/ptr/ (accessed on 11 May 2020).
- Ding, Y. A new method to smooth the in-cylinder pressure signal for combustion analysis in diesel engines. Proc. Inst. MechanicalEng.-A 2011, 225, 309. [Google Scholar] [CrossRef]
- Xiang, L.; Theotokatos, G.; Ding, Y. Investigation on gaseous fuels interchangeability with an extended zero-dimensional engine model. Energy Convers. Manag. 2019, 183, 500–514. [Google Scholar] [CrossRef] [Green Version]
- Li, H.; Karim, G.A. Knock in spark ignition hydrogen engines. Int. J. Hydrog. Energy 2004, 29, 859–865. [Google Scholar] [CrossRef]
- Brussovansky, S.; Heywood, J.B.; Keck, J.C. Predicting the Effects of Air and Coolant Temperature, Deposits, Spark Timing and Speed on Knock in Spark Ignition Engines; SAE Technical Paper; SAE: Warrendale, PA, USA, 1992. [Google Scholar]
- Alla, G.A. Effect of pilot fuel quantity on the performance of a dual fuel engine. Energy Convers. Manag. 2000, 41, 559–572. [Google Scholar] [CrossRef]


| Parameters | Unit | 2135 | YC6K |
|---|---|---|---|
| Cylinder number | - | 2 | 6 |
| Bore | mm | 135 | 129 |
| Stroke | mm | 140 | 155 |
| Compression ratio | - | 11 | 16.5 |
| Displacement per cylinder | L | 2 | 2.03 |
| Nominal engine speed | rpm | 1200 | 1800 |
| Nominal power per cylinder | kW | 9.5 | 50.5 |
| Air-fuel equivalence ratio | - | 1.2 | 2.1 |
| Ignition timing | °CA | −36 | - |
| Pilot injection timing | °CA | - | −5 |
| Equipment | Type | Measured Error/Uncertainty/Linearity |
|---|---|---|
| In-cylinder pressure sensor | AVL GU22CK [67] | ≤ ±0.3% |
| Combustion analyser | KiBox To Go 2893 [68] | Approx. 5 ms (<< 1 combustion cycle) |
| Diesel consumption meter | AVL 735C [69] | ≤ 0.12% |
| Gas consumption meter | E+H 83F25-XRW2/0 [70] | ≤ ±0.05 |
| Air-mass flow meter | ABB FMT 700 [71] | ≤ 0.8% |
| Inlet/Exhaust pressure sensor | AVL LP11DA [72] | ≤ ±0.1% |
| Emission analyser | AVL AMA i60 R1 [73] | ≤ ±2% |
| Compositions | Volumetric fraction (%) |
|---|---|
| CH4 | 86.37 |
| C2H6 | 3.67 |
| C3H8 | 0.02 |
| n-C4H10 | 0.01 |
| CO2 | 4.70 |
| N2 | 2.55 |
| CO | 2.68 |
| Load | SOC (°CA, BTDC) | Combustion Duration (°CA) | Wiebe Exponent (-) |
|---|---|---|---|
| 25% | 36 | 58 | 4 |
| 50% | 34 | 60 | 4 |
| Load | Parameters | pmax (bar) | α1 (°CA) | pcom (bar) | pEO (bar) | IMEP (bar) |
|---|---|---|---|---|---|---|
| 25% | Simulation | 19.71 | 11.70 | 2.90 | 1.31 | 1.74 |
| Measurement | 19.68 | 11.80 | 2.89 | 1.33 | 1.79 | |
| Error (% or °CA) | 0.15 | 0.80 | 0.34 | 1.50 | 2.79 | |
| 50% | Simulation | 30.47 | 8.87 | 7.43 | 1.85 | 3.64 |
| Measurement | 31.07 | 9.00 | 7.34 | 1.90 | 3.72 | |
| Error (% or °CA) | 1.93 | 0.13 | 1.22 | 2.60 | 2.15 |
| Load | Unit | 100 | 85 | 74 | 50 | 42 | 32 | |
|---|---|---|---|---|---|---|---|---|
| b1 | - | 0.1 | 0.1 | 0.1 | 0.1 | 0.1 | 0.1 | |
| Diesel fuel | SOC | °CA, ATDC | 2.9 | 3.1 | 3.6 | 3.9 | 3.9 | 4.0 |
| Combustion Duration | °CA | 14 | 9.5 | 7.5 | 7.5 | 7.5 | 7.5 | |
| Wiebe Exponent | - | 0.2 | 0.5 | 0.5 | 0.5 | 0.5 | 0.5 | |
| Natural gas | SOC | °CA, ATDC | 2.9 | 3.1 | 3.6 | 3.9 | 3.9 | 4.0 |
| Combustion Duration | °CA | 97 | 87.5 | 87 | 87 | 84.5 | 84.5 | |
| Wiebe Exponent | - | 0.5 | 0.5 | 0.5 | 0.5 | 0.5 | 0.4 |
| Load | Parameters | pmax (bar) | α1 (°CA) | pcom (bar) | pEO (bar) | IMEP (bar) |
|---|---|---|---|---|---|---|
| 50% | Simulation | 99.37 | 8.02 | 94.87 | 7.25 | 12.84 |
| Experiment | 100.08 | 7.80 | 95.06 | 7.48 | 12.39 | |
| Error (% or °CA) | 0.7 | 0.22 | 0.2 | 3.07 | 3.63 | |
| 85% | Simulation | 128.43 | 5.64 | 128.09 | 10.46 | 17.89 |
| Experiment | 128.00 | 6.23 | 127.42 | 10.56 | 18.00 | |
| Error (% or °CA) | 0.33 | 0.59 | 0.52 | 0.95 | 0.61 |
| Parameter | Unit | Range |
|---|---|---|
| Compression ratio | - | 7~16 |
| Air–fuel equivalence ratio | - | 0.8~1.5 |
| Ignition timing | °CA | −44~−26 |
| Parameter | Unit | Range |
|---|---|---|
| Compression ratio | - | 12~21 |
| Air-fuel equivalence ratio | - | 0.8~2.8 |
| SOC | °CA | −6~8 |
| Pilot fuel energy proportion | % | 5~15 |
© 2020 by the authors. Licensee MDPI, Basel, Switzerland. This article is an open access article distributed under the terms and conditions of the Creative Commons Attribution (CC BY) license (http://creativecommons.org/licenses/by/4.0/).
Share and Cite
Xiang, L.; Theotokatos, G.; Cui, H.; Xu, K.; Ben, H.; Ding, Y. Parametric Knocking Performance Investigation of Spark Ignition Natural Gas Engines and Dual Fuel Engines. J. Mar. Sci. Eng. 2020, 8, 459. https://0-doi-org.brum.beds.ac.uk/10.3390/jmse8060459
Xiang L, Theotokatos G, Cui H, Xu K, Ben H, Ding Y. Parametric Knocking Performance Investigation of Spark Ignition Natural Gas Engines and Dual Fuel Engines. Journal of Marine Science and Engineering. 2020; 8(6):459. https://0-doi-org.brum.beds.ac.uk/10.3390/jmse8060459
Chicago/Turabian StyleXiang, La, Gerasimos Theotokatos, Haining Cui, Keda Xu, Hongkai Ben, and Yu Ding. 2020. "Parametric Knocking Performance Investigation of Spark Ignition Natural Gas Engines and Dual Fuel Engines" Journal of Marine Science and Engineering 8, no. 6: 459. https://0-doi-org.brum.beds.ac.uk/10.3390/jmse8060459