Article

Intrusion Distance and Flow Discharge in Rivers during the 2011 Tohoku Tsunami

1
Department of Civil Engineering, Tohoku University, Sendai 980-8579, Japan
2
Plant Solution Department, TEPCO Fuel & Power, Inc., Tokyo 100-8560, Japan
3
National Institute of Meteorological Sciences, Jeju 63568, Korea
4
Department of Civil and Environmental Engineering, Hachinohe Institute of Technology, Hachinohe 031-8501, Japan
5
Division of Environment System Management, Fukushima University, Fukushima 960-1296, Japan
6
Formerly Department of Civil and Environmental Engineering, Maebashi Institute of Technology, Maebashi 371-0816, Japan
*
Author to whom correspondence should be addressed.
J. Mar. Sci. Eng. 2020, 8(11), 882; https://0-doi-org.brum.beds.ac.uk/10.3390/jmse8110882
Submission received: 14 October 2020 / Revised: 29 October 2020 / Accepted: 4 November 2020 / Published: 5 November 2020
(This article belongs to the Section Coastal Engineering)

Abstract

:
On 11 March 2011, the Great East Japan Earthquake generated huge tsunami waves. Then, tsunami propagation occurred in rivers, resulting in further expansion of the flooded area. Full data sets of tsunami characteristics such as tsunami inland and river propagation distances as well as the river geometries from all rivers within the Tohoku District were compiled and analyzed. It was found that tsunami propagation distance in rivers was about 1.2 to 4.5 times that of the inland area. There was a good correlation between propagation distance in rivers and the river bed slope. Furthermore, new empirical formulae for calculating the damping coefficient of tsunami wave height and tsunami intrusion length were successfully derived based on the current comprehensive data sets covering a wide range of river geometry and bottom slope. Moreover, tsunami-induced flow discharge was evaluated by using measured water level variation.

1. Introduction

At 14:46 on 11 March 2011, the Great East Japan Earthquake occurred off Sanriku Coast near the oceanic trench located on the boundary between the Pacific Plate and North American Plate. This earthquake with a maximum scale of Mw.9.0 (Japan Meteorological Agency) caused a massive tsunami and serious damages along the Pacific Ocean Coast from Hokkaido to Kanto District, especially in Tohoku District, which is located in the Northeast of Japan and consists of Iwate Prefecture, Miyagi, and Fukushima Prefectures. Tsunami waves with a height of over 10m attacked the coastal area, resulting in serious damage in these regions. One of the important factors causing such devastating damage was tsunami run-up into rivers and subsequent overflow into the adjacent land area [1,2,3,4,5].
There have been various researchers studying tsunami propagation in the land area such as [6,7]. However, studies dealing with a synthetic investigation on tsunami intrusion distance in a river are limited. Abe [8] analyzed measured data of water level in five large rivers during the Central Sea of Japan Earthquake in 1983 and concluded that tsunami waves can reach several kilometers upstream of rivers and the tsunami peaks have resulted from resonance within the river. Tanaka et al. [9], based on a field investigation along Sri Lankan rivers affected by the 2004 Indian Ocean Tsunami, indicated that the tsunami intrusion into a small river upstream caused flooding and local damage, extending the impact of the tsunami to the upstream cities. Similar conclusions were also obtained by analyzing the 2010 Chilean Tsunami that impacted Japanese rivers [10]. Based on the analysis of video images captured during the 2011 tsunami, Adityawan et al. [11] reported that the tsunami in a river propagates a longer distance upstream than that propagating in a land area. Tolkova and Tanaka [12] analyzed 2011 Tohoku tsunami record in the Kitakami River and showed that the bore kept its shape and identity as it traveled a 10.9 km path along the river. Due to the fact that the tsunami ascended the upstream area, the river embankment and various river management facilities were seriously damaged. More recent tsunami propagation into Japanese rivers during the September 2015 Chilean tsunami has been analyzed by Tolkova [13].
In terms of numerical studies, Viana-Baptista et al. [14] and Yeh et al. [15] made a numerical simulation of tsunami propagation into the Tagus estuary, Lisbon, and a hypothetical case in the Columbia River, respectively. They showed that tsunami propagation in a river causes severe flooding in the upstream area far from the river mouth. Reference [16,17,18,19,20,21,22,23] also used numerical methods to predict tsunami propagation along a river. They concluded that there are various factors contribute to tsunami wave intrusion in rivers, and that for the relatively small tsunami event the intrusion length correlates well with the river mouth characteristics.
Generally, estimation of a tsunami inundation zone has been carried out by a depth averaged 2-D numerical simulation in which ocean and land areas are unified in the computational domain, e.g., [5]. However, because the intrusion characteristics of the tsunami into a river greatly reflect the characteristic of river geometry, it may be difficult to fully understand the behavior of tsunami by a unified numerical computation. In addition, model verification is difficult to achieve due to the lack of actual measurement data. Therefore, it is necessary to advance our understanding of the mechanisms of river tsunami intrusion for future tsunami disaster prevention.
In this study, the field measurement data of river tsunami intrusion was collected for numerous rivers from three prefectures in Tohoku District, including Iwate, Miyagi, and Fukushima Prefectures, in order to carry out a synthetic investigation of tsunami intrusion into rivers. As a result, the intrusion distance and tsunami-induced flow discharge were determined. The outcome of this study is valuable for the coastal and river authorities in order to reduce the tsunami wave impact on local residents, and on infrastructural damages, in the future.

2. Study Area and Data Compilation

Figure 1 shows the location of rivers investigated in the present study. There are in total 39 rivers covering wide a range of river geometries in Iwate, Miyagi, and Fukushima Prefectures in the Tohoku District of Japan. In the Japanese river classification system, the rivers are divided into Class-A and Class-B based on their magnitude and social importance. Class-A rivers are relatively larger in terms of catchment and river morphology than Class-B rivers. Class-A rivers are governed by the national government, while Class-B are governed by the prefectural government. The river morphology data were obtained from the corresponding river authorities of each river. In total, data from 21 rivers in Iwate Prefecture, 9 rivers in Miyagi Prefecture, and 9 rivers in Fukushima Prefecture were collected and analyzed. It is noted that this study did not take into account the data from rivers that have been affected by an upstream weir, such as the New Kitakami River and the Abukuma River. The location of the rivers in each prefecture is plotted over the elevation map of Japan at the bottom of Figure 1. It is understood that that the topography of Iwate and Fukushima Prefectures has a steeper slope and relatively short distance than Miyagi Prefecture. On the other hand, rivers that flow through Miyagi Prefecture have larger catchment area and gentler slope.
The tsunami intrusion length was determined based on the field survey immediately after the tsunami occurrence. Locations, such as a tsunami trace and transported debris, were obtained in each river. The most upstream place where the trace was left behind was defined as the intrusion end of the tsunami in the river. Additionally, the distance from a river mouth to an intrusion end was determined as a tsunami intrusion distance.
Moreover, if the most upstream water level station data were available and water level changes by tsunami intrusion could be detected then this location was used to determine the tsunami intrusion length.
The riverbed slope in the section from a river mouth to an intrusion end was used for analysis. The riverbed elevation of the Naruse River is illustrated in Figure 2 as an example. As shown in the figure, the riverbed slope from a river mouth to an intrusion end was estimated approximately as a linear function by using a least-squares method to obtain the bed slope.

3. Tsunami Intrusion Distance

3.1. Relationship between River Tsunami Intrusion Distance and Coastal Tsunami Height

The obtained tsunami intrusion distance, xp, from all analyzed rivers is plotted together with the measured coastal tsunami height (H) data by the Joint Survey Group [24,25] (Figure 3), and the relationship between river tsunami intrusion distance and coastal tsunami height is illustrated in Figure 4. Although it was expected that the intrusion distance of the tsunami is proportional to the coastal tsunami height, they do not have a strong correlation.

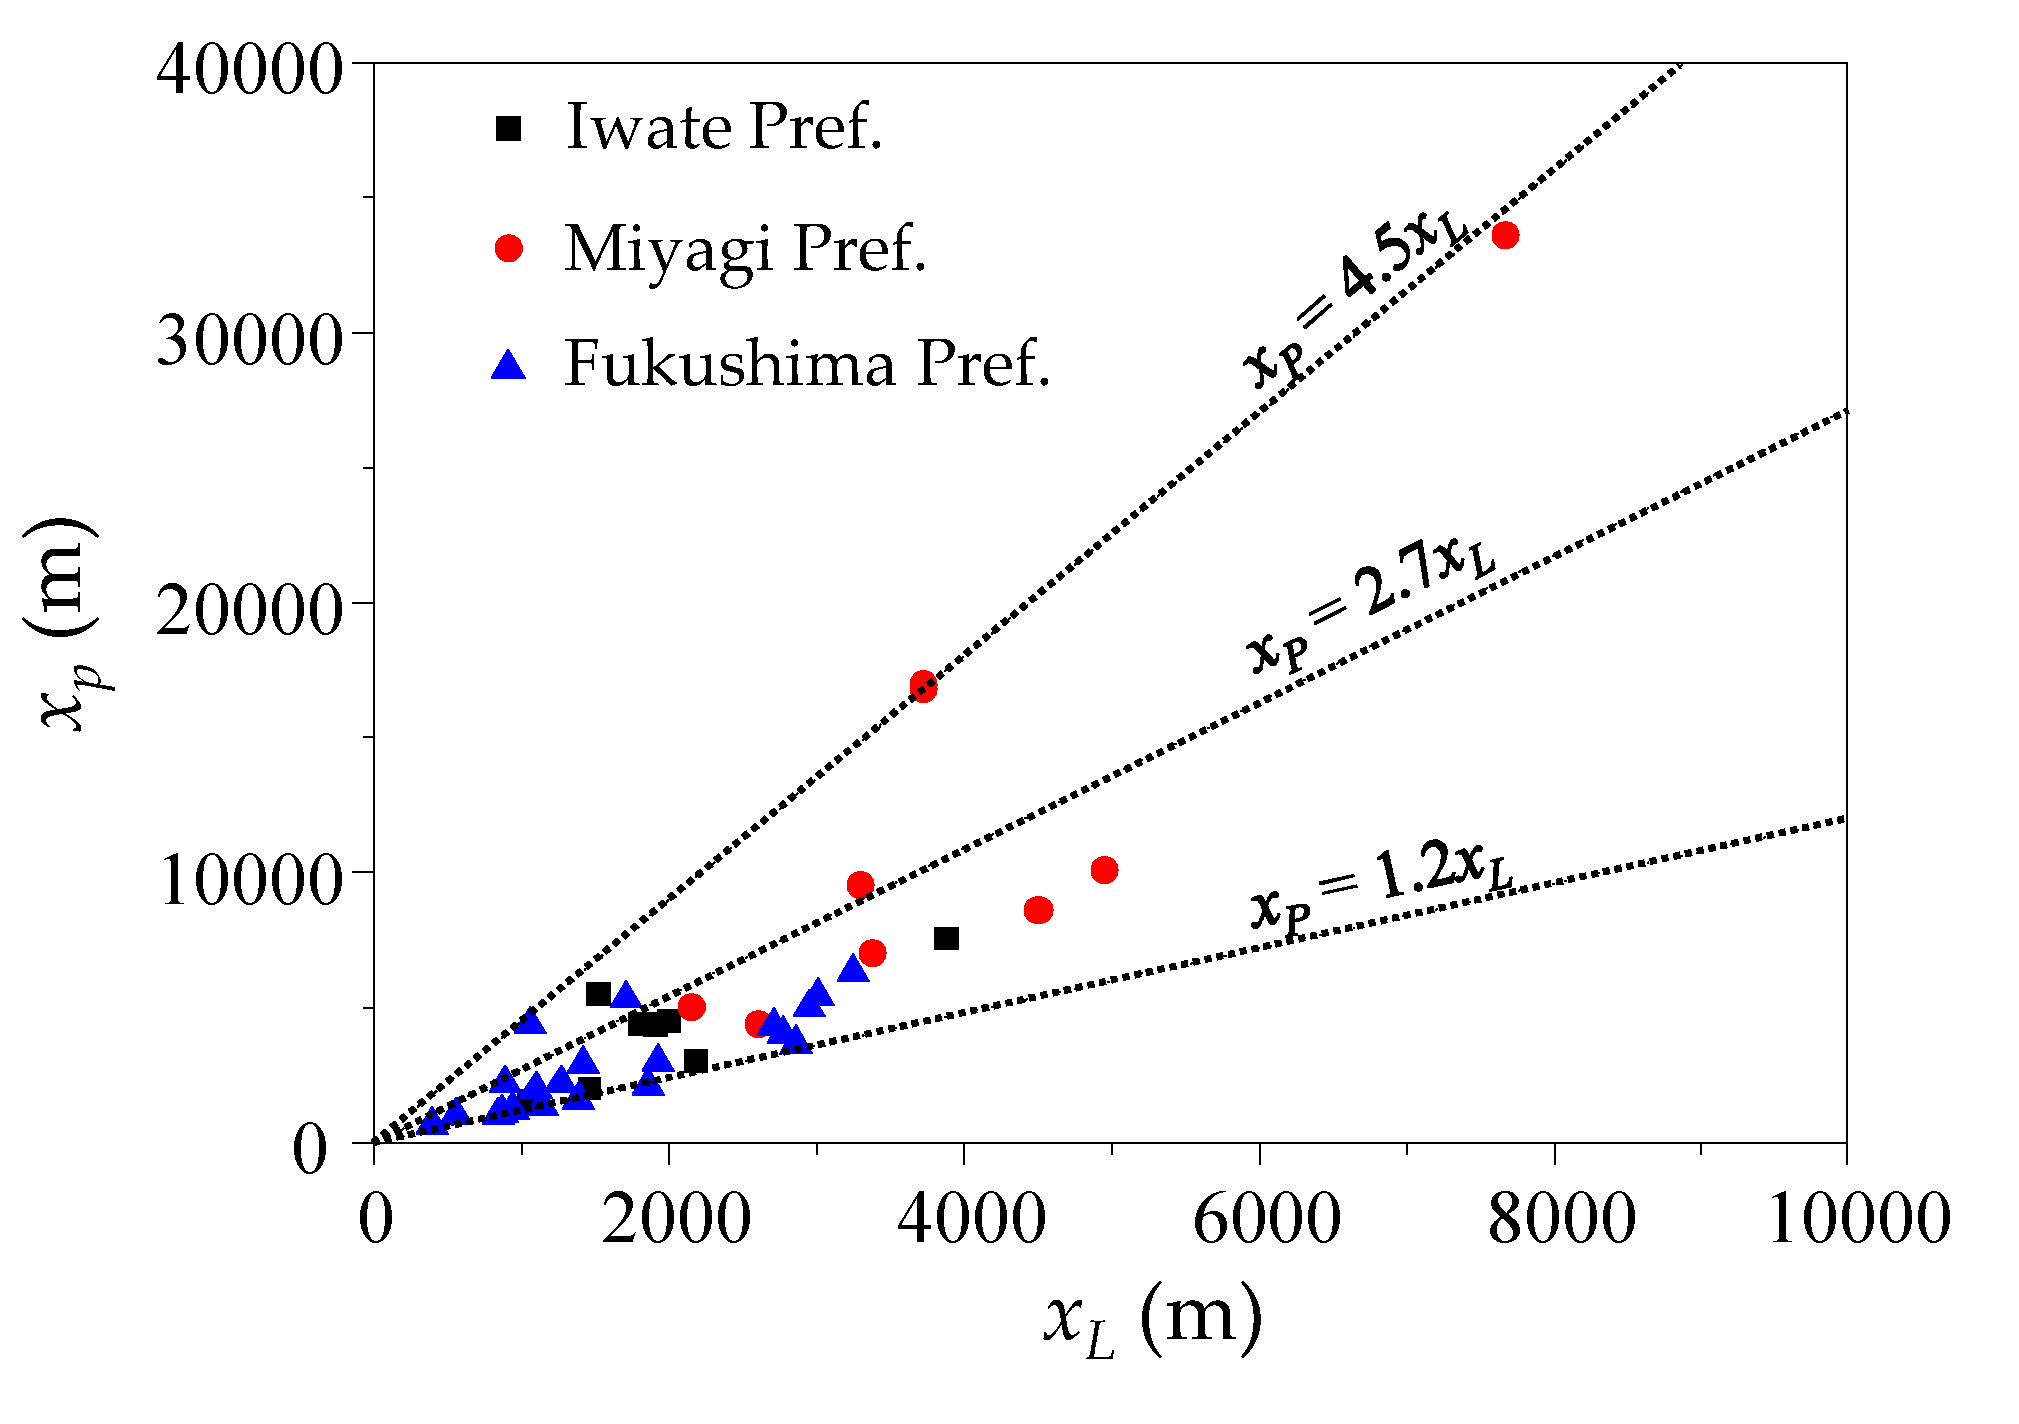
3.2. Relationship of Tsunami Intrusion Distance in River and Land Area

Figure 5 shows the relationships between the river tsunami intrusion distance, x p , and land tsunami propagation distance, x L , for three different prefectures. The tsunami propagation distance inland region was determined from the inundation map by Haraguchi and Iwamatsu [26,27]. Based on this result, the river tsunami intrusion distance was 1.2 to 4.5 times that of the tsunami intrusion in land area. Remarkably, intrusion in the Old Kitakami River, the Yoshida River, and the Naruse River in Miyagi Prefecture and Fujiwara River in Fukushima Prefecture followed the straight line of x p = 4.5 x L . In other words, the river tsunami intrusion has occurred over a much longer distance than on land regions in these rivers. During the present tsunami, the ascended tsunami to the upstream area caused river embankment overflow and then flooded into the land in many places. Therefore, it is necessary to fully understand these intrusion characteristics and to take into consideration future tsunami disaster prevention.

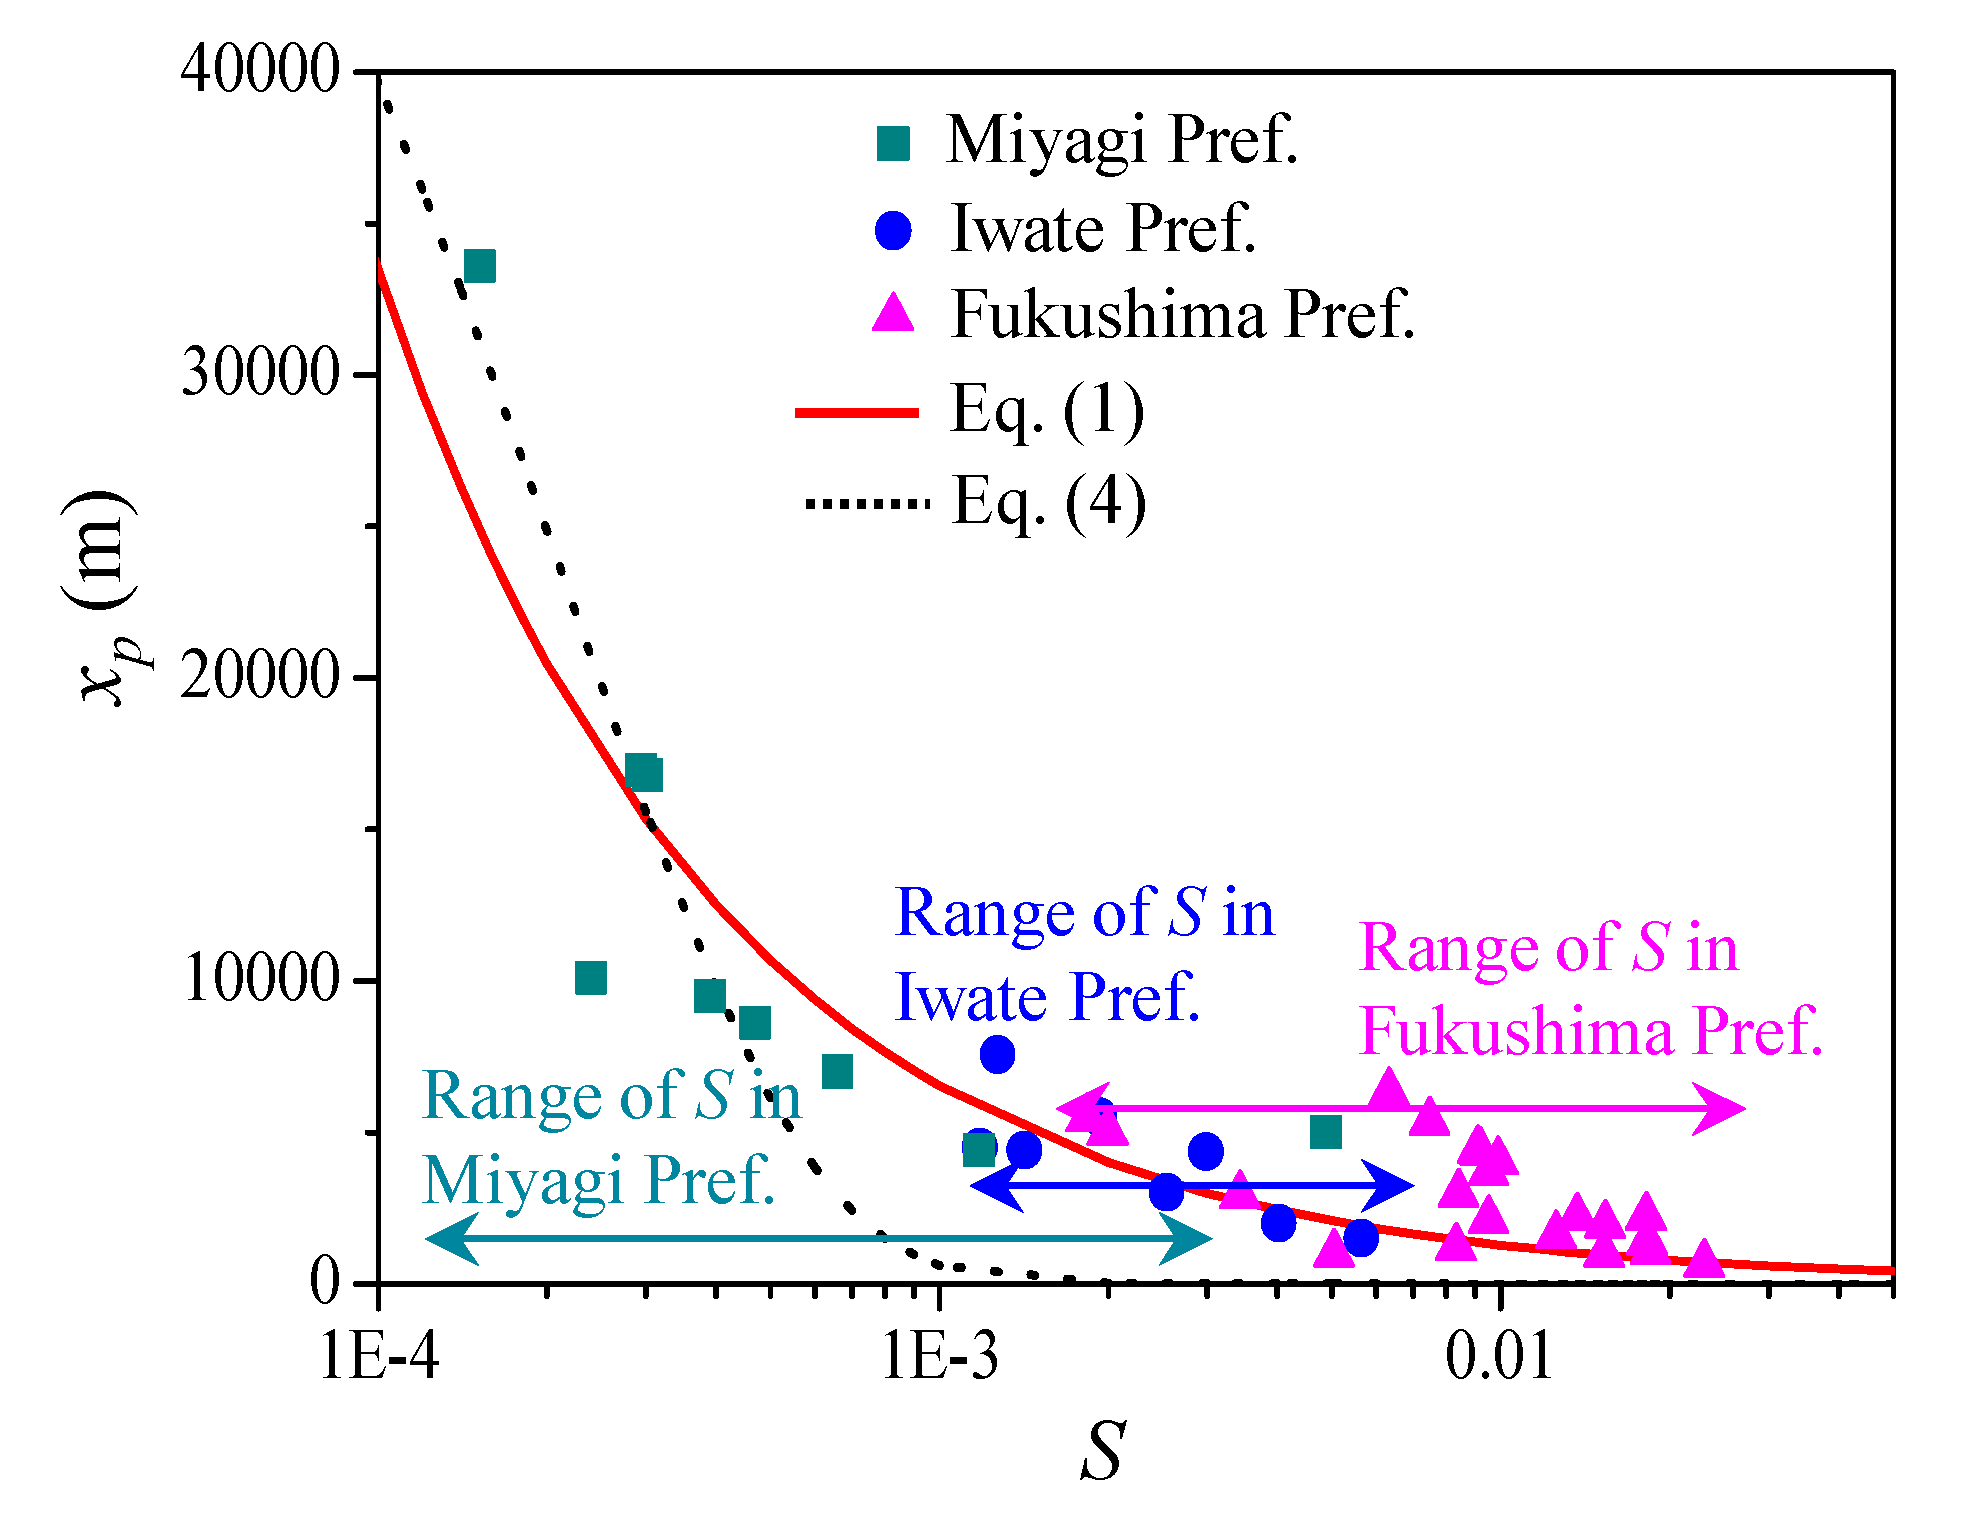
3.3. Relationship between Tsunami Intrusion Distance and Riverbed Slope

For tsunami intrusion process into rivers, riverbed slope is expected to be the most important factor. Based on the current comprehensive data sets from three prefectures, Figure 6 is obtained for the relationship between tsunami propagation distance and river bed slope. By applying the least-square method to all data of the tsunami intrusion distance, a new empirical equation is obtained as follows.
x p = 48.4 S 0.71   ( m )
Tanaka et al. [3] have already proposed another empirical formula based on data sets from Miyagi Prefecture alone. In order to derive a formula for tsunami propagation distance in a river, they assumed the following general exponential relation for the wave attenuation in a channel, as used by [28,29]:
H = H 0 e k x
where x is the upstream coordinate from a river mouth, H is the wave height, H0 corresponds to the initial incoming wave height at x = 0, and k is the damping coefficient.
Based on the measured data from six rivers including the Abukuma River, the Kitakami River, the Old Kitakami River, the Sunaoshi River, the Natori River, and the Naruse River in Miyagi Prefecture, Tanaka et al. [3] obtained an empirical equation for this damping coefficient k and the riverbed slope S as follows:
k = 4.77 × 10 5 e 4.67 x 10 3 S     ( m 1 )
Figure 7 indicates an example of tsunami height damping in the Natori River during the 2011 Tohoku Tsunami. From the slope of the regression line, they obtained the damping coefficient for rivers in Miyagi Prefecture.
By assuming that the tsunami height at the most upstream end equal to 5% of the initial tsunami height (H/H0 = 0.05), the following empirical equation between the tsunami intrusion distance, xp, and riverbed slope, S, is derived:
x p = 6.28 x 10 4 e 4.67 × 10 3 S     ( m )
In Figure 6, Equation (4) thus obtained is also plotted, which gives an underestimated value for the propagation distance in rivers as compared with the newly derived Equation (1). It is noted that the empirical coefficient in Equation (4) was determined using the data sets from Miyagi Prefecture alone, whereas the new Equation (1) covers a wide range of the riverbed slope by compiling data sets from three prefectures. The new equation enables us to estimate the tsunami intrusion distance in a river more accurately.

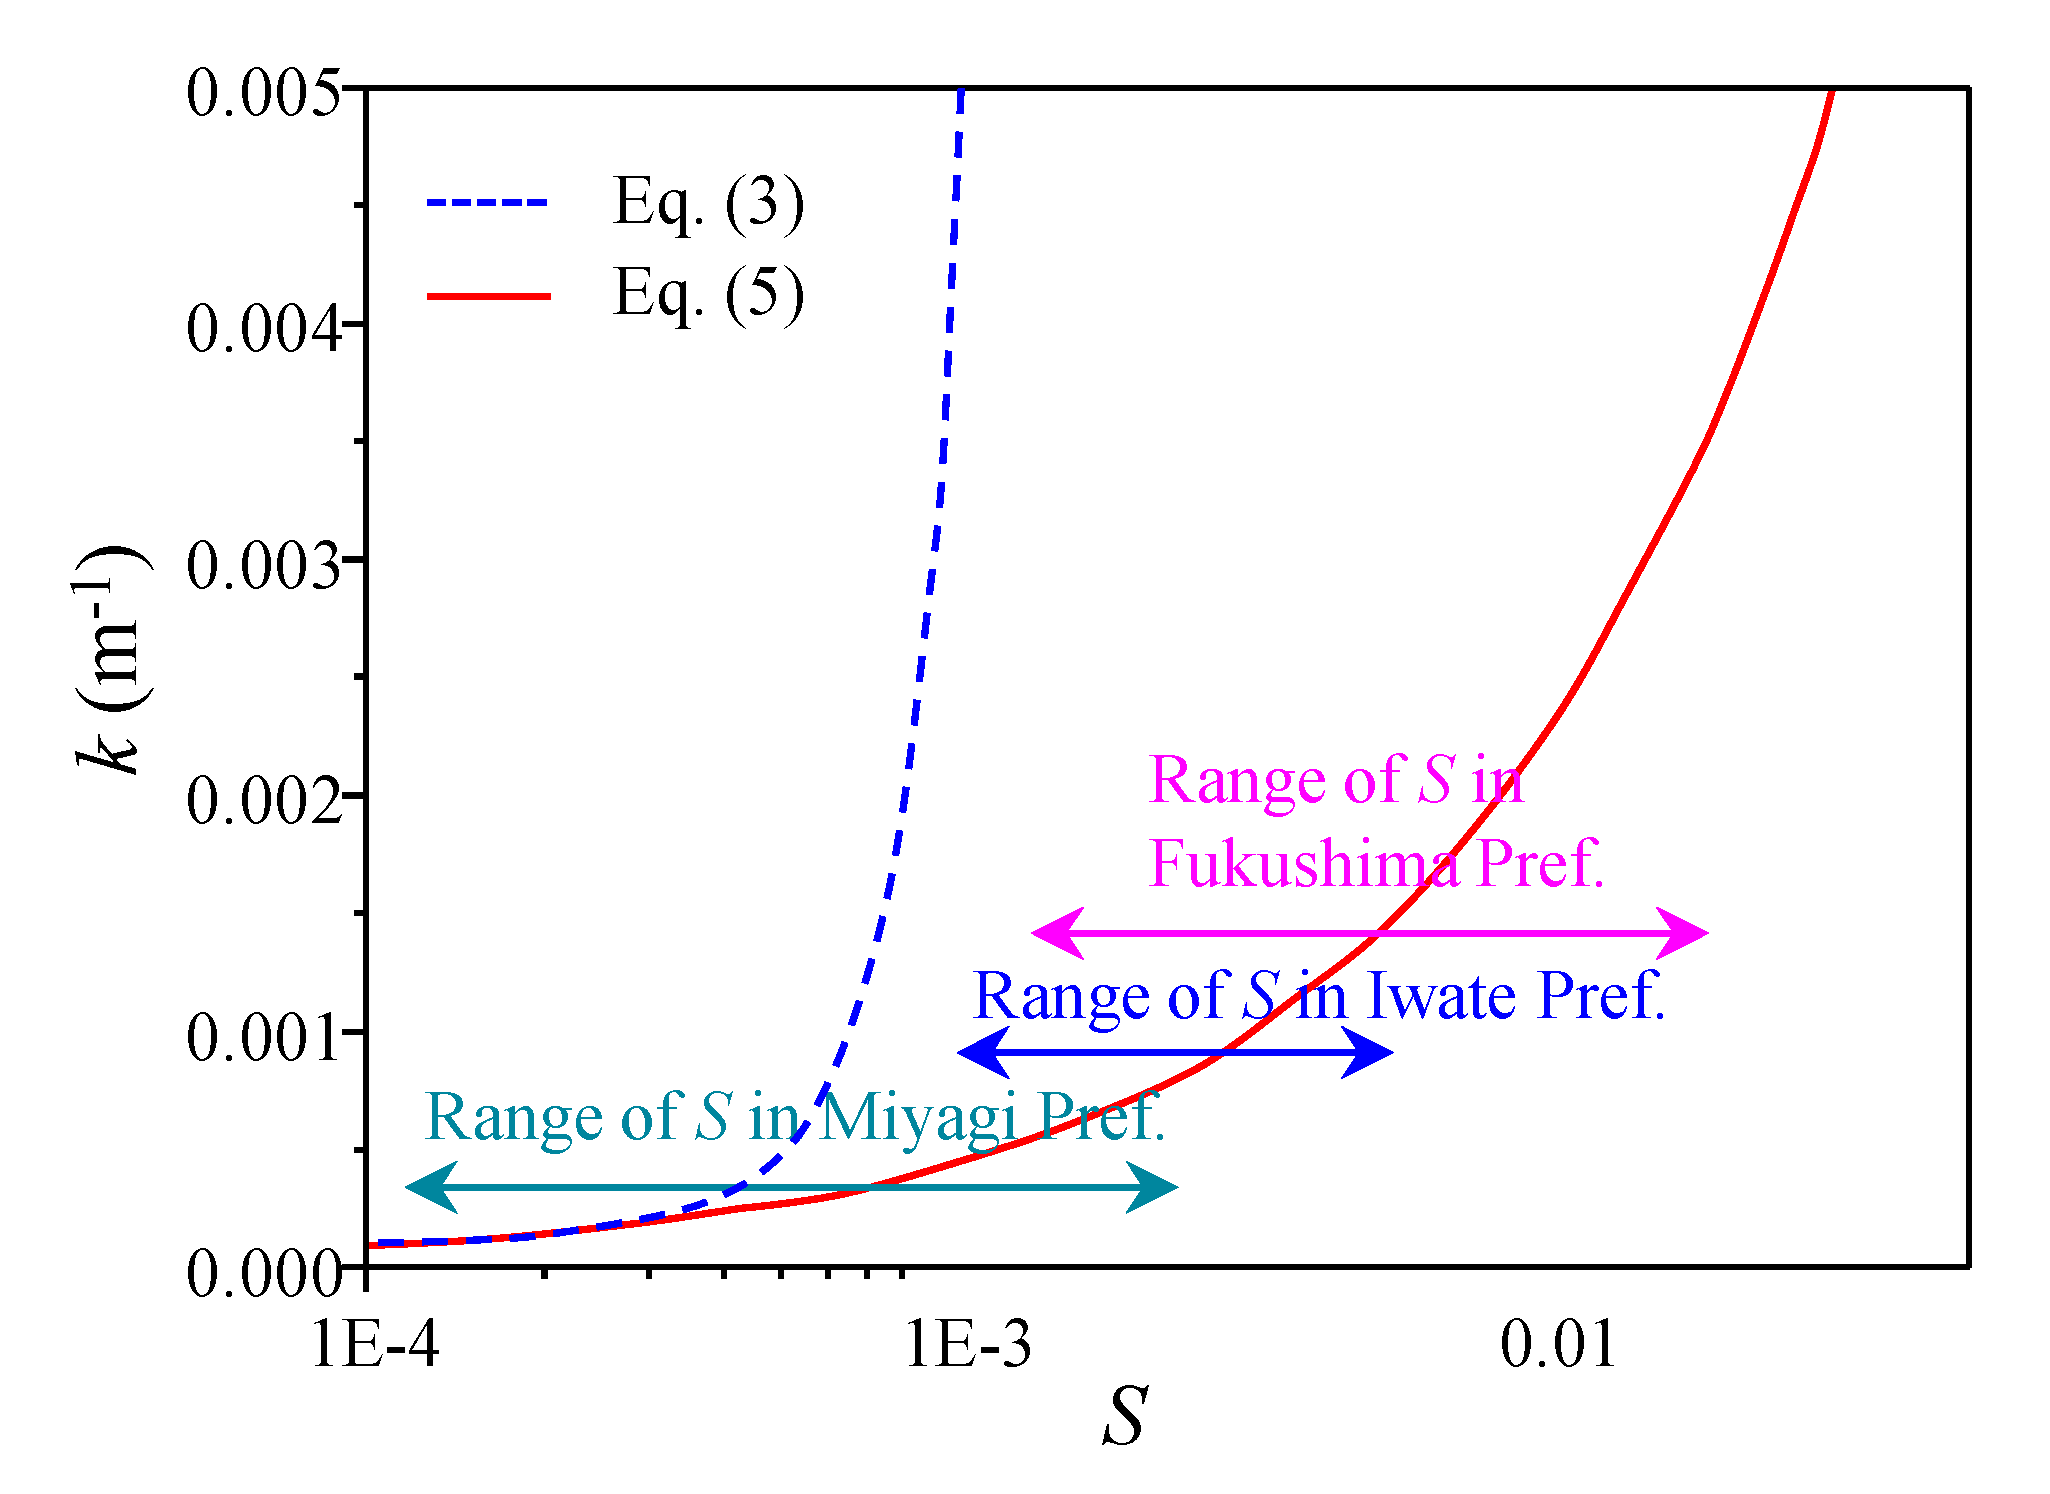
3.4. Evaluation of Tsunami Damping Coefficient

In the same way as Tanaka et al. [3], a new expression for tsunami damping coefficient can be derived by combining the new empirical Equations (1) and (2) and assuming that tsunami height at the intrusion endpoint is equal to 5% of the tsunami height at the river month.
k = 6.19 x 10 2 S 0.71     ( m 1 )
Figure 8 shows comparison results between the old and new equations of the tsunami damping coefficient. The old Equation (3) overestimates the k-value as compared with Equation (5). This is due to the limited data from Miyagi Prefecture alone to obtained Equation (3) in the previous study. It is recommended to use the new Equation (5) to calculate the tsunami height and intrusion distance into rivers. Finally, substituting Equation (5) into Equation (2), a dimensionless exponential relation is obtained for tsunami height attenuation.
H H 0 = e x p { 6.19 × 10 2 S 0.71 × x }           ( m - unit )

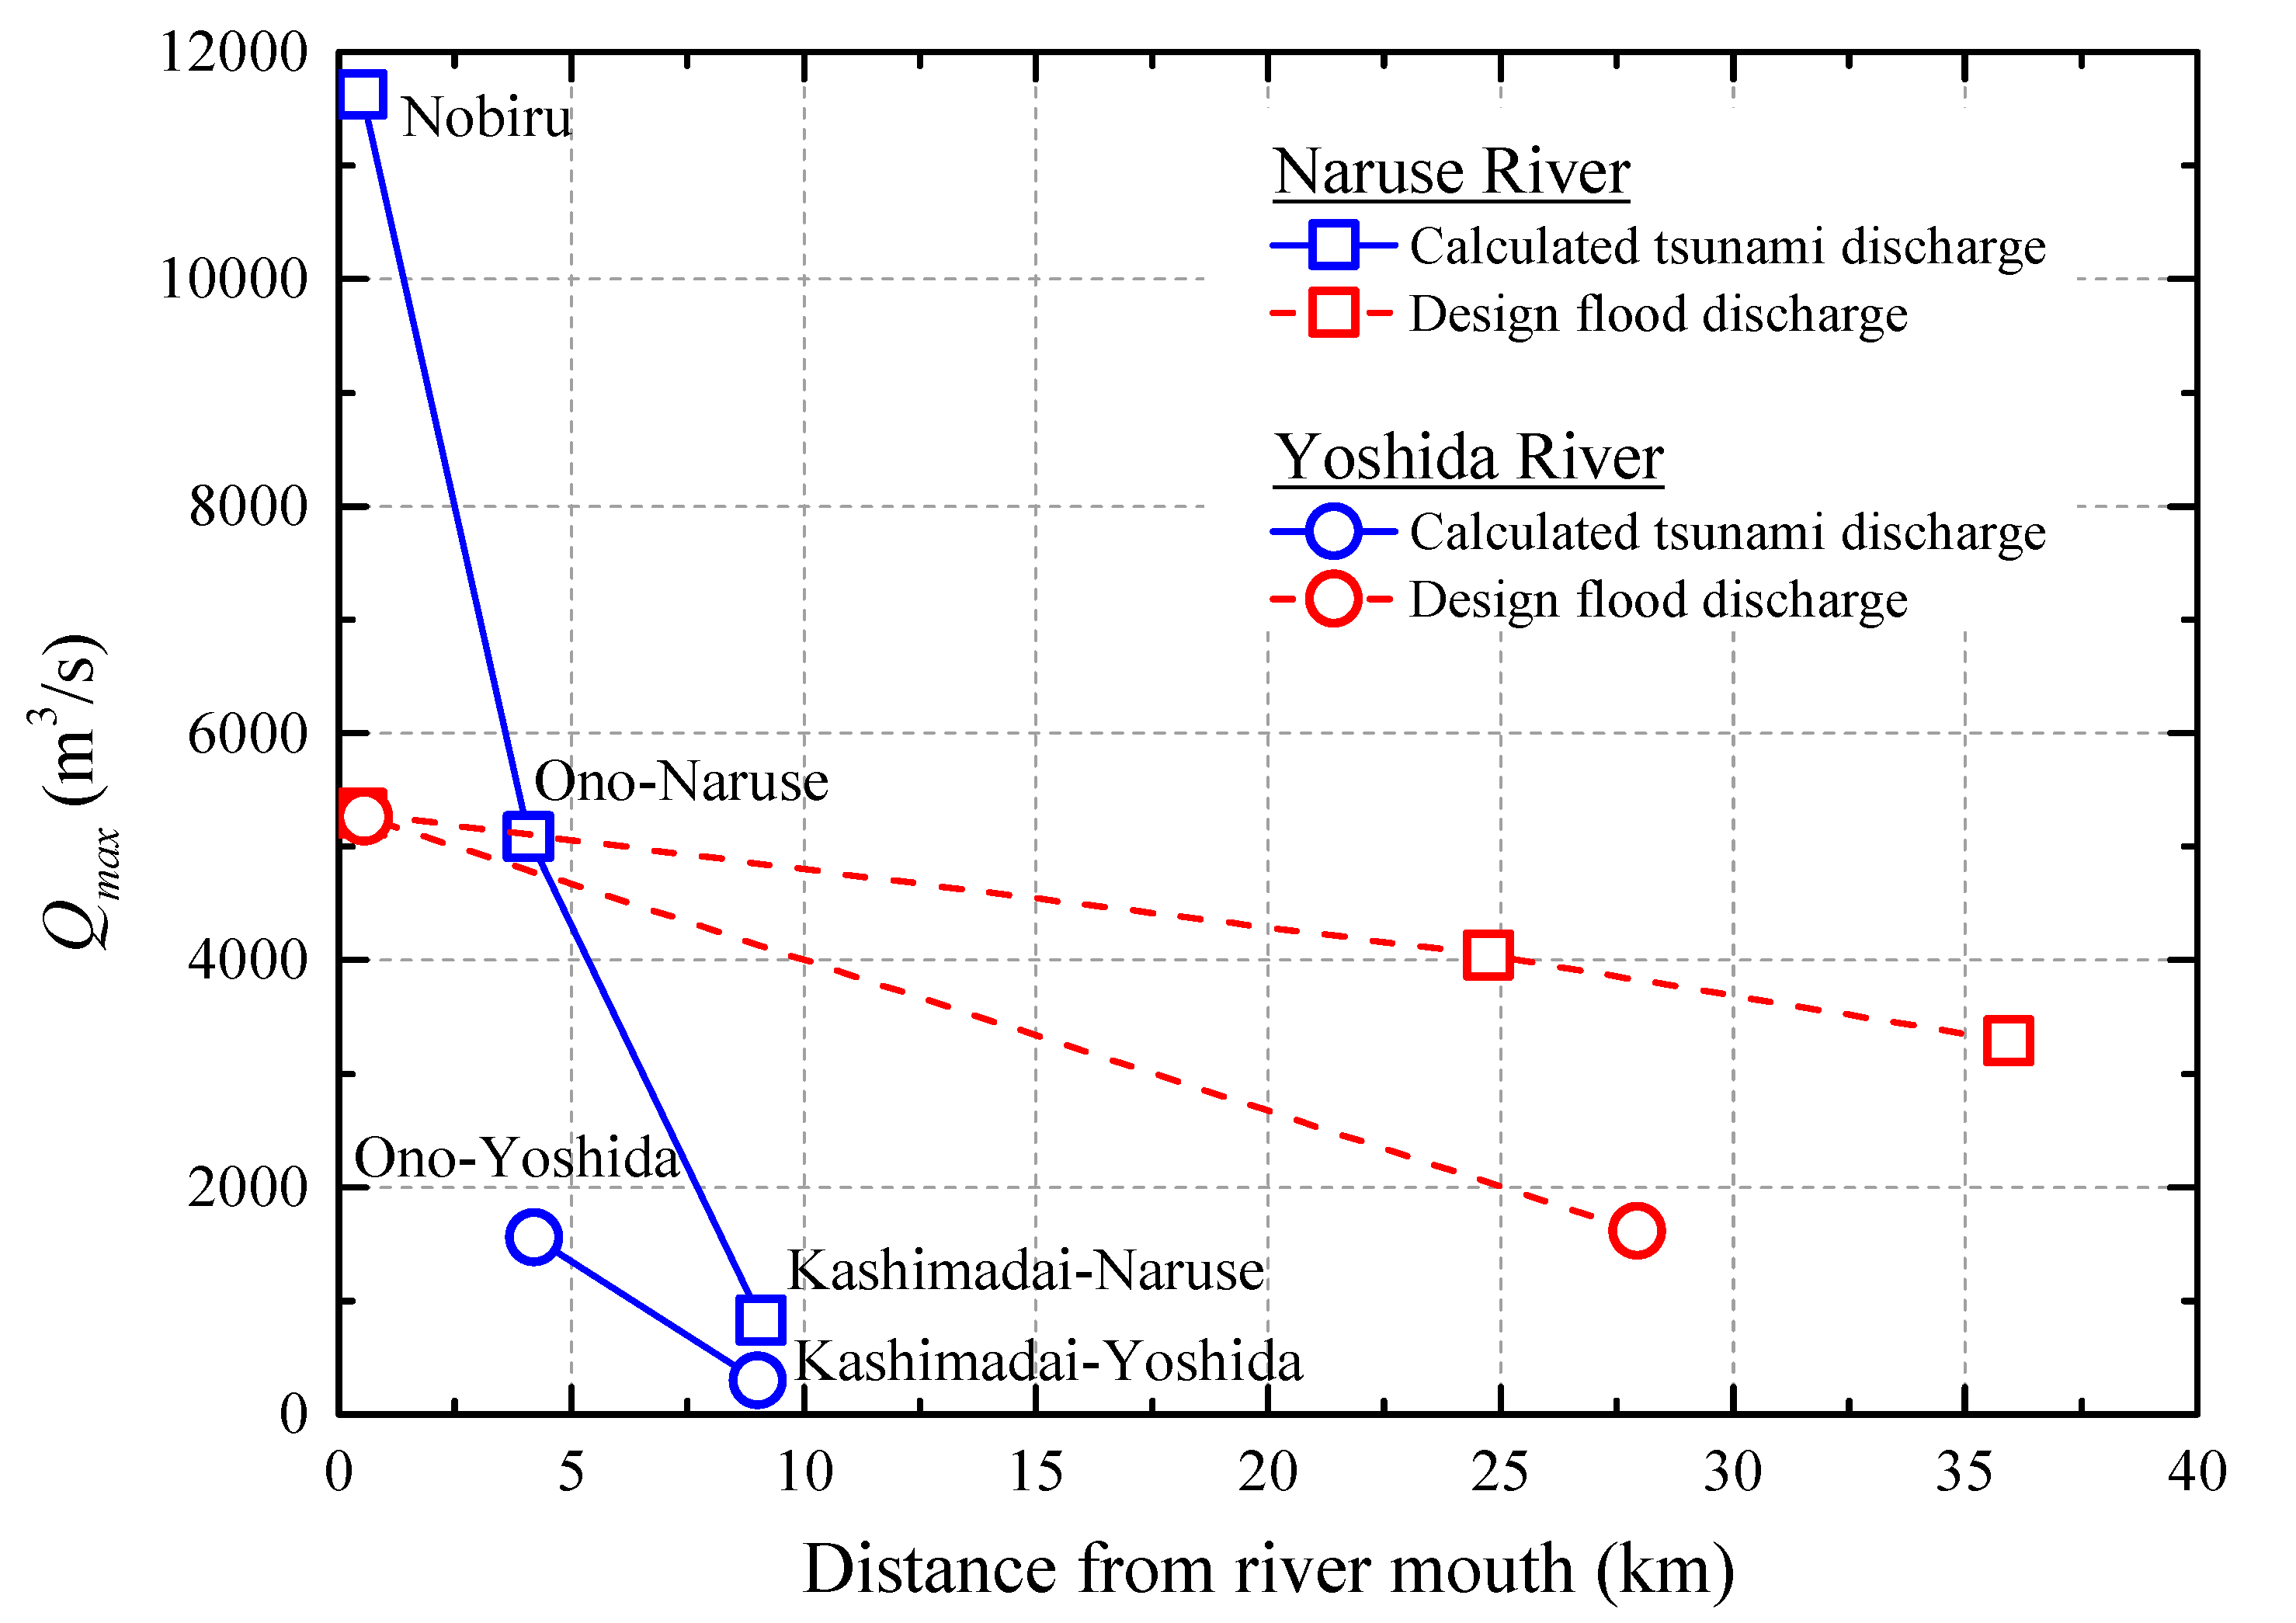
4. Evaluation of Tsunami-Induced Flow Discharge and Velocity in a River

4.1. Methodology

Due to increased opportunities for capturing real tsunamis by a video camera in recent years, studies have been carried out to assess flow velocity from video recordings [30,31,32,33]. In this study, a distinctly different approach utilizing measured water level data along a river will be applied in order to evaluate river discharge and velocity induced by tsunami wave propagation. For this purpose, Adityawan et al. [10] used a continuity equation for a one-dimensional flow analysis as
A t + Q x = 0
where A is the cross-sectional area, t is time, Q is the discharge, and x is the horizontal distance from a reference point (going upstream). Equation (7) is integrated to obtain the following:
Q i Q N = x i x N B η t d x
where η is the water level, B is the river width, Q i is the discharge at cross-section i located at xi, and Q N is the upstream discharge at x N (upstream end).
Equation (8) is solved numerically using the finite difference method to obtain discharge and velocity at the measurement point as follows:
Q i t = j = i N 1 B j + 1 ( η j + 1 t η j + 1 t Δ t ) + B j ( η j t η j t Δ t ) 2 Δ t ( x j + 1 x j ) + Q N
where Δt is the time interval according to the measurement.
Velocity estimation was conducted in the Naruse and Yoshida Rivers located in Miyagi Prefecture. These two rivers flow nearly parallel, as depicted in Figure 9a, and share the river mouth immediately before it pours to the sea (Figure 9b). The water level variation has been obtained along these rivers during the 2011 Tohoku tsunami at the measuring stations summarized in Table 1. The raw data measured in the rivers with the time interval Δt = 10 min are illustrated in Figure 10, which can be substituted into Equation (9) for numerical integration. Moreover, measured discharge at the upstream boundary Q N is used in Equation (9).

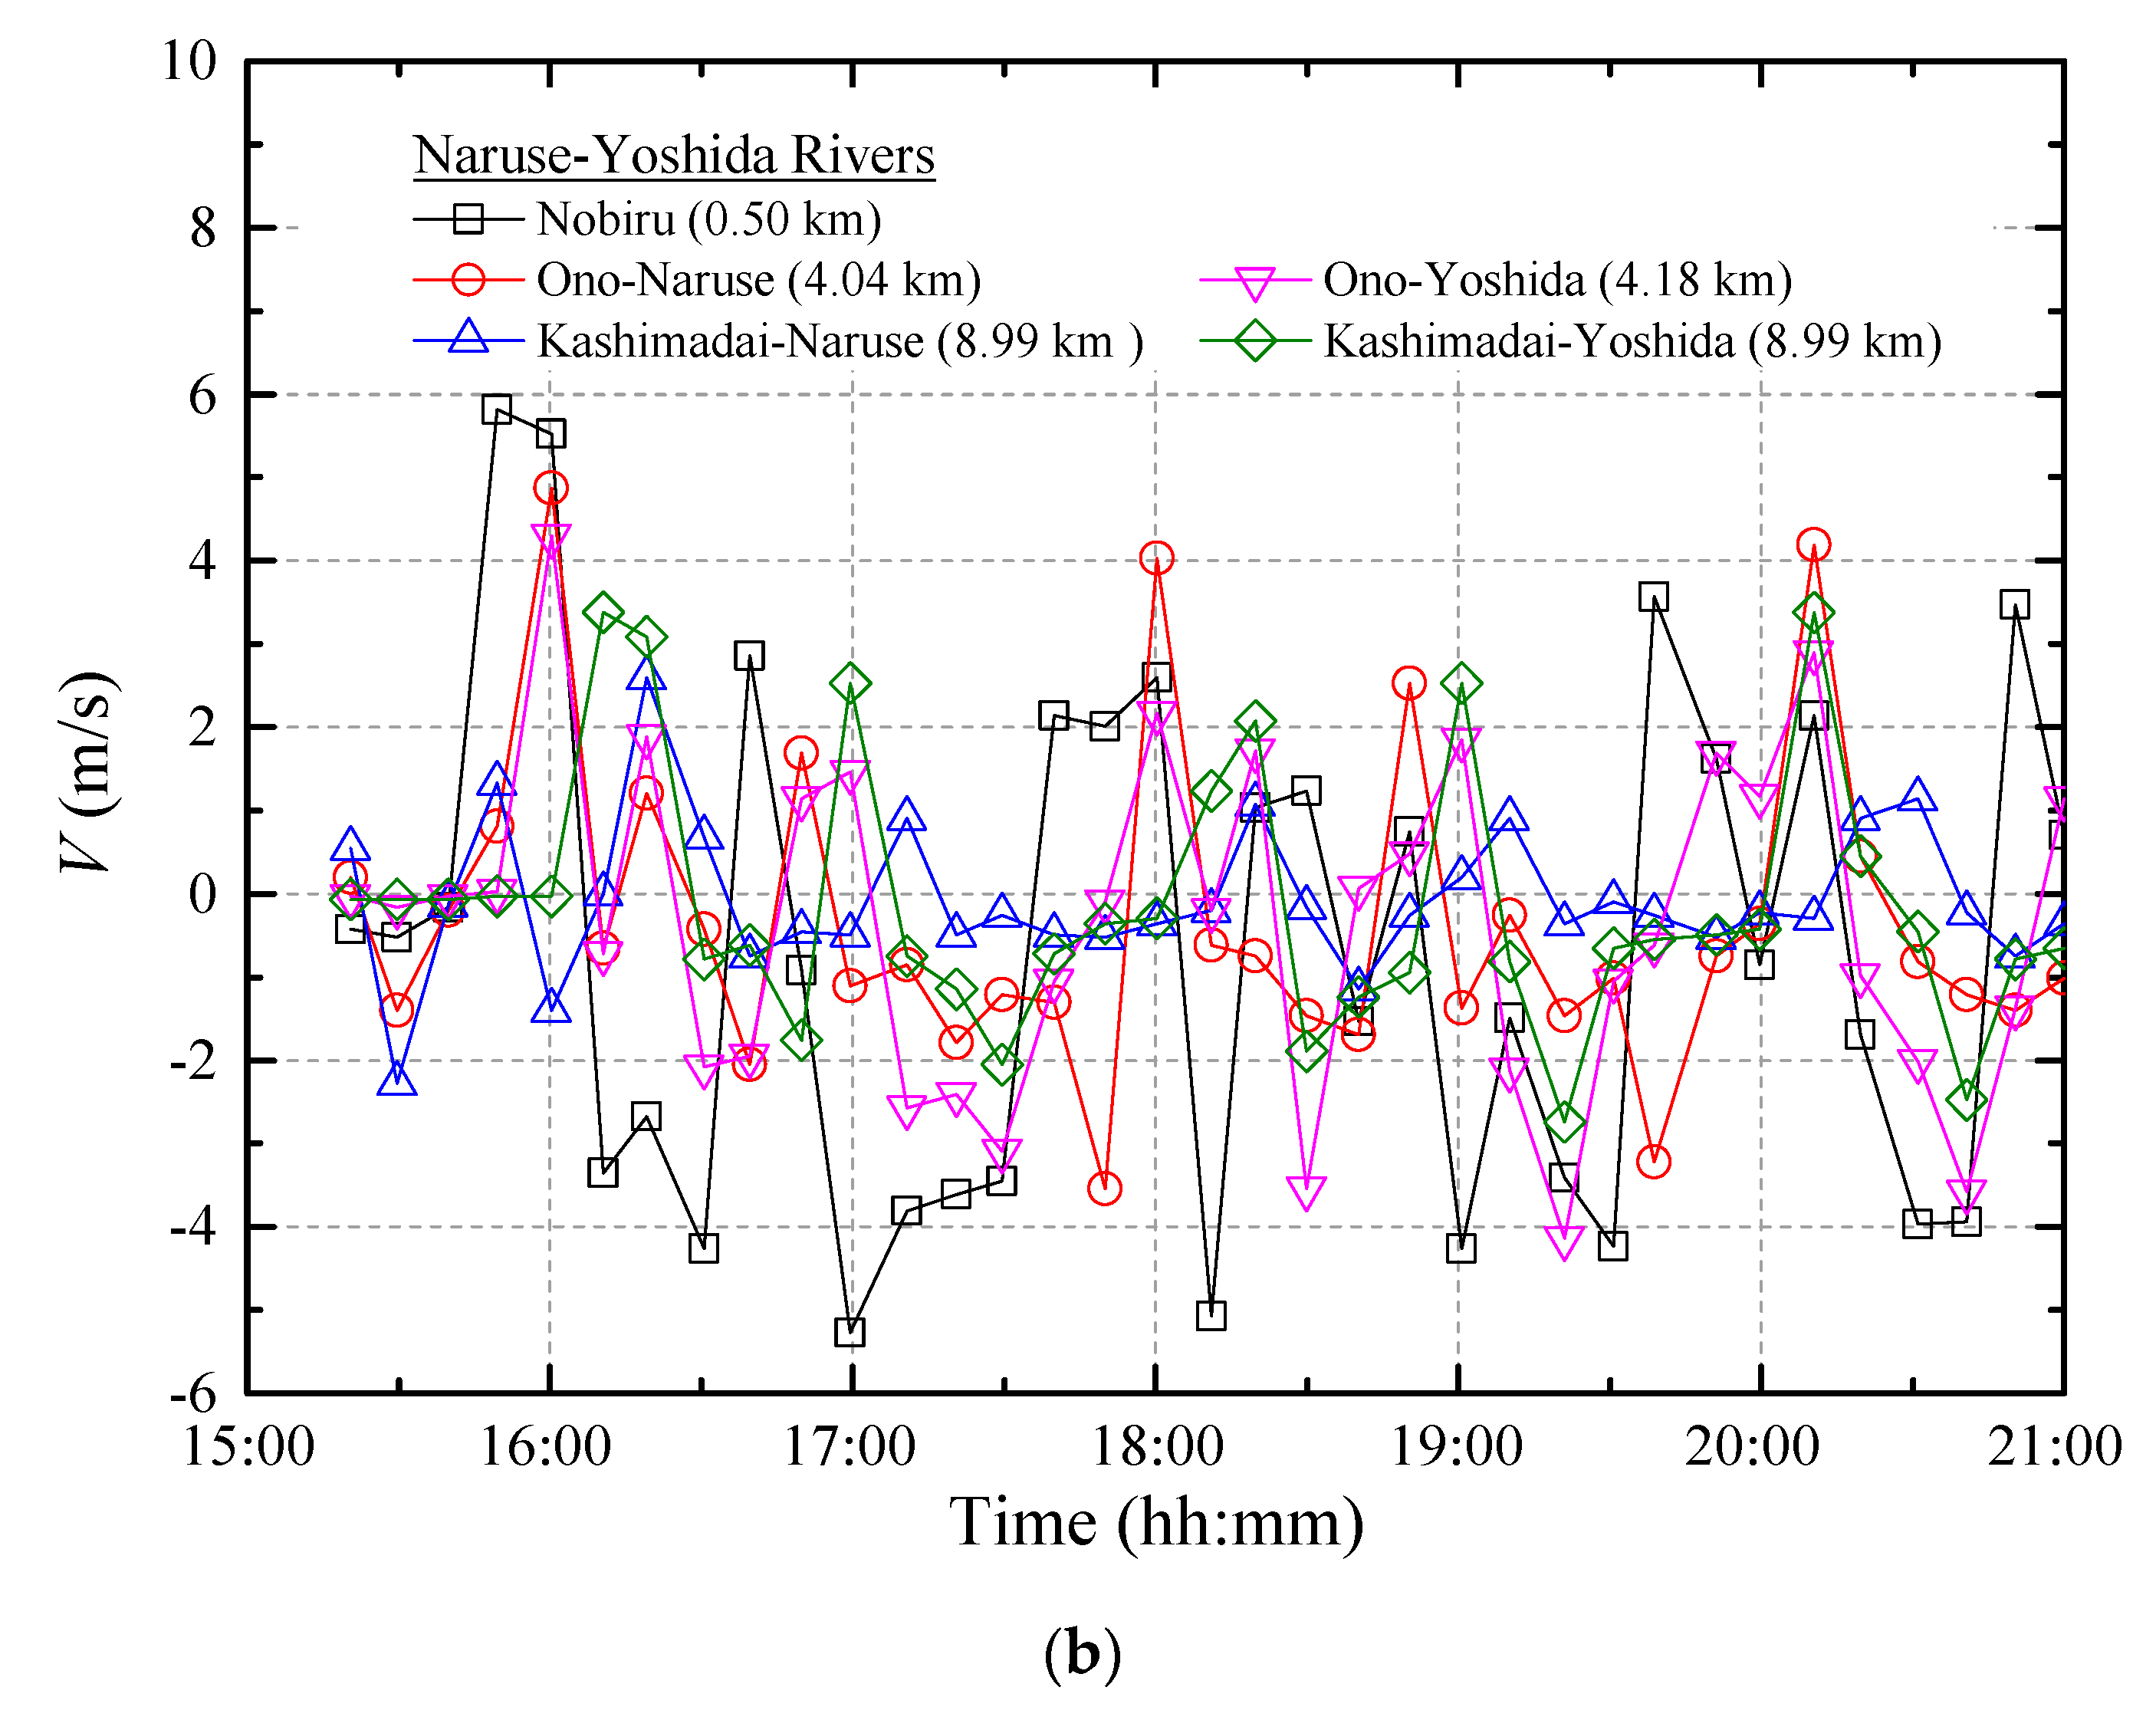
4.2. Results and Discussion

Based on Equation (9), temporal variation of the discharge Q and velocity V at an arbitrary point can be estimated as shown in Figure 11. Figure 11a shows the river discharge induced by the tsunami wave in Naruse and Yoshida Rivers. The discharge at the river mouth (Nobiru) was as large as 12,000 m3/s with a distinct reduction over time. The magnitude is reduced as the wave propagates upstream. The calculated discharge was converted to velocity by dividing its value with the flow area as shown in Figure 11b. As compared with the past evaluations such as [30,31,32,33], the estimated tsunami flow velocity shown in the figure using the conservation equation is of a similar magnitude and pattern.
Figure 12 shows a comparison result between the design flood discharge and maximum river discharge induced by the tsunami in the Naruse and Yoshida Rivers. The return period of the design flood is 100 years [34]. The maximum discharge due to the tsunami propagation at the river mouth was computed as more than two times that of the design flood discharge. In fact, this area was affected severely by the tsunami propagation and inundation due to the extreme discharge much bigger than the design flood discharge [35,36].

5. Conclusions

A comprehensive study of river tsunami intrusion distance and tsunami-induced flow discharge in Tohoku District was carried out by analyzing the collected data sets after the 2011 Tsunami in Japan. The main conclusions are as follows.
(1)
There is no clear relationship between the coastal tsunami height and tsunami intrusion distance in the river.
(2)
The tsunami propagation distance inside of the river is approximately 1.2 to 4.5 times longer than the travel distance over inland areas.
(3)
Based on the comprehensive data compilation, new empirical equations were obtained for calculating the damping coefficient and tsunami intrusion distance using the riverbed slope. The new equation results compared well with the measured data in three prefectures in Tohoku District. The new equation forms are similar to the equations by Tanaka et al. [3], but the present equations cover a wide range of river morphologies and geometries. Therefore, as compared with the previously proposed equation by Tanaka et al. [3], the applicability of the present equations will be higher. However, further verification of will be required by adding more data based on field observations, numerical experiments, and laboratory experiments.
(4)
The continuity equation is applied to estimate the flow discharge during the 2011 tsunami. The magnitude of the velocity is similar to those obtained from video analysis by other researchers.

Author Contributions

The first three authors, H.T., N.X.T., N.T.H., and K.K., mainly contributed to this article. The first author led group discussion and checked the contents, whereas the second and third authors collected and analyzed the field measurement data sets. The rest of the co-authors, M.R., M.U., M.S., S.K. and M.T., made contribution in field investigation to collect the tsunami propagation distance. All authors have read and agreed to the published version of the manuscript.

Funding

This work was funded by the TAISEI Research Foundation.

Acknowledgments

We received valuable river water level data from various organizations such as the Ministry of Land, Infrastructure, Transport (MLIT), Iwate, Miyagi, and Fukushima Prefectures. The authors would like to gratefully acknowledge all the supports.

Conflicts of Interest

The authors declare no conflict of interest.

References

  1. Tanaka, H.; Tinh, N.X.; Umeda, M.; Hirao, R.; Pradjoko, E.; Mano, A.; Udo, K. Coastal and estuarine morphology changes induced by the 2011 Great East Japan Earthquake Tsunami. Coast. Eng. J. 2012, 54. [Google Scholar] [CrossRef]
  2. Tanaka, H.; Adityawan, M.B.; Mano, A. Morphological changes at the Nanakita River mouth after the Great East Japan Tsunami of 2011. Coast. Eng. 2014, 86, 14–26. [Google Scholar] [CrossRef] [Green Version]
  3. Tanaka, H.; Kayane, K.; Adityawan, M.B.; Roh, M.; Farid, M. Study on the relation of river morphology and tsunami propagation in rivers. Ocean Dyn. 2014, 64, 1319–1332. [Google Scholar] [CrossRef]
  4. Adityawan, M.B.; Tanaka, H. Investigating the effect of old river mouth and the Teizan Canal in Sendai Coast to the 2011 Tsunami. In Tsunamis and Earthquakes in Coastal Environments -Significance and Restoration; Springer: Berlin/Heidelberg, Germany, 2016; pp. 125–136. [Google Scholar]
  5. Mitobe, Y.; Tanaka, H.; Watanabe, K.; Tiwari, N.; Watanabe, Y. Numerical experiments on effect of river mouth morphology on tsunami behavior in rivers. Coast. Eng. J. 2018, 60, 516–531. [Google Scholar] [CrossRef]
  6. Wijetunge, J.J. Field measurements and numerical simulations of the 2004 Tsunami impact on the east coast of Sri Lanka. Pure Appl. Geophys. 2009, 166, 593–622. [Google Scholar] [CrossRef]
  7. Suppasri, A.; Koshimura, S.; Imai, K.; Mas, E.; Gokon, H.; Muhari, A.; Imamura, F. Damage characteristic and field survey of the 2011 Great East Japan Tsunami in Miyagi Prefecture. Coast. Eng. J. 2012, 54, 30. [Google Scholar] [CrossRef]
  8. Abe, K. Tsunami propagation in rivers of the Japanese Islands. Cont. Shelf Res. 1986, 5, 665–677. [Google Scholar] [CrossRef]
  9. Tanaka, H.; Ishino, K.; Nawarathna, B.; Nakagawa, H.; Yano, S.; Yasuda, H.; Watanabe, Y.; Hasegawa, K. Field investigation of disasters in Sri Lankan rivers caused by the 2004 Indian Ocean Tsunami. J. Hydrosci. Hydr. Eng. 2008, 66, 91–112. [Google Scholar]
  10. Tanaka, H.; Tinh, N.X.; Dao, N.X. Field measurement and numerical studies on the tsunami propagation into upstream of rivers. In Proceedings of the 34th IAHR Congress, Brisbane, Australia, 26 June—1 July 2011. [Google Scholar]
  11. Adityawan, M.B.; Roh, M.; Tanaka, H.; Mano, A.; Udo, K. Investigation of tsunami propagation characteristics in rivers and on land induced by the Great East Japan Earthquake 2011. J. Earthq. Tsunami 2012, 6, 22. [Google Scholar] [CrossRef]
  12. Tolkova, E.; Tanaka, H. Tsunami Bores in Kitakami River. Pure Appl. Geophys. 2016, 173, 4039–4054. [Google Scholar] [CrossRef] [Green Version]
  13. Tolkova, E. Tsunami penetration in tidal rivers, with observations of the Chile 2015 tsunami in rivers in Japan. Pure Appl. Geophys. 2016, 173, 389–409. [Google Scholar] [CrossRef] [Green Version]
  14. Viana-Baptista, M.A.; Soares, P.M.; Miranda, J.M.; Luis, J.F. Tsunami propagation along Tagus estuary (Lisbon, Portugal) preliminary results. Sci. Tsunami Hazards 2006, 24, 329–338. [Google Scholar]
  15. Yeh, H.; Tolkova, E.; Jay, D.; Talke, S.; Fritz, H. Tsunami hydrodynamics in the Columbia River. J. Disaster Res. 2011, 7, 604–608. [Google Scholar] [CrossRef]
  16. Sun, J.S.; Wai, O.W.H.; Chau, K.T.; Wong, R.H.C. Prediction of tsunami propagation in the Pearl River estuary. Int. J. Tsunami Soc. 2009, 28, 142–153. [Google Scholar]
  17. Yasuda, H. A one-dimensional study on propagation of tsunami wave in river channels. J. Hydr. Eng. 2010, 136, 93–105. [Google Scholar] [CrossRef]
  18. Iwasaki, T.; Abe, T.; Hashimoto, K. Study on the characteristic of river tsunami. J. JSCE 1977, 24, 74–77. (In Japanese) [Google Scholar]
  19. Murashima, Y.; Koshimura, T.; Oka, H.; Murata, Y.; Suzuki, T.; Imamura, F. Numerical simulation of tsunami run-up on Tokachi River using nonlinear dispersive wave equations model and evaluation of space grid size. J. JSCE 2010, 66, 201–205. (In Japanese) [Google Scholar] [CrossRef] [Green Version]
  20. Matsumiya, H.; Yoneyama, N.; Tanaka, T.; Samejima, R.; Sato, H. Numerical analysis of salt water behavior caused by river-runup of tsunami in the upstream part of the Yodo River weir. J. Jpn. Soc. Nat. Disaster Sci. 2009, 28, 125–135. (In Japanese) [Google Scholar]
  21. Tolkova, E.; Tanaka, H.; Roh, M. Tsunami observations in rivers from a perspective of tsunami interaction with tide and riverine flow. Pure Appl. Geophys. 2015, 172, 953–968. [Google Scholar] [CrossRef]
  22. Kalmbacher, K.D.; Hill, D.F. Effects of tides and currents on tsunami propagation in large rivers, Columbia River, United States. J. Waterw. Port Coast. Ocean Eng. 2015, 141. [Google Scholar] [CrossRef]
  23. Tanaka, H.; Adityawan, M.B.; Mitobe, Y.; Widiyanto, W. A new computation method of bottom shear stress under tsunami waves. J. Coast. Res. 2016, 75, 1247–1251. [Google Scholar] [CrossRef]
  24. Great East Japan Earthquake Tsunami Joint Survey Group. Available online: https://coastal.jp/ttjt/index.php (accessed on 15 September 2020).
  25. Mori, N.; Takahashi, T.; Yasuda, T.; Yanagisawa, H. Survey of 2011 Tohoku earthquake tsunami inundation and run-up. Geophys. Res. Lett. 2011, 38, L00G14. [Google Scholar] [CrossRef]
  26. Haraguchi, T.; Iwamatsu, A. Detailed Maps of the Impacts of the 2011 Japan Tsunami Vol.1: Aomori, Iwate and Miyagi Prefectures; Kokonshoin: Tokyo, Japan, 2011. (In Japanese) [Google Scholar]
  27. Haraguchi, T.; Iwamatsu, A. Detailed Maps of the Impacts of the 2011 Japan Tsunami Vol.2: Fukushima, Ibaraki and Chiba Prefectures; Kokonshoin: Tokyo, Japan, 2011. (In Japanese) [Google Scholar]
  28. Hunt, J.N. Viscous damping of waves over an inclined bed in a channel with finite width. Houille Blanche 1952, 7, 836–842. [Google Scholar] [CrossRef] [Green Version]
  29. Dalrymple, R.A. Water wave propagation in jettied channels. In Proceedings of the 23rd International Conference on Coastal Engineering, Venice, Italy, 4–9 October 1992; pp. 3040–3053. [Google Scholar]
  30. Fritz, H.M.; Borrero, J.C.; Synolakis, C.E.; Yoo, J. 2004 Indian Ocean tsunami flow velocity measurements from survivor videos. Geophys. Res. Lett. 2006, 33, L24605. [Google Scholar] [CrossRef]
  31. Borrero, J.; Synolakis, C.E.; Fritz, H.M. Field surveys of northern Sumatra after the tsunami and earthquake of 26 December 2004. Earthq. Spectra 2006, 22, S93–S104. [Google Scholar] [CrossRef] [Green Version]
  32. Fritz, H.M.; Phillips, D.A.; Okayasu, A.; Shimozono, T.; Liu, H.; Mohammed, F.; Skanavis, V.; Synolakis, C.E.; Takahashi, T. The 2011 Japan tsunami current velocity measurements from survivor videos at Kesennuma Bay using LiDAR. Geophys. Res. Lett. 2012, 39, L00G23. [Google Scholar] [CrossRef]
  33. Hayashi, S.; Koshimura, S. The 2011 Tohoku Tsunami Flow Velocity Estimation by the Aerial Video Analysis and Numerical Modeling. J. Disaster Res. 2013, 8, 561–572. [Google Scholar] [CrossRef]
  34. Tohoku Regional Bureau, Ministry of Land, Infrastructure, Transport and Tourism. River Improvement Plan in the Naruse River Basin; Tohoku Regional Bureau: Sendai, Japan, 2012; 124p. (In Japanese) [Google Scholar]
  35. Hiep, N.T.; Tanaka, H.; Tinh, N.X. Post-tsunami recovery and morphology change at Naruse River mouth, Japan. In Proceedings of the 10th International Conference on Asian and Pacific Coasts (APAC2019), Hanoi, Vietnam, 25–28 September 2019; pp. 797–801. [Google Scholar]
  36. Tanaka, H.; Hiep, N.T. Decadal morphological recovery of estuaries and coasts after the 2011 Tohoku Tsunami. In Proceedings of the ICSEA 2019, Ho Chi Minh City, Vietnam, 24–26 October 2019; Lecture Notes in Civil Engineering, 80. Springer: Singapore, 2020; pp. 31–41. [Google Scholar]
Figure 1. Location of study areas on the Japan map. (a) Rivers in Fukushima Prefecture. (b) Rivers in Miyagi Prefecture. (c) Rivers in Iwate Prefecture.
Jmse 08 00882 g001
Figure 2. An example data of riverbed elevation in the Naruse River, Miyagi Prefecture.
Jmse 08 00882 g002
Figure 3. (a) Coastline from Iwate Prefecture to Fukushima Prefecture. (b) Coastal tsunami height. (c) River tsunami intrusion distance.
Jmse 08 00882 g003
Figure 4. Relationship between river tsunami intrusion distance and coastal tsunami height.
Jmse 08 00882 g004
Figure 5. Relationship of tsunami intrusion distance inside of river and land area.
Jmse 08 00882 g005
Figure 6. Relationship between intrusion distance and riverbed slope.
Jmse 08 00882 g006
Figure 7. Tsunami damping in the Natori River [3].
Jmse 08 00882 g007
Figure 8. Relationship of damping coefficient and riverbed slope.
Jmse 08 00882 g008
Figure 9. (a) Location of water level measuring stations along Naruse and Yoshida Rivers; (b) Naruse River mouth morphology.
Jmse 08 00882 g009
Figure 10. Measured water level data along Naruse and Yoshida Rivers (11 March 2011).
Jmse 08 00882 g010
Figure 11. Estimated discharge and flow velocity of Naruse and Yoshida Rivers (11 March 2011). (a) River discharge variation, and (b) flow velocity.
Jmse 08 00882 g011aJmse 08 00882 g011b
Figure 12. Comparison of maximum discharge induced by tsunami and design flood discharge of Naruse and Yoshida Rivers.
Jmse 08 00882 g012
Table 1. Measuring stations of water level along Naruse and Yoshida Rivers. The number in () refers to the distance from the river mouth.
Naruse RiverYoshida River
Nobiru (0.5 km)
Ono-Naruse (4.04 km)Ono-Yoshida (4.04 km)
Kashimadai-Naruse (8.99 km)Kashimadai-Yoshida (8.99 km)
Takeya (17.24 km)Hataya (13.6 km)
Publisher’s Note: MDPI stays neutral with regard to jurisdictional claims in published maps and institutional affiliations.

