Article

Study on an Oscillating Water Column Wave Power Converter Installed in an Offshore Jacket Foundation for Wind-Turbine System Part I: Open Sea Wave Energy Converting Efficiency

Department of Marine Environment and Engineering, National Sun Yat-sen University, Kaohsiung 804, Taiwan
*
Author to whom correspondence should be addressed.
J. Mar. Sci. Eng. 2021, 9(2), 133; https://0-doi-org.brum.beds.ac.uk/10.3390/jmse9020133
Submission received: 3 January 2021 / Revised: 23 January 2021 / Accepted: 25 January 2021 / Published: 28 January 2021
(This article belongs to the Special Issue Waves and Ocean Structures)

Abstract

:
This study is focused on the wave energy converter of an oscillating water column (OWC) system that is integrated with a jacket type infrastructure applied for an offshore wind turbine system. In this way, electricity generation by both wind power and wave power can be conducted simultaneously to maximize the utilization of sustainable energy. A numerical analysis was performed in this research to model and simulate the airflow response and evaluate the converting efficiency of wave energy from an OWC system integrated with an offshore template structural system. The performance of the system including the generating airflow velocity, air-pressure in the chamber, generating power and then the converting efficiency of power from waves are all analyzed and discussed in terms of the variations of the OWC system’s geometrical parameters. The parameters under consideration include the exhale orifice-area of airflow, gate-openings of inflow water and the submerged chamber depth. It is found that from the analytical results the performance of the OWC wave energy converter is influenced by the dimensional parameters along with the design conditions of the local environment. After a careful design based on the in-situ conditions including water depth and wave parameters, an open OWC system can be successfully applied to the template structure of offshore wind power infrastructure as a secondary generating system for the multi-purpose utilization of the structure.

1. Introduction

The intensive development in the high technology industry and the over- consumption of products such as clothes, shoes and electronic devices demands more power supply for industries than ever. Besides the requirements from the industries, the supply of power required for a more comfortable civil life has also increased massively, mainly in newly developed countries. Unfortunately, most electricity power is generated from combustion power plants and the large amounts of carbon dioxide discharged into the air inevitably cause many environmental problems. Those environmental problems not only pollute people’s normal life and affect their health but moreover, eventually lead to dramatic climate change, which has been evidenced and discussed by many studies [1,2]. Therefore, alternative power production from natural resources such as solar energy, wind energy, ocean energy or other forms of non-fossil combustion energy that do not cause environmental impact must be considered.
Ocean energy has been studied as a massive power source for a long time. Among all kinds of ocean energy, wave energy is the one being studied most thoroughly because it is well distributed in the oceans around the world and the energy is abundant. Devices for the exploitation of wave energy have been extensively studied, among which oscillating water column (OWC) wave energy converting systems are ones with relatively higher efficiency.
To date studies on OWC type wave energy converting systems are still in a very active status. Some focus on the improvement of the mechanism of energy harvesting such how as to change the shape of traditional OWC system into a U-OWC [3,4] or a so called backward bent duct buoy OWC (BBDB-OWC) by using a backward-bent duct buoy [5] or by applying a double-chamber to improve the energy harvest ability in the deep water [6] or how to bend the front wall of the chamber to study its influence on the energy conversion [7]. Research focused on the efficiency of turbine performance for outflow and inflow motions is also performed [8] while a similar study released recently [9] is also for a turbine system, where an axial-flow impulse turbine was installed on an OWC model to replace the traditional one and a model was built and placed in a wave flume for the experimental tests under regular wave conditions. Investigations on the wave-height and power taking-off damping effect were carried out experimentally and numerically [10]. Some are focused on the performance of the air-chamber [11], where the effect of neglecting the air compressibility has been studied that an experimental test model scaled down to 1/50 may result in an overestimation up to 15% for the air pressure in the OWC chamber. It points out that for a scaled-down model tested in experimental laboratory, attention must be paid while a full scaled model test will be more realistic.
Mostly of the mentioned studies on OWC wave energy converting systems are focused on systems located close to a shoreline with acting waves, where incident waves will propagate right into the air-chamber of the OWC wave energy converter and react inside the chamber. In this way the wave energy is easier to capture and larger converting efficiencies may be achieved. Only very rare studies have examined OWC wave energy converters situated in an open sea environment. When an OWC wave energy converter is installed in open sea conditions, because the waves will mostly bypass the structure, the energy that can be captured from the incident waves will usually, be much less than a with a system situated by the shoreline. On the other hand, trying to improve the energy capture capability by expanding the size of the facility or installing additional devices may induce severe strains on the main structure where the OWC device is situated. Therefore, there is a dilemma for an open sea OWC wave energy converting system: building an OWC wave energy converting system in open sea that may have high energy converting efficiency comparable to that of a system situated on the shoreline will cost a fortune and yet the durability is still a major concern.
As published lately [12], an OWC wave energy converting system integrated with the column of a jacket platform was studied. In that study the OWC was installed in one of the legs of the jacket structure and a theoretical analysis using an ANSYS finite element model was applied to the proposed OWC energy converter to determine the parameters. It was found that the integrated device had certain effectiveness and feasibility. Another study is an application of an OWC wave energy converting system to buoys for sensors [13]. The analysis revealed that these self-powered sensor buoys are able to provide the required power output for the considered wave climate. It also concluded that the power absorption capacity of these small diameter (less than 25 cm) buoys is rather low when compared with the expected electrical power output of a larger diameter buoy, which is designed for electrical grid supply. The case of OWC installed on a buoy [13] is on a floating structure as some other similar applications on the floating structures were also presented [14,15], of which the behavior will not be able to apply to the OWC installed on a fixed offshore structure. Therefore, some interesting issues are: how will the OWC perform for a device similarly situating in open sea but with much larger diameter and fixed stiff legs on the seabed? How would the main structure respond when it is attached with an additional OWC wave energy converting device in an open sea conditions? Some new studies on so-called “hybrid wind-wave energy converters” (or HWWECs) applied to jacket structures are the ones that led to the innovative idea to integrate the wind-turbine offshore template infrastructure with an OWC wave energy converter [16,17]. Both a mathematical model analysis and a scaled-down experimental study were carried out for the study of the HWWEC system. Since these studies are pioneers in the study of an OWC wave energy converter situated in open sea, the data obtained in the research are valuable.
Similarly, in this study an OWC wave energy converting system which is integrated with an offshore jacket platform is studied. The purposes of this study will focus not only on the effectiveness of the OWC system in open sea, which will be treated as an extra bonus for the cost to build the OWC device can be limited but also on the responses of the main structure after wave energy has been captured by the added OWC device. The OWC wave energy converting system studied here will be built right in the space among the legs of an offshore jacket structure instead of on the legs. In this way the air-chamber can be enlarged so that a small ratio between the outlet orifice and the water surface contained in the chamber, an essential parameter for the OWC device, can be achieved. Avoiding installing an OWC device around the legs of the template structure [12] may have other advantages such as reducing the turbulence and additional vibration caused by the OWC on the legs, which are the main structural members. As the first part of the research, this study will focus on the conversion efficiency of the OWC device installed on the offshore template structure.
As presented in a recent study [18,19,20], the parameters for the application of a conventional OWC wave energy converting system to the caisson breakwater through upgrading on the safety and function of the caisson-based system were examined. Parameters examined in that study include the dimensions of the OWC chamber such as the orifice of the air-chamber allowing airflow in/output, the chamber length along the direction of incident wave, the size of the opening gate for incident waves and the submerged depth of the air-chamber. All of those parameters are presented in dimensionless form, while wave-height and period of waves are considered in a range of variations. Similarly, parameters to be examined in the study for the performing efficiency of the OWC wave converter integrated in the offshore template structure will include the variations of the orifice, the size of the air-chamber in terms of its height and the openings of the gate facing the incident waves. In addition to those parameters the shape of the air-chamber will also be investigated.
The analysis in this study will focus on the conversion efficiency of the OWC wave energy converting system installed on an offshore template structure that includes the airflow velocity from the air-chamber, the pneumatic power and the converting efficiency in terms of a ratio between the pneumatic power and the energy of incident waves. Parameters to be examined in this study include the dimensions of the OWC chamber such as the orifice of the air-chamber allowing airflow in/output, the size of the opening gate for incident waves and the submerged depth of the air-chamber in terms of the height of the chamber. All of these parameters are presented in dimensionless form, while wave-height and period of waves in annual bases for certain site of the installation are considered.

2. Analytical Model and Environmental Forces

2.1. Analytical Model of the Structure

In this study, a typical template or jacket type structure for the offshore wind-turbine foundation located in water deeper than 30.0 m is designed with the installation of accommodated OWC system. As shown in Figure 1, it is a schematic 3-D view of the jacket type structure associated with an OWC wave energy converting system, where the front side of the air-chamber will allow a square gate if necessary. This offshore jacket type of infrastructure for the wind-power station is adapted from a preliminary design of Taipower from Taiwan, which is designed to locate a wind-turbine of 4–6 MW electricity power capacity for annual average wind-speed while the structure is based on a design-wave condition for a storm of 50 years return period at the proposed location.
The feasibility assessment of the generator system has taken into considerations of geographical characteristics such as seabed situation, wind, wave, current and other environmental conditions. Therefore, this study will focus on the associated OWC wave energy converting effect. The dimension of the prototype OWC chamber will basically follow the internal space of the frame of the template structure so that the side walls of the chamber are 12 m wide while the height of the wall is a variable. Mainly, the position of top ceiling of the OWC chamber is decided first, which is at a level 7.0 m above the water and then the height of the wall is varied from 15 m to 21 m (8–14 m submerged depth), a ratio of 0.5 to 0.7 to the water depth.
Figure 2 shows the side-view of the jacket type structure. Dimensions for the structure and the size of structural members are also shown in the figure, where the height of the offshore template infrastructure is 43.0 m above the seabed and width of a square platform is 14.0 m. The diameters of the cylinder members are: 2.0 m for the vertical members and the top frames, 0.9 m for the inclined members and 0.8 m for the horizontal members.

2.2. Analytical Methods and Environmental Conditions

The theorem applied in this study includes two parts. The first part is for the calculation of the fluid and wave motions and their influence to the airflow in the OWC chamber such as the velocity of the airflow through the opening orifice. The second part is about the estimation of the efficiency of the power converted from wave-energy of an OWC system to pneumatic power that can drive a turbine generator installed on the OWC system, of which the related theorem has been presented previously [18].

2.2.1. Basic Theorems for Fluid

In this study a theorem of unsteady Navier-Stokes Equations [21,22] in conservation form consisting of continuity equations, equation of momentums and equation of turbulence dynamics for fluid with density ρ and velocity U are applied and shown as follows.
Continuity equation:
ρ t + · ( ρ U ) = 0
Equation of momentum:
ρ U t + · ( ρ U × U ) · ( μ e f f U ) = · p + · ( μ e f f U ) T + B
where B is the sum of body force, μ eff is the effective viscosity, p is the revised pressure. The effective viscosity and the revised pressure can be presented as:
μ e f f = μ t + μ
p = p + 2 3 ρ k
It is also noticed that μ t is the viscosity of the turbulence, which according to the assumption of k-ε model, is related to the dynamic energy and the dissipation of the dynamic energy as presented as:
μ t = C μ ρ k 2 ε
where k, are obtained directly from the equation of dynamic energy and equation of energy dissipation presented as follows:
( ρ k ) t + · ( ρ U k ) = · [ ( μ + μ t σ k ) k ] + P k ρ ε
( ρ ε ) t + · ( ρ U ε ) = · [ ( μ + μ t σ ε ) ε ] + ε k ( C ε 1 P k C ε 2 ρ ε )
where C ε 1 , C ε 2 , σ k , σ ε are constant parameters while P k is related to viscosity and floating force and can be presented as:
P k = μ t U · ( U + U T ) 2 3 · U ( 3 μ t · U + ρ k ) + P k b
The numerical simulation method of this study uses ANSYS CFX to simulate the performance of the air flow field in the air chamber, and the turbulence model uses the k-ε model. It is assumed that the structure itself does not move by other forces, and only consider the movement of the fluid and the air flow field, especially for the air motions influenced by the waves in the air-chamber of the OWC system.

2.2.2. Calculation for Pneumatic Powers

The pneumatic power for the air flow inward and outward the chamber is obtained from the kinetic work shown in Equation (9). The pneumatic power presented as Ea from the airflow with density ρ a and velocity v a through a cross-section area A a with a wave-period T can be presented as:
E a = 1 2 m v a 2 = 1 2 ρ a A a v a 3 · T

2.3. Numerical Process Applied to the Analysis

The numerical process applied in this study as indicated is based on the unsteady Navier-Stokes equations theorem in conservation form as presented in the previous section. The verification of this numerical process has been carried out and compared with an experimental data [18,19] from an on-field study, a full size OWC wave energy converter situated at Sakeda (Japan) led by Goda, a pioneering researcher in the field [23,24]. In the study for the verification of the numerical method, the comparisons were made for the variations of both water elevation and pressures in the chamber of a full size OWC wave energy converter. It is noticed from the comparison that the analytical results are in very good match with experimental data in general. Therefore, it is confident that this numerical tool may appropriately describe the behavior of an OWC wave converting device integrated into an offshore template structural system.
Presented as following steps are the numerical analysis process along with the boundary conditions:
  • Step 1: Establishing the model geometry according to the analytical object.
For the proposed OWC wave converting device integrated into an offshore template structural system, the model geometry was constructed for the water-body with open surface-field implemented along with the structure.
  • Step 2: Meshing and re-meshing the model if needed after a pre-analysis.
To implement meshes of the analytical model, both the fluid body and the offshore template structure under study are segregated into small elements that can appropriately describe the properties and behavior of the body.
  • Step 3: Setting the boundary conditions based on the analytical environment.
Figure 3 shows a schematic view of the boundary conditions. On the left hand side is the inlet boundary allowing the input of incident waves. In the numerical analysis, a piston-type wave maker method was applied to produce incident waves [25]. The seabed is impermeable condition for fluid like a wall while a free surface between the water and air was applied at the interlayer. The open area is on the top boundary for the air except for the air in the chamber that is confined depending on the variation of the chamber-geometry. At the right hand side it is an outlet boundary allowing the dissipation of the waves propagating away. For the side-condition of analytical domain a symmetrical condition is presumed. The symmetry conditions is not like a wall boundary condition, which is a “non-slip” condition in which it assumes the velocity at the wall is zero no matter what wall roughness value is applied. While the “slip” boundary (slip/symmetry boundary) would allow the flow to move along the boundary, it means that the velocity at the slip/symmetry boundary is not zero.
  • Step 4: Performing the analysis.
The analysis will include several pre-analyses in order to adjust the solution quality. A re-mesh will also be performed if the solution does not converge based on the convergence condition. In order to match the convergence requirement in this study that the RMS (root mean square) of residuals for all solutions must be less than 1.0 × 10⁻⁴, the numbers of nodes and elements applied in this study based on the shape of the air-chamber are varied from 1,286,110–1,244,131 and 1,608,690–1,675,950. Therefore, the running time of computation for each case will be around 72 h in a computer with CPU of eight cores/16 threads.
The incident wave is assumed to propagate in the direction normal to the front face of the jacket structure. The exerting pressure on the jacket structure then can be calculated based on the properties of the wave conditions for the normal operation of the wind-turbine system. The reference site for this study was selected at 10 km off Changhua, west coast of Taiwan Strait, with a water depth of 30 m. The applied wave conditions, unlike the ones for the structural safety design purposes, are based on the local annual average wave statistics. The wave height (H) is 1.5 m, the wave period (T) is 7.5 s, and the corresponding wave length (L) is 84.51 m. The on-field data are also from the preliminary design data of Tai-power.

3. Dimensional Parameters Applied to the Study

3.1. Various Roof Shapes of the Air-Chamber

Before the study for dimensional parameters applied to the OWC wave energy converter, the shape of the air-chamber was examined first. Under conditions of the space allowed in the template type offshore structure for the installation of an OWC wave energy converter, a cubic box with various shapes of roof was taken into consideration. Since the roof is the location for the in/outlet of the compressed air, the efficiency of the energy converted from the captured wave energy in the chamber may be influenced by the shape of the air-chamber. As presented in Figure 4, three air-chambers located in the template structure with various shapes of roof were considered. The first one has a quadrilateral triangle shape cap direct from the bottom of the chamber and the second one also has a quadrilateral triangle cap but from the middle part of the chamber-box while the third one maintains as a cubic box. All of them have the same size of in/outlet orifice on the apex of the roof.

3.2. Dimensional Parameters to Be Examine

The parameters chosen in the analysis basically are related to the dimension of the air-chamber for the OWC converter situating on an offshore template structure. Parameters considered include area ratio between the opening of orifice A and the water surface Aw in the chamber presented as RA = A/Aw, the ratio of the open-gate O in the front side facing the incident wave to the chamber height Z presented as RO = O/Z and the ratio of chamber height of OWC converter to the water depth h presented as RZ = Z/h under a condition that during the operation even in a low water level the whole device is submerged in the water.
Figure 5a–c present schematic drawings of the side view of the OWC converter installed in an offshore template structure, where parameters such as the ratio of orifice area RA, ratio of chamber height Rz and ratio of the front gate opening Ro are correspondingly presented in Figure 5a–c. The dimensions of the device related to parameters to be examined are all marked in the figure and shown in variables as A, O and Z. A table for the variation of these parameters is presented in Table 1. It is noted that because too many parameters are to be analyzed when one parameter is a variable the other parameters will be set as constant. Such a referenced model is set as: RA = 0.4% (A = 144 m2), RO = 0% and RZ = 50%, where they are shown in bold letters in the table.
During the analysis, responses of the OWC system for the converting efficiency to be discussed include the velocity of the airflow through the orifice, the air pressure, the power produced by the airflow and the converting efficiency in terms of the ratio of pneumatic power and power of incident waves. Comparisons of these responses corresponding to the given wave conditions are presented and discussed in the following sections in terms of the parameters of area-ratio of orifice opening RA, opening ratio of OWC gate to the height of the chamber Ro and the ratio of the height of the air chamber to water depth Rz.

4. Numerical Results and Discussion

During the analysis the variation of the air-flow in the chamber can be obtained. Presented in Figure 6 is the water-flow around and through the template structure. It shows that the turbulence is small but, if the dimensions of the structure are larger than 1/5 wavelength, the diffraction effect must be considered as the analysis performed for the large-size tension-leg platform [26,27]. The other factor is that the applied waves based on local environmental conditions are quite small in terms of the wave-height and length. Presented in Figure 7 is the typical variation of air-flow in the chamber, where the flow presented in a vector form can be observed clearly. As shown in the figure, the strongest velocity of the air-flow concentrates in the central space of the chamber along with the vertical line of the orifice while near the orifice in the upper part of the air-chamber a significant vortex response can be observed. Along with the time the variations of the air-flow can also be observed. As is shown in Figure 8, an obvious alternately inward and outward flow of the air are presented along with the time variations. By following the time history of the flow-motions shown in the figures, the inward/outward motions of air-flow are in a period pattern along with the wave heaving motion. It also shows that the outward velocity is larger than the inward velocity. This is due to the effect that when the air flows inward it may encounter the water surface inside the chamber and affect the velocity.

4.1. Responses Corresponding to Various Shapes of the Air-Chamber

When the conditions such as the opening ratio of the in/outlet orifice, the ratio of opening gate and the ratio of submerged depth are set as a constant as RA = 0.4%, RO = 0.5%, and Rz = 0, the speeds of the air-flow from the orifice for three types of shape of the air-chamber are presented in Figure 9a–c corresponding to various shapes of the chamber. It is noticed that the velocity of outflow and inflow are both presented positively, which are taken as a spatial average across the orifice area. The maximum velocity is 51.4 m/s, 52.1 m/s and 71.8 m/s corresponding to three types of chamber roof, namely, quadrilateral triangle, semi-quadrilateral triangle and cubic shape. The average velocities corresponding to these three types of chamber-shape are 39.2, 46.1 and 59.1 m/s. It shows that for maximum velocity of the air-flow from the orifice, there is not much difference between the first two types of chamber-shape but for the last type the cubic one, the maximum velocity can reach a value higher than the other two by 38%. The average velocity from the orifice of the cubic type of air-chamber is 28% higher than that from the semi-quadrilateral triangle type and 50% higher than that from the quadrilateral triangle type of air-chamber. Therefore, it was recommended that the chamber shape for the OWC wave energy converter installed on the offshore template structure under study will be a typical cubic box with in-outlet orifice on the apex of the chamber. Except for the shape, the dimensions for the orifice area and height of the chamber and additional opening of front gate will be discussed in the following sections.

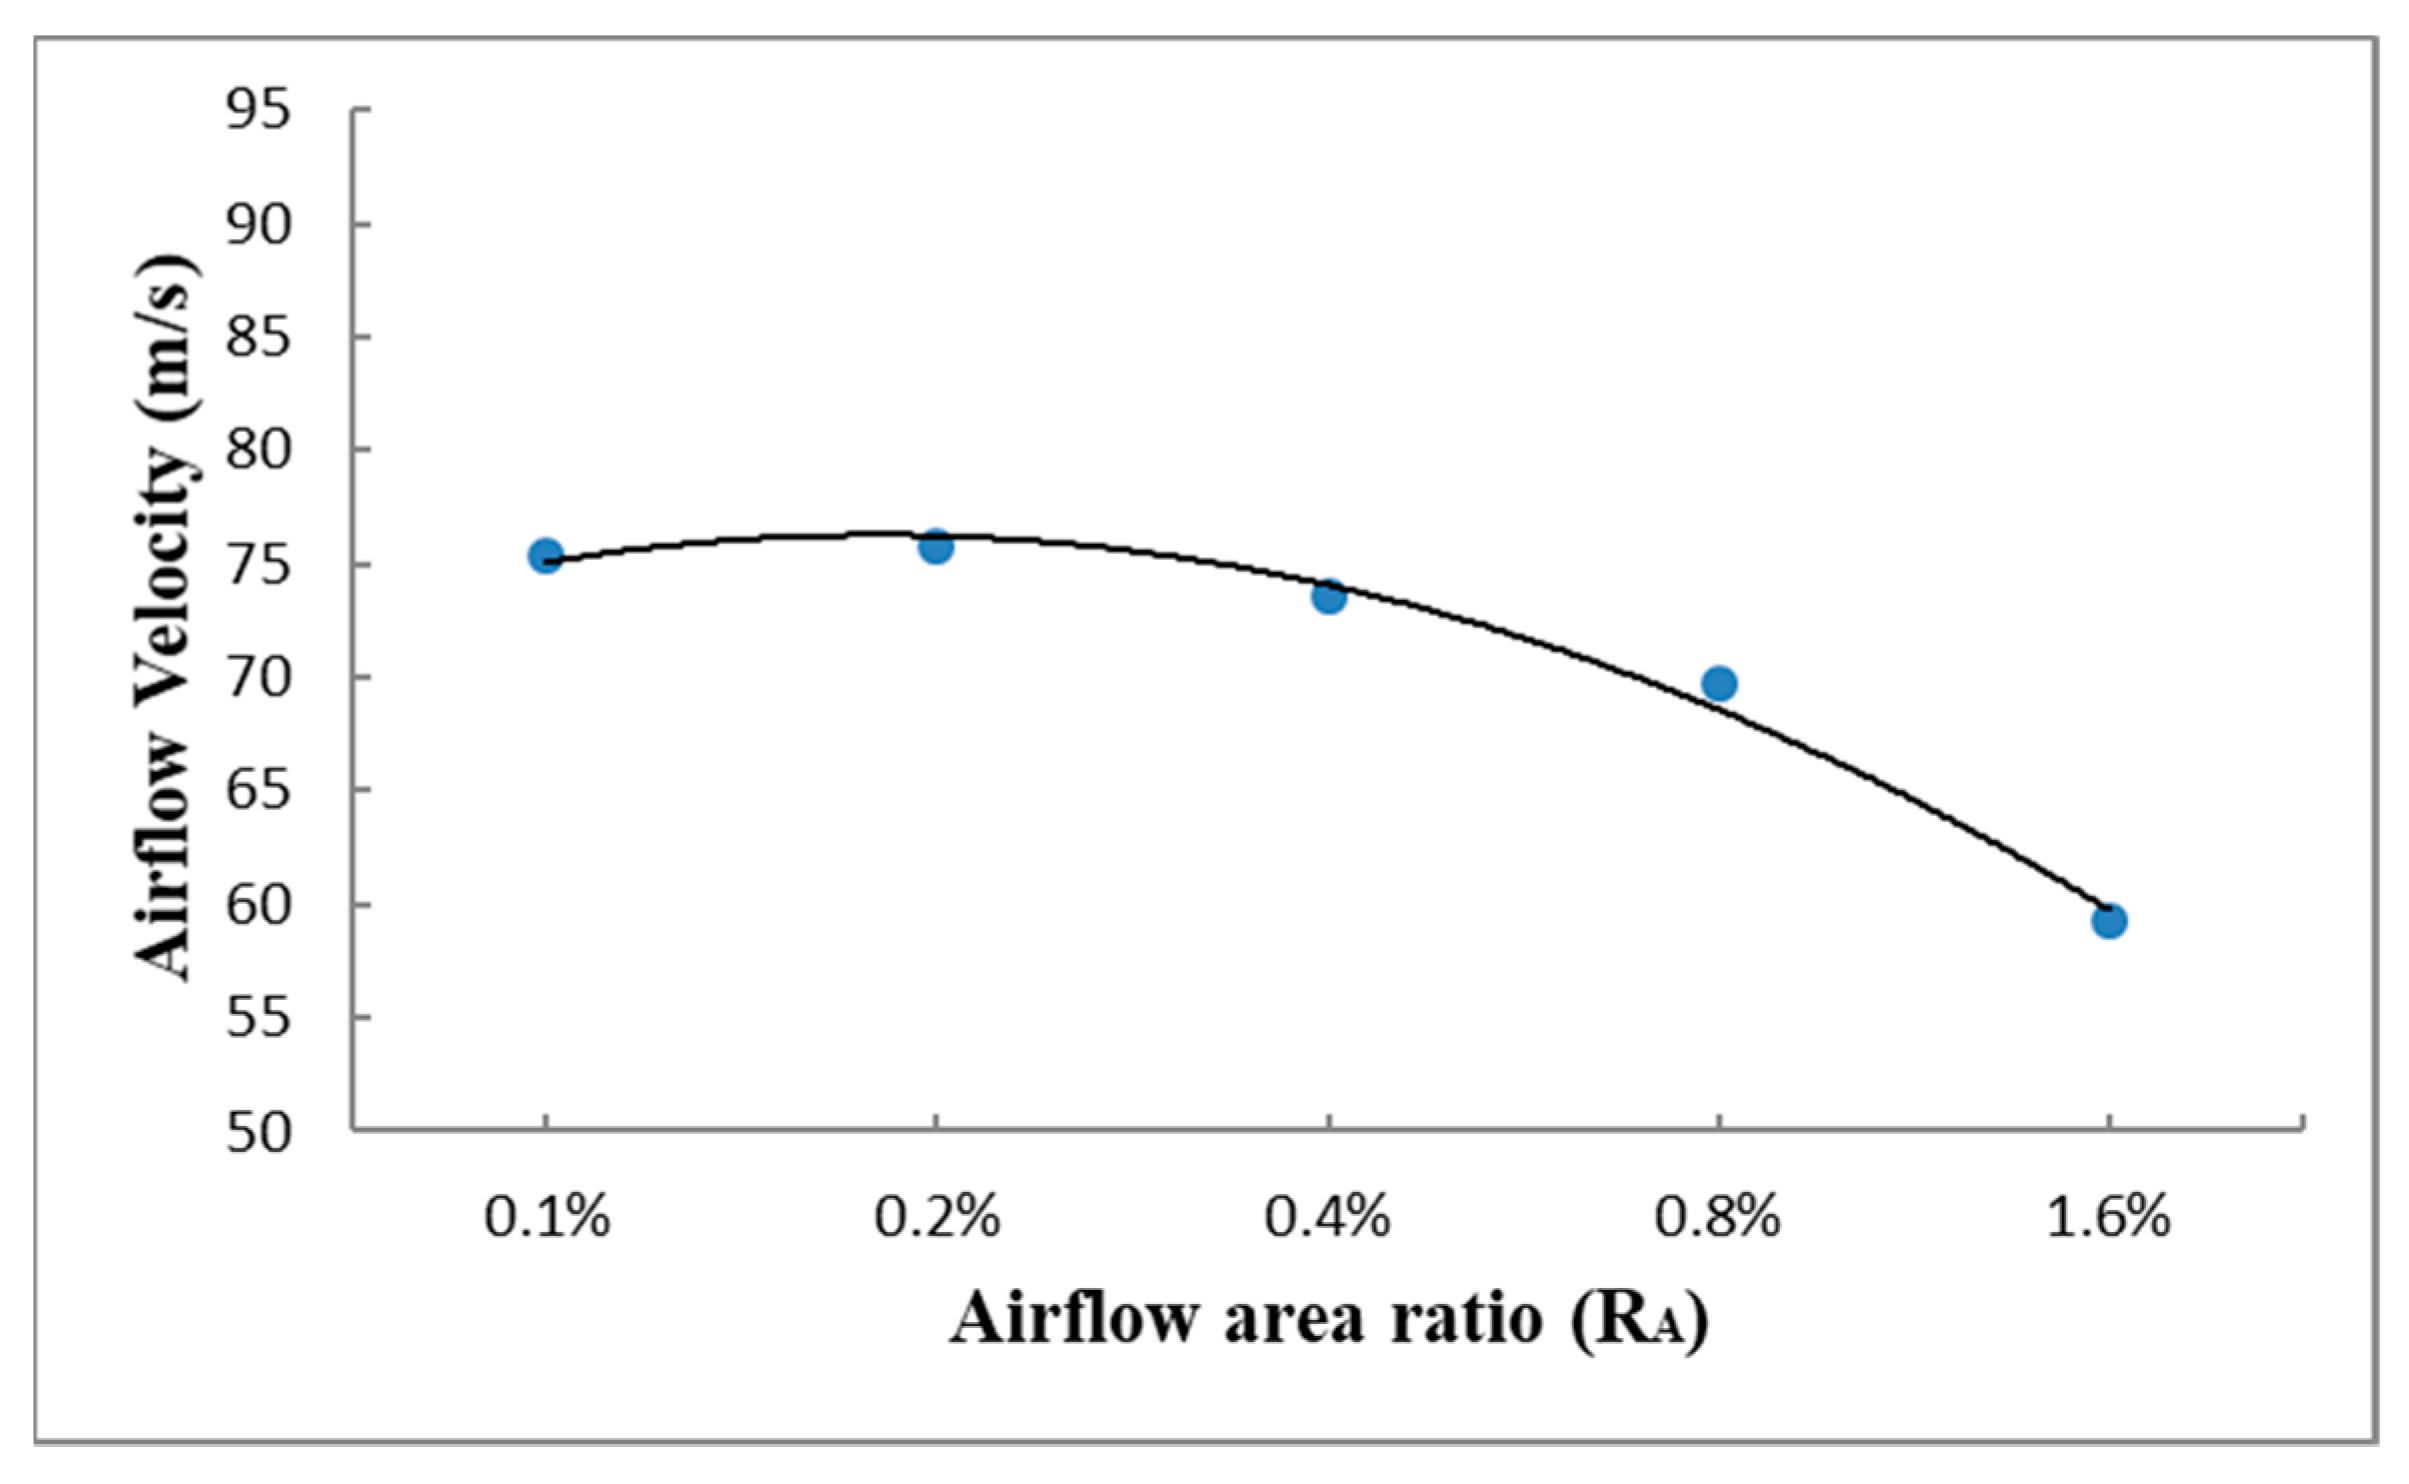
4.2. Responses Corresponding to Area-Ratio RA of Orifice

The area-ratio of the orifice cross-section of OWC will have influence on the performance of an OWC converting system. Therefore, taking into consideration in this subsection is a dimensionless ratio of area of the OWC orifice cross-section to the area of water surface in the chamber as was indicated as RA and listed in Table 1. Since the area of water surface confined in the chamber is a constant while the cross-section of the orifice is variable, the ratio RA is ranged from 0.1% to 1.6%.

4.2.1. Velocity of Airflow from the OWC

The velocity presented in Figure 10 is the average of first 1/3 maximum (significant) velocity of each time-history analysis corresponding to the area ratio of orifice cross-section RA. It is observed that corresponding to the increase of the opening ratio RA, the airflow velocity decreases nonlinearly. The airflow velocity drops slowly at the early stage corresponding to the area-increment of orifice opening and then decreases fast after the opening ratio of the orifice area RA is larger than 0.8%. When the opening-ratio RA increases to 1.6%, the airflow velocity is reduced to 60 m/s.

4.2.2. Air-Pressure from the OWC

Presented in Figure 11 is the average of 1/3 maximum (significant) air-pressure corresponding to various area-ratios of orifice of the OWC converter. It is observed that corresponding to the increase of ratio of the orifice opening, the air-pressure will remain at a high level till it reaches certain value and then drops rapidly. When the cross sectional area of the orifice to the area of water surface in OWC chamber is smaller than 0.4%, the air-pressure remain in a stable value larger than 4566 Pa. Similar to the velocity response, the air-pressure will decrease in a higher rate corresponding to the area-increment of orifice opening when the opening-ratio is larger than 0.8%. Moreover, the air-pressure can reach a value over 4500 Pa for most cases.

4.2.3. Pneumatic Power from the OWC

Presented in Figure 12 is the average of 1/3 maximum (significant) pneumatic power corresponding to various area-ratios of orifice of the OWC converter. It is observed that corresponding to the increase of ratio of the orifice opening the pneumatic power will slightly increases till it reaches a peak value in the lower ratio of the orifice area and then decreases nonlinearly. The ratio corresponding to the peak of pneumatic power is 0.2% for the cross-sectional area of the orifice to the area of water surface in OWC chamber. Similar to the velocity response, the pneumatic power will decrease in a higher rate corresponding to the area-increment of orifice opening when the opening-ratio is larger than 0.8%. The pneumatic power of the OWC wave energy converter can reach a value larger than 250 kW for most cases.

4.2.4. Efficiency of Power Converted from the OWC

For the examination of efficiency of power converted from wave-energy of an OWC system to pneumatic power that can drive a turbine generator, an estimation for the ratio between energy induced by airflow and produced from incident waves is applied [18]. As presented in Figure 13 is the average of 1/3 maximum (significant) pneumatic power corresponding to various area-ratios of orifice of the OWC converter. It is observed that corresponding to the increase of the opening ratio, the converting-efficiency of OWC decreases. The converting-efficiency stays at a high level first and then drops fast at the area-ratio approaches 0.8%. Basically after the opening-ratio increases to 0.8%, the efficiency of power converted is reduced to 10%. It is also found that the converting efficiency from the OWC system installed in an offshore template structure is only slightly over 10% for most cases without an additional opening of the front gate.

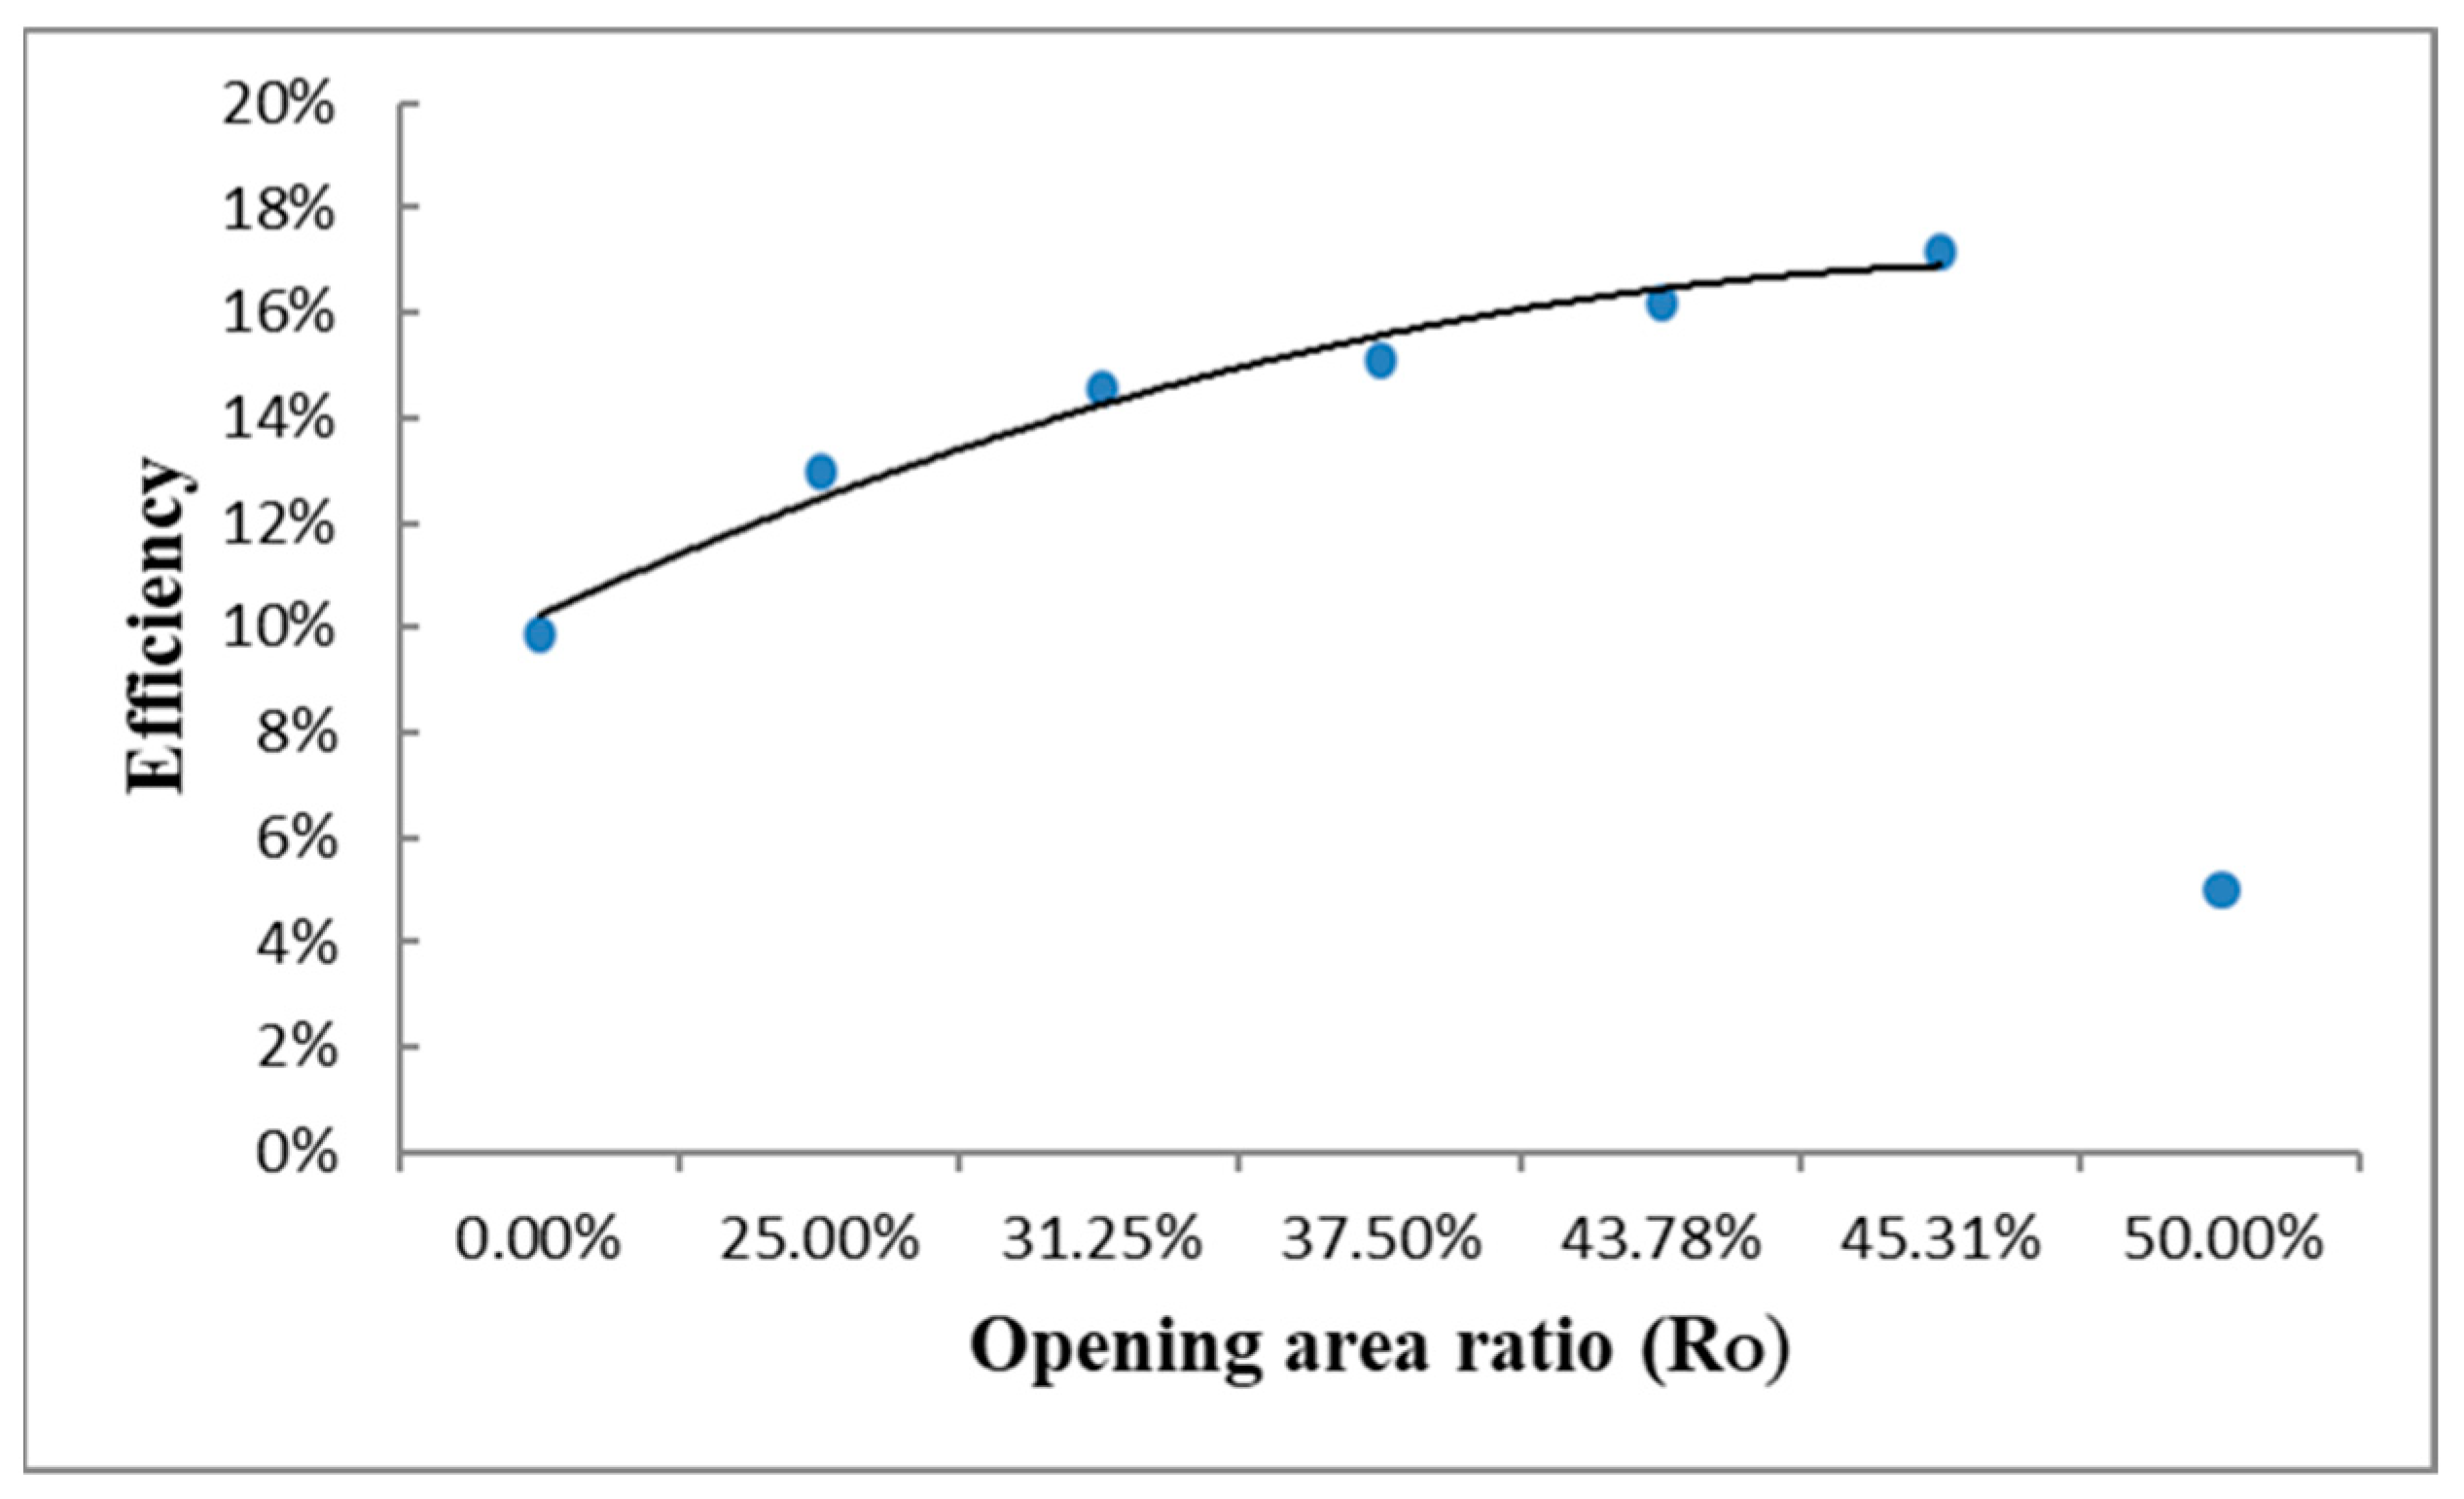
4.3. Responses Corresponding to Opening-Ratio of OWC Gate RO

Considering the prevailing direction of waves, adding an opening gate to the original chamber is expected to capture more energy from the incident waves and upgrade its energy conversion efficiency. However, if the wave direction changed and is not aligned with the opening gate, it will be an issue that can be studied in a future study. The opening of the OWC gate is set as a ratio of the gate-opening to the height of the chamber for the OWC converter as indicated as O/Z = RO in Figure 6. The height of the chamber of the OWC converter is a constant of 15-m while the opening-ratio of the gate is a variable as presented in Table 1 ranged from 0% to 50%.

4.3.1. Velocity of Airflow from the OWC

Presented in Figure 14 is the average of first 1/3 maximum velocity of airflow for various ratios of gate-opening of the OWC converter to the chamber height. It is observed that corresponding to the increase of the opening-ratio of the air chamber gate, the airflow velocity increases until it reaches the ultimate value. The maximum average velocity of the airflow found from the orifice is 88.24 m/s when the opening ratio is 45.31% as set in this study. It is also noticed that for the largest opening ratio of the gate when it is 50%, corresponding to which the air-velocity drops suddenly to less than 60 m/s. For the gate opened by 50% of the height of chamber, it means that the submerged part of the chamber is 0.5 m. During the heaving motion of the waves the gate may be over part of the water surface. Once the gate opening is over the lowest water level, the velocity drops suddenly because the air chamber is wild opened then and the air is not confined in the chamber to be compressed through the orifice. Therefore, the determination of the largest value that must be corresponding to the highest water level is important and essential to the efficiency of the conversion effect.

4.3.2. Air-Pressure in the Air Chamber of the OWC

Presented in Figure 15 is the average of first 1/3 maximum air-pressure for various ratios of gate-opening of the OWC converter to the height of the air-chamber of the OWC. It is observed that corresponding to the increase of the opening-ratio of the air chamber gate, similar to the velocity responses, the air-pressure increases till it reaches an ultimate value. Only a slightly flatter slope was found for the variation of the air-pressure increment when compared to the velocity variation corresponding the increase of the opening-ratio of the gate. The maximum air-pressure found in the air-chamber 5800 Pa, but when the opening-gate is over the lowest water level the air-pressure also drops suddenly to 3783 Pa, which is reduced by about 35%.

4.3.3. Pneumatic Power from the OWC

Presented in Figure 16 is the average power of airflow in 1/3 maximum pneumatic power for various opening-ratios of OWC gate to the height of the chamber of OWC. It is observed that corresponding to the increase of opening-ratios of OWC gate the pneumatic power also increases till the ultimate peak value. The increment of the pneumatic power is in a nonlinear but stiffer slope compared to the air-pressure increment trend. The maximum power obtained corresponding to the gate-opening in this case is 480 kW when the gate-opening ratio is 45.31% to the height of the air-chamber of the OWC. However, when the opening-gate is above the lowest level of the water, the pneumatic power drops to 139 Pa, which is only 29%, less than 1/3 of the highest power that can be obtained.

4.3.4. Efficiency of Power Converted from the OWC

Presented in Figure 17 is the efficiency of power of airflow converted from the OWC for various opening-ratios of OWC gate. It is observed that corresponding to the increase of opening-ratios of OWC gate the converting efficiency of the power also increases till the ultimate peak value. The increment of the pneumatic power is also in a stiffer slope compared to the air-pressure increment trend. The maximum converting efficiency of the power obtained corresponding to the gate-opening in this case is 17.2% when the gate-opening ratio is 45.31% to the height of the air-chamber of the OWC. Compared to the case without a gate-opening, of which the converting efficiency is 9.9%, the converting efficiency obtained from a larger gate opening is much higher. As indicated in the numbers the increase of the converting efficiency can be raised by 74% from the largest opening of the gate. It is also noticed that the converting efficiency will drop dramatically if the gate opened above the lowest water level. As is shown in Figure 17, the efficiency is 5.0% for an over opened gate (RO = 50%). That is reduced by 70% compared to a case, where the gate is opened in a ratio of 45.31%, slightly over the lowest water level.
The results show that increasing the opening area can effectively increase the efficiency of wave energy conversion. As the opening area increases, the wave conversion power is also higher. When the gate-opening ratio is 0.4531, the highest average speed is 88.24 (m/s), the generated power is 480 kW, and the conversion efficiency can be calculated as 17.2%. However when the gate opened is higher than the water surface as the case that the opening ratio is 50%, the internal air will escape and fail to flow through the airflow outlet, resulting in a significant reduction in wave energy conversion efficiency. Therefore, it is recommended that the opening area ratio is 37.5–45.31% based on this study.

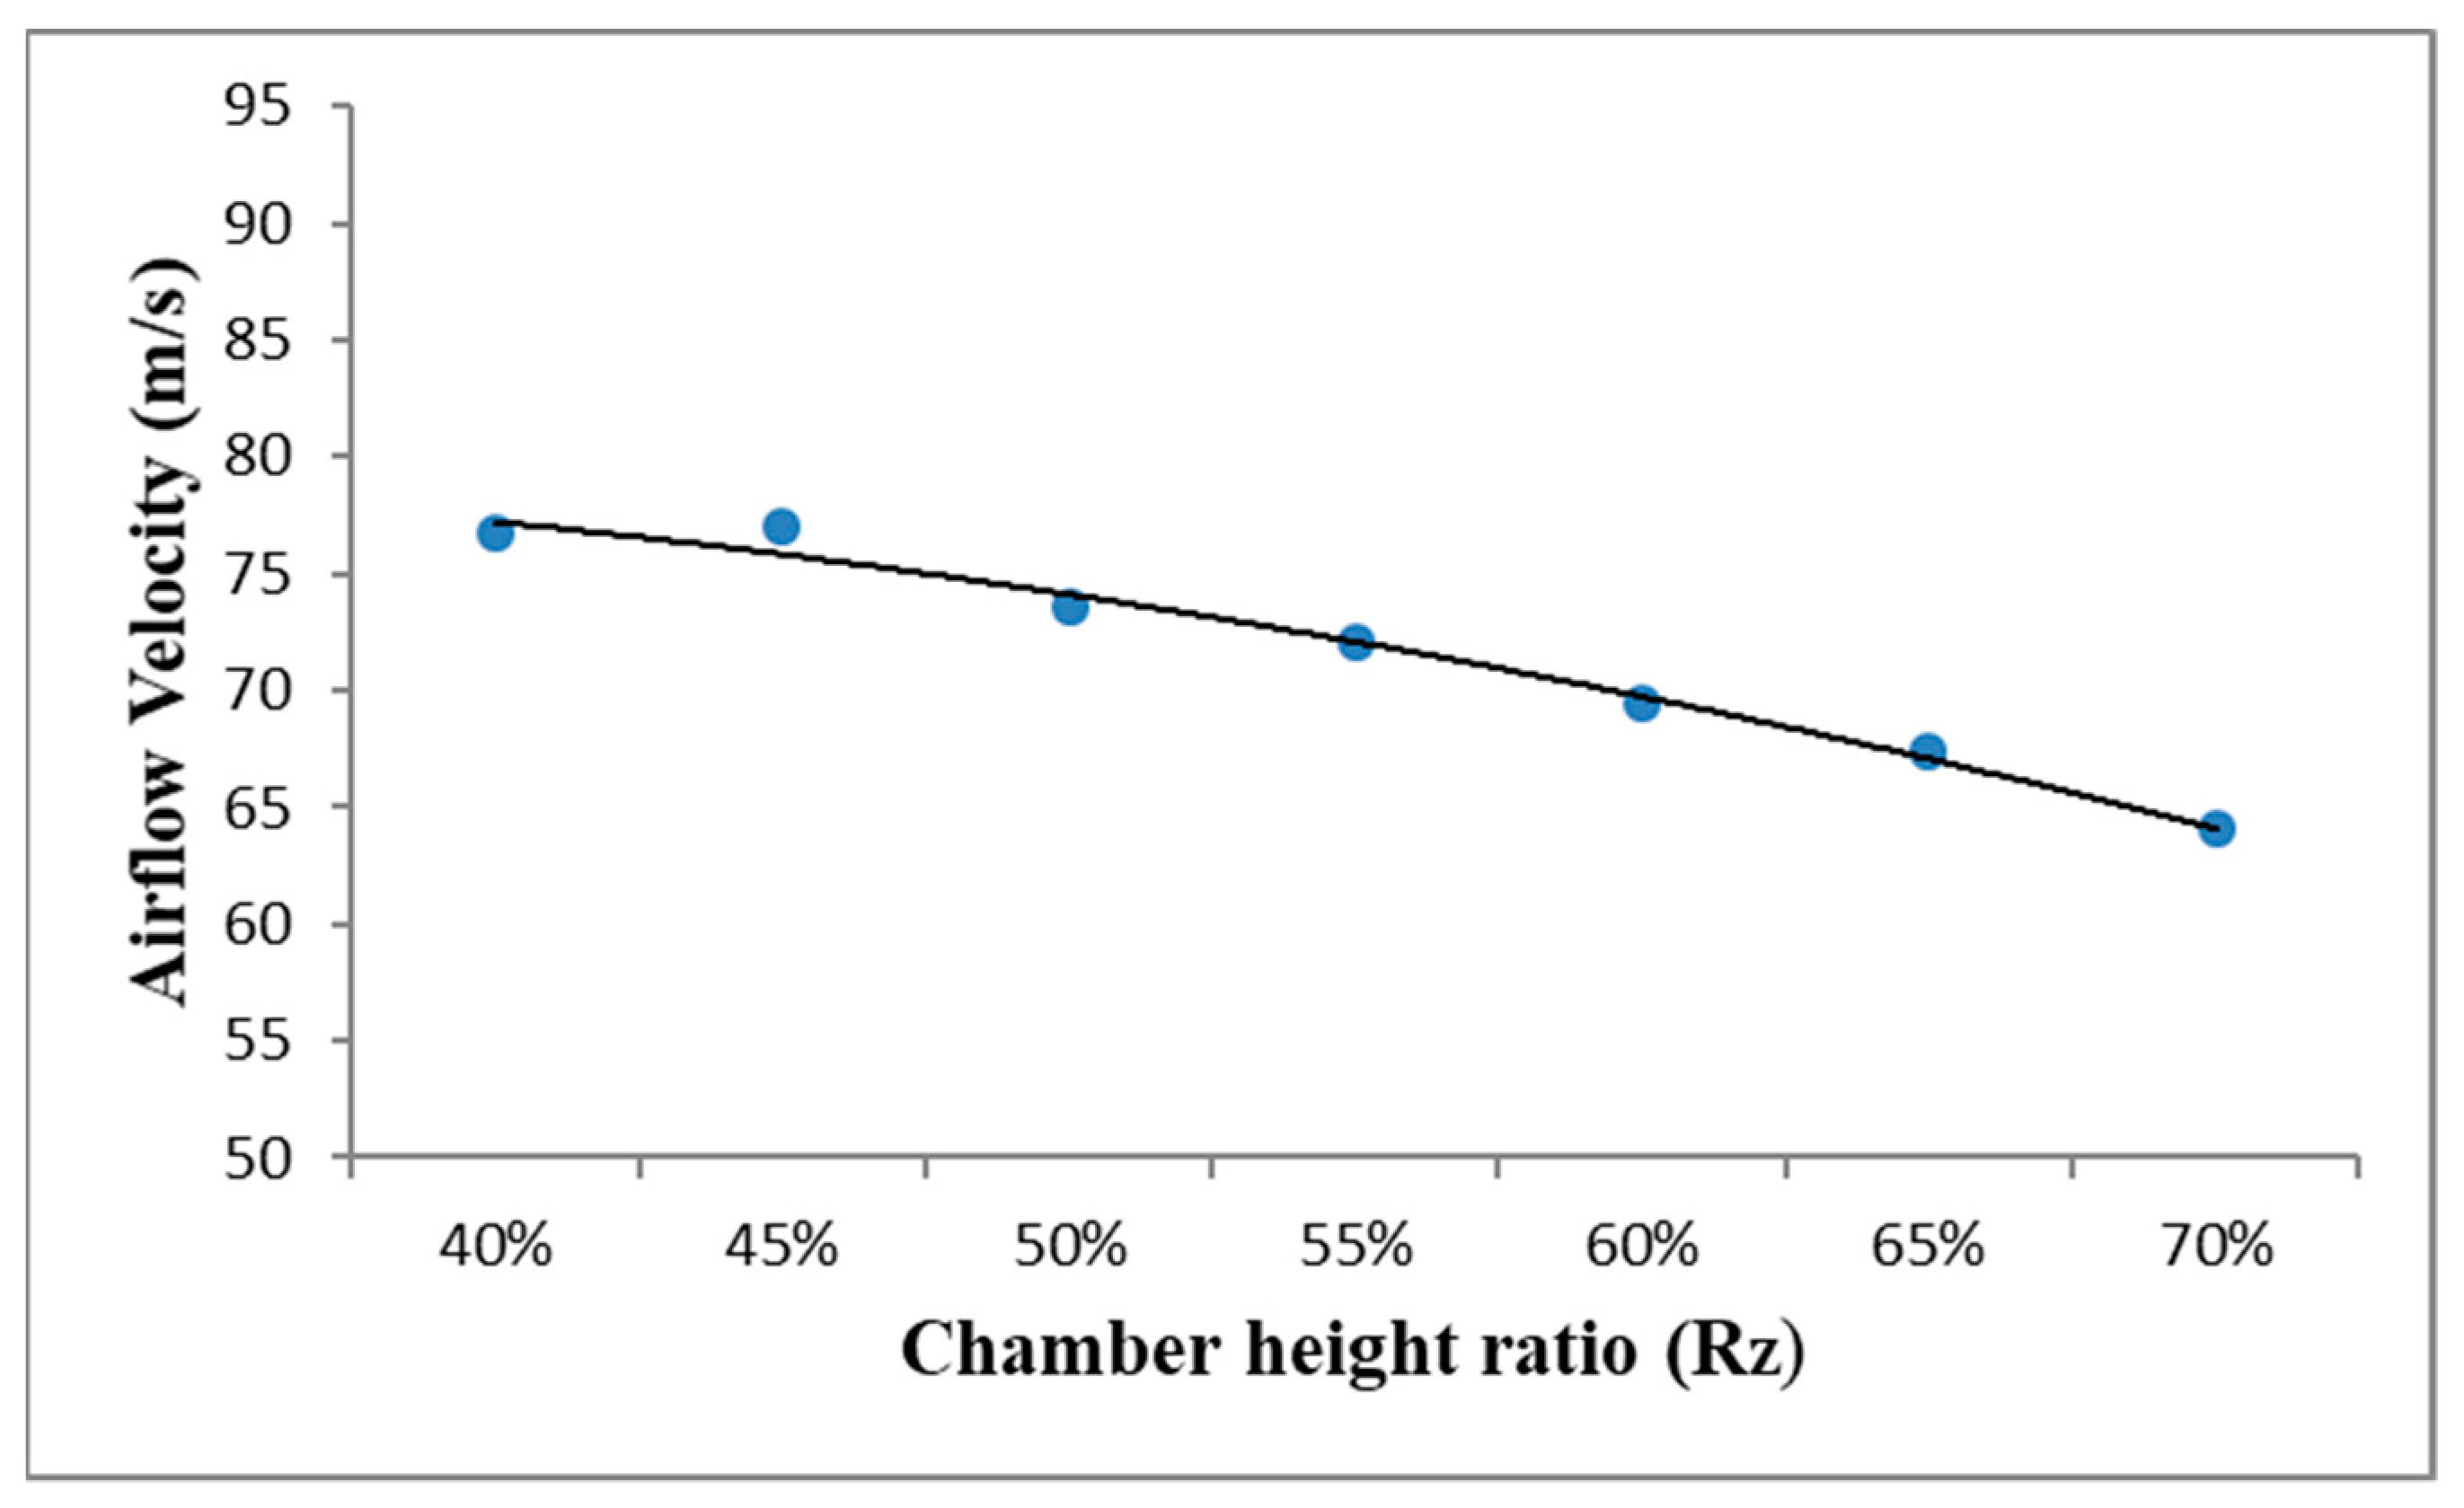
4.4. Responses Corresponding to the Ratio of Chamber-Height RZ

The submerged depth of the OWC may have influence to the performance of an OWC converting system. Therefore, taking into consideration in this section is a dimensionless ratio of chamber-height of the OWC converter to the water depth as indicated as RZ and listed in Table 1. Since the apex of the OWC chamber located at the frame of the template structure is fixed based on the sea-water level, the main variation factor is the dimension of the chamber below the water level, or the height of the chamber.

4.4.1. Velocity of Airflow from the OWC

Presented in Figure 18 is the average of 1/3 maximum (significant) velocity of airflow for various ratios RZ of the chamber-height of the OWC converter to the water depth. It is found that corresponding to the increase of the chamber-height of the OWC converter, the airflow velocity would not be influenced for the first two variations of ratio but after that it decreases almost linearly.
The maximum average velocity of the airflow is 76.97 m/s, corresponding to the ratio of chamber-height Rz = 0.45, while the second largest average velocity is 76.71 m/s, corresponding to the ratio Rz = 0.40 the smallest height of the chamber designed in the OWC converter.
Compared to the gate opened in the front wall, the reduction of the height of the whole chamber seems less effective for the energy conversion. As indicated in the second case for gate-opening that a 25% height of front wall is opened to reduce the front wall to 11.25 m high of which the velocity of air-flow is 80.38 m/s. When compared to the first case of the height-variation of the chamber that the chamber-height is 40% (Rz = 0.40) of water depth meaning that the air-chamber is 12 m high, the velocity from the gate-opening seems compatibly higher.

4.4.2. Air-Pressure in the air Chamber of the OWC

Presented in Figure 19 is the average of 1/3 maximum (significant) air-pressure for various ratios RZ of the chamber-height of the OWC converter to the water depth. It is found that corresponding to the increase of the chamber-height of the OWC converter, the air-pressure would not be significantly influenced for the first several variations of ratio and then decreases almost suddenly when the ratio Rz is larger than 0.65. As was observed in ratios of Rz = 0.40 to Rz = 0.60, the air-pressure varies from 4932 Pa to 4062 Pa, which decreases in a slow rate till Rz = 0.65. When Rz = 0.7 the air-pressure drops to 1764 Pa almost in a sudden. This suggests that for the chamber-height in a lower ratio range the influence of the ratio on the air-pressure is minor, however, if the ratio is larger than 0.65 the influence on the air-pressure can be very significant.

4.4.3. Power of Airflow from the OWC

Presented in Figure 20 is the pneumatic power corresponding to various ratios of OWC chamber height to the water depth. It is observed that in the first two ratios the pneumatic power slightly increases from 314 kW to 317 kW and then decreases corresponding to the increase of height-ratios of OWC chamber to the water depth. The pneumatic power decreases in an almost linear trend corresponding to the ratio increase of OWC height to the water depth.

4.4.4. Efficiency of Power Converted from the OWC

Presented in Figure 21 is the efficiency of power of airflow converted from the OWC for various ratios of OWC chamber height to the water-depth. It is found that a pattern similar to the pneumatic power is presented for the first two ratios of the OWC height to the water depth, where the converting efficiency is slightly increase from 11.3 to 11.4 when the ratios are increased from 0.4 to 0.45. After that the converting efficiency of the wave energy to pneumatic power decreases corresponding to the increase of the height-ratio of the OWC height to the water depth.

4.5. General Discussions on the Power Converting Efficiency

A general discussion for the power converting efficiency examined in this study will be compared to available experimental data and discussed here. Since only very few experimental studies have been performed and even for the rare one, the model type for analysis, shape, corresponding size from scaled-down to prototype and loading conditions are merely comparable, this subsection still tries to make a comparison to the very rare experimental data for the OWC wave converter integrated in an offshore template structure. The experimental data were presented in reference [16], where a scaled-down model of 1:50 for an OWC wave converter integrated in an offshore template structure was tested under regular and irregular waves to find the hydrodynamic response. As indicated, since the model and the analytical parameters are different from this study, we’ll choose the converting efficiency that based on nearly similar analytical conditions to compare and discuss.
As presented in the referred article [16], the capture width ratio (CWR) is the parameter used to evaluate the performance of the OWC sub-system. Corresponding to the wave-steepness, which is 0.017 quite small as applied to this study but was a representative in-situ condition, the performance parameters are located in a range lower than 10 except for the case that the period of the applied wave is 7 s. As comparison, the wave-period applied in this study is 7.5 s and the corresponding dimensionless damping coefficient B*, (please refer to [16]) is about 37 in terms of a similar scaled-down model so that the performance parameters obtained from the experimental data are located in the range between 5 and 10. It is found that compared to the performance parameters obtained from the experiment, the converting efficiencies of this study are in a range between 5.2 and 10.1 as indicated in Figure 13 (efficiency corresponding to area ratio of orifice cross-section). The results obtained from this study are compactible to an experimental result and quite encouraging.

5. Conclusions

In this research an OWC wave energy converting system was installed and combined to an offshore template structure for a wind turbine system as a subsystem for power generation. The theoretical results showed that though the converting efficiency in open sea conditions is not very high, it is workable and the efficiency can also be raised by 70% through addition of a front gate. Some substantial conclusions from the study are listed as follows:
  • For the variation of chamber shapes, three kinds of shape were examined for the performance of the power converting, namely, quadrilateral triangle, semi-quadrilateral triangle and cubic shape. Among these three shapes, the chamber of cubic shape has the best performance in terms of the velocity of air-flow through the out-let orifice. The average velocity from the orifice of the cubic type of air-chamber is 28% higher than that from the semi-quadrilateral triangle type and 50% higher than that from the quadrilateral triangle type of air-chamber.
  • Corresponding to the increase of the area-ratio RA of orifice-opening, the conversion-efficiency decreases. For the early stage the conversion efficiency remains 10% till the area-ratio approaches 0.8%. It is also found that the conversion efficiency from the OWC system installed in an offshore template structure is only slightly over 10% for most cases if gate opening is not allowed.
  • When gate-opening is allowed in the direction of incident waves the conversion efficiency can be greatly increased. For the case where the gate-opening ratio is 0.4531 to the height of the chamber, the generated power can reach as high as 480 kW, and the conversion efficiency is 17.2%, which represents an increase by 74% compared to the chamber without an opening in the front wall. The results show that the opening area can effectively increase the efficiency of wave conversion, but when the height of the opening area is higher than the water surface, internal air will escape, which leads to a reduction in the wave energy conversion efficiency. Therefore, it is recommended that the opening area ratio be 0.375~0.4531, based on the size of this experiment.
  • For the ratio of chamber-height RZ, since the height of chamber apex remains unchanged, the main changing factor is the underwater depth. The results show that an increase in the depth will directly reduce the outlet airflow velocity and power generation. It is recommended that the air chamber height ratio to the water depth be 0.4–0.5.
Therefore, according to this study for an OWC wave converter installed in an open sea situation, an OWC device with smaller outlet orifice and smaller height of the chamber relative to the water depth will have better performance in terms of the air-velocity and the pneumatic power converted from the wave power. Furthermore, if a gate-opening is allowed at the front side of the chamber (usually in the prevailing direction of the wave propagation), a ratio of gate-opening reaching 45% may give a great upgrade for the conversion efficiency.
It is noticed that the highest average power obtained in the system is 0.48 MW. When compared to the main structure, established for a wind turbine system of 5 MW power generation, the associated wave energy converting system may produce about 10% of the power obtained from the main system. For a sub-system, the results are quiet encouraging. However, in order to effectively increase the efficiency of ocean energy extraction and avoid negative impacts on the original structure and the environment, there are still many issues to be considered, hopefully to increase the efficiency of energy use and enhance the feasibility of sustainable development.

Author Contributions

Conceptualization, H.H.L.; methodology, H.H.L. and G.-F.C.; software, G.-F.C.; validation, G.-F.C., H.-Y.H. and H.H.L.; formal analysis, G.-F.C.; resources, H.H.L.; writing—original draft preparation, G.-F.C. and H.H.L.; writing—review and editing, H.H.L.; supervision, H.H.L.; project administration H.H.L.; funding acquisition, H.H.L. All authors have read and agreed to the published version of the manuscript.

Funding

This study has been financially supported in part by the Ministry of Science and Technology (MOST), Taiwan as indicated in the acknowledgements.

Institutional Review Board Statement

Not applicable for studies not involving humans or animals.

Informed Consent Statement

Not applicable.

Data Availability Statement

Not applicable.

Acknowledgments

This research has been financially supported in part by the Ministry of Science and Technology (MOST), Taiwan under grants “MOST 108-2221-E-110-025-MY2”.

Conflicts of Interest

The authors declare no conflict of interest.

References

  1. Rohli, R.V.; Vega, A.J. Climatology, 4th ed.; Jones & Bartlett Learning: Burlington, MA, USA, 2018; ISBN 9781284126563. [Google Scholar]
  2. Ruddiman, W.F. Earth’s Climate: Past and Future; W. H. Freeman and Company: New York, NY, USA, 2008; ISBN 9780716784906. [Google Scholar]
  3. Spanos, P.D.; Strati, F.M.; Malara, G.; Arena, F. An approach for non-linear stochastic analysis of U-shaped OWC wave energy converters. Probabilistic Eng. Mech. 2018, 54, 44–52. [Google Scholar] [CrossRef]
  4. Boccotti, P. Comparison between a U-OWC and a conventional OWC. Ocean Eng. 2005, 34, 799–805. [Google Scholar] [CrossRef]
  5. Sheng, W. Power performance of BBDB OWC wave energy converter. Renew. Energy 2019, 132, 709–722. [Google Scholar] [CrossRef]
  6. Ning, D.; Zhou, Y.; Zhang, C. Hydrodynamic modeling of a novel dual-chamber OWC wave energy converter. Appl. Ocean Res. 2018, 78, 180–191. [Google Scholar] [CrossRef]
  7. Bouali, B.; Larbi, S. Contribution to the geometry optimization of an oscillating water Column wave energy converter. Energy Procedia 2013, 36, 565–573. [Google Scholar] [CrossRef] [Green Version]
  8. Ansarifard, N.; Fleming, A.; Henderson, A.; Kianejad, S.; Orphin, J. Comparison of inflow and outflow radial air turbines in vented and bidirectional OWC wave energy converters. Energy 2019, 1821, 159–176. [Google Scholar] [CrossRef]
  9. Liu, Z.; Xu, C.; Qu, N.; Cui, Y.; Kim, K. Overall performance evaluation of a model-scale OWC wave energy converter. Renew. Energy 2020, 149, 1325–1338. [Google Scholar] [CrossRef]
  10. Elhanafi, A.; Kim, C.J. Experimental and numerical investigation on wave height and power take–off damping effects on the hydrodynamic performance of an offshore–stationary OWC wave energy converter. Renew. Energy 2018, 125, 518–528. [Google Scholar] [CrossRef]
  11. Simonetti, L.C.; Elsafti, H.; Oumeraci, H. Evaluation of air compressibility effects on the performance of fixed OWC wave energy converters using CFD modelling. Renew. Energy 2018, 119, 741–753. [Google Scholar] [CrossRef]
  12. Qiao, D.; Feng, C.; Ning, D.; Wang, C.; Liang, H.; Li, B. Dynamic response analysis of jacket platform integrated with oscillating water column device. Front. Energy Res. 2020, 8, 42. [Google Scholar] [CrossRef]
  13. Henriques, J.C.C.; Portillo, J.C.C.; Gato, L.M.C.; Gomes, R.P.F.; Ferreira, D.N.; Falcao, A.F.O. Design of oscillating-water-column wave energy converters with an application to self-powered sensor buoys. Energy 2016, 112, 852–867. [Google Scholar] [CrossRef] [Green Version]
  14. Singh, U.; Abdussamie, N.; Hore, J. Hydrodynamic performance of a floating offshore OWC wave energy converter: An experimental study. Renew. Sustain. Energy Rev. 2020, 117, 109501. [Google Scholar] [CrossRef]
  15. Elhanafi, A.; Fleming, A.; Macfarlane, G.; Leong, Z. Numerical hydrodynamic analysis of an offshore stationary floating oscillating water column wave energy converter using CFD. Int. J. Nav. Archit. Ocean Eng. 2017, 9, 77–99. [Google Scholar] [CrossRef] [Green Version]
  16. Perez-Collazo, C.; Greaves, D.; Iglesias, G. A novel hybrid wind-wave energy converter for jacket-frame substructures. Energies 2018, 11, 637. [Google Scholar] [CrossRef] [Green Version]
  17. Michele, S.; Renzi, E.; Perez-Collazo, C.; Greaves, D.; Iglesias, G. Power extraction in regular and random waves from an OWC in hybrid wind-wave energy systems. Ocean Eng. 2019, 191, 106519. [Google Scholar] [CrossRef]
  18. Lee, H.H.; Chen, C.-H. Parametric study for an oscillating water column wave energy conversion system installed on a breakwater. Energies 2020, 13, 1926. [Google Scholar] [CrossRef] [Green Version]
  19. Lee, H.H.; Wu, T.-Y.; Lin, C.-Y.; Chiu, Y.-F. Structural Safety Analysis for an Oscillating Water Column Wave Power Conversion System Installed in Caisson Structure. J. Mar. Sci. Eng. 2020, 8, 506. [Google Scholar] [CrossRef]
  20. Lee, H.H.; Chiu, Y.-F.; Lin, C.-Y.; Chen, C.-H.; Huang, M.-H. Parametric study on a caisson based OWC wave energy converting system. World J. Eng. Technol. 2016, 4, 213–219. [Google Scholar] [CrossRef] [Green Version]
  21. Sarpkaya, T.; Isaacson, M. Mechanics of Wave Forces on Offshore Structures; Van Nostrand Reinhold Company: New York, NY, USA, 1981; ISBN 0-442-25402-2. [Google Scholar]
  22. Milne-Thomson, L.M. Theoretical Hydrodynamics; The MacMillan Co.: New York, NY, USA, 1960. [Google Scholar]
  23. Goda, Y.; Nakada, H.; Ohneda, H.; Suzuki, M.; Takahashi, S.; Shikamori, M. Results of field experiment of a wave power extracting caisson breakwater. Proc. Ocean Dev. 1991, 7, 143–148. [Google Scholar] [CrossRef] [Green Version]
  24. Goda, Y.; Shinda, T.; Chiyama, S.; Ohneda, H.; Suzuki, M.; Takahashi, S.; Shikamori, M.; Takaki, Y. Experiment of a wave power extracting caisson breakwater. Proc. Ocean Dev. 1989, 5, 1–6. [Google Scholar]
  25. Lal, A.; Elangovan, M. CFD simulation and validation of flap type wave maker. World Acad. Sci. Eng. Technol. 2008, 22, 76–82. [Google Scholar]
  26. Lee, H.H.; Wang, W.-S. Analytical solution on the dragged surge vibration of TLPs with wave large body and small body multi-interactions. J. Sound Vib. 2001, 248, 533–556. [Google Scholar] [CrossRef]
  27. Lee, H.H.; Wang, W.-S. On the dragged surge vibration of a twin TLP system with multi-interactions of wave and structures. J. Sound Vib. 2003, 263, 743–774. [Google Scholar] [CrossRef]
Figure 1. Schematic drawing of a jacket type structure installed with OWC converter.
Jmse 09 00133 g001
Figure 2. Side view and the dimension of the jacket type structure.
Jmse 09 00133 g002
Figure 3. Schematic drawing of the boundary conditions.
Jmse 09 00133 g003
Figure 4. Consideration for various shapes of air-chamber of the OWC wave energy converter installed in an offshore template structure.
Jmse 09 00133 g004
Figure 5. Parameters to be examined in the study: (a) Ratio of orifice area RA = A/Aw; (b) Ratio of front gate opening RO = O/Z; (c) Ratio of chamber height RZ = Z/h.
Jmse 09 00133 g005
Figure 6. Fluid motions around the template structure with an air-chamber of the OWC.
Jmse 09 00133 g006
Figure 7. Typical air-flow and vortex variations in the air-chamber of the OWC.
Jmse 09 00133 g007
Figure 8. Variations of air-flow in the air-chamber of the OWC corresponding to time.
Jmse 09 00133 g008
Figure 9. Velocity of air-flow corresponding to various shapes of OWC chamber.
Jmse 09 00133 g009aJmse 09 00133 g009b
Figure 10. Airflow velocity corresponding to area ratio of orifice cross-section RA.
Jmse 09 00133 g010
Figure 11. Air-pressure corresponding to area ratio of orifice cross-section.
Jmse 09 00133 g011
Figure 12. Pneumatic power corresponding to area ratio of orifice cross-section.
Jmse 09 00133 g012
Figure 13. Efficiency corresponding to area ratio of orifice cross-section.
Jmse 09 00133 g013
Figure 14. Airflow velocity corresponding to opening ratio of OWC gate.
Jmse 09 00133 g014
Figure 15. Air-pressure corresponding to opening ratio of OWC gate.
Jmse 09 00133 g015
Figure 16. Pneumatic power corresponding to opening ratio of OWC gate.
Jmse 09 00133 g016
Figure 17. Efficiency corresponding to opening ratio of OWC gate.
Jmse 09 00133 g017
Figure 18. Airflow velocity corresponding to height-ratio RZ of OWC chamber.
Jmse 09 00133 g018
Figure 19. Air-pressure corresponding to height ratio RZ of OWC chamber.
Jmse 09 00133 g019
Figure 20. Pneumatic power corresponding to height-ratio RZ of OWC chamber.
Jmse 09 00133 g020
Figure 21. Efficiency corresponding to height-ratio of OWC chamber.
Jmse 09 00133 g021
Table 1. Parameters utilized in the analysis.
ParameterCodeVariables
Area-ratio of orificeRA0.1%, 0.2%, 0.4%, 0.8%, 1.6%
Opening-ratio of gateRO0%, 25%, 31.25%, 37.5%, 43.75%, 45.31%, 50%
Height-ratio of chamberRZ0.50, 0.55, 0.60, 0.65, 0.70
Publisher’s Note: MDPI stays neutral with regard to jurisdictional claims in published maps and institutional affiliations.

