Article

Investigation of the Starting-Up Axial Hydraulic Force and Structure Characteristics of Pump Turbine in Pump Mode

1
State Key Laboratory of Hydroscience and Engineering, Department of Energy and Power Engineering, Tsinghua University, Beijing 100084, China
2
College of Water Resources and Civil Engineering, China Agricultural University, Beijing 100083, China
*
Author to whom correspondence should be addressed.
J. Mar. Sci. Eng. 2021, 9(2), 158; https://0-doi-org.brum.beds.ac.uk/10.3390/jmse9020158
Submission received: 11 January 2021 / Revised: 29 January 2021 / Accepted: 1 February 2021 / Published: 5 February 2021
(This article belongs to the Special Issue Fluid/Structure Interactions)

Abstract

:
During the starting up of the pump mode in pump turbines, the axial hydraulic force acting on the runner would develop with the guide vane opening. It causes deformation and stress on the support bracket, main shaft and runner, which influence the operation security. In this case, the axial hydraulic force of the pump turbine is studied during the starting up of pump mode. Its influences on the support bracket and main shaft are investigated in detail. Based on the prediction results of axial hydraulic force, the starting-up process can be divided into “unsteady region” and “Q flat region” with obviously different features. The mechanism is also discussed by analyzing pressure distributions and streamlines. The deformation of the support bracket and main shaft are found to have a relationship with the resultant force on the crown and band. A deflection is found on the deformation of the runner with the nodal diameter as the midline in the later stages of the starting-up process. The reason is discussed according to pressure distributions. The stress concentration of the support bracket is found on the connection between thrust seating and support plates. The stress of the runner is mainly on the connection between the crown and the blade’s leading-edge. This work will provide more useful information and strong references for similar cases. It will also help in the design of pump turbine units with more stabilized systems for reducing over-loaded hydraulic force, and in the solving of problems related to structural characteristics.

1. Introduction

Pumped storage power stations are crucial in electric power systems. They have two main modes—the power generating (turbine mode) and pump-storing (pump mode) modes—with the ability to quickly start up and shut down. During the peak period of electricity demand, the pump turbine operates in turbine mode and converts the potential energy of water in upstream to electrical energy. During the off-peak period, it operates in pump mode and stores the excess energy via pumping water into the upstream reservoir.
The pump turbine, designed as reversible in modern times, is the key component of pumped storage power stations [1]. It operates under complex conditions and suffers varying hydraulic force on the runner, shaft and support bracket. Pump turbines are usually designed and installed in vertical-axis style. The operating stability and security becomes very sensitive to axial hydraulic force [2]. The total axial force that shaft systems suffer includes the axial hydraulic force, the weight of the runner and the weight of the shaft system. Thus, the axial force is an important technical requirement and also affects the design of thrust bearing. The desirable condition of axial force is upward but slightly less than the runner-shaft weight. The total axial force will be downward to ensure the unit is stable. However, a desirable condition is usually difficult to achieve. Especially, the axial force strongly and complexly changes in transient conditions such as starting-up, load rejection, stalling, etc. If the upward axial hydraulic force is too strong to exceed the unit weight, the unit lifting happens and causes accidents [3,4,5,6]. On the contrary, if the downward axial hydraulic force is too strong, especially with strong pulsation, the support bracket will strongly deform or even be damaged due to plastic deformation or fatigue failure [7].
Investigating the axial hydraulic force characteristics and influences is a popular topic in pump turbine engineering cases and other hydro-turbine cases. The mechanism of axial hydraulic force is currently well known. It is caused by the pressure difference between the inner and outer surfaces of the runner’s crown and the band and between the runner blade’s suction and pressure sides [8,9,10,11]. Usually, the crown and band leakages are filled with high-pressure flow, which is higher than the inner flow of the runner [4,12]. The pressure of the blade pressure side is higher than that of the suction side. However, the total axial hydraulic force is empirically unpredictable because the influence factor is very complicated. The condition parameters of the pump turbine, including head, flow rate and rotation speed, impact the flow regime and pressure distribution [13,14,15]. Liu et al. [16] presented an analytical method to calculate the axial hydraulic force, considering the leakage size and the angular flow velocity in high-pressure leakages. They also pointed out that the turbine axial force is mainly produced by crown and band leakages. The leakage-induced axial force is much larger than that induced by other runner parts. Based on Genetic Algorithm, large-quantity experiment and computational fluid dynamics(CFD) simulation, Zhao et al. [17] put forward a prediction formulation of axial hydraulic force with condition parameters, runner diameter and empirical coefficients. The axial force of the centrifugal pump simulated by the CFD method was compared with the test result of Zhou et al. [18]. The results indicated that an appropriate impeller rear shroud radius is able to significantly reduce axial force. Based on experiment and simulation, the wear ring radial clearance was found to influence the axial thrust. The solutions of hydraulic axial thrust reduction of pumps were then presented [19,20]. In terms of the load-rejection of generating mode, the axial force variation was found to have a strong relationship with flow rate [21]. Li et al. [22] found that the amplitude of the force depends on the operating conditions and the guide vane openings. For example, the axial force is prominent in the common operation of turbine mode while the radial force is dominant in runaway and shutdown processes.
The structure of the pump turbine mainly includes the support bracket, main shaft, rotor generator and runner. The support bracket is a fixed component while the other components are rotational. As the structural support, the weight of the unit and the hydraulic force of the runner load on the support bracket [23,24]. It should be considered as a fluid–structure interaction (FSI) problem in order to understand the influence of the runner’s hydraulic force on structures [25]. Based on FSI, many studies were focused on the stress on the runner. Considering the interaction between the hydraulic force of the flow field and the deformation of the structure field, two-way FSI is used in structural analysis of the runner and the accuracy is compared with experimental studies [26,27,28,29]. However, in terms of turbine FSI issues, the deformation of the runner structure is much less than the flow characteristic length. In that case, Zhou et al. and Xiao et al. [30,31] studied the fatigue and stress of runner at off-design operating points via one-way FSI. They found that the stress caused by hydraulic force is one of the main reasons of the runner fatigue failures and cracks. In terms of the other essential components of pump turbines, Luo et al. [32,33,34] focused on the stress of the rotor bracket of the generator and the piston rod of the blade. Improvements in design are made based on stress analyses. However, the hydraulic force was usually simplified as a resultant force in the research on shafts and support brackets [35,36,37]. It cannot accurately reflect the influence of hydraulic force on unit structure due to the non-uniform force distributions.
In this study, based on one-dimensional (1D) hydraulic transient simulation in pipeline and 3D CFD simulation in pump turbines, the axial hydraulic force of the pump turbine in the starting up of pump mode is studied. The influence of axial force on pump turbine structure is also researched. The reliability of CFD simulation is verified by comparison with the prototype on-site test. The influence of the operation parameters on axial hydraulic force and the mechanism are analyzed and explained in detail. Based on one-way FSI, the structural strength including deformation and stress of the support bracket, main shaft and runner is calculated. The relationship between axial hydraulic force and structural strength is well discussed. This research will provide more useful information and strong references for similar cases. It helps the design of pump turbine units for a better hydraulic and structural performance.

2. Numerical Method

2.1. Method of 3D Turbulent Flow Simulation

Given the incompressibility of water, the Reynolds averaged Navier-Stokes (RANS) equations were used to calculate the 3D flow field in the pump turbine. The continuity equation and momentum equation are [38]:
u i x i = 0
u i t + u j u i x j = f i 1 ρ p x i + v 2 u i
where u is flow velocity, f is body force, ρ is density, p is pressure, v is kinematic viscosity, t is time and x is the coordinate component.
In the RANS method, the instantaneous component is decomposed into its time-averaged component and fluctuating component. To close the equations, the turbulence model is used to empirically model the fluctuating component. The SST kω transient model which is an eddy viscosity model is applied in this study [39]. It can simulate both the shear flow and adverse pressure gradient accurately and is particularly useful in engineering simulations. The RANS equation with SST kω model can be written as:
( ρ k ) t + ( ρ u i k ) x i = P ρ k 3 2 l k ω + x i [ ( μ + σ k μ t ) k x i ]
( ρ ω ) t + ( ρ u i ω ) x i = C ω P β ρ ω 2 + x i [ ( μ l + σ ω μ t ) ω x i ] + 2 ( 1 F 1 ) ρ σ ω 2 ω k x i ω x i
where lk−ω is the turbulence scale in which lk−ω=k1/2βkω, μ is dynamic viscosity, term P is the production term, Cω is the coefficient of the production term, F1 is the blending function, σk, σω and βk are model constants.
Based on the CFD commercial software CFX, the high resolution was used for discretization schemes in this paper.
The 3D flow simulation was processed with the steady simulation in CFX. The one-dimensional (1D) hydraulic transient simulation of unsteady flow in pipe was processed to consider the transient effect in starting-up. As the boundary conditions of 3D flow field, the 1D hydraulic transient simulation was based on the continuity equation and momentum equation.
U H x + H t U s i n α + a 2 g U x = 0
g H x + U U x + U t + f U | U | 2 D = 0
where H is piezometric head, U is average velocity, g is gravity acceleration, f is Darcy-Weisbach friction factor; α is pipeline slope; D is diameter of pipe; a is speed of pressure pulse [40].

2.2. Method of Structural Simulation

The structural simulation was proceeded using commercial software ANSYS. Based on the structural static equilibrium equation, the stress and deformation are calculated using the finite element method (FEM). The equilibrium equation is [41]:
[ K ] { d } = { F }
where [K] is the stiffness matrix of the system, {d} is the vector with the nodal displacement and {F} is the vector of force loaded on structure.
Via the displacement {d} solved by Equation (7), the static stress σ can be calculated by [42,43]:
σ = [ D s ] [ B s ] { d }
where [Ds] is the elastic matrix based on Young’s modulus and Poisson’s ratio for the material and [Bs] is the strain–displacement matrix based on the element shape functions.
Universally, the equivalent von Mises stress is applied in engineering to analyze the stress characteristics of the structure. The equivalent von Mises stress σc can be calculated using the fourth strength theory:
σ c = 1 2 [ ( σ 1 σ 2 ) 2 + ( σ 2 σ 3 ) 2 + ( σ 3 σ 1 ) 2 ]
where σ1, σ2 and σ3 are the first, second and third principal stress.

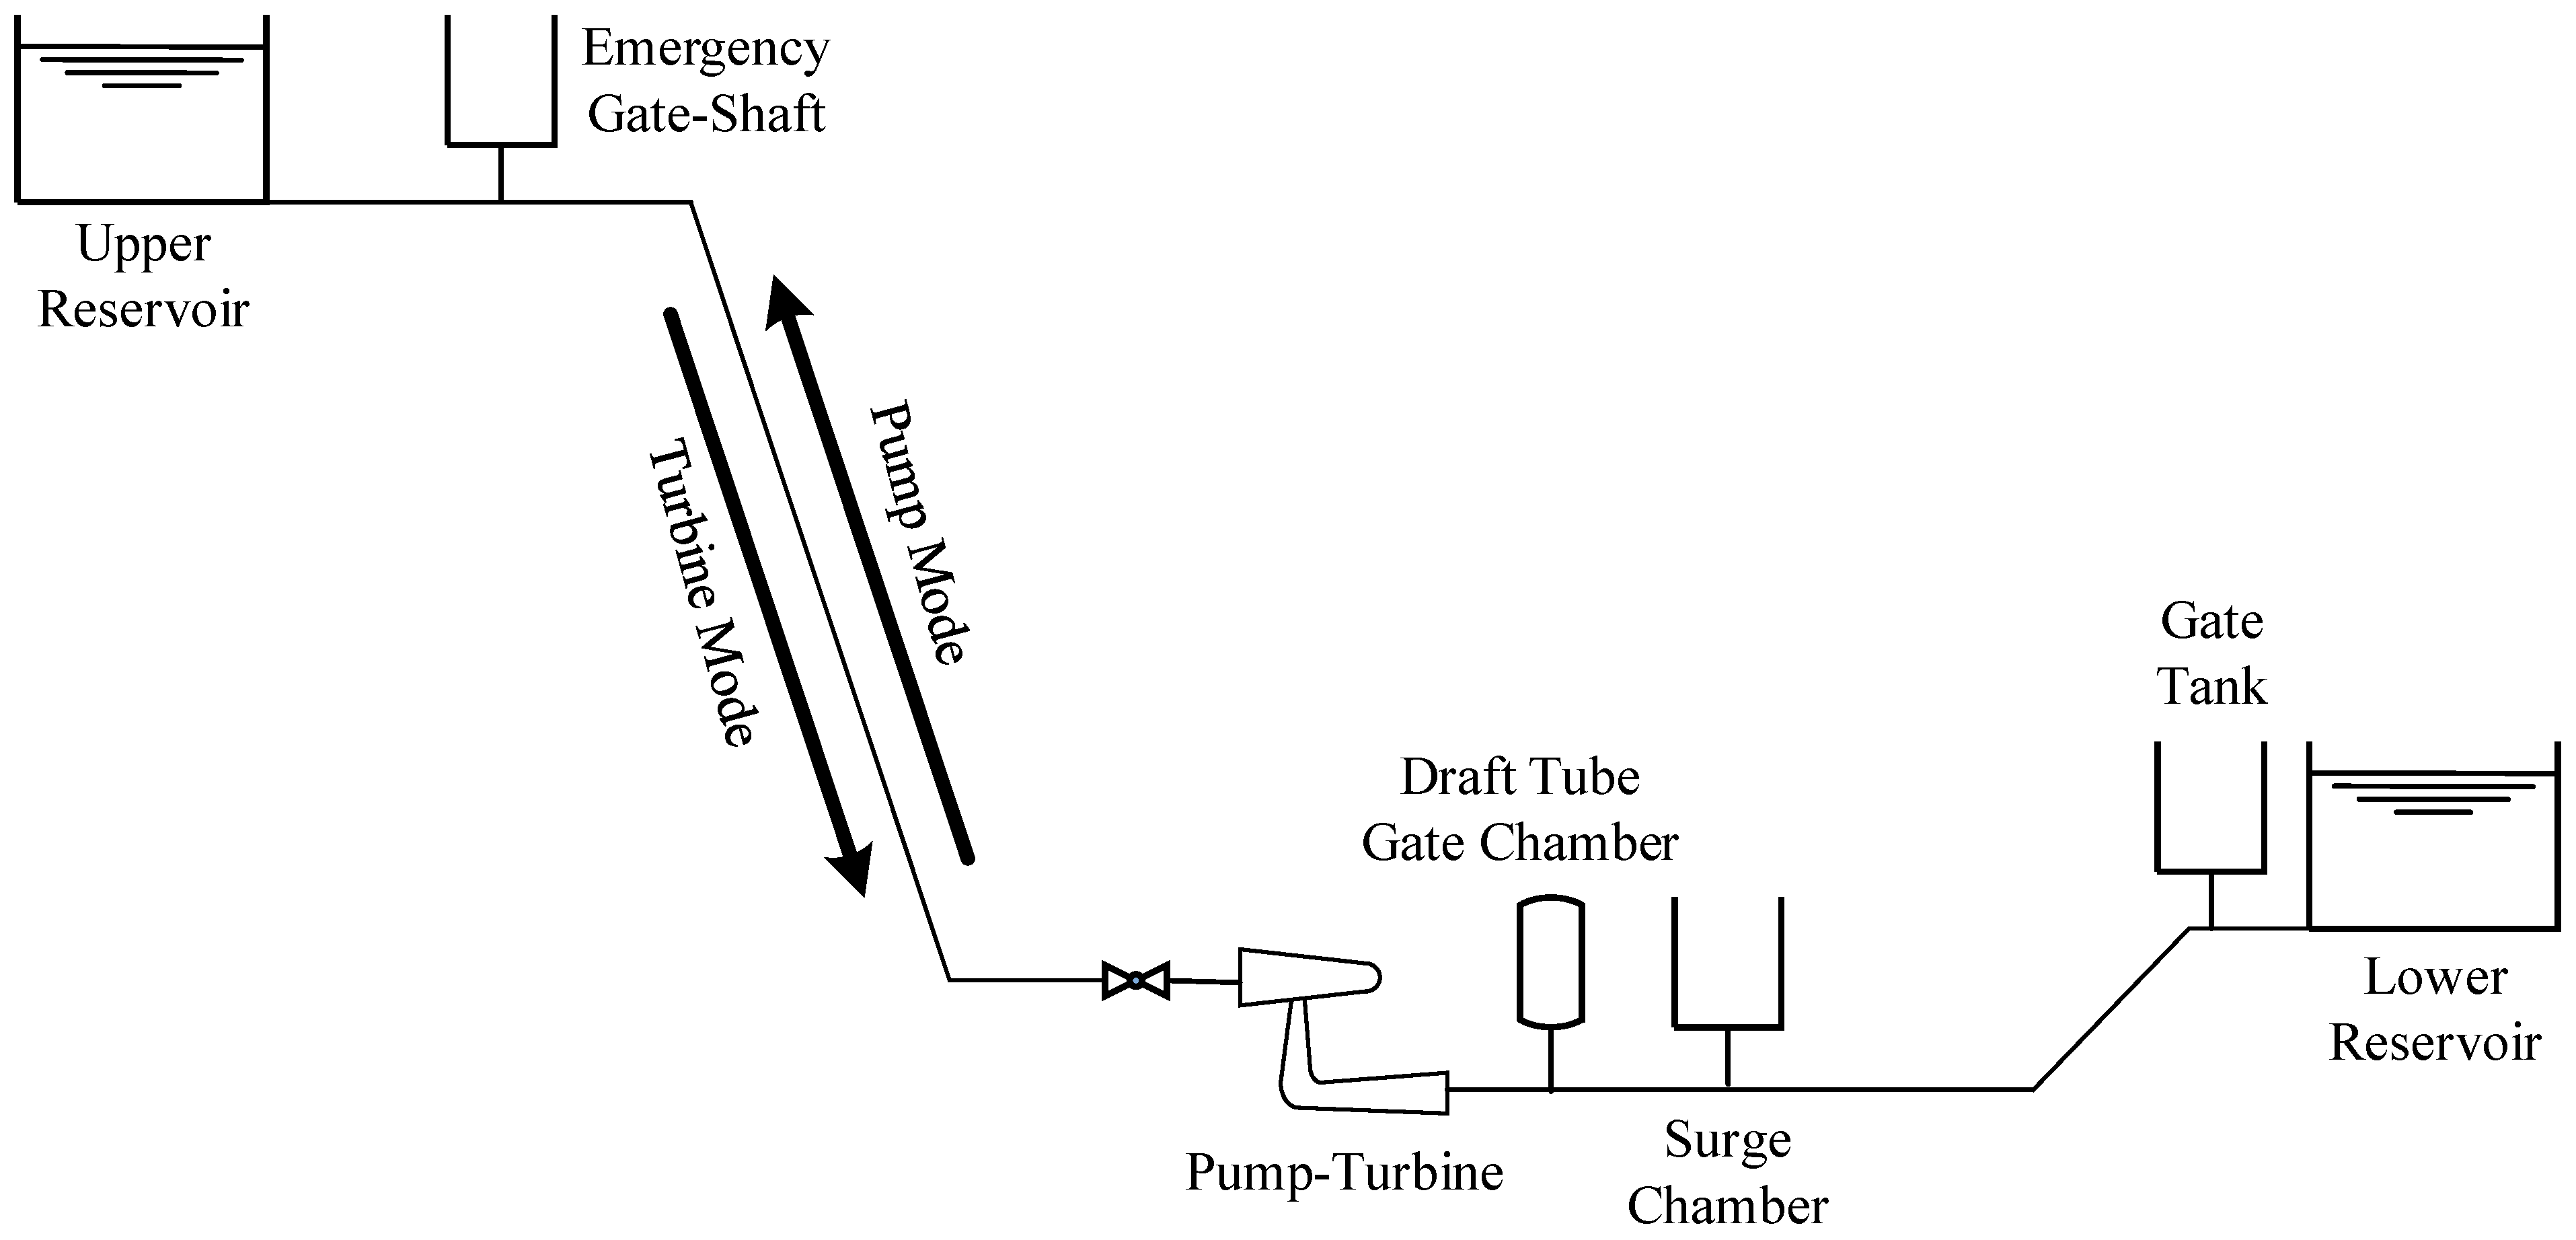
3. Computational Model and Boundary Conditions

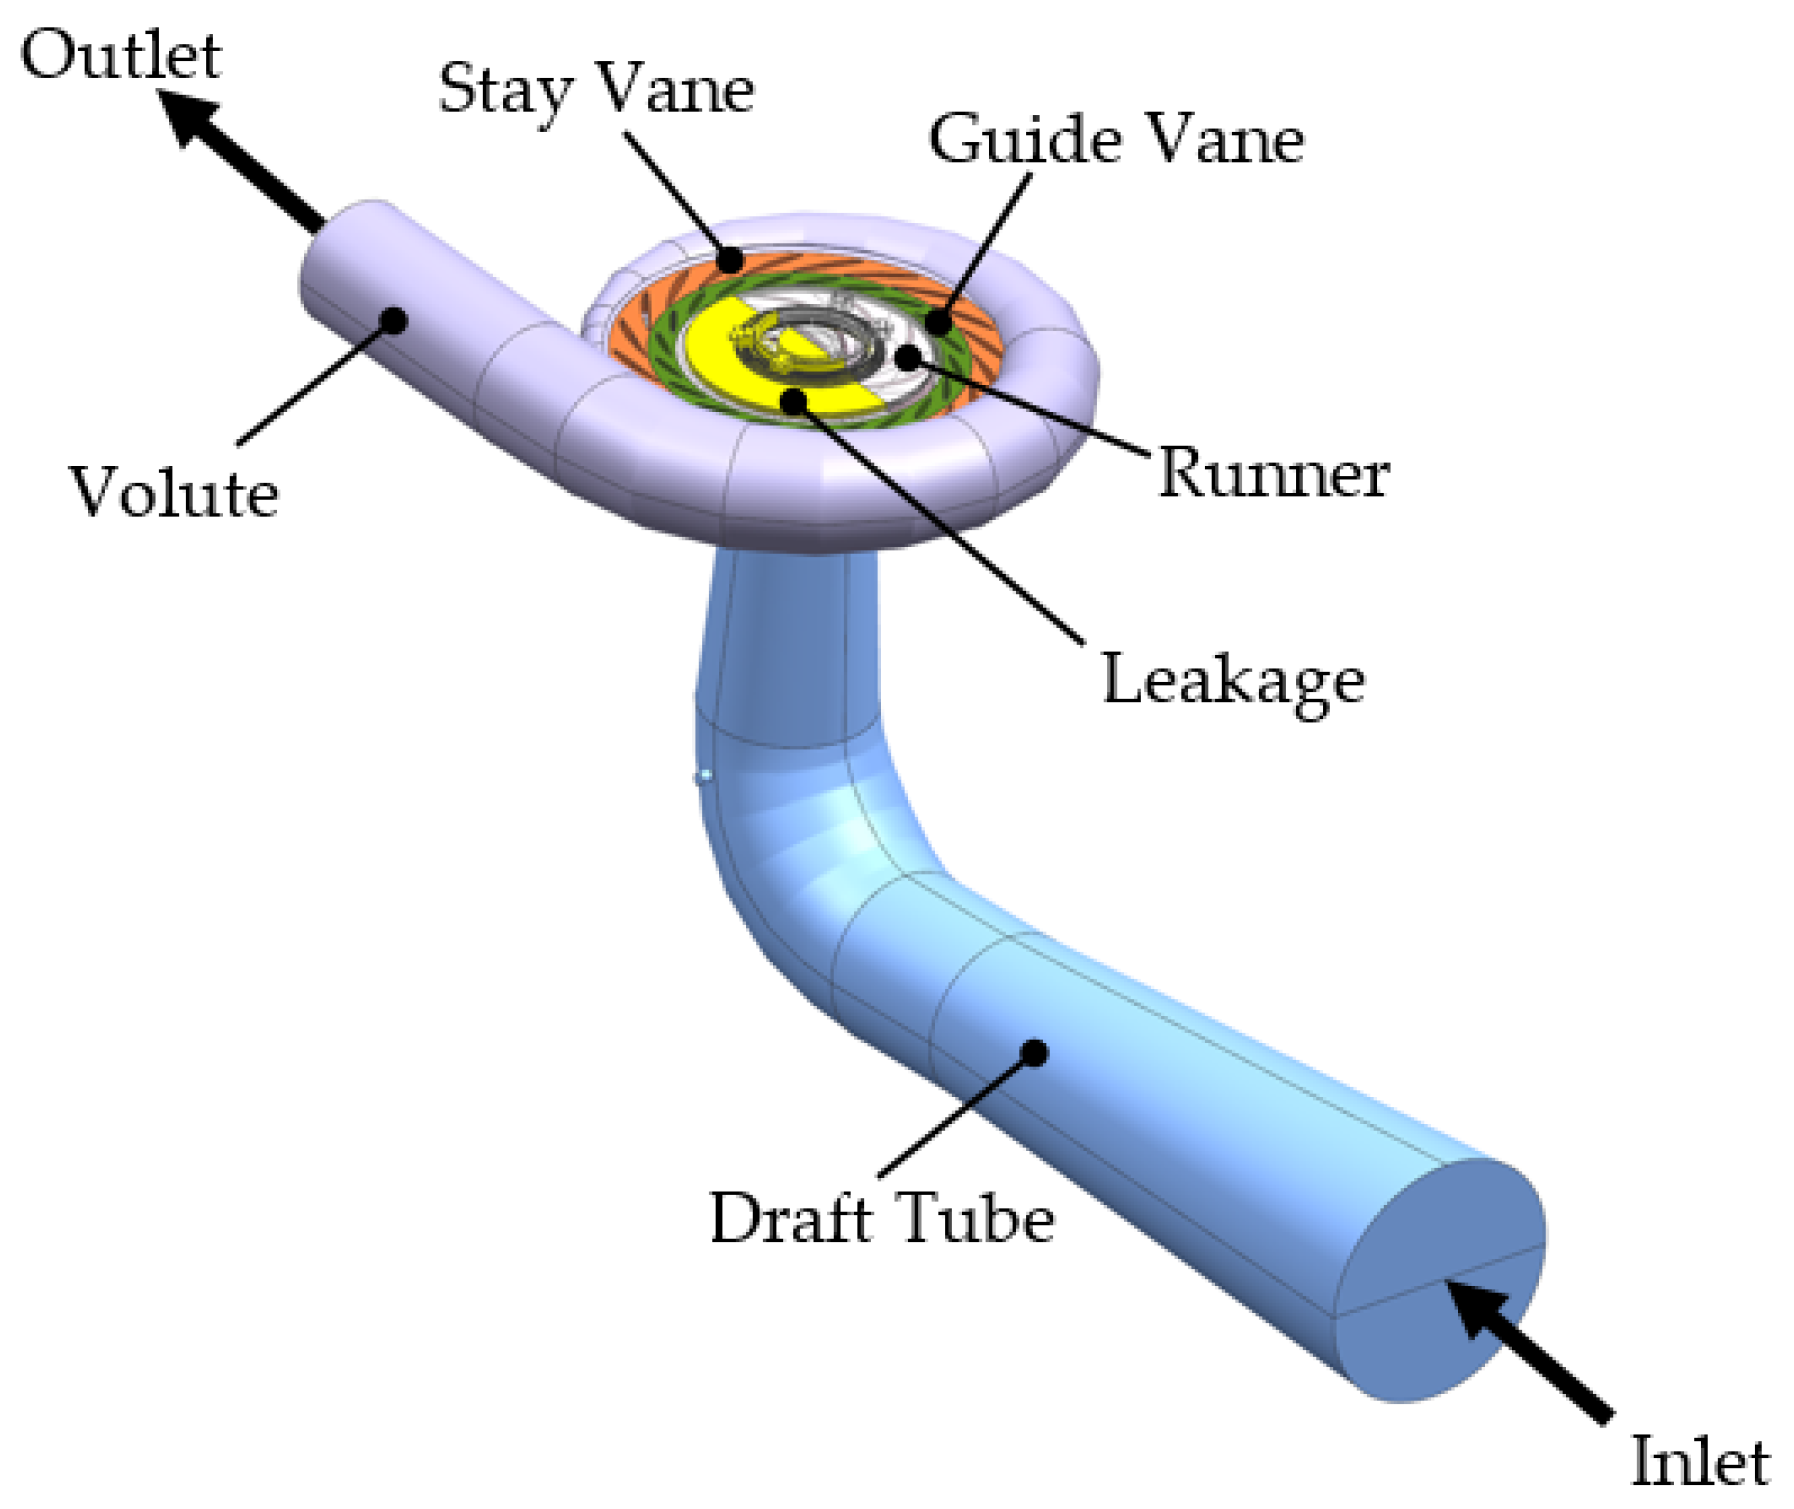
3.1. Flow Field of Pump Turbine

In this study, the model is a prototype reversible pump turbine in a pumped storage power station. In order to acquire the boundary conditions of the pump turbine, the hydraulic system has been modelled in 1D. As shown in Figure 1, the 1D system includes the pipeline, reservoir, gate shaft, pump turbine and tank. The operate process studied in this paper is the starting-up process of the pump mode. Because the reservoir level has principle influence on hydraulic force, the most common situation is considered to be the initial conditions with the maximum lower reservoir level of 294 m and the minimum upper reservoir of 741 m. The length of upper pipeline is about 1160.9 m and the length of lower pipeline is about 1108.5 m.
The parameters of pump turbine are listed in Table 1. The 3D flow profile of the pump turbine, shown in Figure 2, mainly consists of volute, stay vane, guide vane, runner and draft tube. To consider the hydraulic force on the outside surface of the runner, the flow field of the runner’s crown and shroud leakages, and pressure-balancing chamber, are also modelled. Figure 3 shows the details of the runner and leakage. The hydraulic force of runner and leakage flow acts on the fluid–structure interface including the blade suction side (BSS), blade pressure side (BPS), crown outside surface (COS), crown inside surface (CIS), band outside surface (BOS) and band inside surface (BIS). These interfaces are illustrated in Figure 3.
While the runner keeps rotating at the rated speed, the air, which is pressurized into the runner chamber to reduce start-up torque, has been already released, instead of filling water. Then, the guide vane opens gradually from 0 degrees to the maximum opening angle. This process is called “starting-up” in pump mode. According to the guide vane opening law, the starting point is when the guide vane opening is 0 degrees and the starting-up calculation duration in this paper is 30 s. The time step of 1D hydraulic transient simulation is 0.005 s.
The 3D flow field during starting-up is calculated using CFD steady simulation at selected typical time points (STP), which is illustrated in Figure 4. The boundary conditions of 3D CFD simulation is based on 1D hydraulic transient results of the pipe at the inlet and outlet of the pump turbine. The draft tube inlet is set as the mass flow rate inlet boundary. The volute outlet is set as the static pressure outlet boundary. The rotation speed is the rated speed. The guide vane opening rule, mass flow rate and static pressure at volute outlet are acquired from 1D hydraulic transient simulation, as shown in Figure 4. All the parameters are at relative values of Q* = Q/Qr, Hout* = Hout/Hr, A* = A/Amax where Qr, Hr are the rated flow rate and rated head, Hout is the pressure at the volute outlet, Amax is the maximum guide vane opening. There is a fluctuation of Hout at the initial stage of starting-up, which is caused by the water hammer effect in the pipeline with the guide vane opening.
The fluid medium is considered as incompressible in this case. The runner walls in leakages are set as counter-rotating. The other solid walls are set as no-slip wall type boundaries. The runner domain and FSI of leakage, COS and BOS are set as rotational. The other domain and wall are set as stationary. Interfaces between stationary domains are set as general connection. Interfaces between stationary and rotational domains are set as frozen-rotor type for good data transfer ability. The convergence criterion is set as the root-mean-square (RMS) residual of continuity equation, and momentum equation is set as less than 1 × 10⁻⁴.

3.2. Structural Field of Pump Turbine Unit

In the structural field simulation, the structural stress and deformation of pump turbine unit are focused and simulated based on the finite element method (FEM). The structural model is composed of the support bracket, shaft, motor and runner. The rotating components including the shaft, motor and runner are regarded as one. Figure 5 shows the 3D structural model with corresponding boundary conditions. The material of the pump turbine unit is steel; the properties that refer to the prototype pump turbine are listed in Table 2. The total weight of rotating components is about 550 t. The coordinate system is shown in Figure 5 with a downward +z (axial) direction. The bracket has, in total, eight supporting arms, fixed by concrete foundations at the arm end (fixed support 1) and connected with the generator stator at the bottom (fixed support 2). The diameter of the basic support part is 4 m and the diameter with eight supporting arms is 10 m. The thrust bearing is simplified by spring element (the element type is COMBIN14), connecting the thrust collar and thrust seating of the support bracket. The upper bearing, lower bearing and turbine bearing are simplified by the bearing element (the element type is COMBI214), constraining the radial motion of the shaft. The stiffness coefficients k of thrust bearing and guide bearing are listed in Table 3 [37]. Hydraulic force loads on the fluid–structure interfaces of runner based on one-way FSI. The hydraulic force is acquired from 3D flow field simulation and is mapped onto the fluid–structure interface of the runner structure using the profile-preserving method. The rotation speed of the rotating components is nr. The gravity and centrifugal force of the rotating components are fully considered in this study.

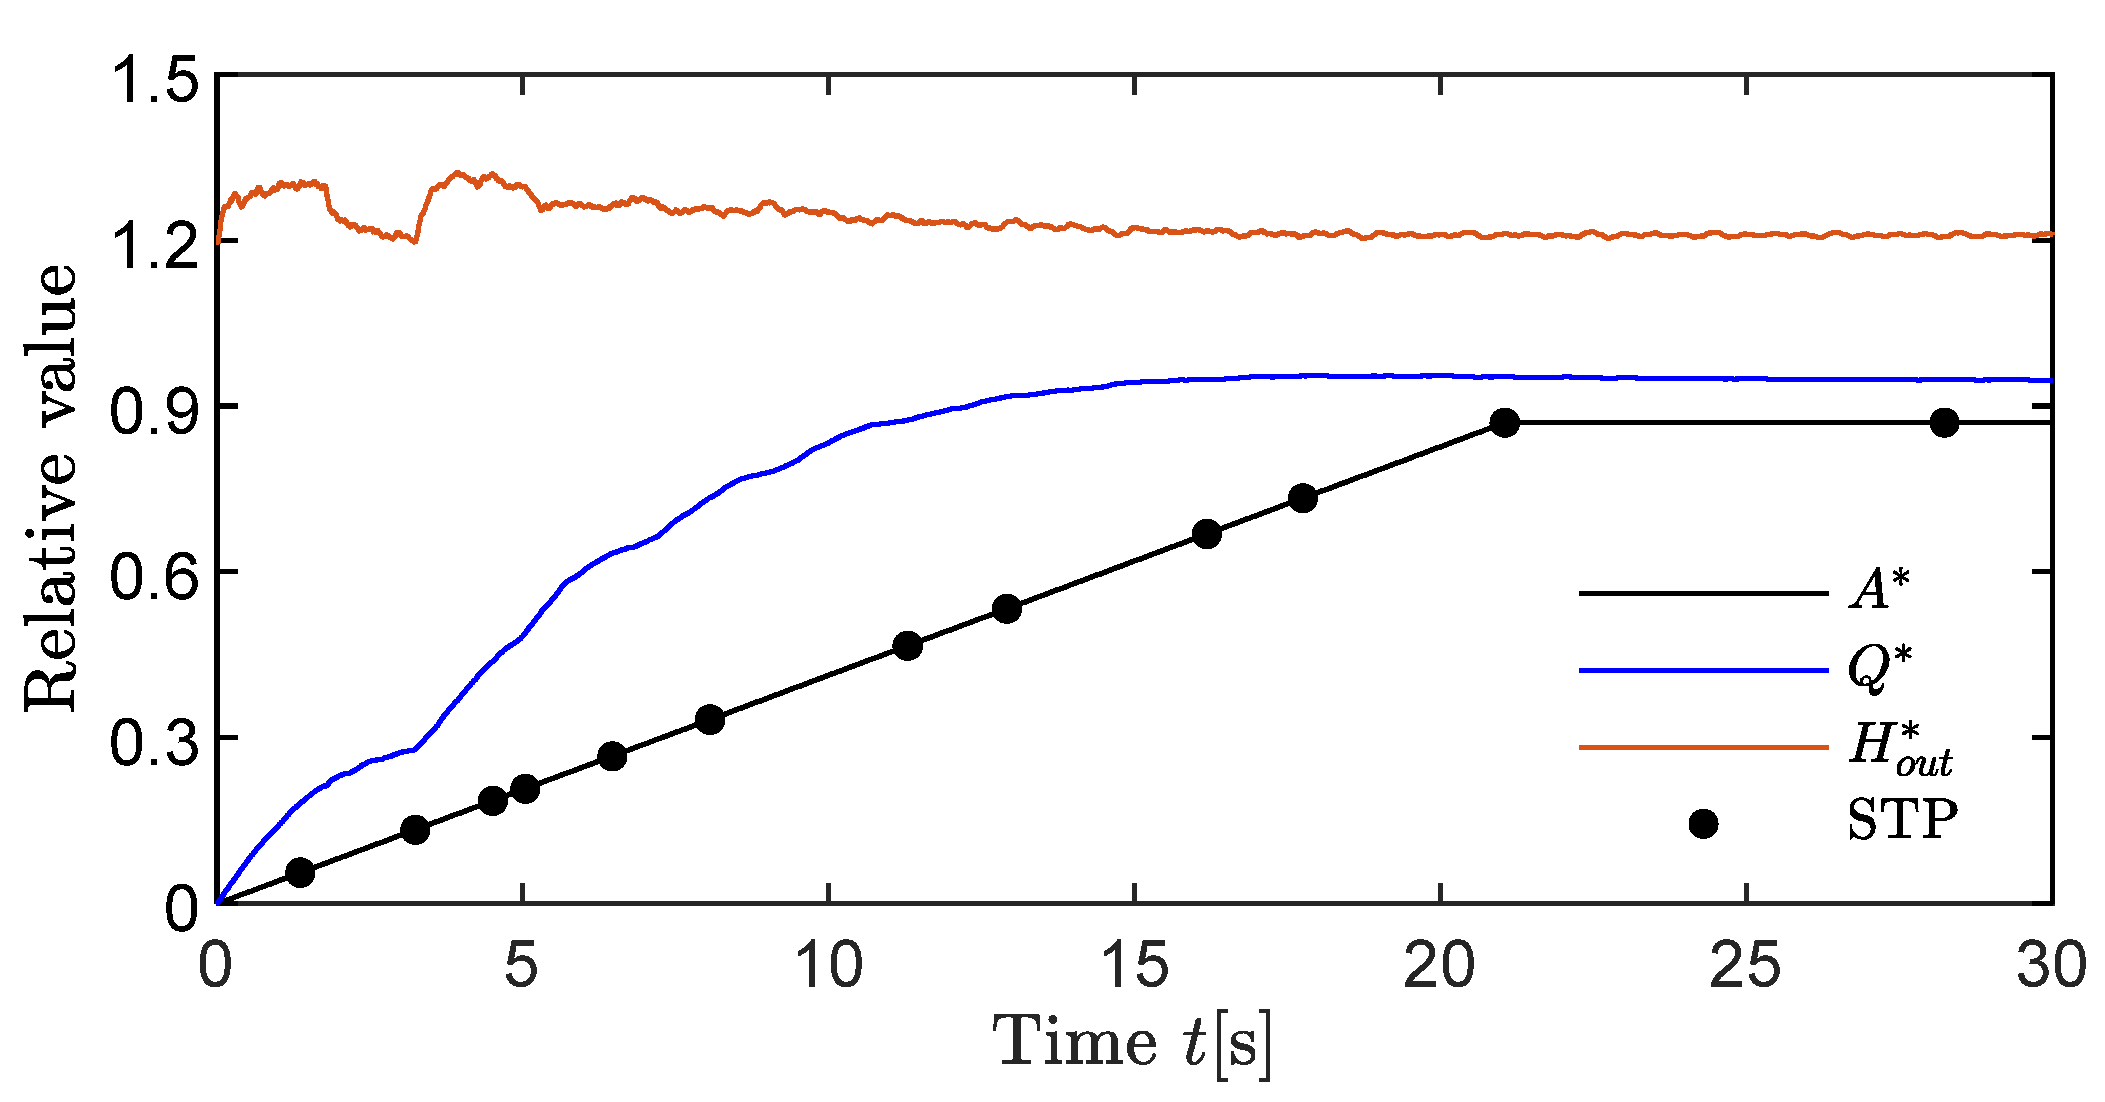
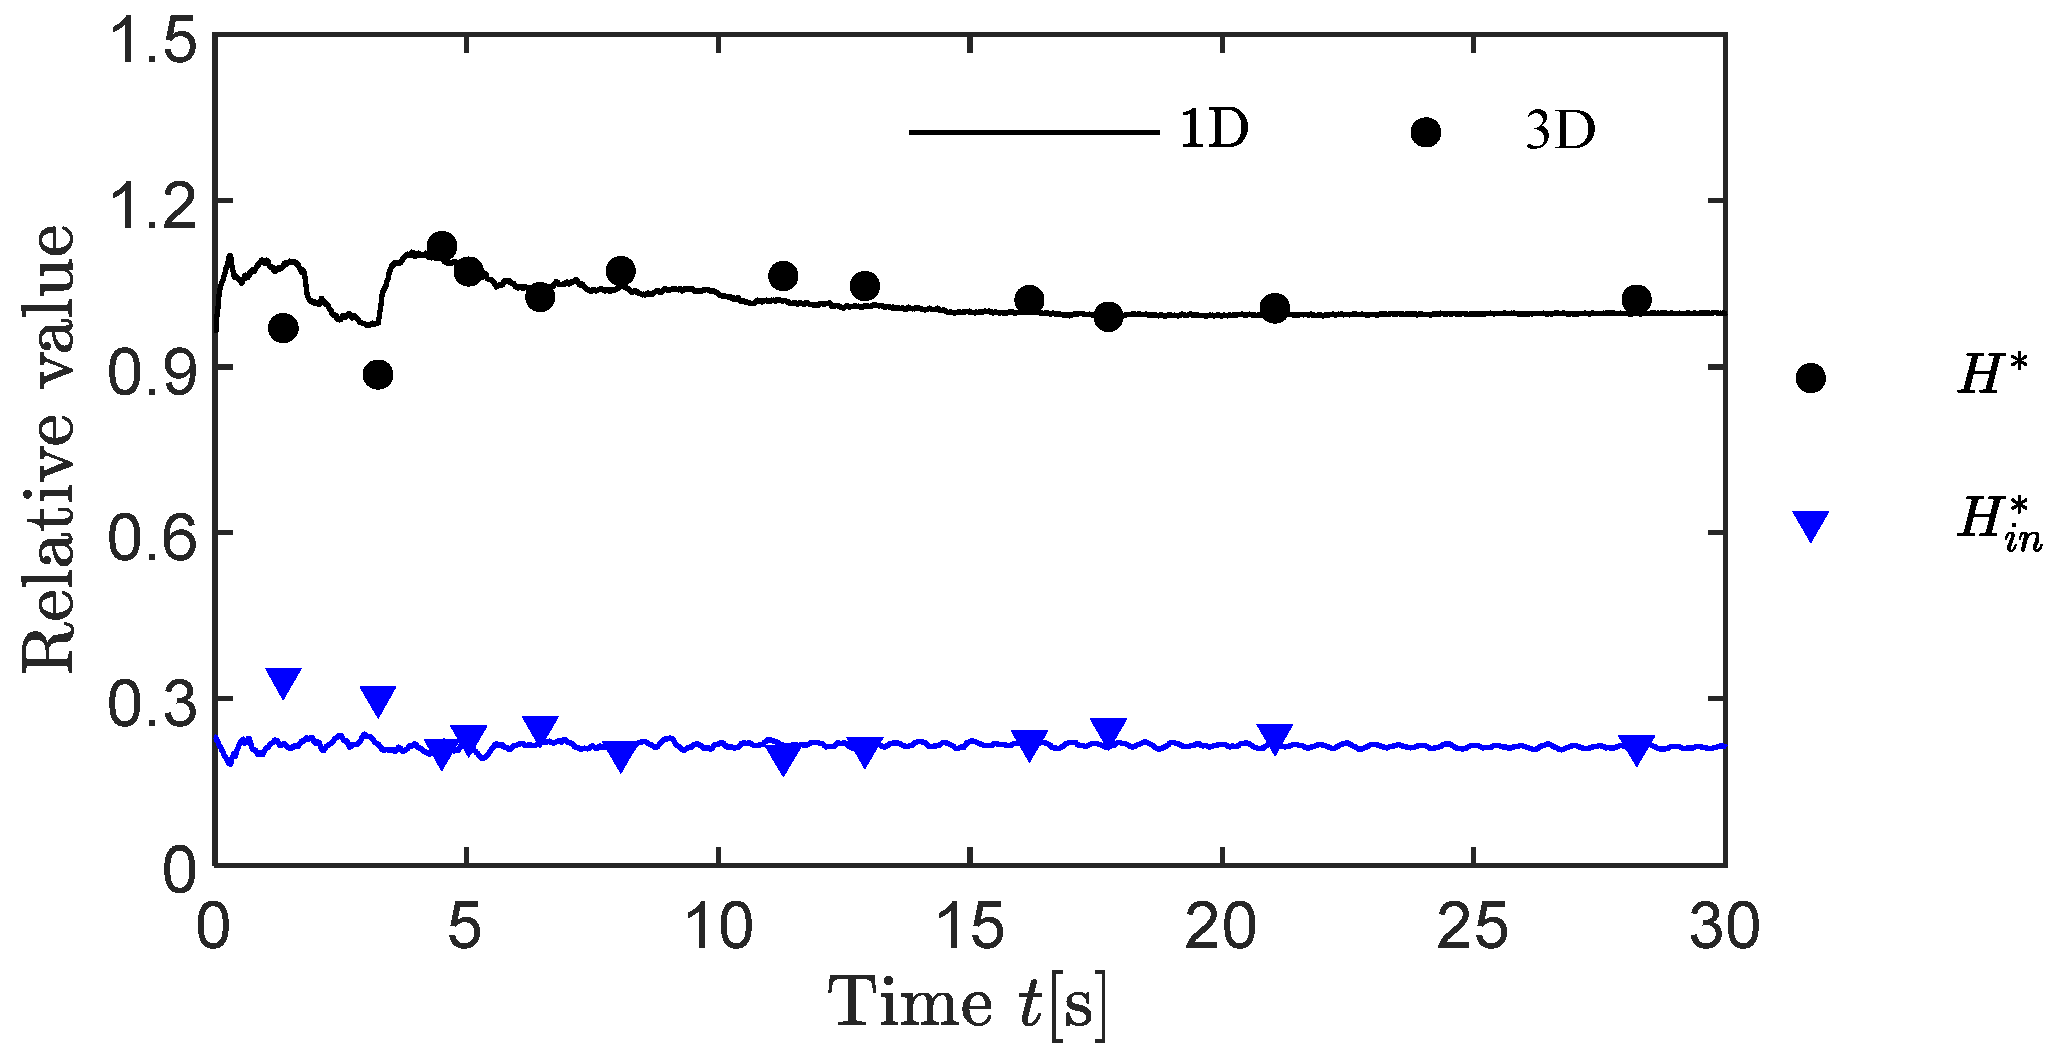
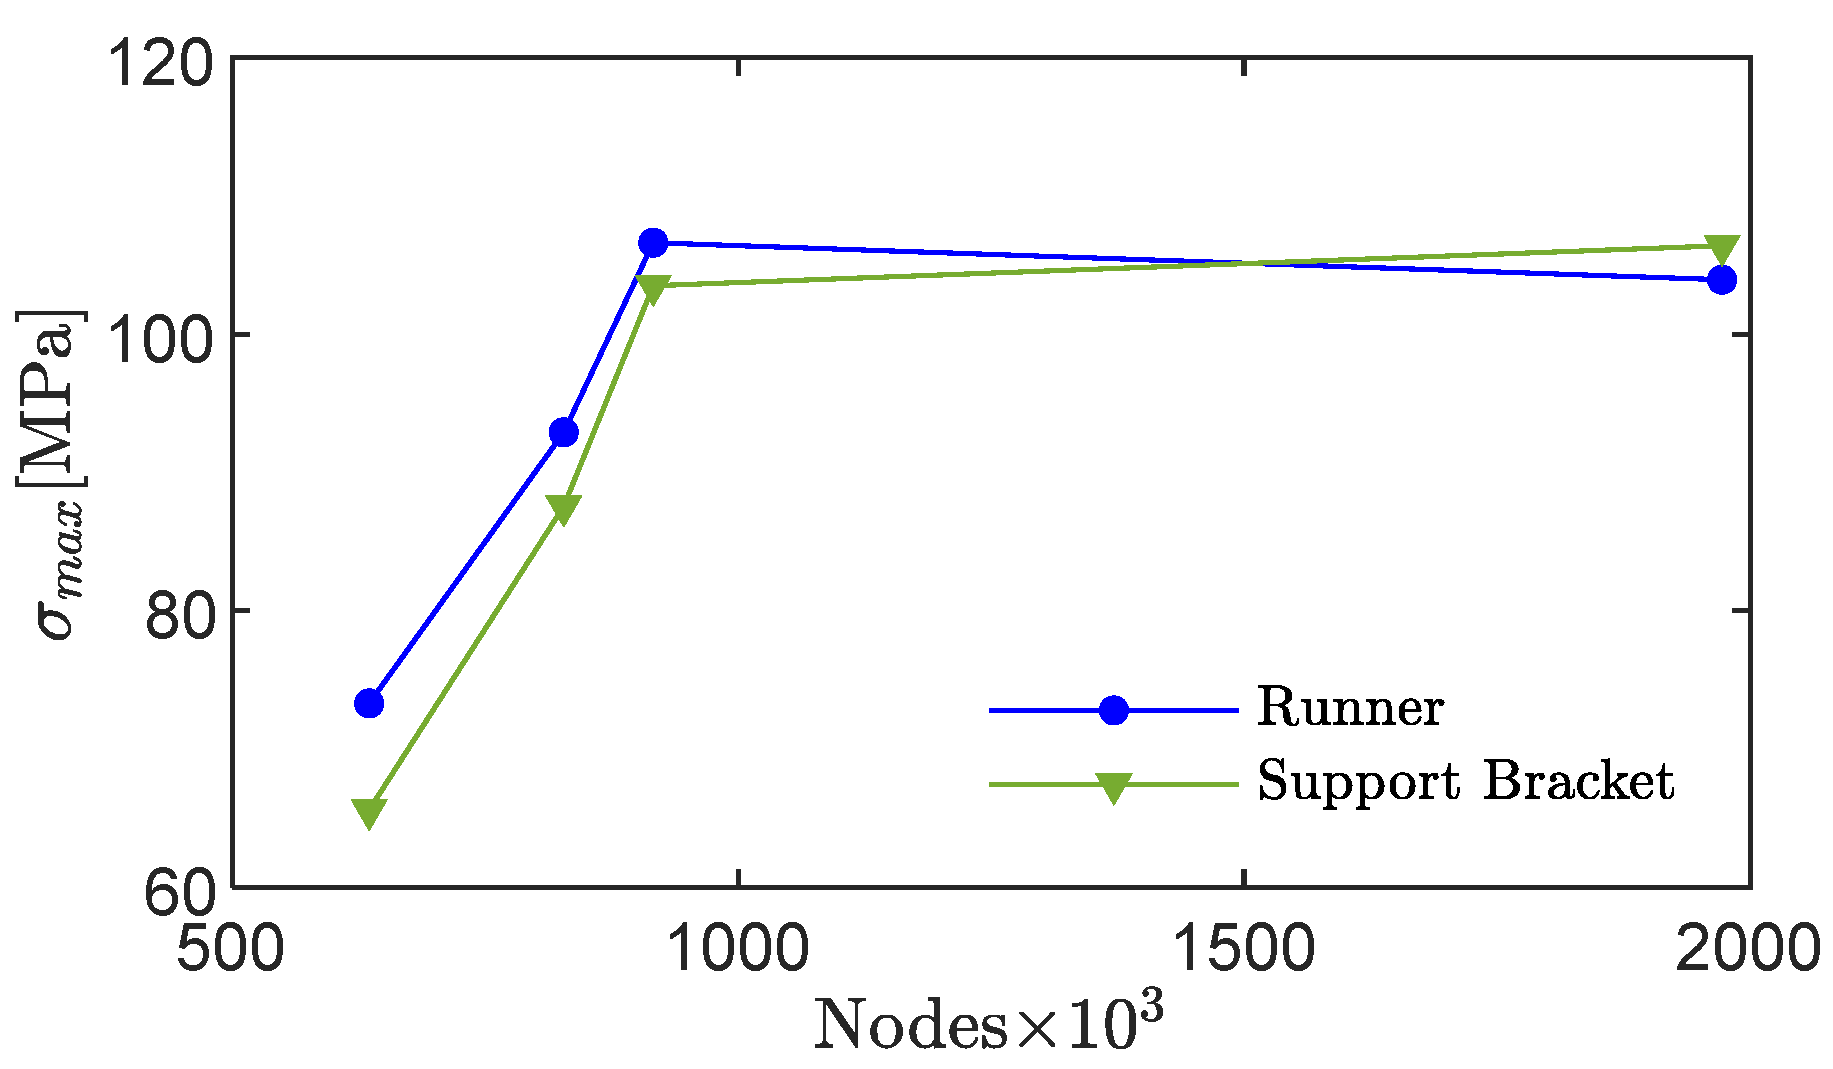
4. Mesh and Independence Check

4.1. Mesh of Flow Field

The flow field of the pump turbine is discretised using tetrahedral-hexahedral hybrid mesh elements to balance the computational cost and simulation accuracy. The schematic map of mesh is shown in Figure 6. It is worth noting that the guide vane flow domain is remeshed with consistent element size and rules as the guide vane opening is changing. The y+ value is also checked by adjusting the near-wall mesh height. To apply the automatic wall functions, y+ is finally controlled within 30~300.
In order to validate the mesh independence and the simulation accuracy, the comparison of pressure on typical locations between the prototype pump turbine test data and simulation is conducted, as pressure distribution is the key point of hydraulic force. Four pressure sensors were arranged on the prototype pump turbine at the location marked in Figure 7, working during the starting-up in pump mode. The sampling frequency of the pressure sensor is 800 Hz. For comparison with simulation results at STP, the frequency of test pressure shown in Figure 8 is 4 Hz, which is averaged from the original data with 800 Hz. The relative pressure coefficient Cp is defined as:
C p = P ρ g H r
As shown in Figure 8, the pressure on typical locations shows good agreement between the test and simulation, with errors below 10.7%. Larger errors mainly exist in the initial stage of the starting-up process as both the guide vane opening and mass flow rate are very small. Furthermore, relative head H* = H/Hr and relative pressure at draft tube inlet Hin* = Hin/Hr between 1D hydraulic transient and 3D CFD steady simulation are compared in Figure 9. The H* and Hin* predicted by CFD matches well with the 1D-predicted results. Therefore, the mesh is sufficient for the hydraulic force simulation based on steady state CFD simulation. The final mesh of the flow field in this study has about 6.89 million nodes and 9.91 million elements. The mesh detail of each component is, respectively, listed in Table 4.

4.2. Mesh of Structural Field

Figure 10 shows the mesh of structural field including support bracket, shaft and runner. The support bracket is meshed by tetrahedral mesh elements. The shaft and runner are meshed by hexahedral mesh elements. The element type in ANSYS simulation is SOLID185. The tress concentration often occurs at the “T-shape” connection and at the corners. These regions are extremely sensitive to the mesh quality [44]. Therefore, as shown in detail in Figure 10, mesh in special regions like the corners of support plates, the connections between the blade and the crown, and the connection between the blade and the runner’s band, are locally refined. According to the maximum stress on local refinement zones of the runner and support bracket, the mesh independence check is conducted with four schemes, as listed in Table 5. The four schemes have different element sizes, especially in sensitive regions. As shown in Figure 11, the changes of maximum stress at typical sites are monitored to be less than 2% in the check. The final mesh scheme has 0.92 million nodes and 1.17 million elements. The mesh details of each component are listed in Table 6.

5. Results and Analysis

5.1. Axial Hydraulic Force

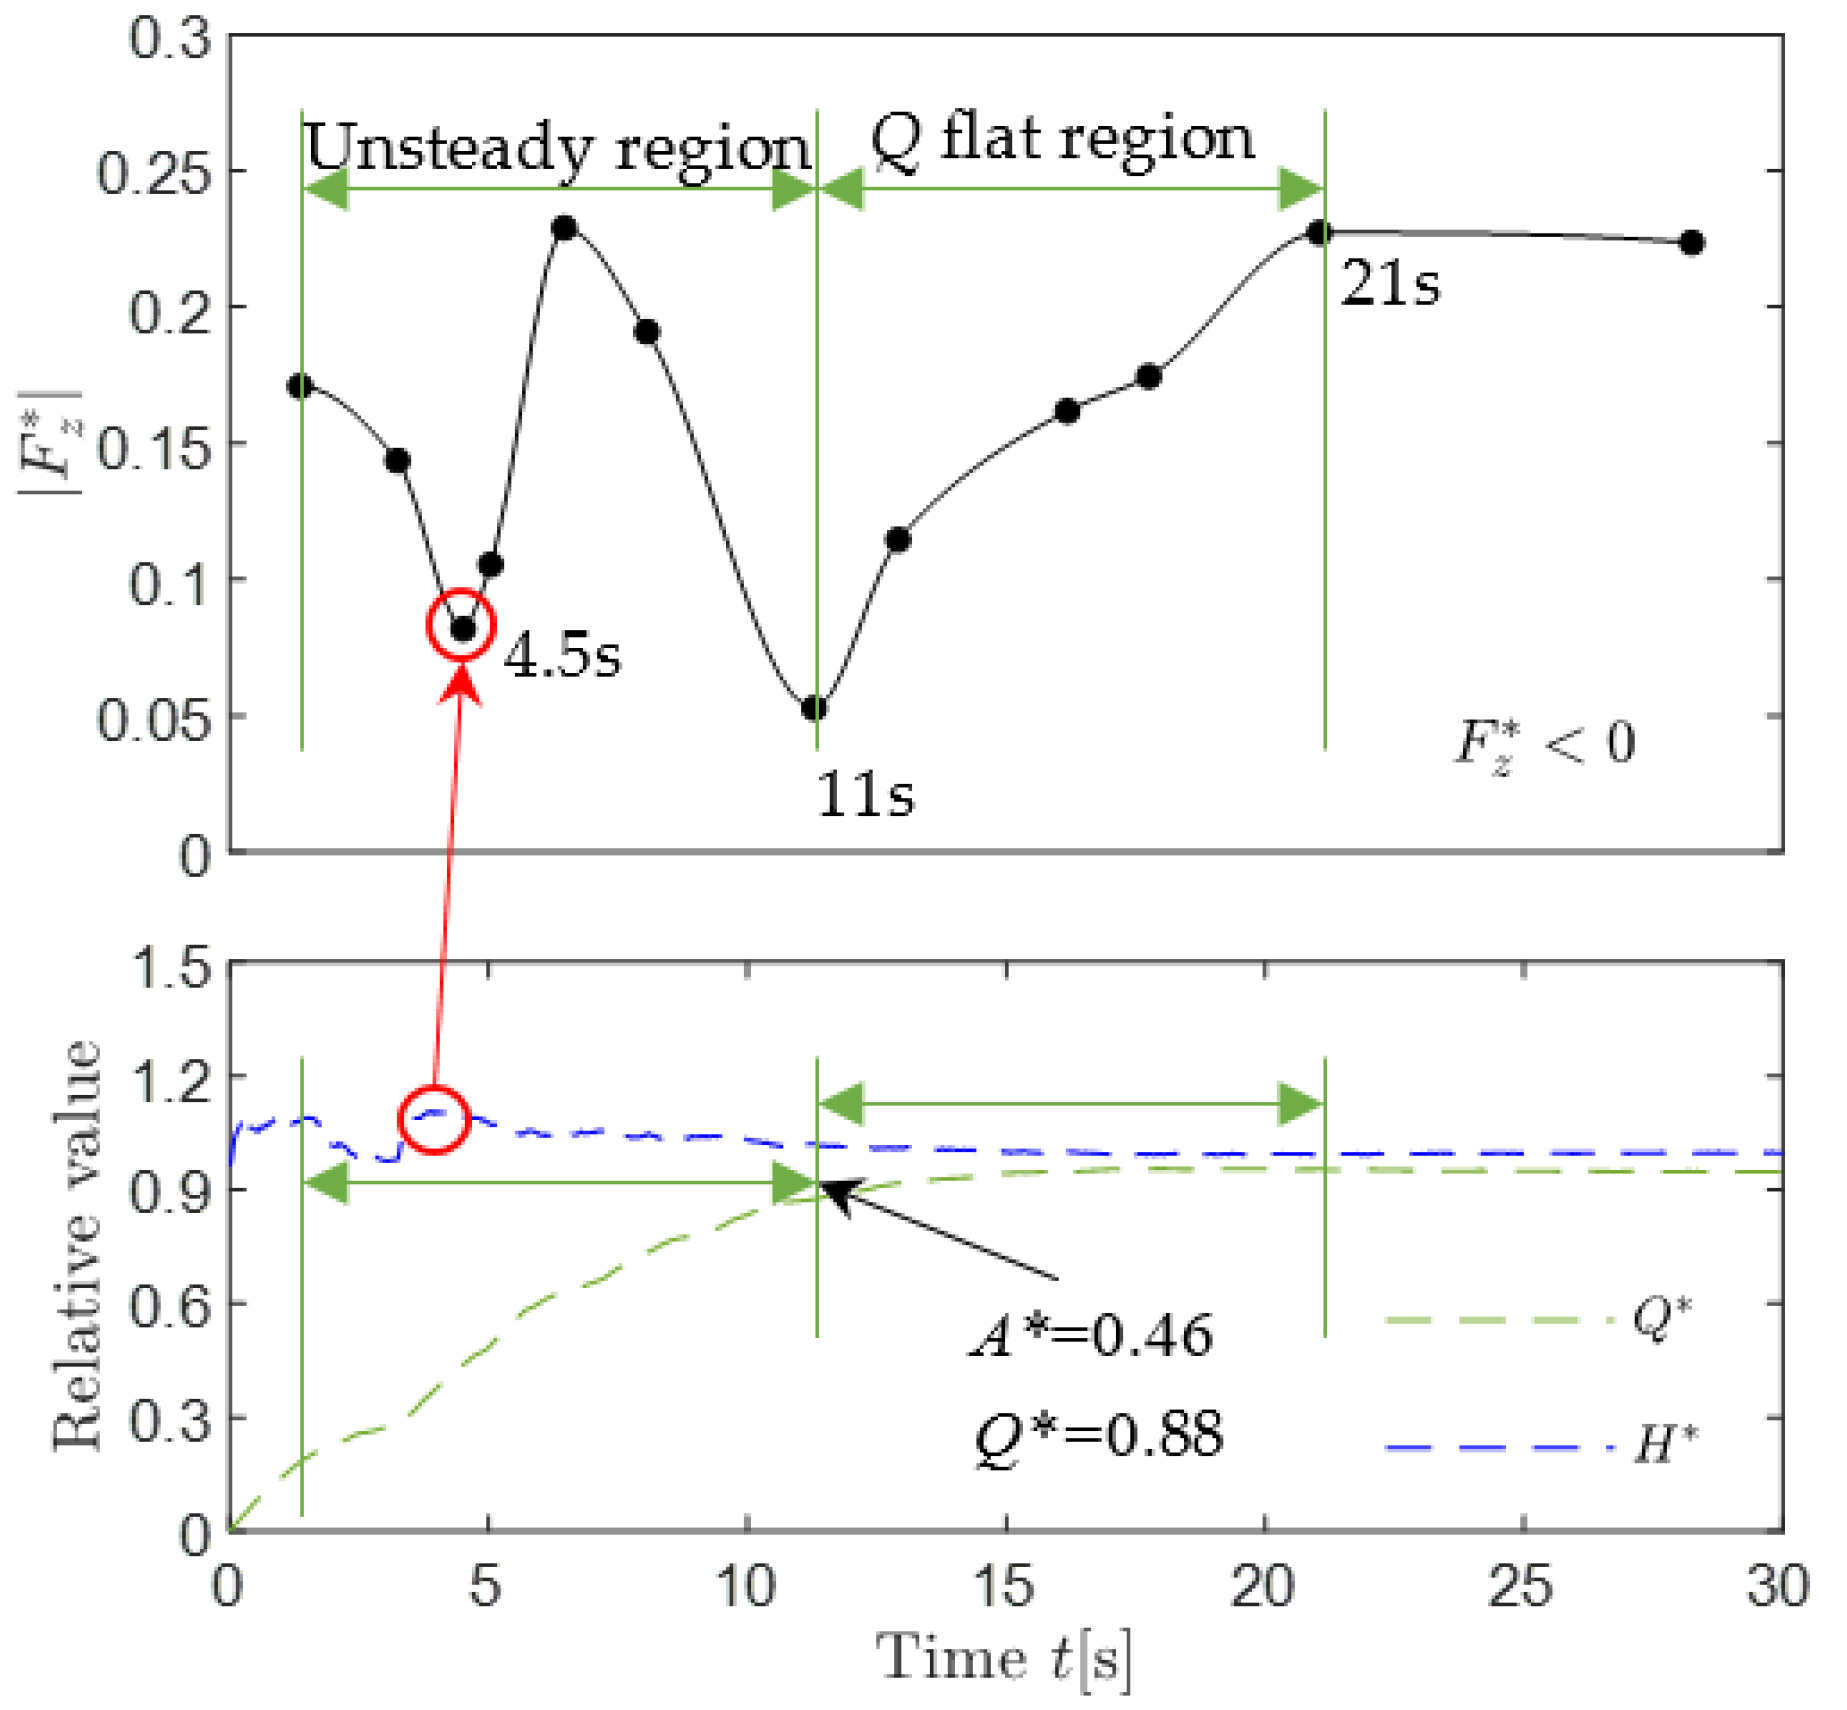
5.1.1. Characteristic and Development

Based on the CFD simulation at the STP, the development of total axial hydraulic force acting on runner during the starting up process is analyzed, as presented in Figure 12. The relative axial hydraulic force is defined as:
F z * = F z m t g
where mt is the weight of rotating components including the shaft system and runner.
In this paper, the downward axial force is defined as positive according to the definition of the +z direction. | F z * | is adopted to stress the magnitude of axial hydraulic force. To find out the mechanism of axial hydraulic force and its relationship with flow parameters of the turbine, the relative flow rate Q* and relative head H* from 1D hydraulic simulation are also shown in Figure 12 as a reference.
During starting-up, | F z * | is upward and changes between approximately 0.05 and 0.23. There, t = 0 corresponds to the onset of the opening up of the guide vane. In 0~4.5 s, | F z * | gradually decrease and reach the first local valley. During this period, H* reaches the maximum with fluctuation. Before t = 11 s, the guide vane has opened for 46% and Q* increases to 0.88. | F z * | suffers the largest fluctuation from 0.05 to 0.23. It can be found that the axial hydraulic force, head and flow rate are very fluctuant until the guide vane opens to 46%, which is about half of the maximum opening. This period is defined as the “unsteady region” where the phenomenon will be discussed in later sections. Then, Q* increases flatly when the guide vane is continually opening, while H* is almost constant. This period is defined as the “Q flat region”. It is worth stressing the point that | F z * | has a sharp increase and is strongly positively related to flow rate in this “Q flat region”.
In order to identify the axial hydraulic force on specific locations of the runner, the components of | F z * | are plotted in Figure 13. It may be helpful to have a clear knowledge of the variation mechanism of axial hydraulic force during the starting up process. As shown in Figure 13a, the directions of F z * on COS and BIS are downward and those on CIS and BOS are upward. It is very unstable for axial hydraulic force on the surface of the crown and band in the “unsteady region” while it is almost flat in the “Q flat region”. For the runner’s crown, | F z * | on COS is larger than CIS, so the resultant axial force acting on crown is downward, as shown in Figure 13b. For the runner’s band, the resultant axial force is upward as | F z * | on BOS is larger than BIS. It can be estimated that pressure in the leakages is higher than that in the runner. Hence, the axial hydraulic force on the outside surface of the runner is larger than on its inside surface. With the opening of the guide vane, the resultant force on the crown and band decreases with the increasing of the flow rate. The other point observed in Figure 13b is that the resultant force on the crown is smaller than that on the band. Figure 13c provides the | F z * | value on the blade with the comparison against that on the crown and the band. | F z * | on the blade is found downward because pressure on blade pressure side is always higher than that on the suction side. In the “unsteady region”, | F z * | on the blade increases with the opening of the guide vane because the differential pressure on the blade is increasing. In contrast, it decreases in the “Q flat region” as the guide vane is continually opening and the flow rate is flatly increasing. For the resultant force on the crown and the band, some fluctuations can be found in the “unsteady region”, as well as a slight increase in the “Q flat region”.
In summary, the process of pump mode’s starting-up should be divided to two parts—the “unsteady region” and the “Q flat region”—when discussing the characteristics of axial hydraulic force. The dividing point of two periods is that the guide vane opens to around half. In the two periods, obviously different axial hydraulic force characteristics and their relationships with flow parameters can be found. By analyzing the local components, it is found that the magnitude of axial hydraulic force on the runner’s local surface is 4~10 times the weight of the pump turbine unit, but in the opposite direction. The total axial hydraulic force is generated due to the counteraction among all the force components. The total | F z * | value is much smaller than these local axial force values. Therefore, because of the combined influence of local axial force, the resultant force develops according to a complicated law.

5.1.2. Mechanism Discussion

Pressure distribution in the runner and leakages is the key factor influencing axial hydraulic force. In order to discuss the mechanism of axial hydraulic force, Figure 14 provides the pressure coefficient Cp distribution on the cross-section view in runner domain and leakages at typical selected time points, t = 3 s, 4 s, 6 s, 11 s, 16 s, 21 s.
During the starting-up process, pressure reaches the lowest level at t = 11 s, accompanied with the smallest axial hydraulic force. Before reaching this point (in the “unsteady region”), unstable pressure development can be observed in the runner and leakages. At t = 4 s, the pressure level becomes lower than before and after. This is the time with the first valley value, as shown in Figure 12. Hence, the valley values of axial hydraulic force are, along with the lower pressure level in the “unsteady region”, at t = 4 s and 11 s. Moreover, in this period, the pressure in crown and band leakages are apparently higher than that in the runner. In contrast, there is a small difference of pressure between the runner and leakages from t = 11 s to 21 s. Pressure in the crown and band leakages remain almost unchanged in the “Q flat region”. At the same time, pressure in the runner near the draft tube increases with the flow rate.
Figure 15 shows the streamlines and relative velocity coefficient Cv in the mid-span of the guide vane at typical selected time points of t = 3 s, 6 s in the “unsteady region” and t = 16 s, 21 s in the “Q flat region”. The relative velocity coefficient Cv is defined as:
C v = v π n D 60
In the “unsteady region”, the guide vane opening is relatively small. The high-speed flow from runner is blocked in front of the guide vane and forms an obvious jet flow between two guide vane blades. Due to the disturbance of the jet, the twin-vortex flow structure can be seen in the vaneless region between the guide vane and the stay vane. This twin-vortex flow structure causes strong local blockage in the guide vane. Therefore, the flow blockage leads to high-pressure in the runner and leakages. The twin-vortex causes the flow pattern to be significantly more turbulent and unstable. This is the reason why axial hydraulic force fluctuates in this period. With the guide vane opening becoming larger in the “Q flat region”, the flow pattern in the guide vane becomes well-behaved with no obvious separation and vortex. The axial hydraulic force develops stably with a positive correlation against flow rate. It is worth noting that the flow pattern distribution in the guide vane is asymmetric in the later period during starting-up. This phenomenon will be discussed in the following sections.

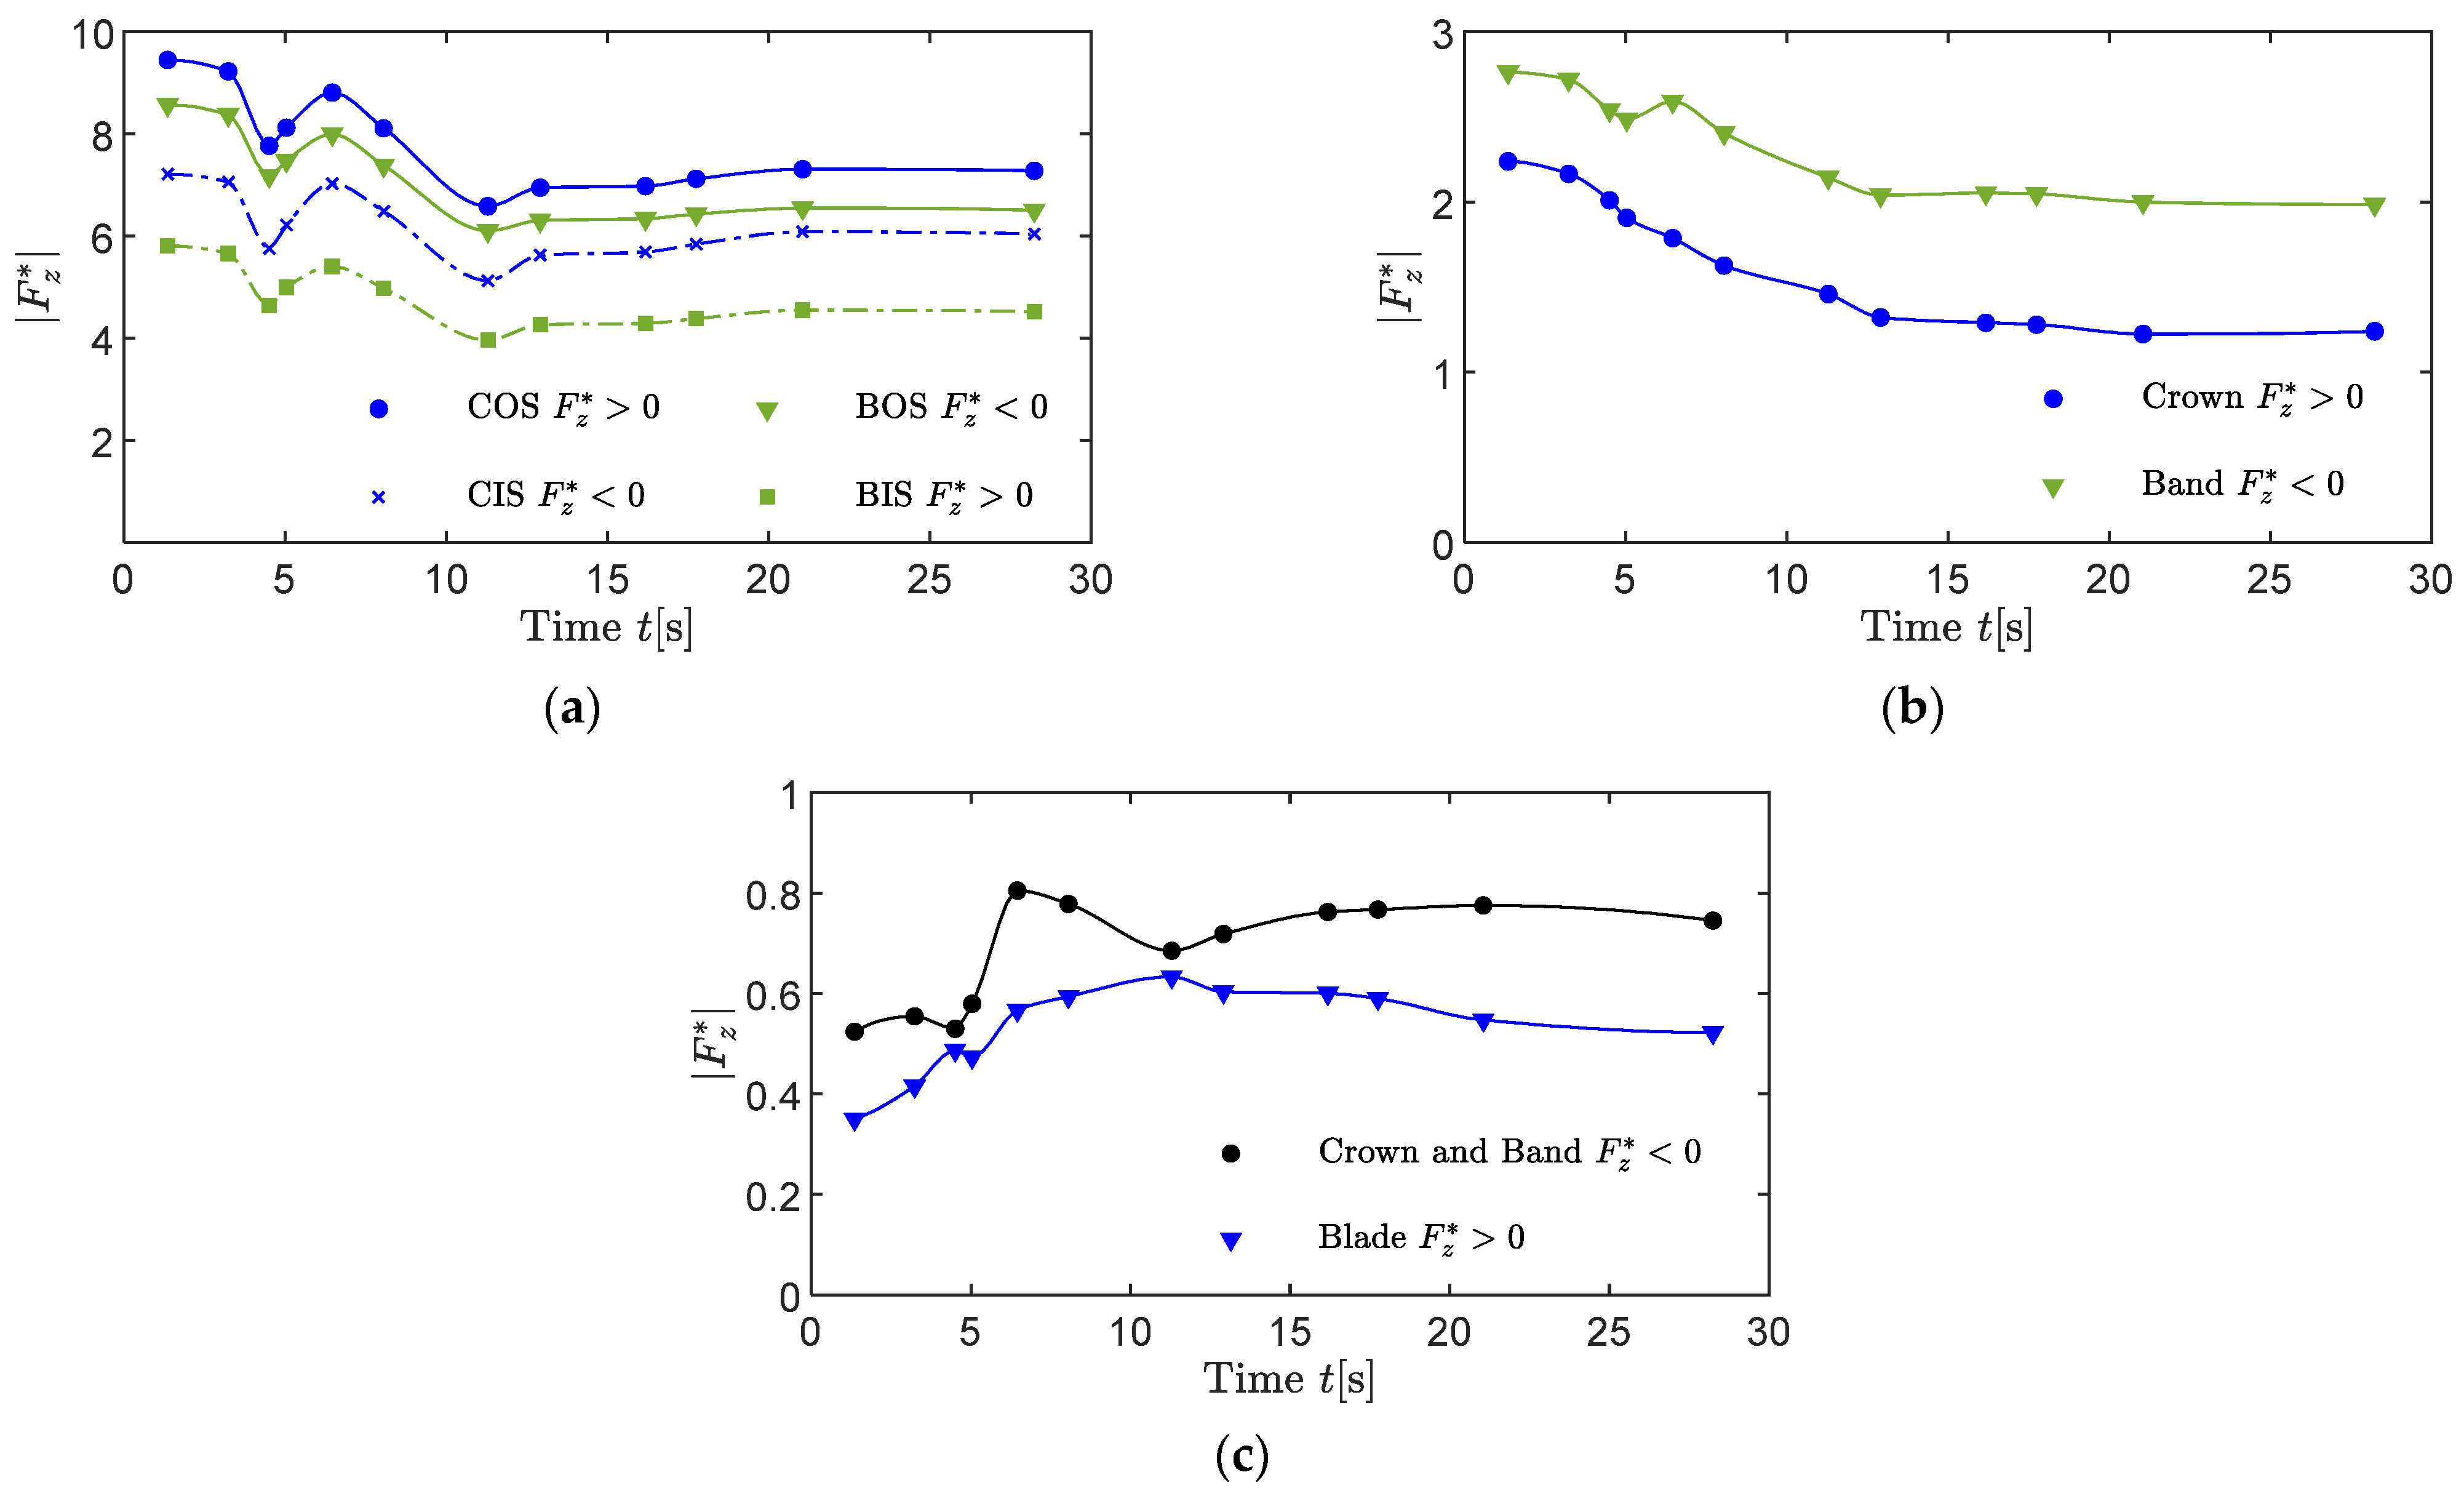
5.2. Structural Characteristic of Unit

Based on the FEM method, structural simulation of pump turbine unit, including the support bracket, shaft and runner, is conducted during pump mode’s starting-up process. The hydraulic force on the runner and leakages are obtained from the CFD results above. It is loaded on the fluid–structure interface based on the one-way FSI method. The Von-Mises stress σ and axial deformation D, which influence the operation safety of the pump turbine, are the main parameters in the structural simulation.

5.2.1. Deformation

The deformation Dmax distribution on the main shaft and support bracket are almost constant during starting-up, as shown in Figure 16 and Figure 17 at t = 21 s. In this paper, the downward deformation is positive. The Dmax of the main shaft is 1.3 mm at t = 21 s and the location is at the top of shaft. It is noted that the end of the shaft, which connects the runner, has the smallest deformation. This means that the shaft is pushed upward because of centrifugal force. The Dmax of the support bracket is 0.35 mm at t = 21 s and the location is at the thrust seating, which bears the axial hydraulic force and the self-weight of rotating components. The deformation decreases as the radius increases since the ends of the support arms are fixed.
Figure 18 shows the Dmax variation of the main shaft and support bracket during pump mode’s starting-up process. To emphasize the effect of hydraulic force, the deformation without hydraulic force is plotted as a reference. The resultant force on the crown and band is also shown as a reference. The total axial force F z T acting on the shaft and bracket can be calculated as:
F z T = F z H + F z W
where F z H is the hydraulic axial force and F z W is the self-weight of rotating components.
Based on Equation (7), there is the relationship that D F z T . Since F z W is constant, it is the case that D F z H . The finding that the axial deformation of the main shaft and support bracket do not relate to the total axial hydraulic force is unexpected. However, it relates to the resultant axial hydraulic force on the crown and band ( F z C B ). As Figure 18 shows, when hydraulic force has not been loaded on the fluid–structure interface, the Dmax of the shaft and bracket is 3.2 mm and 0.85 mm. The hydraulic force makes Dmax decrease, as a result of the upward axial hydraulic force. At the initial point of starting-up, Dmax is the largest, with values of 2.35 mm for the shaft and 0.63 mm for the bracket. Dmax of the shaft and bracket have similar tendencies during starting-up. They decrease before t = 6 s and reach the first valley value, which corresponds to the first valley of F z C B . Then, they increase and reach the peak value at t = 11 s which corresponds to the first peak of F z C B . In the “Q flat region”, the Dmax of the shaft and bracket decrease and correspond to the F z C B with a similar tendency. It indicates that the resultant axial hydraulic force on the crown and band plays a principal role that affects the deformation of the shaft and bracket. However, the axial force on the blade has only a slight effect. This is a new breakthrough understanding because total axial hydraulic force was, previously, usually regarded as important. Now, the influence of the resultant axial hydraulic force on the runner’s crown and band should be specially focused.
Unlike the shaft and bracket, a developing distribution of the runner axial deformation during starting-up is shown in Figure 19. Initially, the D distribution of the runner is radial-symmetric. The Dmax is 1.65 mm and the location is at the outer edge of the crown. The Dmin is at the bottom of the band (shown in Figure 19a) due to the effect of centrifugal force. However, at t = 6 s, there are different degrees of deformation between the two sides of the runner. As shown in Figure 19b,c, the maximum is at one side of the outer edge of the crown while the minimum is at the other side, at the bottom of the band. In the later period of the starting-up process, the runner is obviously deflected with the nodal diameter as midline. Dmax and Dmin are, respectively, at the two sides outer edge of crown, as shown in Figure 19d. Considering the operation of the pump turbine, it is important to find out this phenomenon. This is because the deformation on the crown and band may change the size of leakages and then influence the leakage flow field.
In order to understand the runner deflection, based on the location of Dmax and Dmin at t = 21 s (marked as D1 and D2 in Figure 19d), the deformation development is provided in Figure 20. During starting-up, the maximum location is at D1 all the time. The variation of Dmax of the runner has a similar tendency to those of the shaft and bracket as a result of the superposition of deformation. The largest Dmax is 1.7 mm at t = 11 s. After that, the Dmax is at lower values of around 0.75~1 mm. In terms of D2, it is very close to D1 at the beginning. With the increase in guide vane opening, the difference between D1 and D2 also increases. Figure 21 provides the development of Δ D = D 1 D 2 which provides a visualized illustration. According to the asymmetric streamlines in the guide vane region, as shown in Figure 15, a possible explanation is that the increasing of the flow rate leads to a more serious asymmetric flow field distribution as the volute are asymmetric. This may induce the large runner deflection phenomenon.
To illustrate the reason of runner deflection, the pressure distribution of COS and BOS are found to be asymmetric in the later part of starting-up, when t = 21 s, as shown in Figure 22. It is obvious that the pressure distribution at 135° direction of both COS and BOS are smaller than that of the opposite direction. As the direction of axial hydraulic force of COS and BOS is opposite and the effects would be counteracted against each other, the pressure distribution on every 45° line (as marked in Figure 22a) of COS and BOS is provided in Figure 23 for comparison. R* is the relative radial distance where R* = 2R/Dhi. In COS and BOS, Cp of PL4 is the largest while that of PL2 is the smallest. It can be compared to the difference between the PL4 and PL2 of COS, which is larger than that of BOS, which means that COS plays the principal role in affecting the runner deflection. In this case, it can be summarized that the downward hydraulic force on the D1 side is larger than that on the D2 side. Therefore, the deflection of runner can be well explained.

5.2.2. Von-Mises Stress

Unlike the deformation of the runner, the Von-Mises stress distribution and the σmax location on the runner are almost constant during starting-up. It is also almost constant on the support bracket. The stress of the main shaft, which is very small, is not discussed in detail in this case. Figure 24 and Figure 25 show the distribution of Von-Mises stress on the support bracket and runner at t = 21 s. The maximum stress of the support bracket concentrates on the connection between the thrust seating and the support plates. The maximum stress value is about 90.2 MPa at t = 21 s. However, the strength of other sites is strong enough as the stress is only around 10 MPa. For the runner, the stress concentration occurs on the connection between the crown and the leading-edge of the blade. The σmax of the runner is about 105.8 MPa at t = 21 s and that of the other regions is less than 60 MPa.
Figure 26 shows the σmax development of the support bracket and the runner during starting-up. For the support bracket, the σmax development has a similar trend with deformation. It is principally influenced by the resultant force on the crown and band. The largest σmax of the support bracket is 172.8 MPa at the beginning of starting-up. As guide vane opens completely, σmax reaches the smallest value of 90.2 MPa. It indicates that the beginning of starting-up should be focused when considering the strength and safety of the support bracket. Differently, the σmax of the runner reaches the peak value of 134.1 MPa at t = 11 s. It is obvious that the stress of the runner is not only influenced by the hydraulic force on the crown and band but also affected by the blade force. In this paper, the axial hydraulic force is mainly focused. The radial and circumferential force components and their influence on structural stress will be discussed in future research.

6. Conclusions

This paper studied the axial hydraulic force characteristics on the runner in a pump turbine case during the starting up of the pump mode. Conclusions can be drawn as follows:
  • According to the features of axial hydraulic force, the pump mode’s starting-up process can be divided into two parts—those of the “unsteady region” and the “Q flat region”. In the “unsteady region”, the axial hydraulic force and its components are obviously fluctuant. In the “Q flat region”, the axial hydraulic force shows a strong positive relationship with flow rate. The dividing point of these two regions is, approximately, at the half-opening of the guide vane. The components of axial hydraulic force are in different directions at different positions. Therefore, the total axial hydraulic force is formed by the counteraction among force components. It is the main reason for the complexity of axial hydraulic force characteristics.
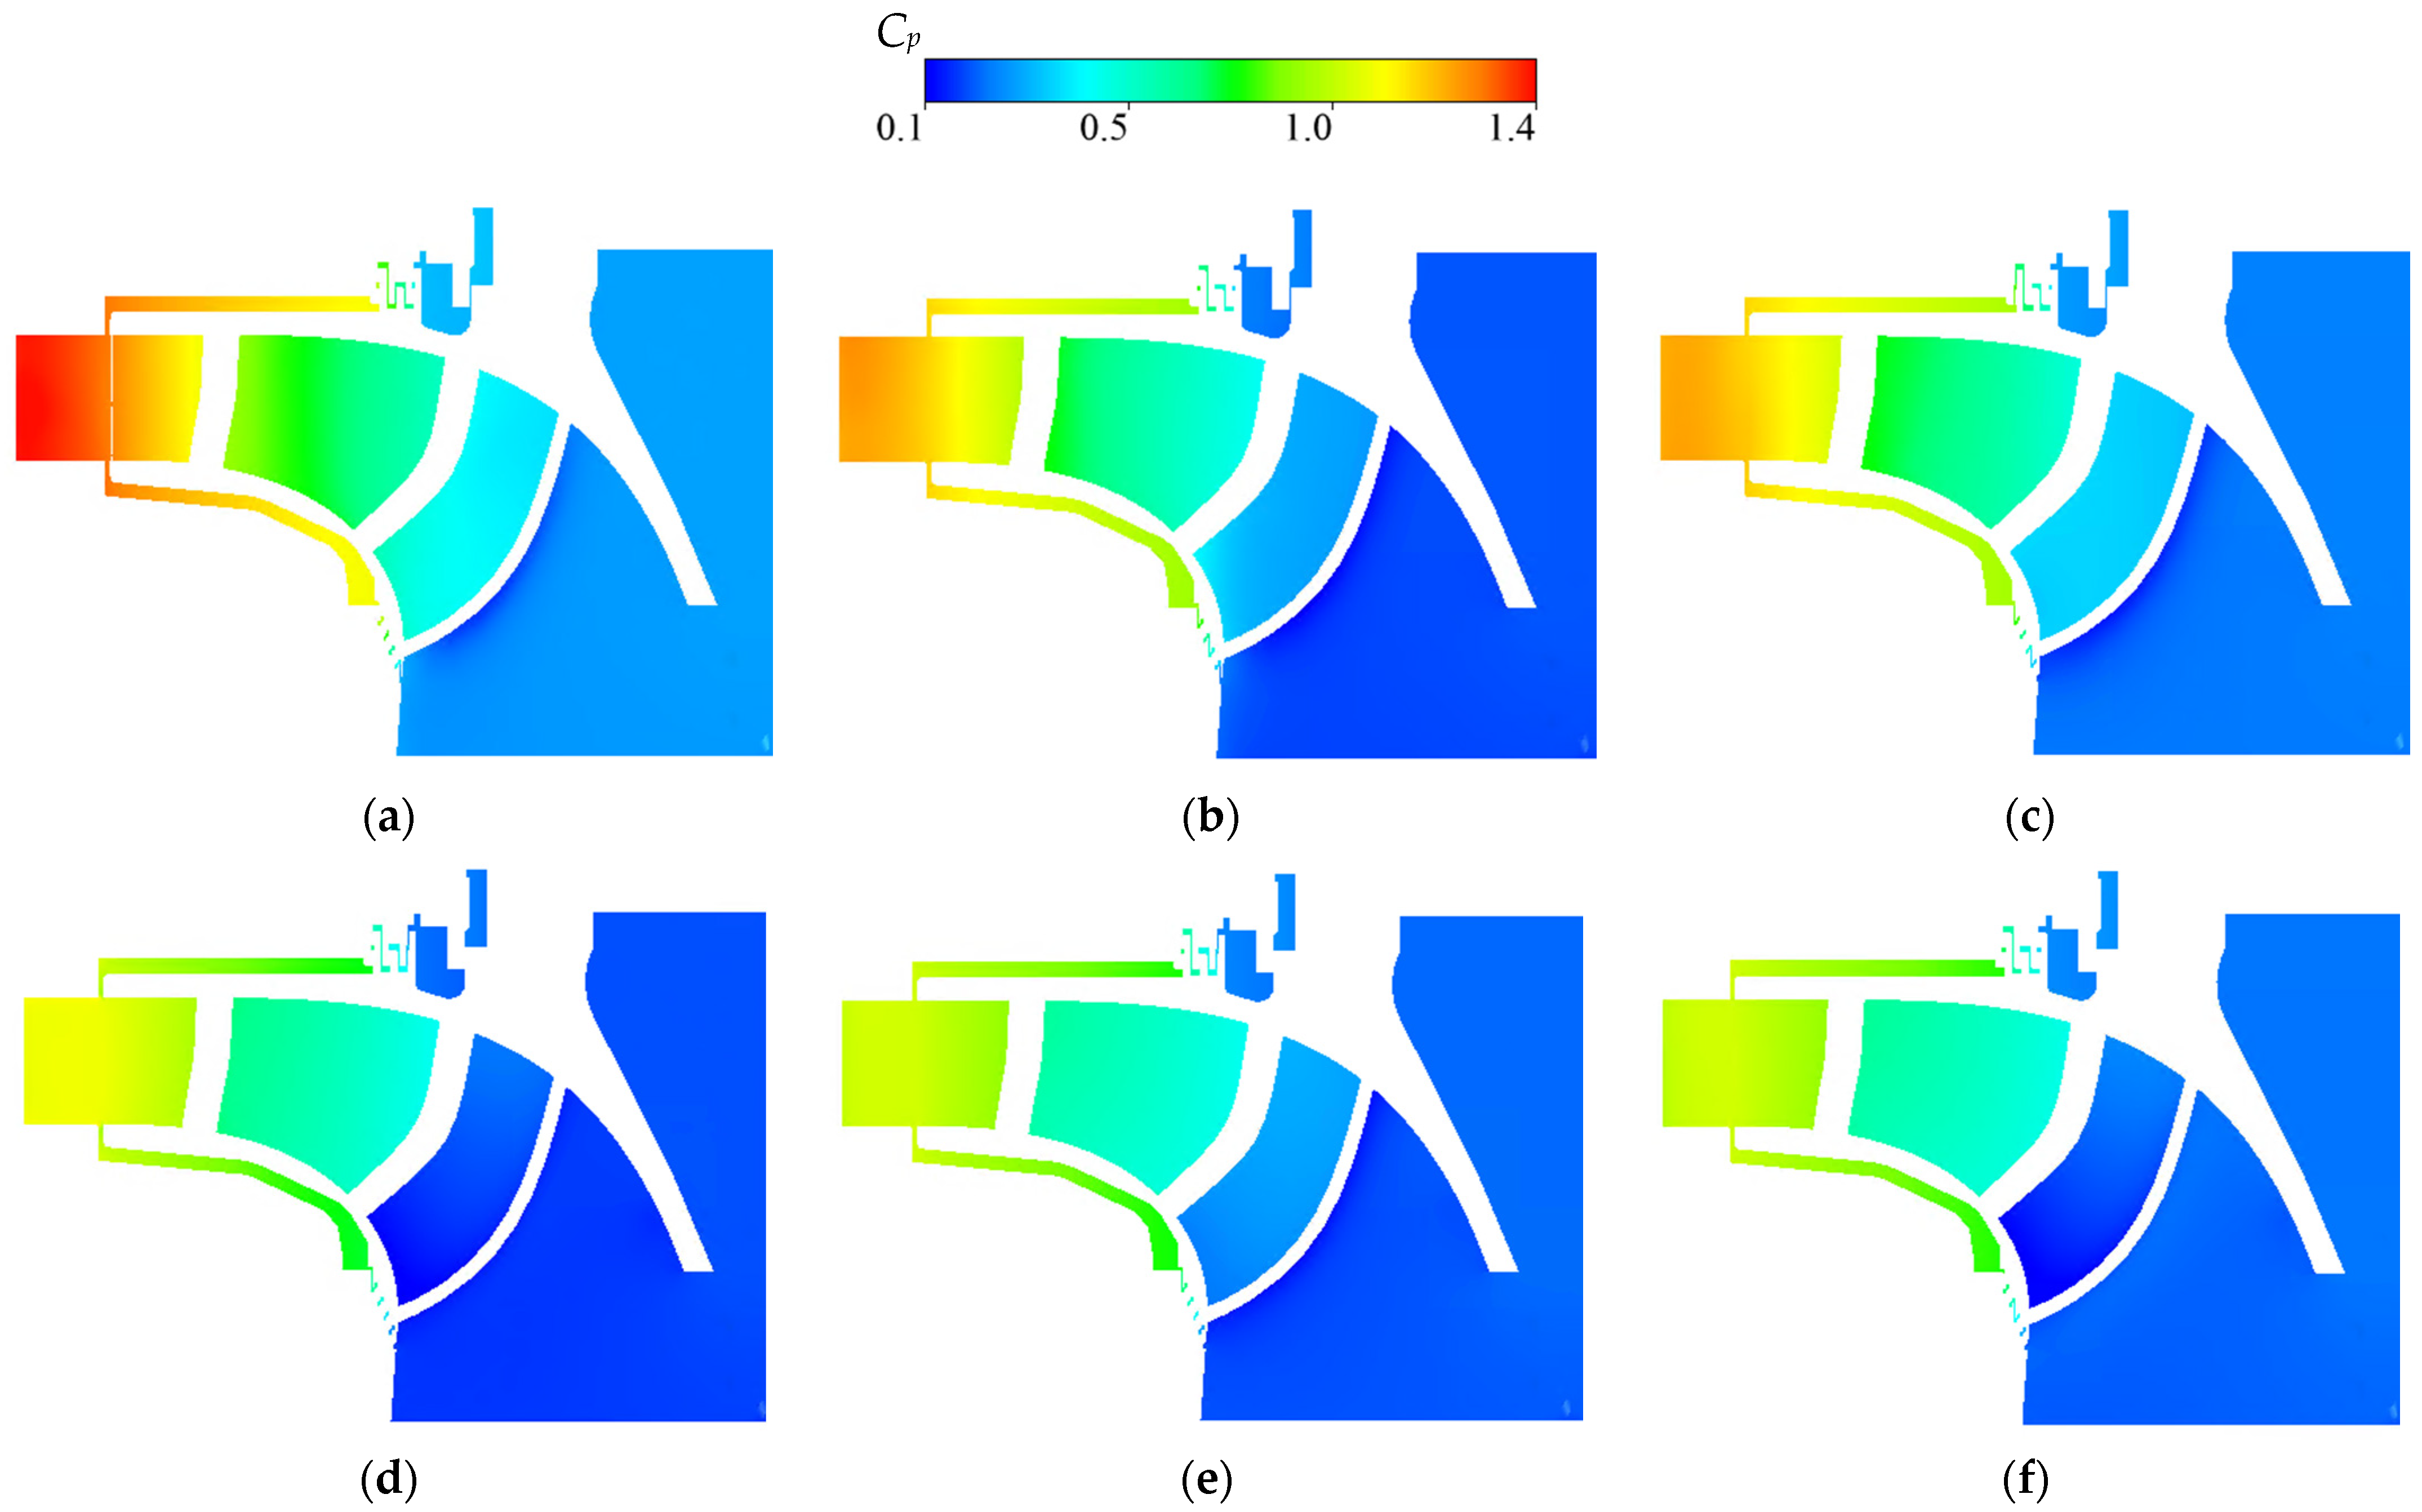
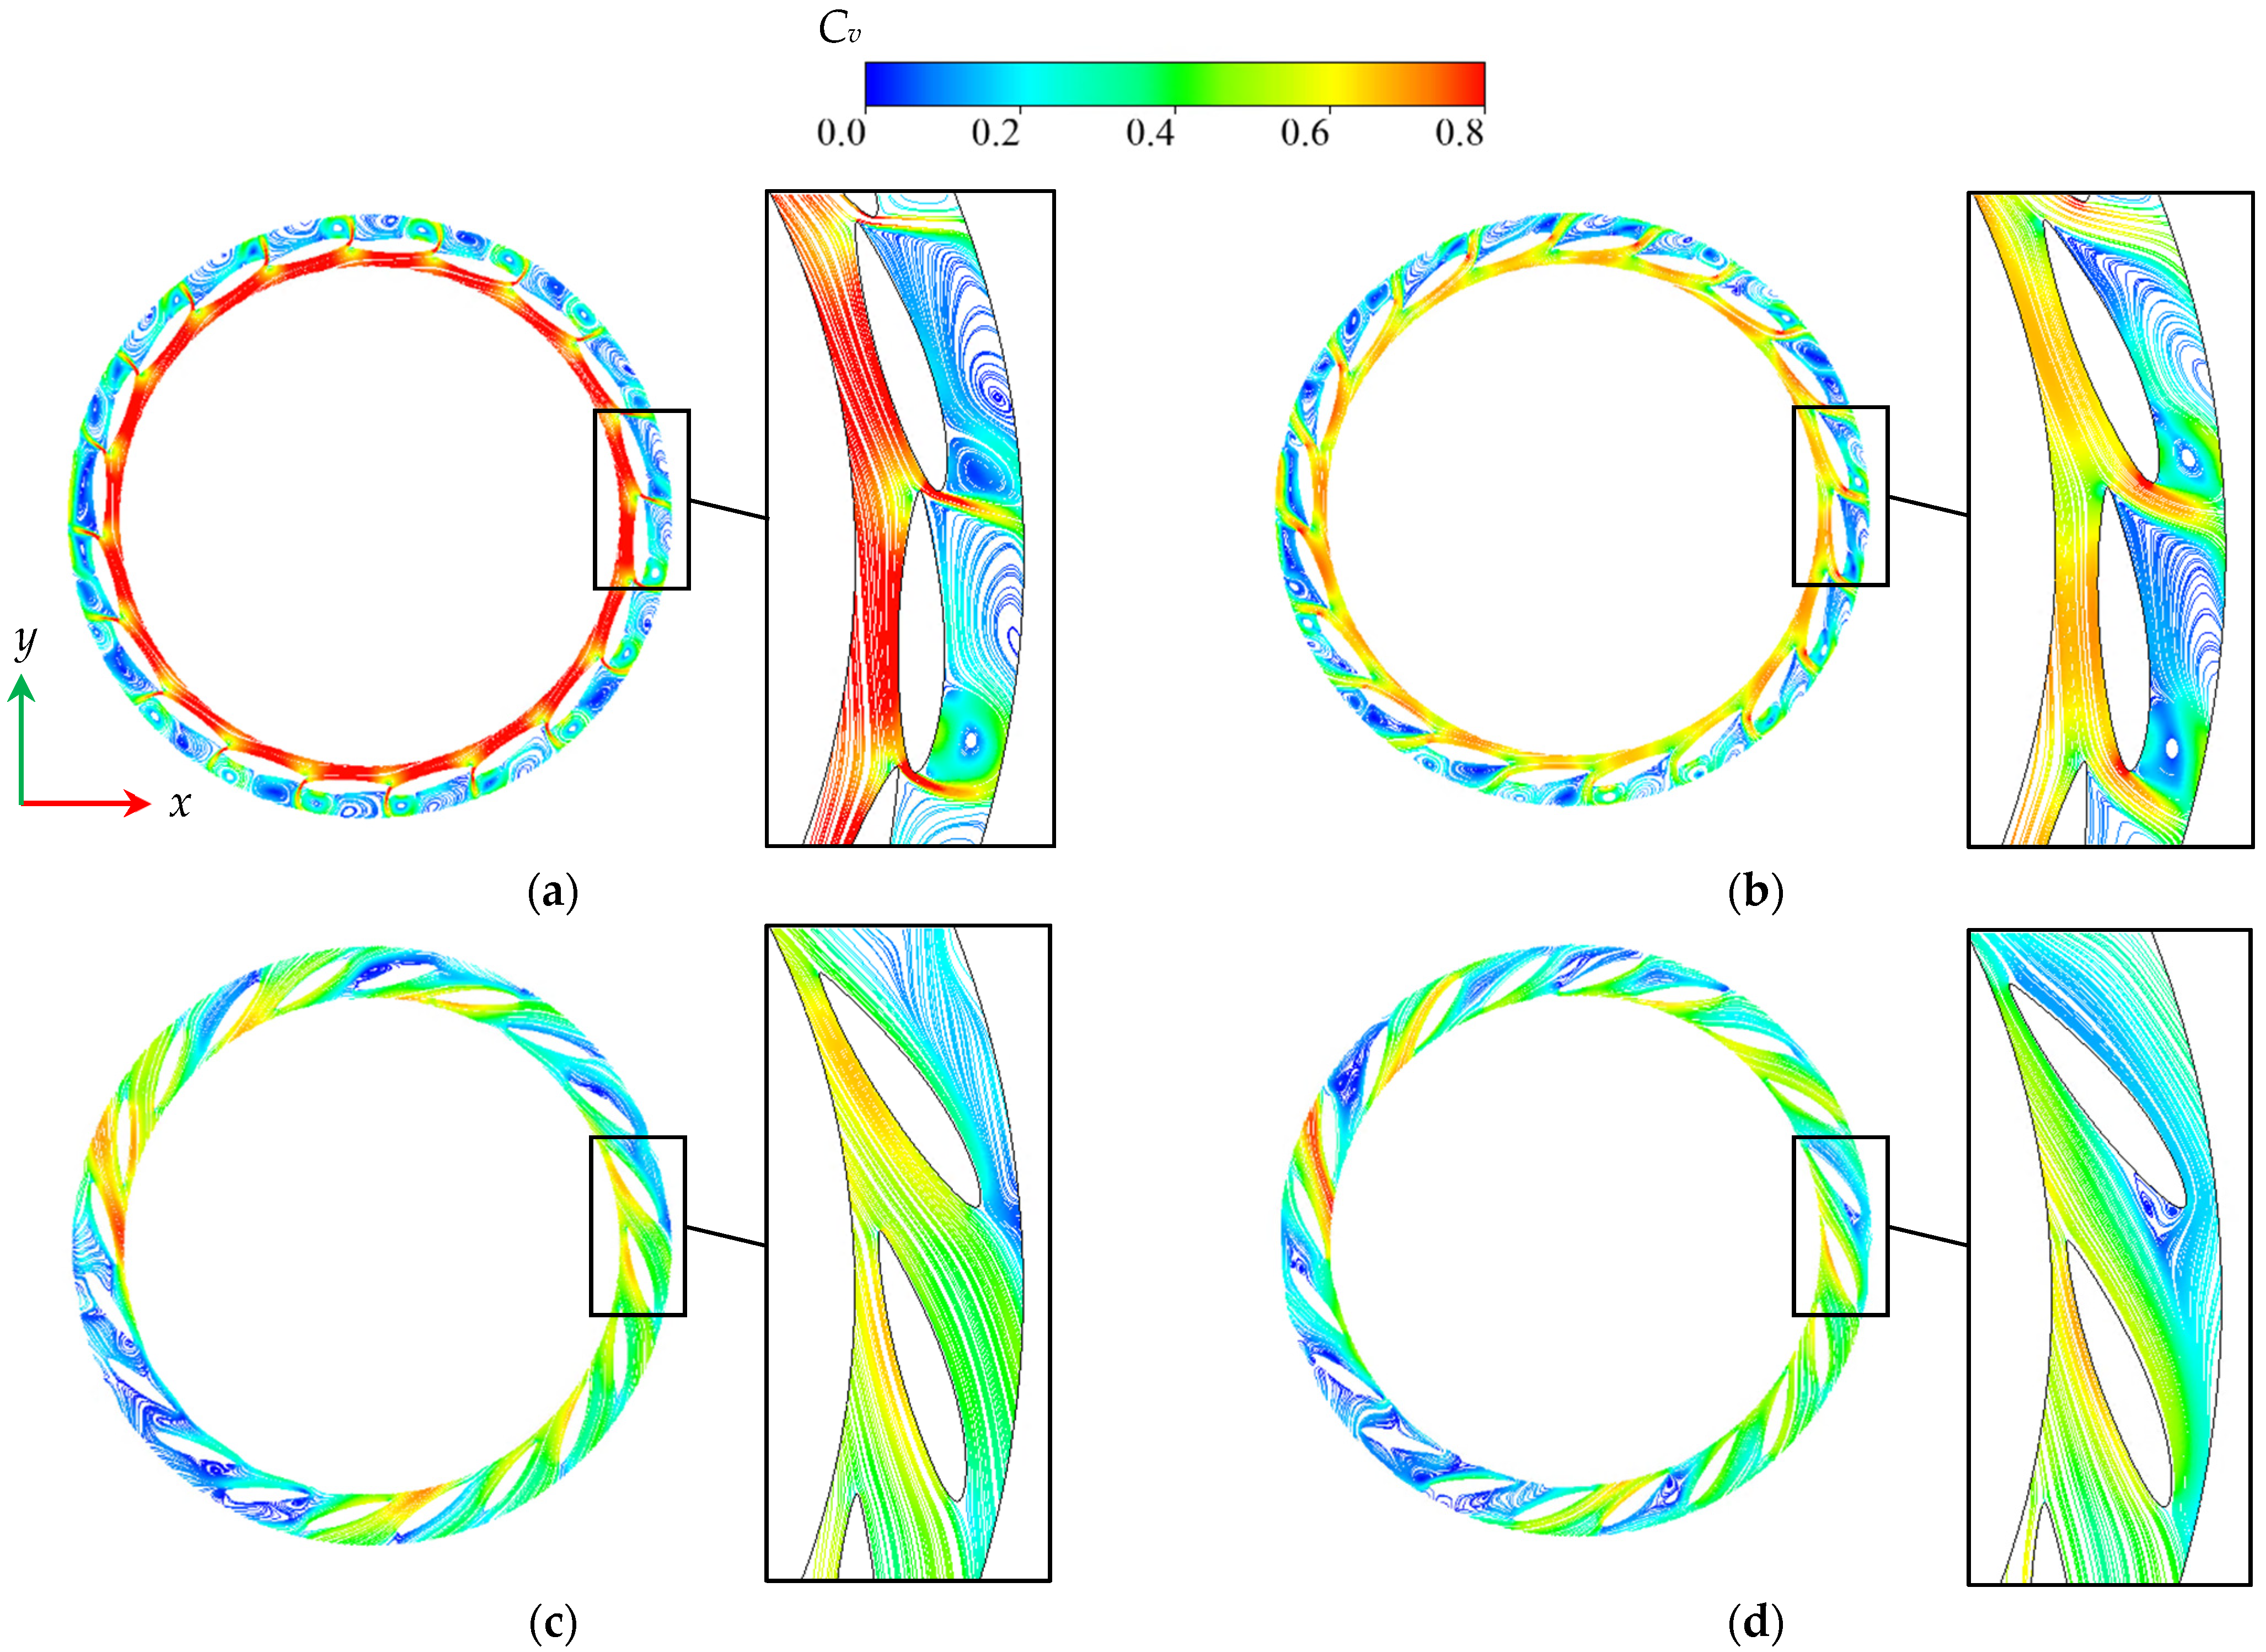
  • The pressure distribution in the runner and leakages and the streamline in the guide vane region enabled the identification of the mechanism of axial hydraulic force development. In the “unsteady region”, the pressure is obviously unstable. Pressure in the runner’s crown and band leakages is apparently higher than in the runner. A twin-vortex flow structure can be observed in the vaneless region between the guide vane and the stay vane with strong flow blockage. In the “Q flat region”, the pressure in the crown and band leakages remains almost unchanged, while the flow regime in the guide vane is well-behaved. It is worth noting that the flow pattern distribution in the guide vane is asymmetric in the later period of the starting-up process.
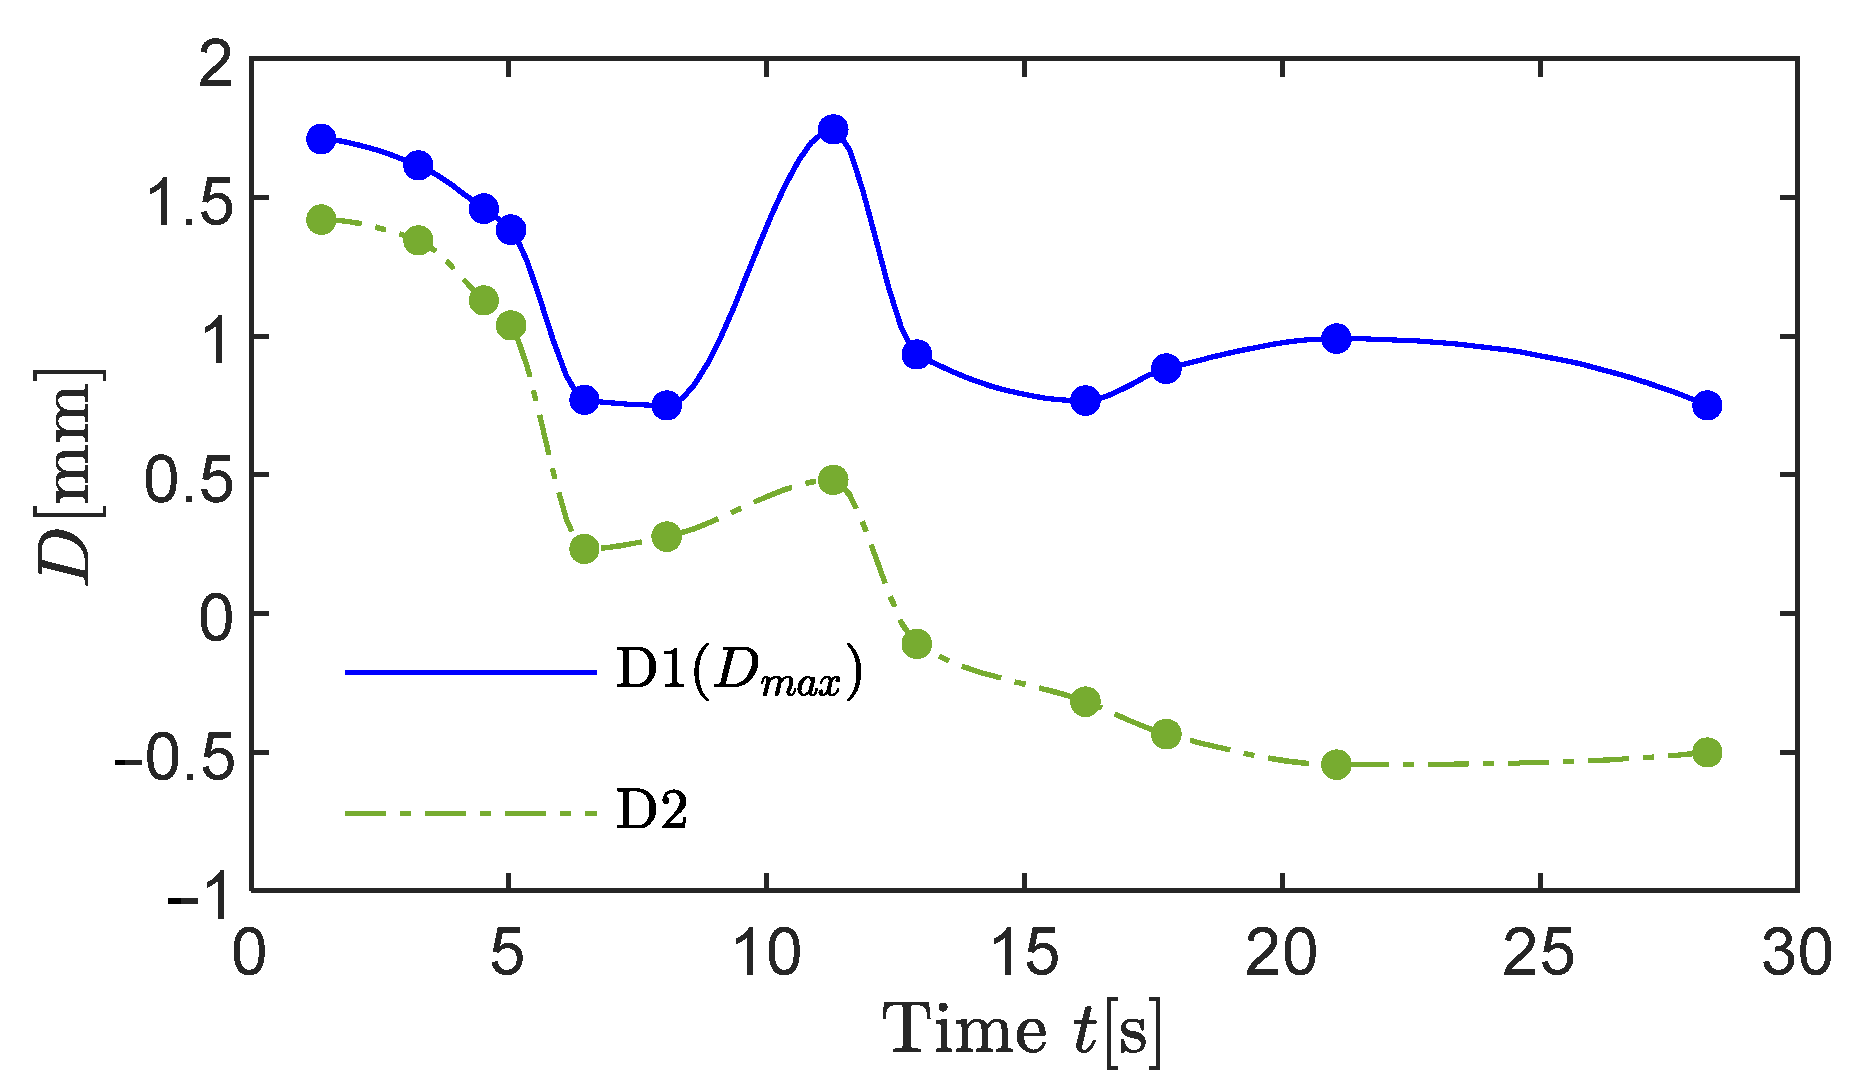
  • The maximum deformation of the main shaft is located at the top of shaft. The maximum deformation of the support bracket is on the thrust seating. The finding that the resultant axial hydraulic force on the crown and band plays a principal role in affecting the deformation of the shaft and bracket is unexpected. However, the axial force on the blade has just a slight effect. The deformation on the runner is radially symmetric at the beginning of starting-up, while the runner clearly deflects with the nodal diameter at the midline in the later period. The reason is found to be the asymmetric pressure distribution of COS and BOS. Among them, COS plays the principal role.
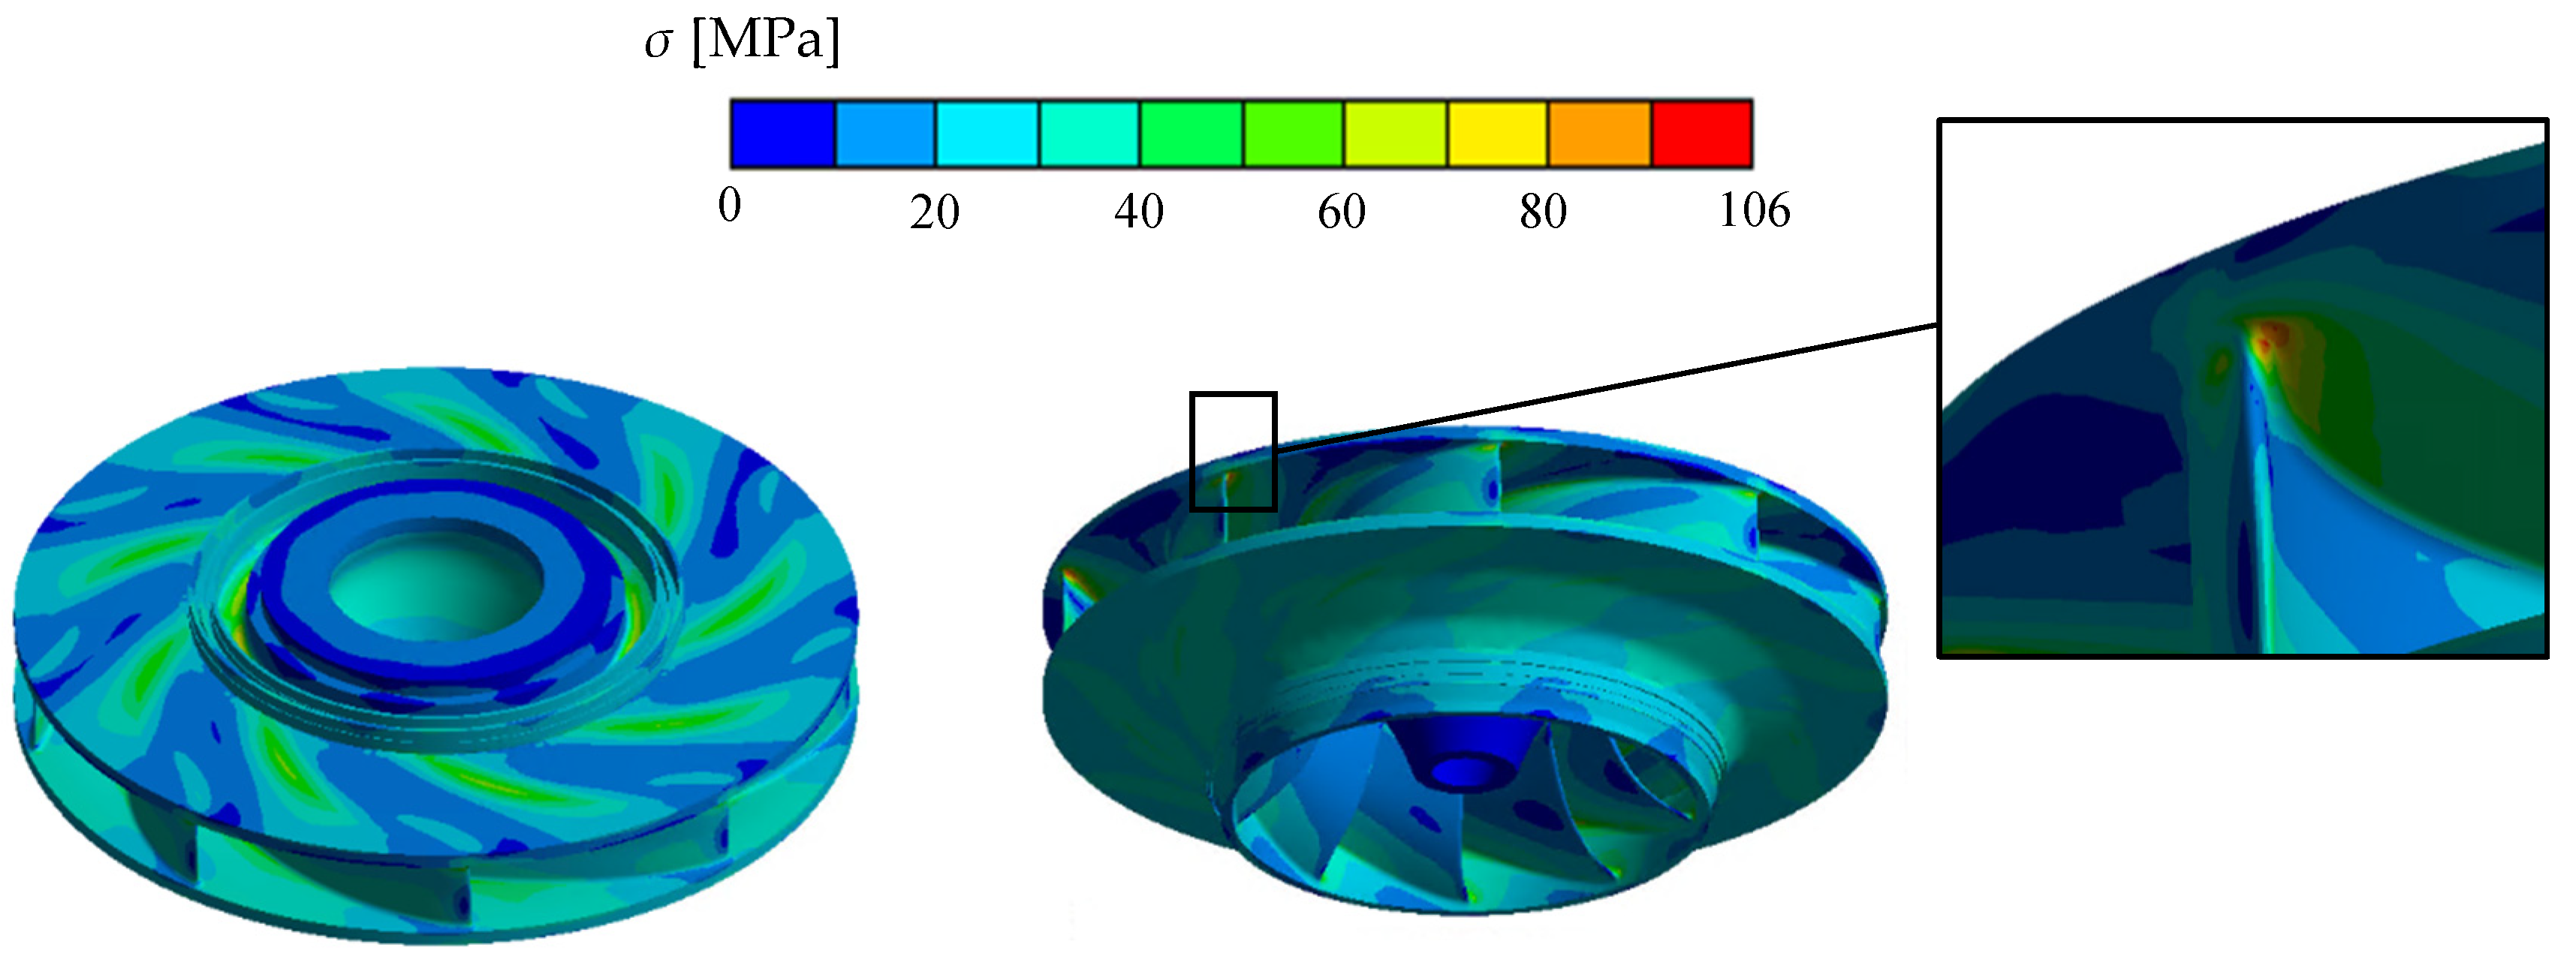
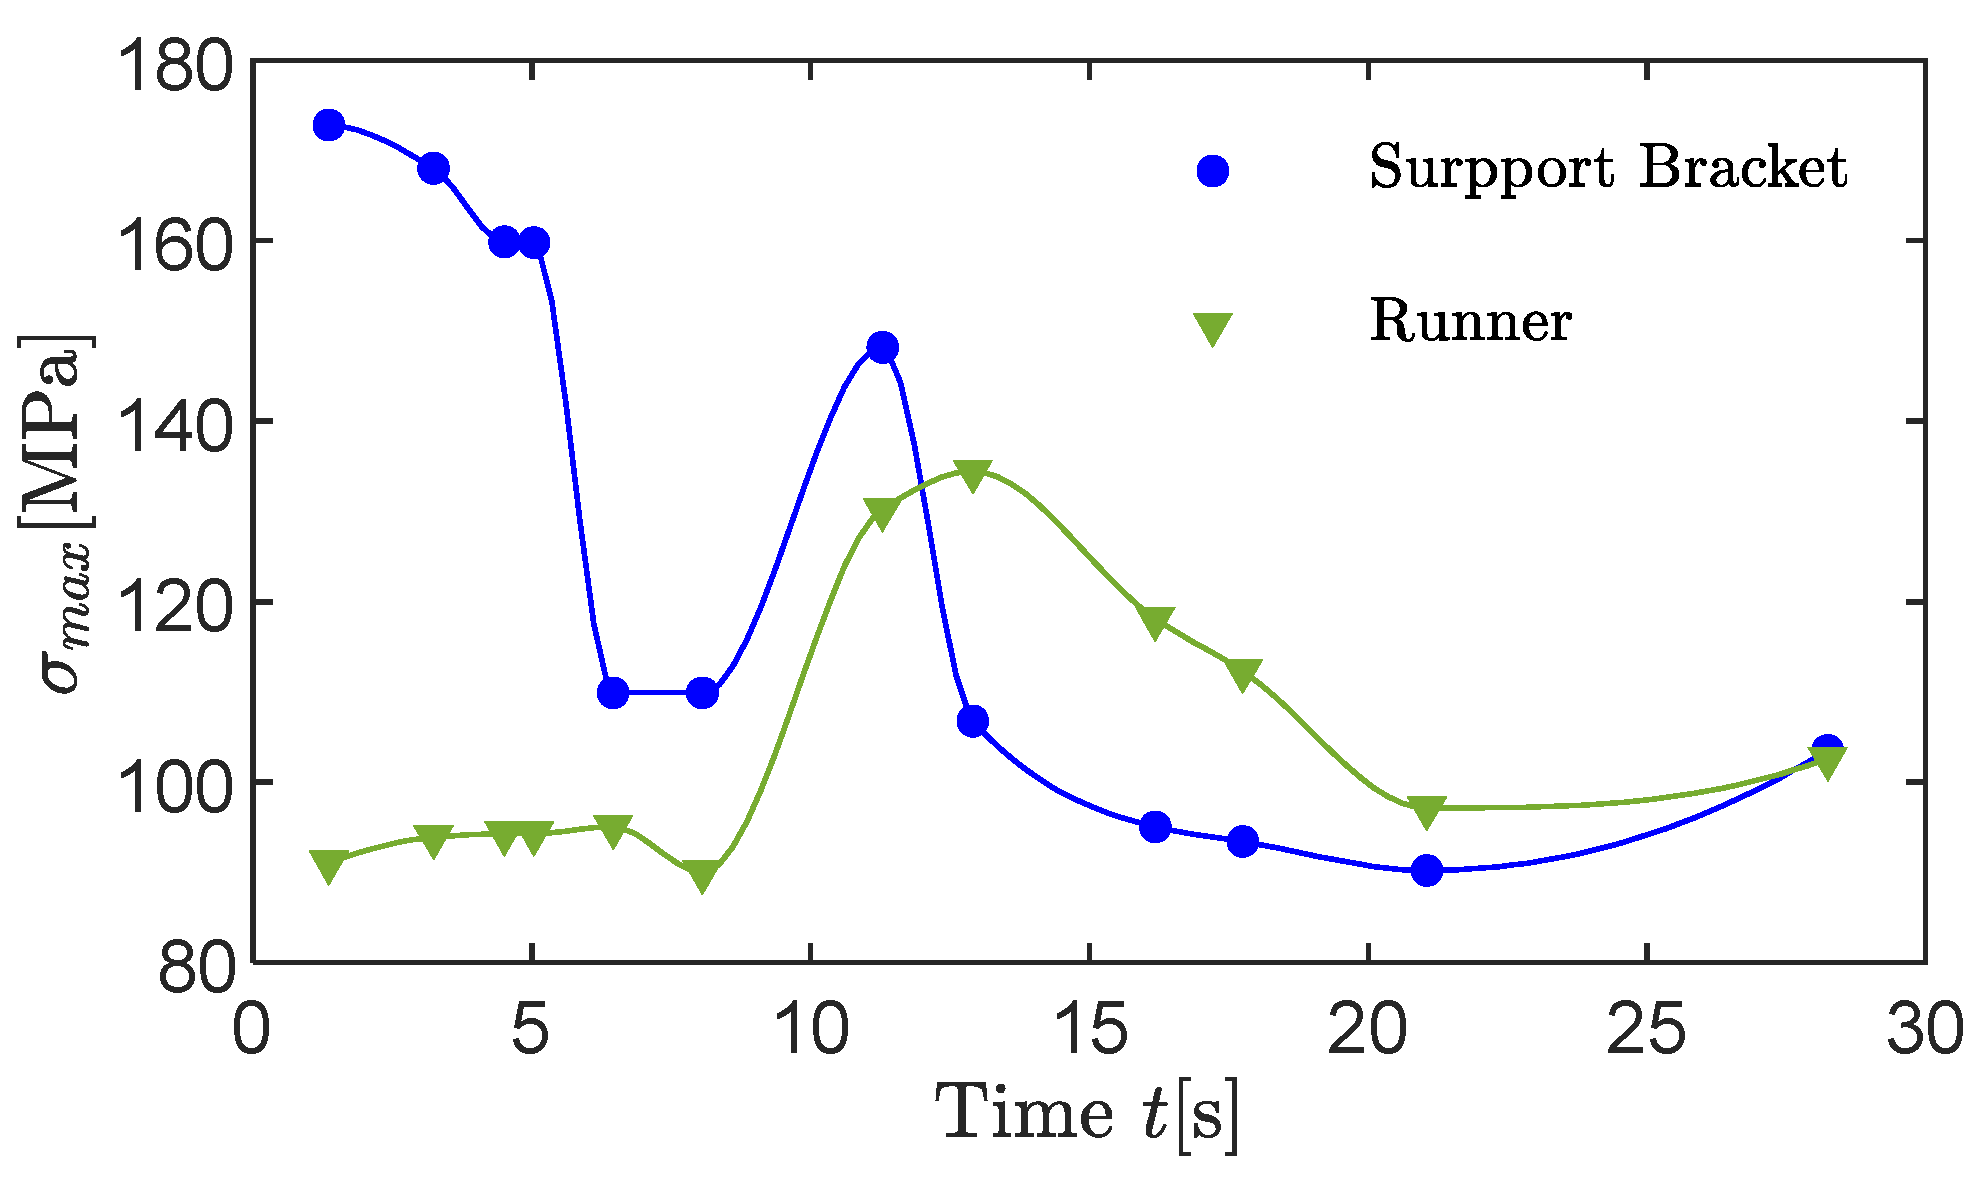
  • The maximum stress on the support bracket concentrates on the connection between the thrust seating and the support plates. The maximum stress on the runner is on the connection between the crown and the blade inlet edge. The σmax development of the support bracket has a similar tendency with the development of deformation. The stress on the runner is found not only to be influenced by hydraulic force on the crown and band, but also to be affected by the blade force.
Finally, this paper will be helpful in realizing the axial hydraulic force of the pump turbine during the starting-up of the pump mode and can provide support for the design of structural components. In the further works in the future, the transient characteristics of axial hydraulic force, vibration and structural dynamic stress should be analyzed and discussed in order to facilitate further improvement in more actual engineering cases.

Author Contributions

Conceptualization, Y.L. and Z.W.; Data curation, R.T.; Formal analysis, Z.M. and H.F.; Resources, R.T. and H.B.; Software, Z.M. and F.C.; Supervision, R.T. and Y.L.; Validation, F.C. and J.C.; Visualization, J.C.; Writing—Original draft, Z.M.; Writing—Review & editing, Z.M. All authors have read and agreed to the published version of the manuscript.

Funding

This research was funded by National Key R&D Program of China, grant number 2016YFC0401905 and National Natural Science Foundation of China, grant number 51909131.

Institutional Review Board Statement

Not applicable.

Informed Consent Statement

Not applicable.

Data Availability Statement

Not applicable.

Acknowledgments

This study is financially supported by the National Key R&D Program of China No. 2016YFC0401905 and the National Natural Science Foundation of China No. 51909131. Fujian Xianyou Pumped Storage Power Station provided strong technical support to the work, especially with help in the on-site prototype tests.

Conflicts of Interest

The authors declare no conflict of interest.

References

  1. Zhang, Y.; Wu, Y. A review of rotating stall in reversible pump turbine. Proc. Inst. Mech. Eng. Part C J. Mech. Eng. Sci. 2016, 231, 1181–1204. [Google Scholar] [CrossRef] [Green Version]
  2. Zhang, J. Study on Thrust Support Types of Vertical Axis Hydraulic Turbine Generating Unit. Large Electr. Mach. Hydraul. Turbine 2014, 1, 52–56. [Google Scholar]
  3. Huang, D.; Yuan, B.; Yu, Z. Treatment of Machine Lifting for Kaplan Turbine. Water Resour. Power 2009, 27, 161–162. [Google Scholar]
  4. Wu, G.; Zhang, K.W.; Dai, Y.F. Influences of the Runner Gap and Seal Construction on the Safety in Operation of Francis Water Power Sets. Large Electr. Mach. Hydraul. Turbine 2005, 1, 44–48+52. [Google Scholar]
  5. Li, Z.; Bi, H.; Karney, B.; Wang, Z.; Yao, Z. Three-dimensional transient simulation of a prototype pump-turbine during normal turbine shutdown. J. Hydraul. Res. 2017, 55, 520–537. [Google Scholar] [CrossRef]
  6. Li, Z.; Bi, H.; Wang, Z.; Yao, Z. Three-dimensional simulation of unsteady flows in a pump-turbine during start-up transient up to speed no-load condition in generating mode. Proc. Inst. Mech. Eng. Part A J. Power Energy 2016, 230, 570–585. [Google Scholar] [CrossRef]
  7. Ji, X.-Y.; Li, X.-B.; Su, W.-T.; Lai, X.; Zhao, T.-X. On the hydraulic axial thrust of Francis hydro-turbine. J. Mech. Sci. Technol. 2016, 30, 2029–2035. [Google Scholar] [CrossRef]
  8. Faria, M.T.C.; Paulino, O.G.; De Oliveira, F.H.; Barbosa, B.H.G.; Martinez, C.B. Influence of Mechanical Draft Tube Fish Barrier on the Hydraulic Thrust of Small Francis Turbines. J. Hydraul. Eng. 2010, 136, 924–928. [Google Scholar] [CrossRef]
  9. Kazakov, Y.A.; Pelinskii, A.A. Experimental investigation of the axial force in a submersible, electric well pump. Chem. Pet. Eng. 1970, 6, 262–263. [Google Scholar] [CrossRef]
  10. Tao, R.; Xiao, R.; Liu, W. Investigation of the flow characteristics in a main nuclear power plant pump with eccentric impeller. Nucl. Eng. Des. 2018, 327, 70–81. [Google Scholar] [CrossRef]
  11. Wang, C.; Shi, W.; Zhang, L. Calculation Formula Optimization and Effect of Ring Clearance on Axial Force of Multistage Pump. Math. Probl. Eng. 2013, 2013, 1–7. [Google Scholar] [CrossRef]
  12. Wu, G.; Zhang, K.; Dai, Y.; Sun, J. Influences of the leakage rate of low specific speed Francis runner on phenomenon of the lifting hydroelectric generator set. J. Hydroelectr. Eng. 2004, 4, 106–111. [Google Scholar]
  13. Meng, L.; Zhang, S.P.; Zhou, L.J.; Wang, Z.W. Study on the Pressure Pulsation inside Runner with Splitter Blades in Ultra-High Head Turbine. In Proceedings of the IOP Conference Series: Earth and Environmental Science, Montreal, QC, Canada, 22–26 September 2014; Volume 22, p. 32012. [Google Scholar]
  14. Zhang, Y.; Zheng, X.; Li, J.; Du, X. Experimental study on the vibrational performance and its physical origins of a prototype reversible pump turbine in the pumped hydro energy storage power station. Renew. Energy 2019, 130, 667–676. [Google Scholar] [CrossRef]
  15. Xia, L.; Cheng, Y.G.; Yang, Z.; You, J.; Yang, J.; Qian, Z. Evolutions of Pressure Fluctuations and Runner Loads During Runaway Processes of a Pump-Turbine. J. Fluids Eng. 2017, 139, 091101. [Google Scholar] [CrossRef]
  16. Liu, D.; You, G.; Wang, F.; Zhang, J. Calculation and analysis of axial thrust acting on turning wheel of flow-mixing reversible hydraulic turbines. J. Hohai Univ. 2004, 32, 557–561. [Google Scholar]
  17. Zhao, X.; Lai, X.; Gou, Q.; Zhu, L.; Tang, J. Research on the calculation formula of axial hydro-thrust of Francis turbine. China Rural Water Hydropower 2015, 5, 172–175. [Google Scholar]
  18. Zhou, L.; Shi, W.; Li, W.; Agarwal, R. Numerical and Experimental Study of Axial Force and Hydraulic Performance in a Deep-Well Centrifugal Pump with Different Impeller Rear Shroud Radius. J. Fluids Eng. 2013, 135, 104501. [Google Scholar] [CrossRef]
  19. Gantar, M.; Florjancic, D.; Sirok, B. Hydraulic Axial Thrust in Multistage Pumps—Origins and Solutions. J. Fluids Eng. 2002, 124, 336–341. [Google Scholar] [CrossRef]
  20. Zhao, W.G.; He, M.Y.; Qi, C.X.; Li, Y.B. Research on the effect of wear-ring clearances to the axial and radial force of a centrifugal pump. In Proceedings of the IOP Conference Series: Materials Science and Engineering, Beijing, China, 19–22 September 2013; Volume 52, p. 072015. [Google Scholar]
  21. Li, X.; Mao, Z.; Lin, W.; Bi, H.; Tao, R.; Wang, Z. Prediction and Analysis of the Axial Force of Pump-Turbine during Load-Rejection Process. IOP Conf. Series Earth Environ. Sci. 2020, 440, 052081. [Google Scholar] [CrossRef] [Green Version]
  22. Li, J.-W.; Zhang, Y.; Liu, K.-H.; Xian, H.-Z.; Yu, J.-X. Numerical simulation of hydraulic force on the impeller of reversible pump turbines in generating mode. J. Hydrodyn. 2017, 29, 603–609. [Google Scholar] [CrossRef]
  23. Tang, W.; Zheng, X. Group Theory Method for Upper Bracket-stator System Vibration Analysis. Large Electr. Mach. Hydraul. Turbine 1999, 3, 10–14. [Google Scholar]
  24. Luo, Y.; Wang, Z.; Chen, G.; Lin, Z. Elimination of upper bracket resonance in extremely high head Francis hydro-generators. Eng. Fail. Anal. 2009, 16, 119–127. [Google Scholar] [CrossRef]
  25. Trivedi, C.; Cervantes, M.J. Fluid-structure interactions in Francis turbines: A perspective review. Renew. Sustain. Energy Rev. 2017, 68, 87–101. [Google Scholar] [CrossRef]
  26. Wang, W.Q.; He, X.; Zhang, L.X.; Liew, K.; Guo, Y. Strongly coupled simulation of fluid-structure interaction in a Francis hydroturbine. Int. J. Numer. Methods Fluids 2009, 60, 515–538. [Google Scholar] [CrossRef]
  27. Wang, W.; Yan, Y. Strongly coupling of partitioned fluid–solid interaction solvers using reduced-order models. Appl. Math. Model. 2010, 34, 3817–3830. [Google Scholar] [CrossRef]
  28. Schmucker, H.; Flemming, F.; Coulson, S. Two-Way Coupled Fluid Structure Interaction Simulation of a Propeller Turbine. Int. J. Fluid Mach. Syst. 2010, 3, 342–351. [Google Scholar] [CrossRef]
  29. Dompierre, F.; Sabourin, M. Determination of turbine runner dynamic behaviour under operating condition by a two-way staggered fluid-structure interaction method. Ser. Earth Environ. Sci. 2010, 12, 012085. [Google Scholar]
  30. Xiao, R.; Wang, Z.; Luo, Y. Dynamic stresses in a francis turbine runner based on fluid-structure interaction analysis. Tsinghua Sci. Technol. 2008, 13, 587–592. [Google Scholar] [CrossRef]
  31. Zhou, L.; Wang, Z.; Xiao, R.; Luo, Y. Analysis of dynamic stresses in Kaplan turbine blades. Eng. Comput. 2007, 24, 753–762. [Google Scholar] [CrossRef]
  32. Luo, Y.; Wang, Z.; Chen, L.; Wu, J. Finite Element Analysis Design of a Split Rotor Bracket for a Bulb Turbine Generator. Adv. Mech. Eng. 2013, 5, 428416. [Google Scholar] [CrossRef]
  33. Luo, Y.; Wang, Z.; Zeng, J.; Lin, J. Fatigue of piston rod caused by unsteady, unbalanced, unsynchronized blade torques in a Kaplan turbine. Eng. Fail. Anal. 2010, 17, 192–199. [Google Scholar] [CrossRef]
  34. Luo, Y.; Wang, Z.; Zhang, J.; Zeng, J.; Lin, J.; Wang, G. Vibration and fatigue caused by pressure pulsations originating in the vaneless space for a Kaplan turbine with high head. Eng. Comput. 2013, 30, 448–463. [Google Scholar] [CrossRef]
  35. Momčilović, D.; Odanović, Z.; Mitrović, R.; Atanasovska, I.; Vuherer, T. Failure analysis of hydraulic turbine shaft. Eng. Fail. Anal. 2012, 20, 54–66. [Google Scholar] [CrossRef]
  36. Urquiza, G.; García, J.C.; González, J.G.; Castro, L.; Rodríguez, J.A.; Basurto-Pensado, M.A.; Mendoza, O.F. Failure analysis of a hydraulic Kaplan turbine shaft. Eng. Fail. Anal. 2014, 41, 108–117. [Google Scholar] [CrossRef]
  37. Zhai, L.; Luo, Y.; Wang, Z.; Liu, X. Failure Analysis and Optimization of the Rotor System in a Diesel Turbocharger for Rotor Speed-Up Test. Adv. Mech. Eng. 2014, 6, 476023. [Google Scholar] [CrossRef] [Green Version]
  38. Terentiev, L. The Turbulence Closure Model Based on Linear Anisotropy Invariant Analysis; VDM Verlag Dr. Müller: Saarbrücken, Germany, 2008. [Google Scholar]
  39. Menter, F.R.; Kuntz, M.; Langtry, R. Ten years of industrial experience with the SST turbulence model. Turbul. Heat Mass Transf. 2003, 4, 625–632. [Google Scholar]
  40. Bi, H.; Fan, H.; Cao, B.; Xu, Y. Research on the Performance of Check Valve at a Long Distance Pumping System. In Proceedings of the ASME-JSME-KSME 2019 8th Joint Fluids Engineering Conference, San Francisco, CA, USA, 28 July–1 August 2019. [Google Scholar]
  41. Wang, H.; Qin, Q.-H. Methods of Fundamental Solutions in Solid Mechanics; Elsevier: Amsterdam, The Netherlands, 2019. [Google Scholar]
  42. Megson, T.H.G. Structural and Stress Analysis; Butterworth-Heinemann: Oxford, UK, 2019. [Google Scholar]
  43. Yu, M. Engineering Strength Theory; High Education Publication: Beijing, China, 1999; Volume 150. [Google Scholar]
  44. Cook, R.D.; Saunders, H. Concepts and Applications of Finite Element Analysis; John Wiley & Sons: Hoboken, NJ, USA, 2007. [Google Scholar]
Figure 1. Schematic map of the hydraulic system of the studied pumped storage power station.
Jmse 09 00158 g001
Figure 2. Overview of the 3D flow profile of the pump.
Jmse 09 00158 g002
Figure 3. Details of runner and leakage.
Jmse 09 00158 g003
Figure 4. Boundary conditions acquired from 1D hydraulic transient simulation.
Jmse 09 00158 g004
Figure 5. Model and boundary conditions of structural field of pump turbine unit.
Jmse 09 00158 g005
Figure 6. Schematic map of the mesh for flow field. (a) Runner; (b) Leakage, guide vane, stay vane and volute; (c) Draft tube.
Jmse 09 00158 g006
Figure 7. Pressure measurement points. P1: crown leakage before seal; P2: band leakage before seal; P3: upper vaneless space; P4: lower vaneless space.
Jmse 09 00158 g007
Figure 8. Comparison of pressure between prototype test and simulation on typical locations.
Jmse 09 00158 g008
Figure 9. Comparison of head between 1D hydraulic transient simulation and 3D CFD simulation.
Jmse 09 00158 g009
Figure 10. Schematic map of the structure field meshes. (a) Shaft and Generator rotor; (b) Support Bracket; (c) Runner.
Jmse 09 00158 g010
Figure 11. Mesh independence check.
Jmse 09 00158 g011
Figure 12. Schematic map of the structure field meshes.
Jmse 09 00158 g012
Figure 13. Axial hydraulic force components during pump mode’s starting up. (a) Inside and outside surface of runner; (b) Crown and band; (c) Crown and band, blade.
Jmse 09 00158 g013
Figure 14. Pressure distribution on axial cross-section of runner and leakages during starting-up at t = 3 s, 4 s, 6 s, 11 s, 16 s, 21 s. (a) t = 3 s; (b) t = 4 s; (c) t = 6 s; (d) t = 11 s; (e) t = 16 s; (f) t = 21 s.
Jmse 09 00158 g014
Figure 15. Streamlines and relative velocity coefficient Cv in the mid-span of guide vane during starting-up at t = 3 s, 6 s, 16 s, 21 s. (a) t = 3 s; (b) t = 6 s; (c) t = 16 s; (d) t = 21 s.
Jmse 09 00158 g015
Figure 16. Deformation of main shaft at t = 21 s.
Jmse 09 00158 g016
Figure 17. Deformation of support bracket at t = 21 s.
Jmse 09 00158 g017
Figure 18. Maximum deformation of main shaft and support bracket during starting-up.
Jmse 09 00158 g018
Figure 19. Deformation of main shaft during starting-up at t = 3 s, 6 s, 16 s, 21 s. (a) t = 3 s; (b) t = 6 s; (c) t = 16 s; (d) t = 21 s.
Jmse 09 00158 g019aJmse 09 00158 g019b
Figure 20. Deformation of runner’s typical location during starting-up.
Jmse 09 00158 g020
Figure 21. Δ D of runner during starting-up.
Jmse 09 00158 g021
Figure 22. Pressure distribution of COS and BOS at t = 21 s. (a) COS; (b) BOS.
Jmse 09 00158 g022
Figure 23. Pressure distribution on typical lines of COS and BOS at t = 21 s. (a) COS; (b) BOS.
Jmse 09 00158 g023
Figure 24. Von-Mises stress of support bracket at t = 21 s.
Jmse 09 00158 g024
Figure 25. Von-Mises stress of runner at t = 21 s.
Jmse 09 00158 g025
Figure 26. Maximum Von-Mises stress of support bracket and runner during starting-up.
Jmse 09 00158 g026
Table 1. Parameters of pump turbine.
ParameterValue
Rated head Hr [m]430
Rated rotation speed nr [r/min]428.6
Rated power Pr [MW]300
Rated flow rate Qr [m3/s]68
Diameter on runner pressure side Dhi [m]4.16
Table 2. Pump turbine unit material properties.
Density ρ
[kg/m3]
Young’s Modulus E
[Pa]
Poisson’s Ratio μ
[-]
78502.1 × 10110.3
Table 3. Bearing stiffness coefficients k.
Upper BearingLower BearingTurbine BearingThrust Bearing
Stiffness coefficients k
[N/m]
2.0 × 1092.0 × 1091.5 × 1092.5 × 109
Table 4. Mesh details of the flow field.
ComponentNodes
Volute150,796
Stay Vane417,420
Guide Vane750,688
Runner1,831,959
Draft Tube174,411
Leakages2,947,430
Balancing-Pipe615,984
Total6,888,688
Table 5. Mesh details for mesh independence check.
Mesh1Mesh2Mesh3Mesh4
Nodes635,012827,539915,9611,972,471
Elements774,9071,009,8391,169,3212,640,587
Table 6. Mesh details of the final structure field.
ComponentShaft and Generator RotorSupport BracketRunnerTotal
Nodes262,888121,470540,639915,961
Publisher’s Note: MDPI stays neutral with regard to jurisdictional claims in published maps and institutional affiliations.

