
The Accelerations of a Wave Measurement Buoy Impacted by Breaking Waves in the Surf Zone

1
Glosten, Inc., 1201 Western Ave, Seattle, WA 98101, USA
2
Department of Mechanical, Industrial, and Manufacturing Engineering, Oregon State University, 414 Rogers Hall, Corvallis, OR 97331, USA
*
Author to whom correspondence should be addressed.
†
Ph.D. from Oregon State University in Mechanical Engineering, Department of Mechanical, Industrial, and Manufacturing Engineering.
‡
This work contributed to the Ph.D. Dissertation of Adam Brown.
J. Mar. Sci. Eng. 2021, 9(2), 214; https://0-doi-org.brum.beds.ac.uk/10.3390/jmse9020214
Submission received: 27 December 2020
/
Revised: 24 January 2021
/
Accepted: 10 February 2021
/
Published: 18 February 2021
(This article belongs to the Special Issue Water Waves: Field and Experimental Observations)
Abstract
:A spherical wave measurement buoy capable of detecting breaking waves has been designed and built. The buoy is 16 inches in diameter and houses a 9 degree of freedom inertial measurement unit (IMU). The orientation and acceleration of the buoy is continuously logged at frequencies up to 200 Hz providing a high fidelity description of the motion of the buoy as it is impacted by breaking waves. The buoy was deployed several times throughout the winter of 2013–2014. Both moored and free-drifting data were acquired in near-shore shoaling waves off the coast of Newport, OR. Almost 200 breaking waves of varying type and intensity were measured over the course of multiple deployments. The characteristic signature of spilling and plunging breakers was identified in the IMU data.
1. Introduction
Though humans have been sailing the seas for thousands of years, the oceans of the world remain the final frontier of science and engineering. The harshness and remoteness of the environment further complicate direct observation and experimentation, yet increases in global population and consumption are rapidly pushing industries offshore. The oil and gas industry is the primary example of this shift, but engineers also hope to tap the ocean’s vast renewable energy resources. Offshore renewable energy (ORE) can be harvested from winds, currents, and waves as well as salinity and thermal gradients.
Offshore systems are pummeled by the sea. Large breaking wave impacts impart intense loads that often lead to damage. In deep water, both spilling and plunging breakers occur. Large plunging breakers are rare, but very dangerous, capable of imparting intense impact loads and overturning moments. Although less severe, spilling breakers still produce a significant impact load, and occur frequently during storms. The actual probability of encountering these waves remains poorly quantified. To date, most large offshore systems, such as oil platforms, have overcome the lack of information by using extremely conservative safety factors and material allowances, resulting in massive and expensive structures. This strategy is not feasible for ORE systems, as the energy produced per device is much less than that produced by a single oil and natural gas platform. To be cost effective, ORE systems must be designed efficiently to survive extended ocean deployments with little maintenance. To achieve this goal, developers will need to consider the ocean as a probabilistic design environment.
Breaking Waves
System failures may be broadly classified as fatigue or single event failures. Single event failures are those caused by a single extreme stress that exceeds the yield or ultimate strength of the material. In most cases, these events are unexpected and are often not adequately considered during the design process. It is therefore important to consider likely causes of single event failures before they occur.
Deep-water breaking waves are one cause of single event failures at sea. Breaking waves occur at varying frequency scales [1]. For instance, small high frequency waves may break on top of larger stable low-frequency swell. Although much less common, the dominant lower frequency waves may also break in a violent release of the energy transported by the wave. In either case, breaking waves may overtop offshore structures resulting in slamming and drag loads on the upper surfaces of the device with horizontal or downward directionality [2]. This is not a load often considered in design.
Few data sets exist that capture the probability of deep-water wave breaking in a manner suitable for system design [3,4,5,6,7]. In order to determine the type, probability, and severity of breaking waves in deep-water, a system must first be developed that can remotely detect and classify breaking waves. Many devices will need to be deployed in locations with varying conditions spread across the globe in order to develop a statistically significant description of deep water breaking that considers confounding environmental factors. Therefore, the systems must be low cost and the detection method must be robust; capable of surviving the harshest winter storms when breaking waves are most likely. As a first step toward this goal, we have built a wave measurement buoy purposefully similar to commercially available systems in size, shape, and working principle such that our results are broadly applicable to those systems.
The buoy uses a nine degree-of-freedom (DoF) inertial measurement unit (IMU), comprised of three accelerometers, three gyroscopes, and three magnetometers measuring along orthogonal axes. The individual sensor measurements are input into a fusion algorithm running on the device that produces an estimate of buoy orientation and three dimensional motion. IMUs are often called Attitude and Heading Reference Systems (AHRS), and are widely used in technology from smart phones to aerial drones. The primary difference between our buoy, and commercially available buoys, is that ours is configured to sample data at a much higher rate. Sampling rates between 50 and 200 Hz were used for these experiments, while commercial buoys typically sample at rates from 1 to 10 Hz.
The goal of this project is to determine the characteristic acceleration signature of a wave measurement buoy impacted by spilling and plunging breaking waves, so that algorithms can be developed to identify and classify breaking wave impacts in future deep water deployments of more advanced buoys. For this reason, data were initially taken in the near-shore environment, as it allows the buoy to encounter a large number of breaking waves in a relatively short period of time. Buoy deployments were video recorded to verify that the signatures observed in the IMU data were produced by breaking wave impacts.
In the following sections, a brief literature review is provided in Section 2 and the buoy design, construction, and deployment are described in Section 3. Testing was conducted in several ways, and the experimental variations are discussed in Section 4. Deployments were made with the buoy both moored and free-drifting in varying water depths. The breaking wave signature is identified and examined in Section 5 and Section 6. To some extent, the experimental variations resulted from adaptations to the challenge of deploying a buoy by kayak just outside the surf zone; however, the variations allow the effects of the mooring and the water-depth to be examined (Section 7). Finally, the data acquired present a vast set of possibilities for further analysis and future work, and some of those options are presented in Section 8.
2. Related Work
A significant body of research on breaking waves has developed since World War 2. Initial research focused on the prediction of wave breaking was used to inform the design of near-shore structures and breakwaters. Much of this work sought to characterize the geometry of breaking waves and the effect of beach slope on the development of the various breaker types. During the 1970s, oil production moved offshore, and the focus of research broadened to include breaking in deep-water wave-fields.
Cokelet described two breaking wave types that occur in deep water: spilling and plunging [8]. Spilling breakers are characterized by a turbulent rush of water down the forward face of the wave, while plunging breakers are characterized by a jet of water propelled forward from the wave crest. Breaking waves tend to start as plunging breakers, and transition to spilling breakers as they dissipate energy.
Breaking waves impart large slamming loads, and a vast body of work focuses on the impact loading of breaking waves on structures of varying geometry [9]. Plunging breakers with a smooth vertical front face, although rare in deep water, tend to produce the most severe impact load on marine structures [10].
Ever increasing computing power has made it practical to numerically simulate non-linear wave-fields in order to study the development of breaking waves in deep-water [11]. Much of the recent experimental work related to breaking waves has focused on the air-sea exchange of mass, heat, and energy due to its importance in climate modeling [12,13]. Relatively little work has been devoted to characterizing the probability and intensity of breaking waves in deep-water, and much of the work that has been done is theoretical in nature, requiring validation [14].
A few of the many methods of breaker detection that have been used, include: direct visual observation, acoustic and void fraction detection of bubble plumes, and detection of microwave backscatter from breaking crests [14,15,16,17,18]. However, given the prevalence and wide spread use of wave measurement buoys to measure wave heights and direction, relatively few attempts have been made to detect breaking waves using buoys. Most of these efforts have focused on detecting the breaker based upon the vertical component of wave surface elevation. Thorpe and Humphries and Longuet-Higgins used floating wire gauges to detect breaking waves; this technique was recently resurrected by Pascal et al. in 2011 [19,20,21]. The spar-type buoy developed by Pascal et al. is a full sensor platform incorporating accelerometers to characterize buoy motion as well as hydrophones and cameras to monitor the formation of bubble-clouds. Downward looking still and video cameras were also employed for breaker verification. In a similar effort, the Applied Physics Lab at the University of Washington has developed the SWIFT Drifter [22,23]. SWIFT buoys are a free floating, spar-type, Lagrangian measurement platform. Wave spectra are calculated from horizontal velocity measurements obtained using the Doppler shift of a GPS ping. The floats can also house an IMU, camera, hydrophone, and an Acoustic Doppler Current Profiler (ADCP) to characterize the turbulence produced by breaking waves. The work presented in this paper led to the development of breaker detection algorithms employed during recent deployments of SWIFTs off the coast of Oregon during storms in 2015 and 2016 [6]. In that study breaking wave impacts were identified by looking for high frequency transients within the recorded IMU time series.
Balaji et al. conducted laboratory tests of a scaled discus wave measurement buoy subjected to deep-water breaking waves [24]. The response of the buoy was measured using potentiometers and motion tracking cameras. Wavelet analysis was applied to the data to determine the phase shift of high frequency wave components after breaking. Fourier analysis was also used to characterize the energy spectrum of various breaking events in heave, pitch, and roll.
Two other projects of note have used grapefruit sized spherical Lagrangian drifters to approximate the motion of a water particle in a breaking wave. Amador et al. approximated the dynamics of plunging breaking waves by allowing their buoy to flow off a ledge into a tank below [25]. Sinclair hired surfers to deploy her device in shallow-water plunging breakers [26]. She was able to capture incredible images of her float from inside the barrel of a wave. Her data clearly show the free-fall of a wave particle as it plunges forward of the breaking crest.
3. The Wave Measurement Buoy
A simple low-cost wave measurement buoy capable of recording the impact of breaking waves has been developed and deployed as a first step toward a more complex breaking wave measurement buoy capable of long term remote deployments in deep water. The buoy houses a 9 DoF IMU developed by Yost Labs, formerly YEI corporation [27]. The sensor package is roughly the size and weight of a key fob. It measures acceleration, rotation, and the magnetic field relative to the sensor fixed X-, Y-, and Z-axes. The IMU employs an on-board Kalman filter that calculates an estimate of orientation based on the raw sensor data. Orientation, acceleration, and rotational rate data were output to a microSD card at frequencies of 50 Hz or greater.
Buoy orientation was recorded in quaternion form due to its compact nature, and its avoidance of gimbal lock. Though less widely known, quaternion mathematics is simple and provides many tools useful for the analysis of rotating systems [28].
The internal sensor battery is capable of powering the unit for approximately six hours of continuous recording. An external high capacity USB battery pack has been incorporated into the buoy with sufficient capacity to power the device for multiple days. Using the USB battery pack, the maximum duration of recording was limited by the 2 GB capacity of the microSD card. Outputting the date and time-stamp as well as the orientation and sensor measurements at 50 Hz consumes approximately 25 MB/h for a maximum run time of approximately 80 h. This could be extended by outputting the data in binary form. However, the ability to use and share the data is improved by outputting it directly to a standard ASCII text file.
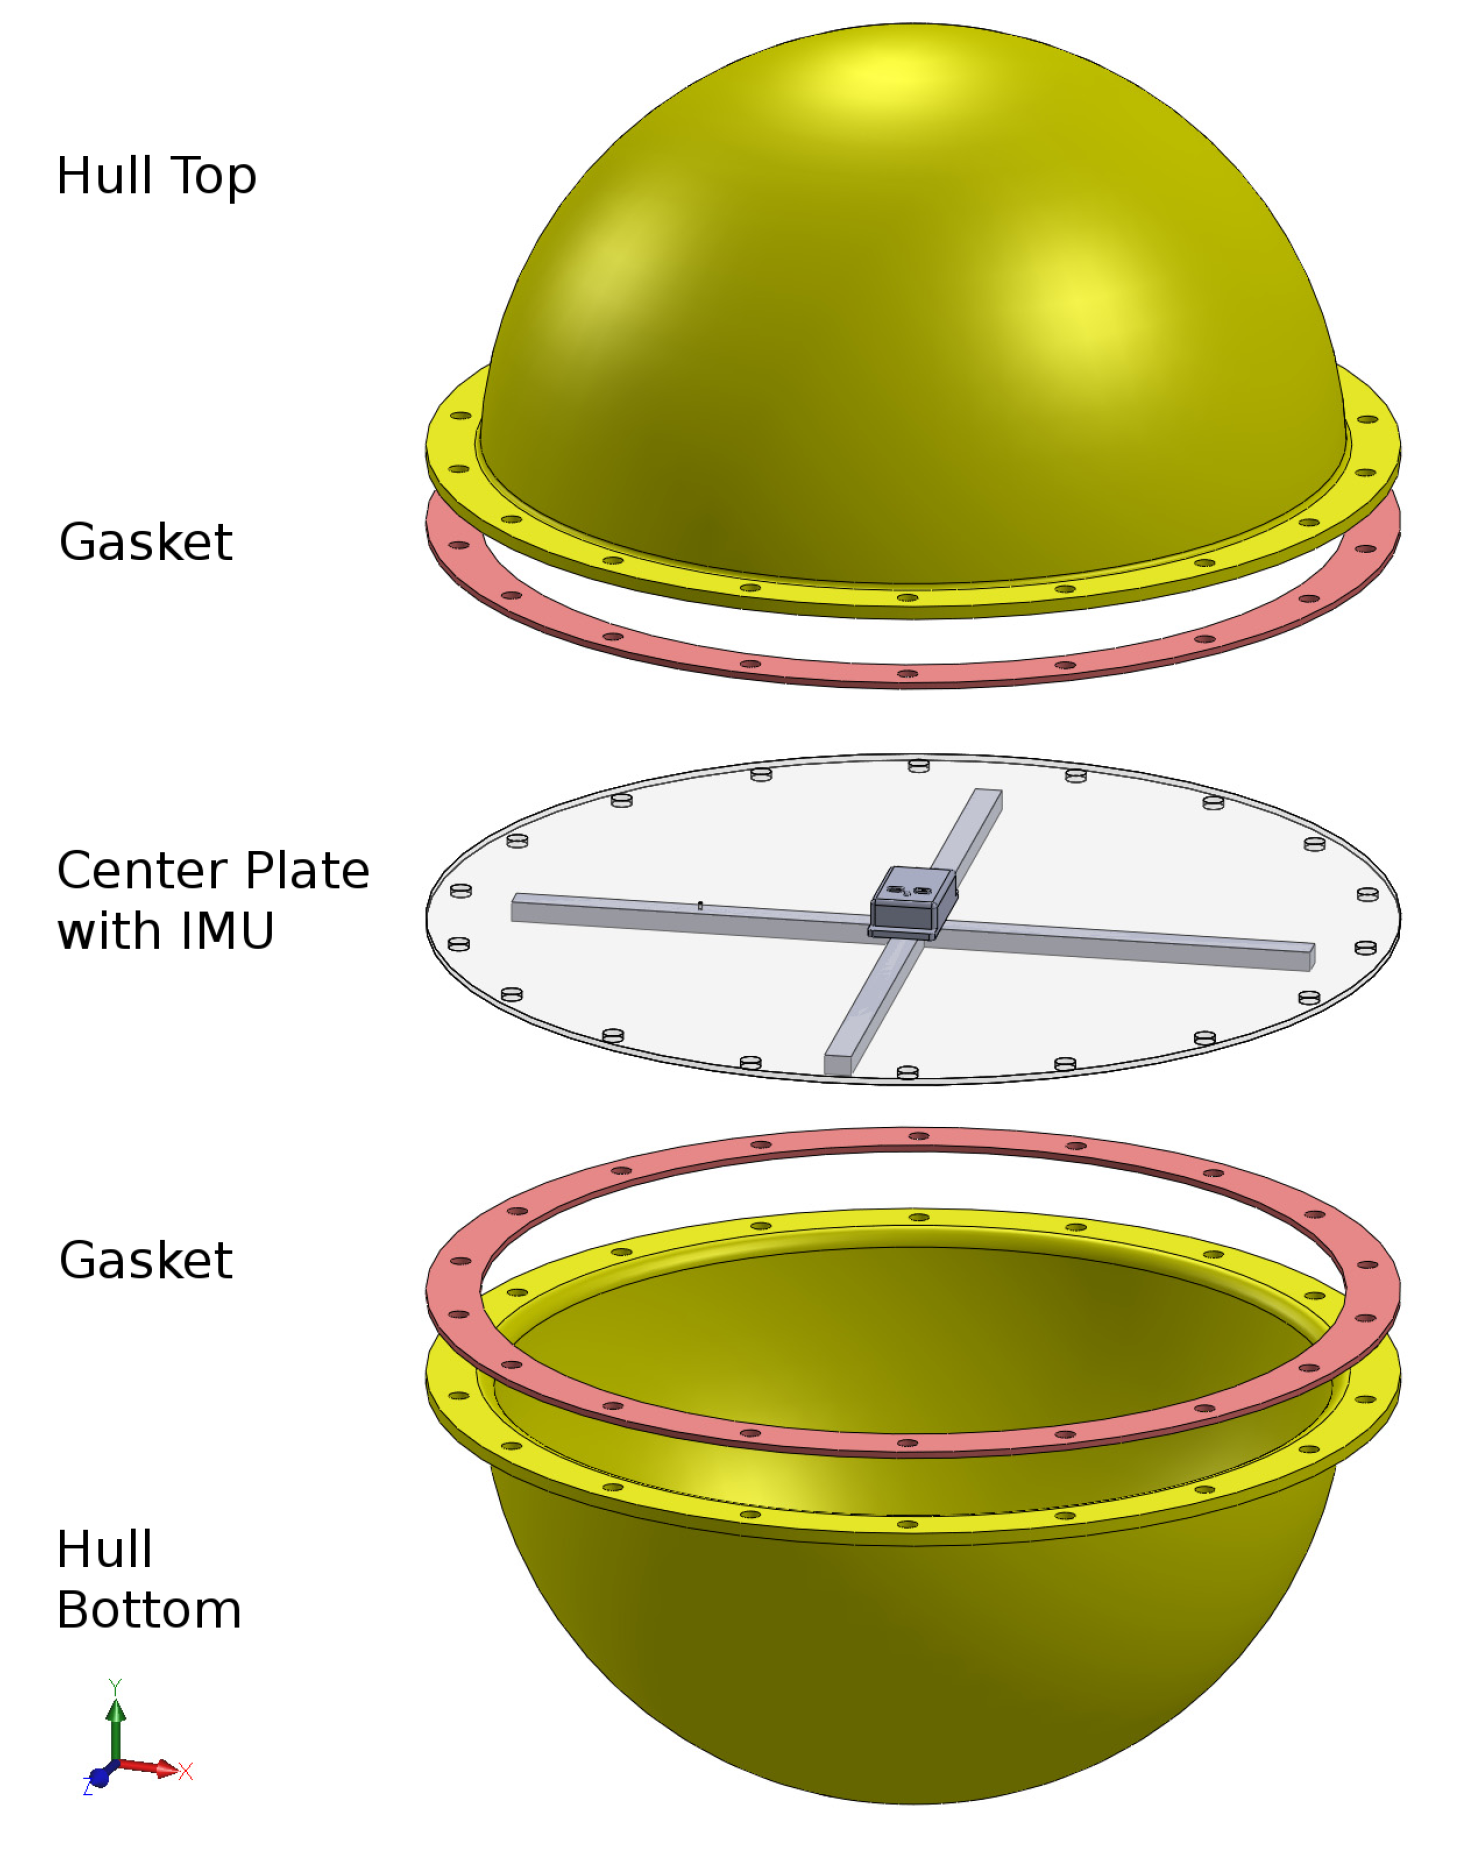
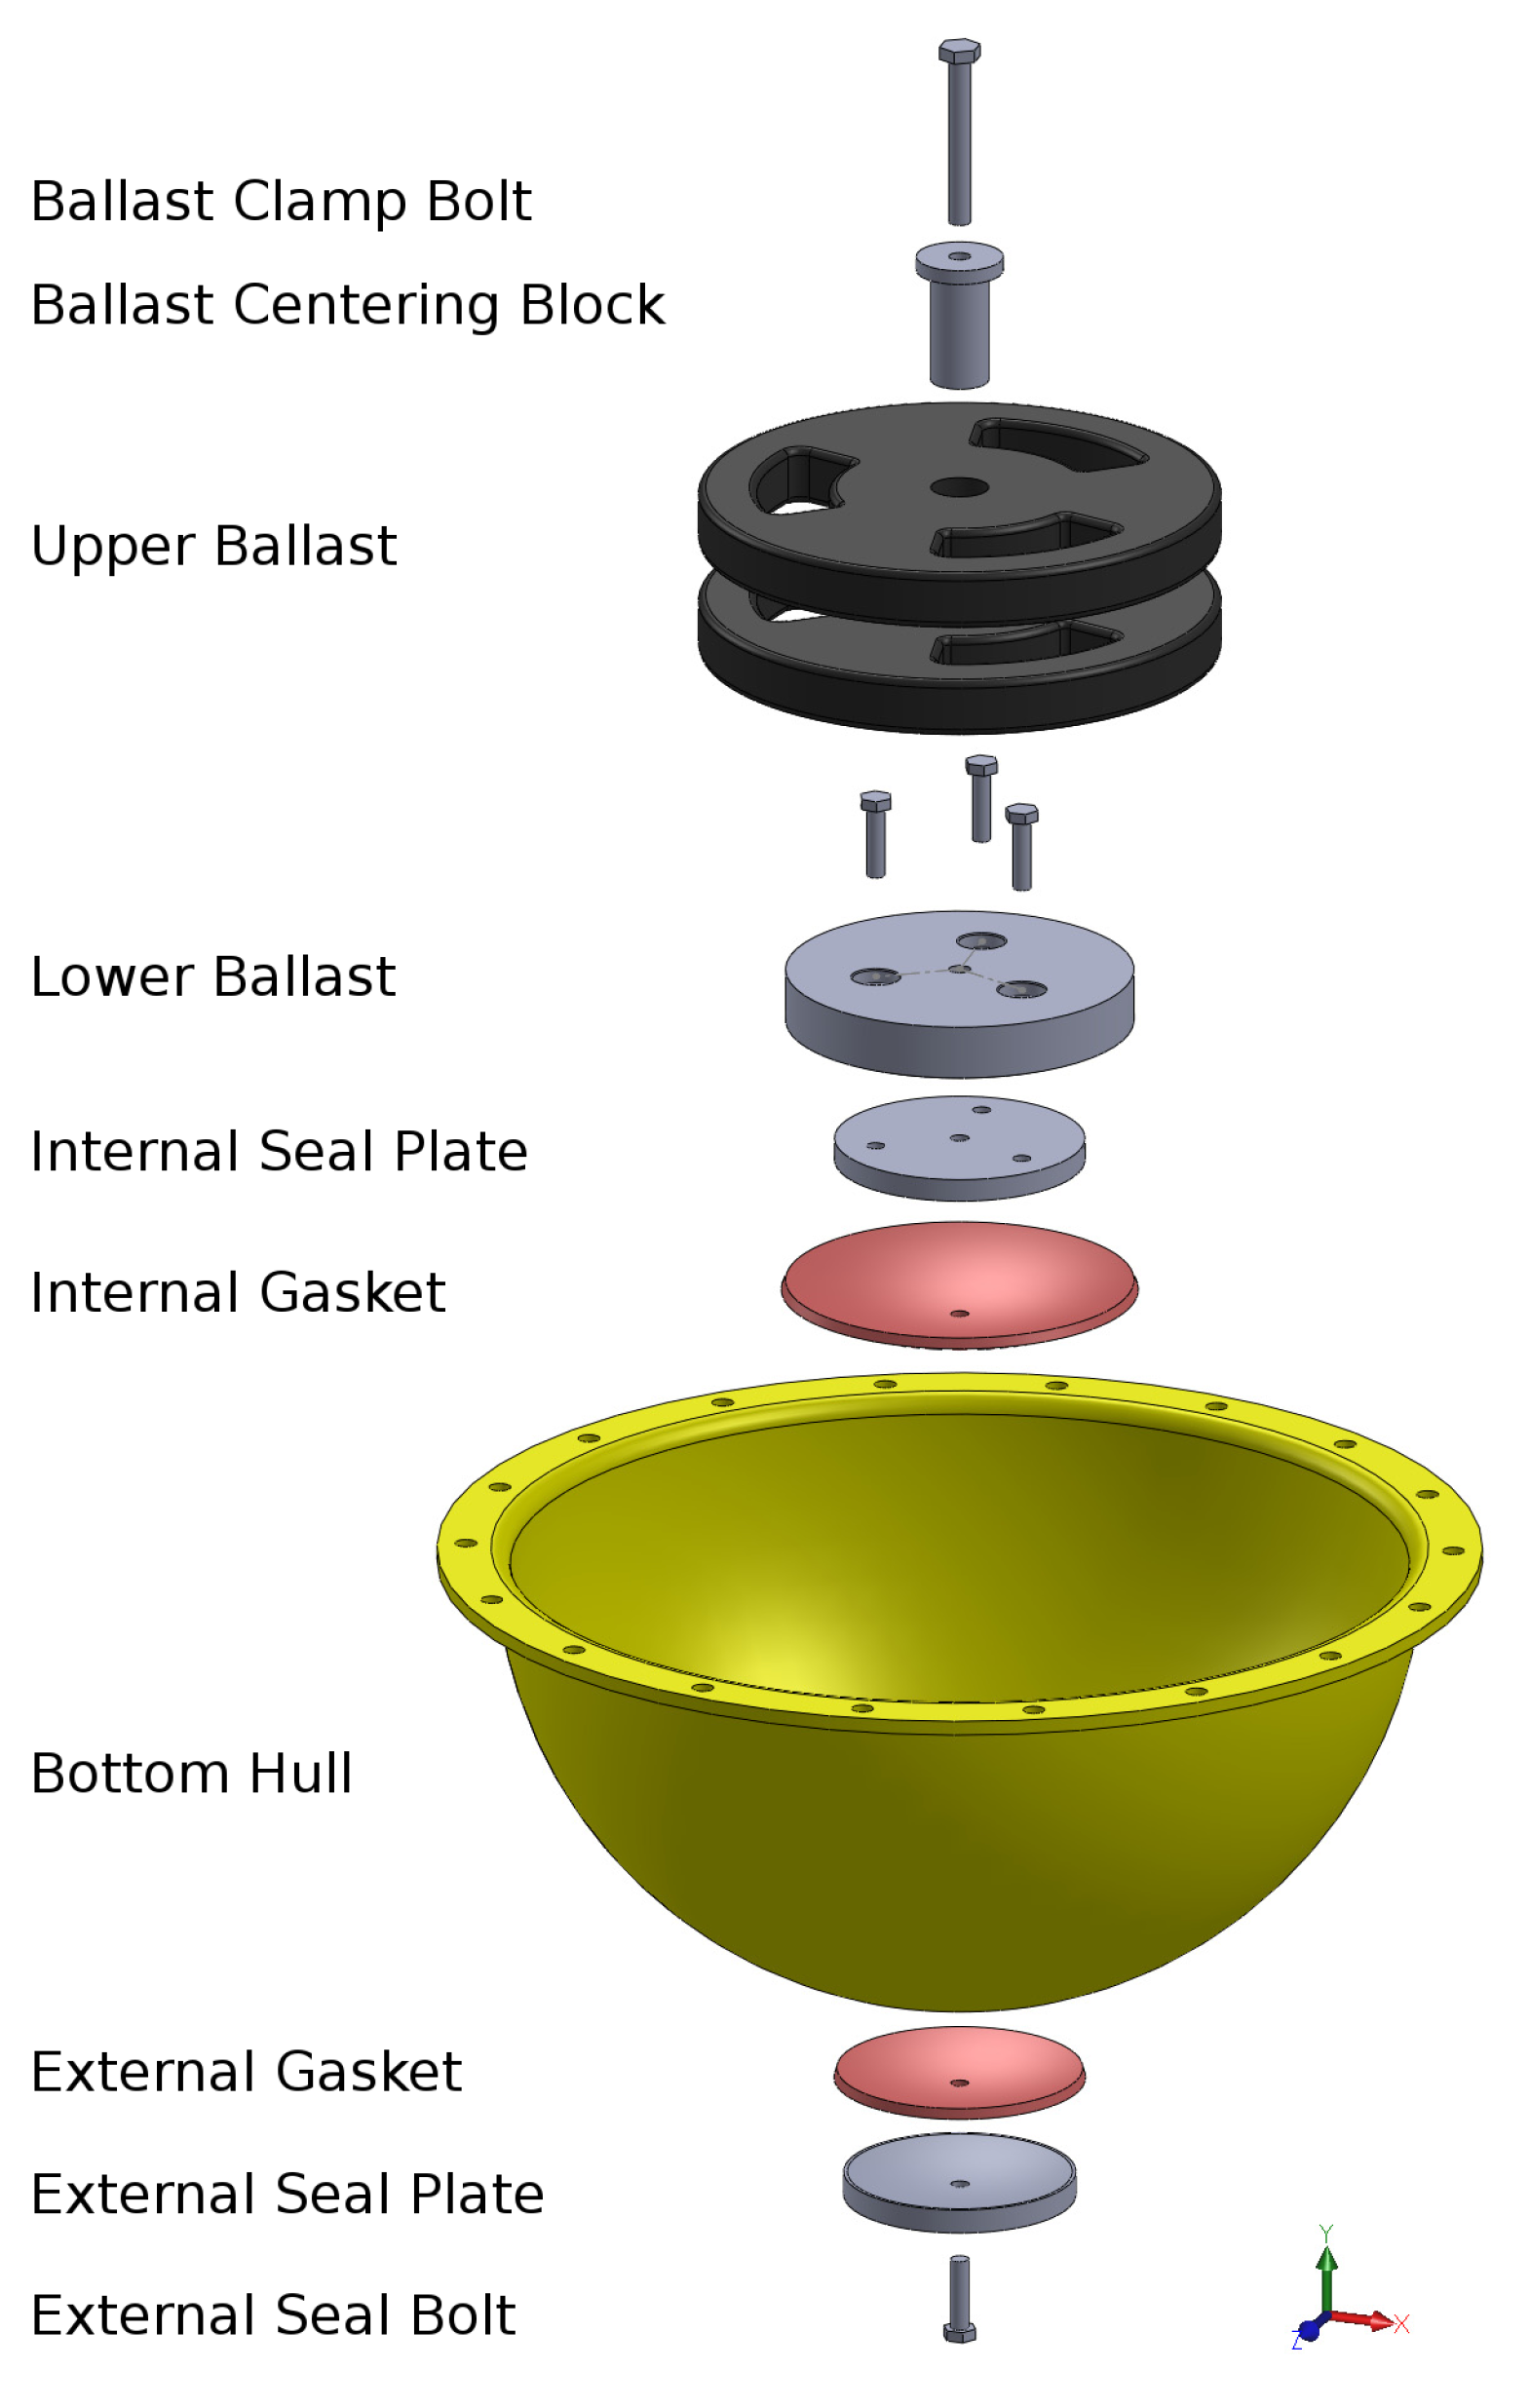
The buoy is spherical in shape with an outer diameter of 40 cm. The size and shape were chosen to be representative of the hulls employed by other commercially available wave measurement buoys. The hull of the buoy is composed of two polycarbonate hemispheres bolted together at the equator through a 2.5 cm wide flange. When floating, the still water line coincides with the equator. The buoy displaces 18 kg of water; steel ballast weight is mounted as low as possible inside the hull. The combined weight of the sensor, battery, and center plate is less than a kilogram. Damping is provided by a continuous length of chain attached to three eye bolts 120 apart along the flange; 4.5 m of 0.8 cm stainless chain was used to make the loop. Each segment of the chain hangs to a point roughly 60 cm below the equator of the buoy. Exploded views of the buoy can be seen in Figure 1 and Figure 2, and the damping chain can be seen in Figure 3.
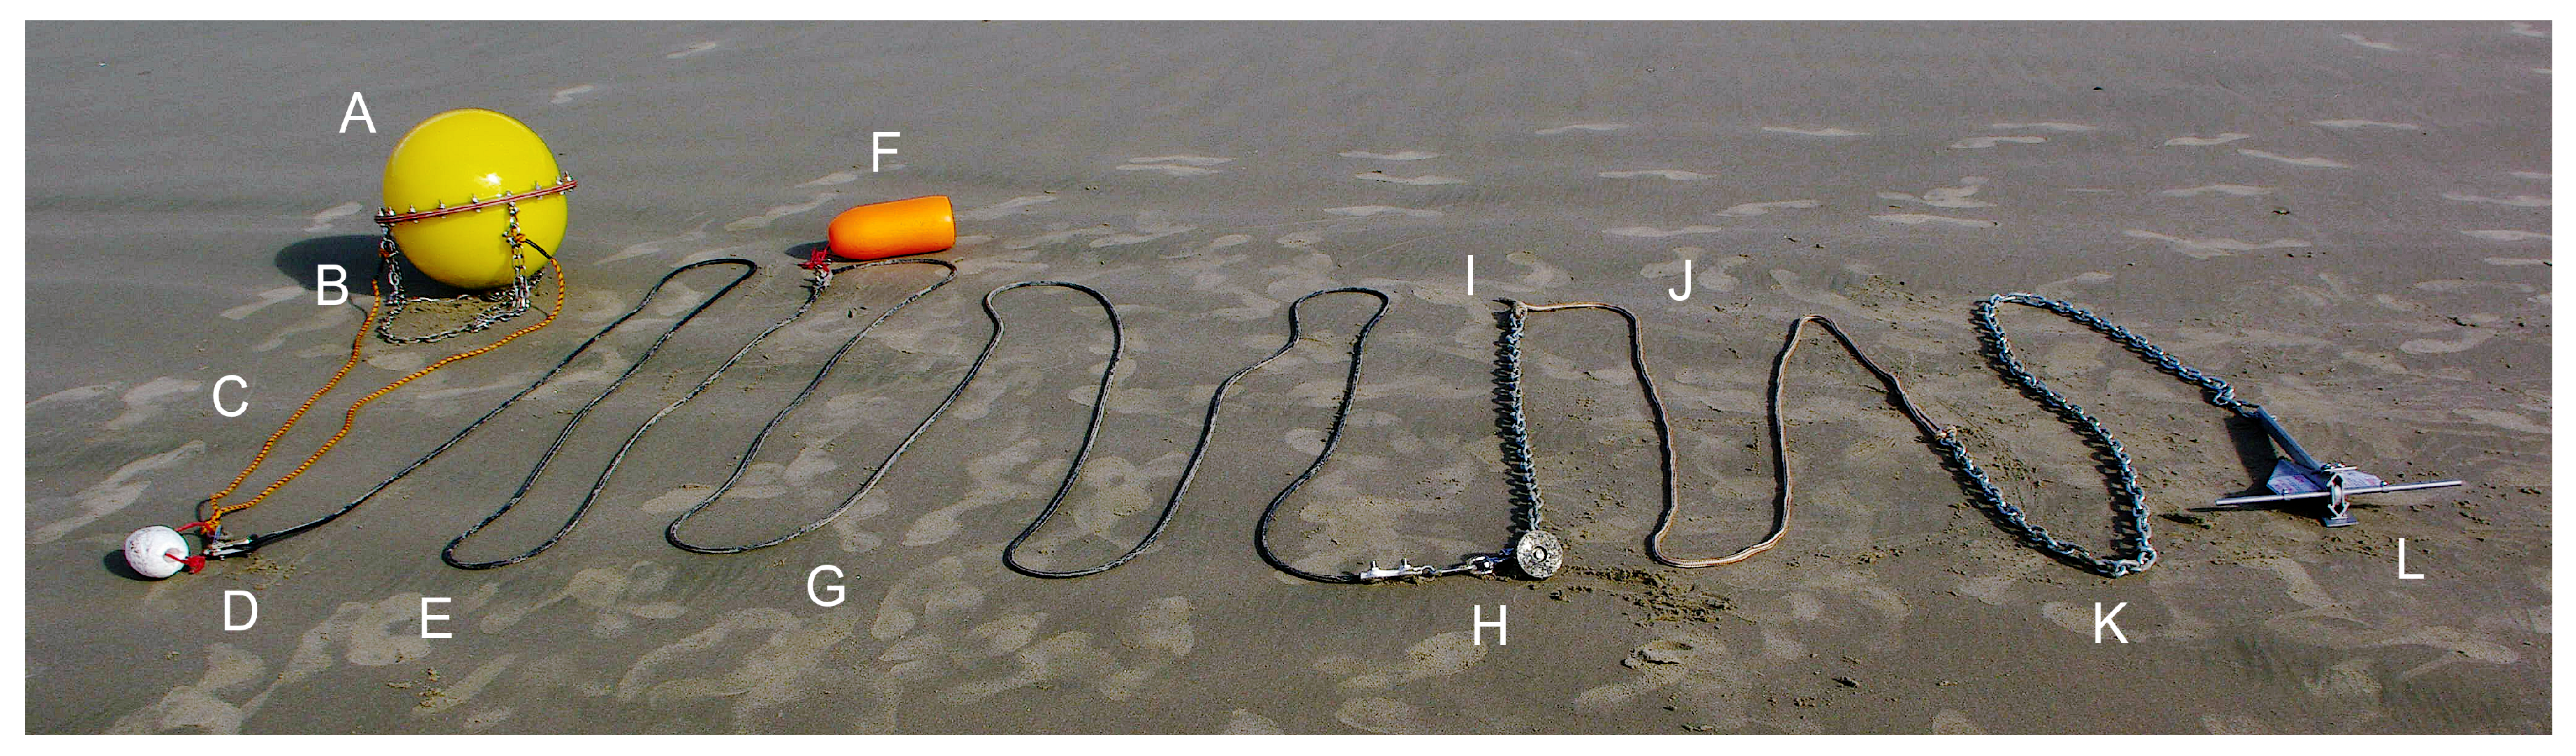
A bridle attached to two of the three flange eye-bolts is used to connect the buoy to its anchor line. The anchor line attachment point of the bridle is held at the ocean surface using a small crab float. A 6 m length of 1 cm diameter natural latex rubber line connects the bridle to a surface float. From the surface float, a second 9 m length of rubber line drops down to the ocean floor where it is attached to a 2.3 kg discus steel sinker. From the sinker, a 1.2 m length of 1 cm chain is attached with a 14.6 m length of 0.8 cm nylon double braid line to another 1.8 m length of 1 cm anchor chain. This final length of anchor chain is attached to the three pound aluminum boat anchor. The buoy, bridle, and mooring can be seen in Figure 3. This arrangement was settled on after tests conducted with a longer mooring (approximately 60 m) resulted in an impractically large watch circle. Adding the mid-mooring sinker weight and chain significantly improved anchor setting, allowing the total mooring length to be significantly shortened to approximately 30 m.
The natural frequencies of the buoy were empirically determined from data recorded in Foster Lake, near Sweet Home, OR. In still water, the buoy was displaced from its neutrally buoyant position, released, and allowed to oscillate back to equilibrium. The natural frequency of the buoy in heave is 1.1 Hz, and 1.3 Hz in pitch and roll. These numbers are approximate, as the difference in density between fresh and salt water will have a minor effect on the dynamics of the buoy. It should also be noted that the polycarbonate hemispheres used for the buoy hull were not perfect in shape. However, displacing the buoy on varying pitch and roll axes did not significantly alter the observed natural frequency. From resonance theory, these natural frequencies indicate that the buoy should act as a wave follower for wave periods greater than 2.5 s.
4. Experimental Setup
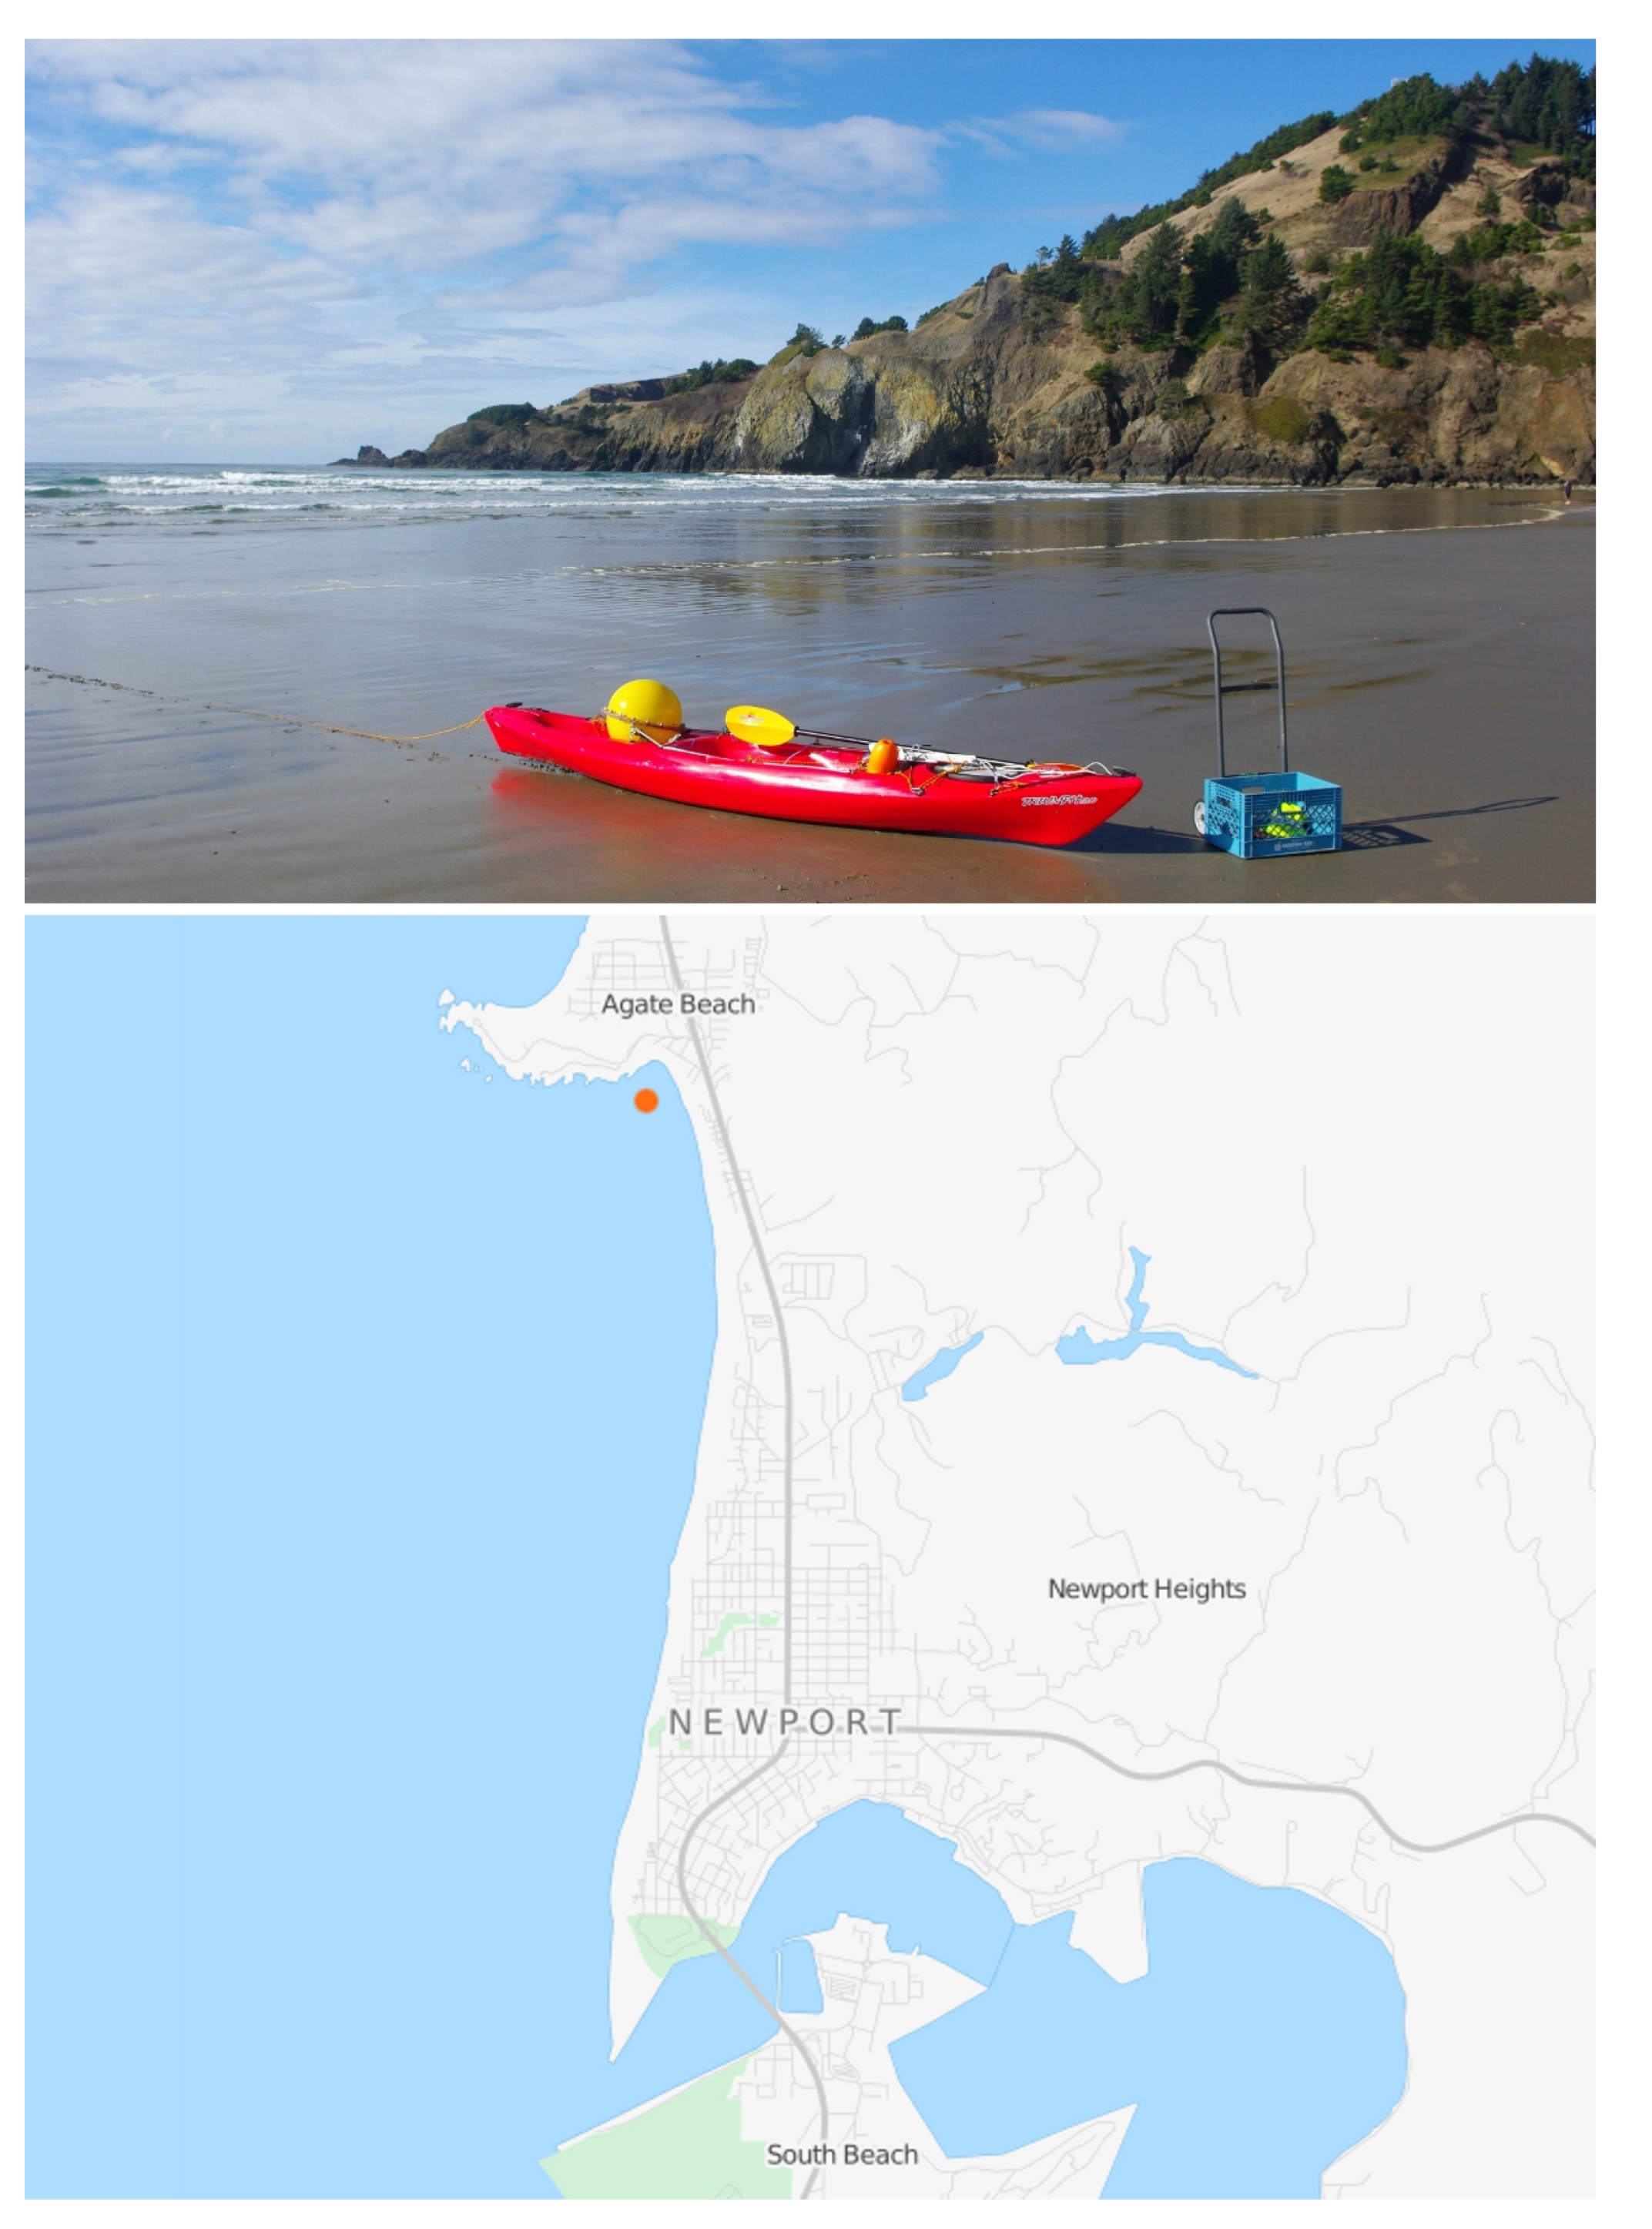
In order to identify breaking waves in the data produced by the IMU, it was necessary to subject the buoy to a significant number of breaking wave impacts that could be visually verified and logged. The buoy was deployed off of Agate Beach along the Oregon coast just south of the Yaquina Head Outstanding Natural Area (Figure 4). As mentioned in Section 1, several experimental variations were used to acquire data. These variations are discussed in the following subsections.
The sensor and camera clocks were manually synchronized allowing for the correlation of recorded data with visually observed breaking events. It was not always possible to synchronize the clocks immediately prior to deployment. However, error between the clocks was typically less than a wave period, and it has proven simple to correlate the observed breakers with their signature in the data.
4.1. Moored in the Outer-Break
The initial plan was to moor the buoy just outside the surf zone, in a region we will call the outer-break, while video recording the deployments from Yaquina Head (Figure 5). Deployments and recoveries were made using a 4 m sit-on-top kayak. The buoy operated in water depths varying from 4.5 to 9 m. In this region wave breaking may occur, but it is infrequent (averaging less than one breaking wave per hour) and limited to the biggest wave in a set.
It was important to consider the tidal cycle prior to deployment. When possible, the tides were used such that the buoy was deployed safely beyond the surf zone in stable water at ebb tide; the surf zone would then move out toward the buoy as the water depth reached a minimum at low tide. Finding the ideal deployment spot was challenging as a vast number of variables affect the location of the surf zone. Several deployments failed to record a single breaking wave as the buoy was located too far outside the surf zone.
4.2. Free-Drifting in the Outer-Break
Only one plunging event was recorded during moored testing in the outer-break. In order to increase the chance of encountering a plunging breaker, the buoy was released free-drifting in the outer-break just prior to the arrival of large waves likely to plunge. This method of acquiring data was effective, but presented its own challenges. In order to release the buoy in the path of an oncoming wave, it was necessary to position the kayak in front of the same oncoming wave. It was also impractical to video record these tests; instead, a wrist watch was used to identify the time of the plunging impact.
In free drifting tests, the combined effect of a breaking wave impact and the associated shoreward surface currents would typically drive the buoy into the surf-zone and back to the beach. However, on one occasion, a rip current developed which roughly balanced the effect of the breaking waves. The buoy and kayak were impacted by several strong breaking events, only to be pushed back out to sea by the rip current. After several minutes and multiple impacts, the buoy was recovered, and paddled back to shore.
4.3. Free-Drifting in the Surf Zone
The buoy was also tested free-drifting in the surf zone. Acquiring these data sets involved walking the buoy into the surf zone and releasing it in water depths greater than 1.5 m. The buoy was driven back toward shore by the breaking waves until it reached a water depth of approximately 1 m. The buoy was then recovered and walked back into deeper water to start the next test. In the surf zone, breaking is continuous, and it is possible to quickly acquire data for both spilling and plunging wave impacts. Surf zone tests ranged in duration from 30 s to several minutes depending on the surface currents. Over 150 breakers were measured and recorded with a handheld waterproof camera in less than an hour of data acquisition.
Although surf zone data are easily and readily acquired, the shallow water depth raises concerns that the observed signature may not be characteristic of breaking waves in deeper water. In Section 5 and Section 6, we make the assumption that the data acquired in the surf zone are broadly descriptive of breaking waves in general in water of any depth. The validity of this assumption is considered in Section 7.
4.4. Drifting in the Mid-Break
Recognizing the limitations and challenges of the first three deployment methods, a fourth was employed. The floating buoy was towed by a swimmer into water depths from 2 to 4.5 m using kick fins and a 9 m length of marine grade bungee cord. This range of depths will be called the mid-break. Testing was conducted with the bungee cord slack, and as such the buoy was considered to be free drifting. Mid-break tests were video recorded with the same hand-held waterproof camera used for the surf zone tests.
This method of testing provided greater freedom to move the buoy into areas of active wave breaking with water depths approaching those of the outer-break. Swimming the buoy into the mid-break was also likely easiest and safest deployment method.
4.5. Moored in the Surf Zone
The final means of testing occurred by accident. As mentioned in Section 3, the buoy was initially deployed with an approximately 60 m long mooring. For most of the day, the buoy had been drifting, with the wind, to the ocean extent of its watch circle. However, after it was hit by three consecutive spilling breakers, it was driven rapidly to the shoreward extent of its watch circle, inside the surf zone, where it was hit repeatedly by breakers for the next half hour while still anchored in the outer-break.
This data set though accidental, provides a means of examining the effect of mooring loads on the response of the buoy to breaking waves in the surf zone. Water depth at can be estimated from the video at approximately 1.5 m, as surfers were present standing in the water near the buoy.
5. Characteristic Acceleration Signatures
The IMU records motion in the North-West-Up reference frame. However, on days with a complex wave-field, individual waves approached the beach at angles varying 30 or more. To identify breaking waves, it proved simple and effective to only consider the buoy’s vertical acceleration and the magnitude of horizontal acceleration. This formulation provides the vertical motion associated with the buoy traveling over or through the wave crest, as well as the maximum horizontal buoy acceleration inline with the wave impact. Also of note, gravitational acceleration appears in IMU accelerometer data. It is in fact one of the signals used to determine sensor orientation. The constant bias of gravity present in the measured vertical acceleration signal would be removed by subtraction if integrating to determine buoy velocity and position, as the buoy is not actually accelerating upwards. However, the one gravity bias in vertical acceleration serves two purposes in our data: (1) the vertical and horizontal acceleration signals are offset, allowing them to be easily distinguished, and (2) moments of buoy free-fall can be identified when measured vertical acceleration reaches a value of zero acceleration/g.
The data were examined for the presence of three wave types: plunging breakers, spilling breakers, and incipient breakers. An incipient breaker is defined here as a steep wave that is very near the point of breaking. In most cases, incipient waves broke beside or just after passing the buoy.
The buoy was observed as it encountered these three wave types. Table 1 provides a summary of the number and type of breaking waves observed, and how they break down in relation to the experimental variables.
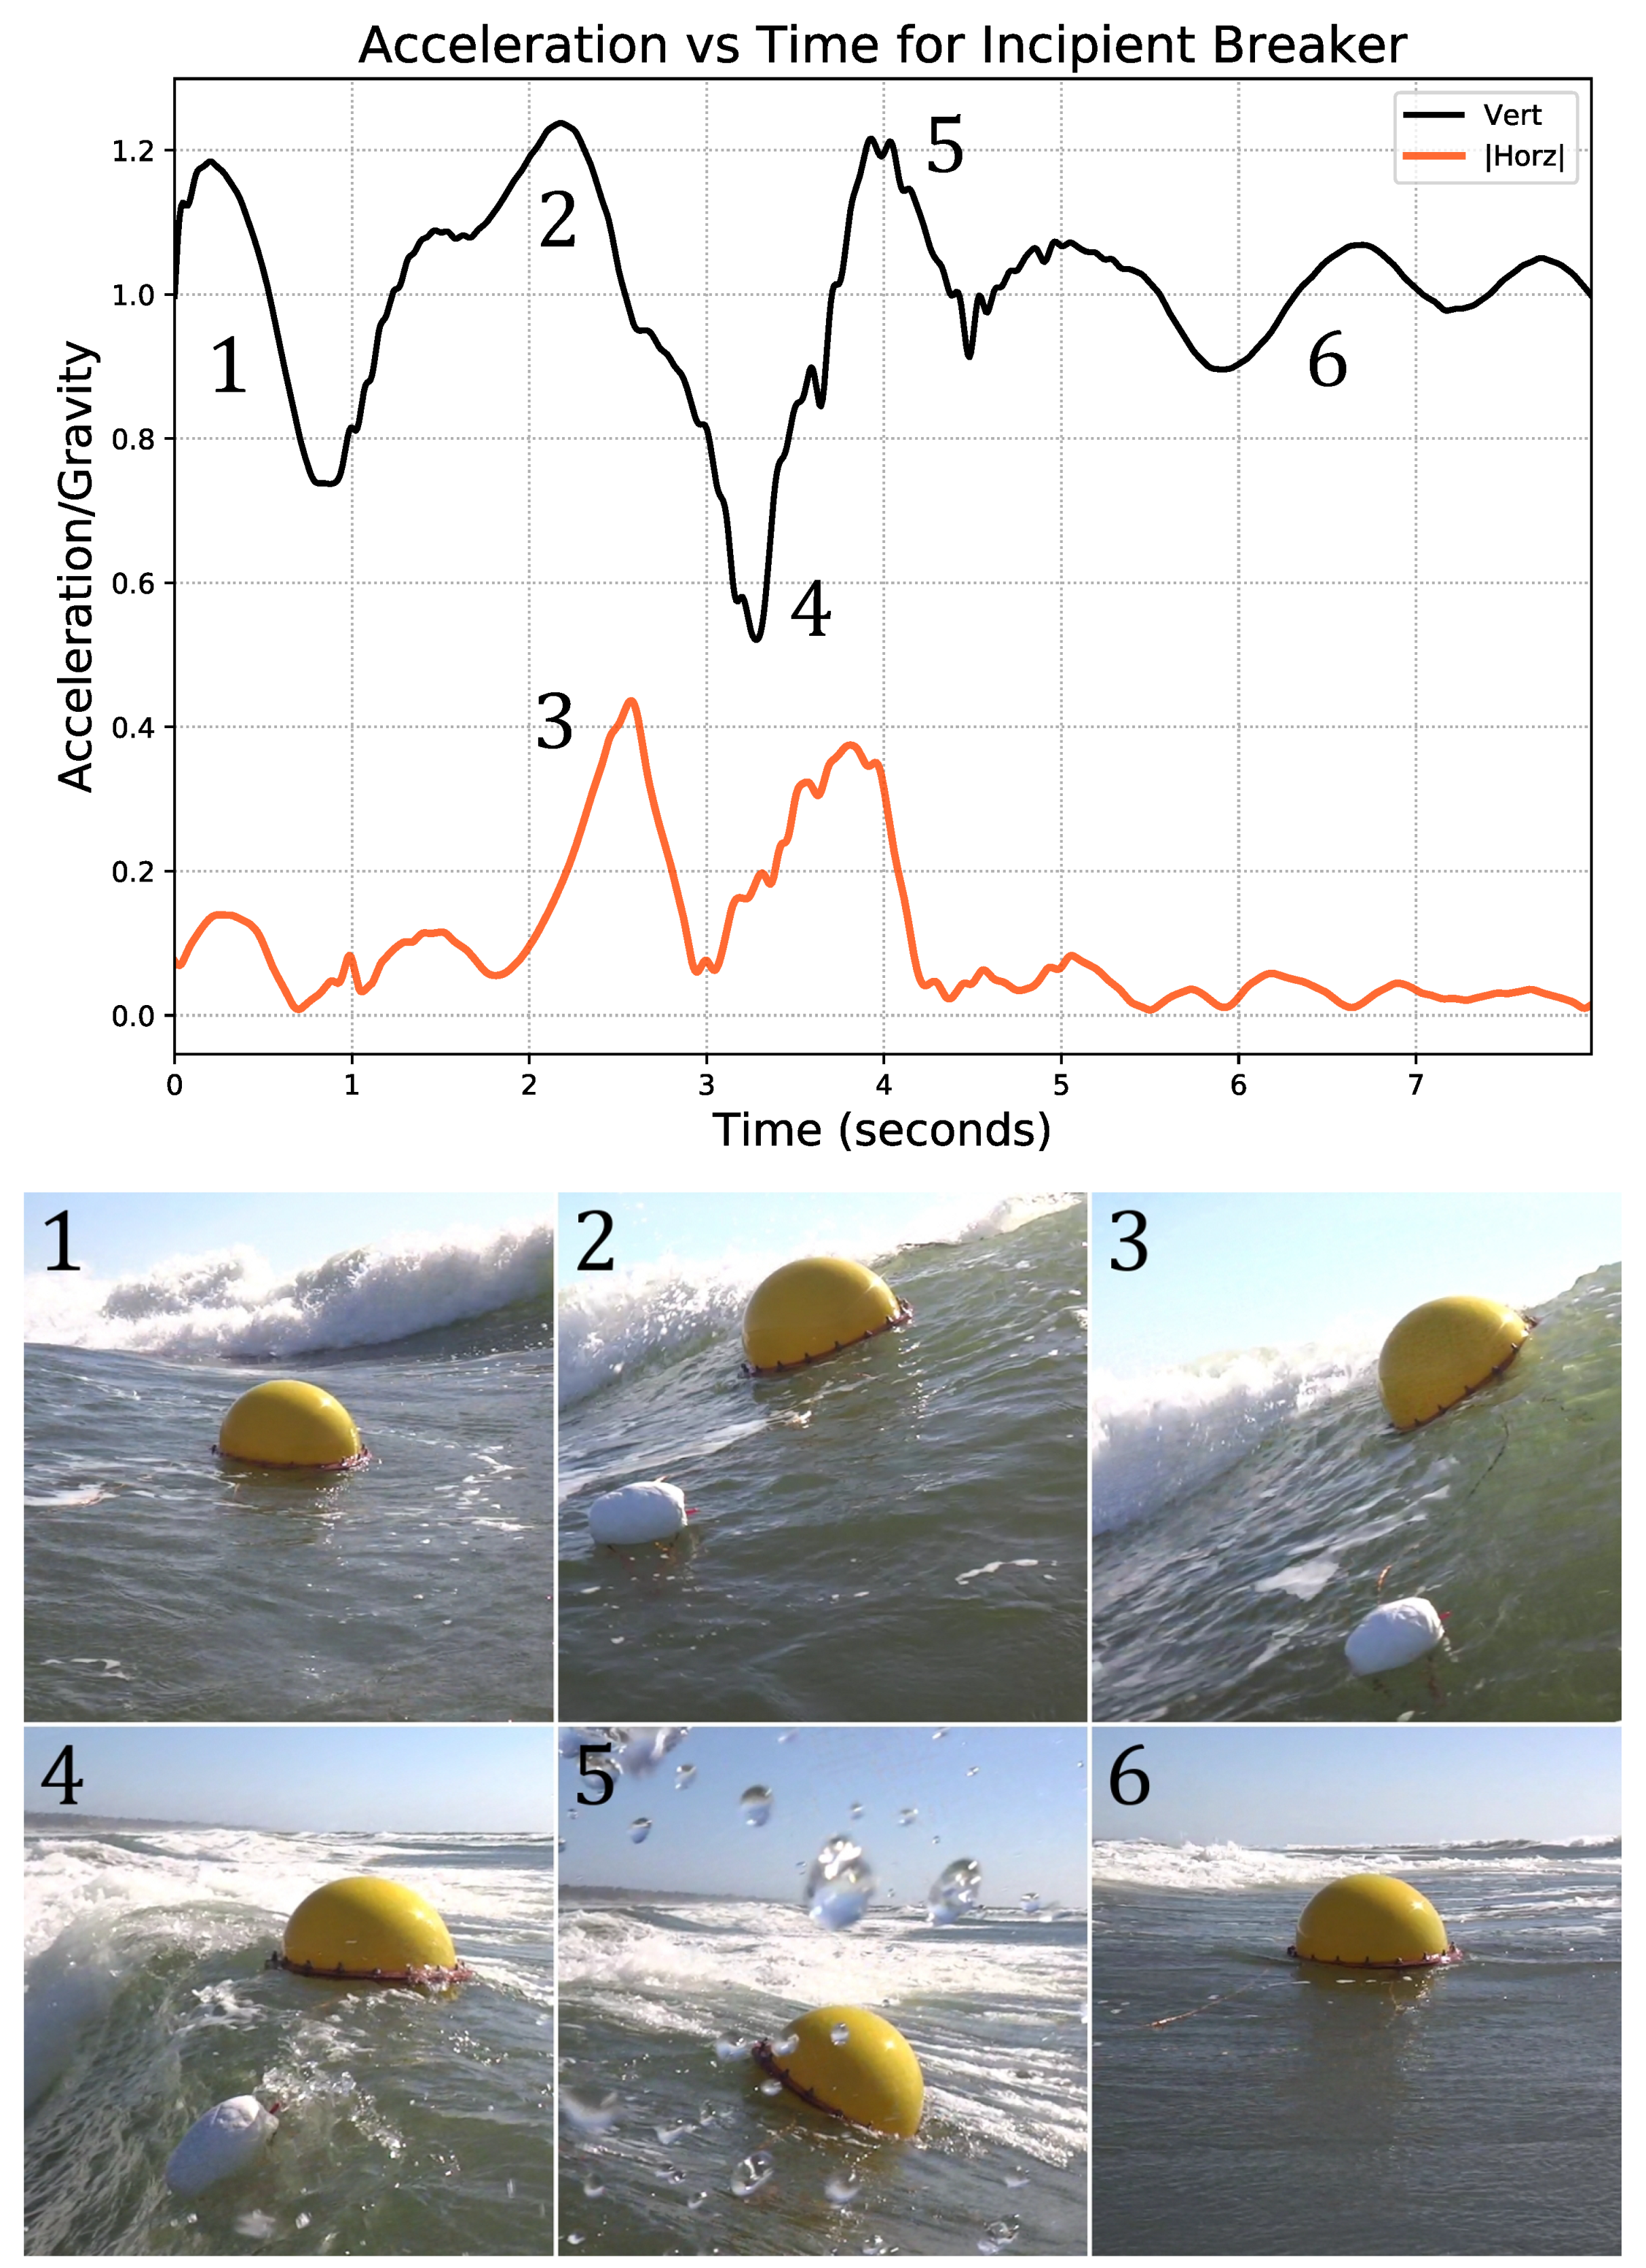
The buoy is first considered as it progresses over an incipient breaker (Figure 6). The observed effect of an incipient wave on the wave buoy is primarily confined to the duration of the waves presence. The buoy climbs the forward face of the wave following closely the slope of the free surface at this point; the buoy may be pitched nearly 90 toward shore; as the buoy crests the wave, the buoy pitches back toward the rear face of the wave. The rear face of the wave tends to fall away from the buoy while the buoy still has vertical inertia. This results in a downward acceleration as the buoy experiences a minor reduction in buoyancy due to reduced displacement. As the buoy pitches back to a neutral orientation, it may slightly over- or under-shoot resulting in minor residual oscillations in pitch and roll as the buoy quickly returns to equilibrium. Although there is variation between individual waves in the amplitudes of the accelerations experienced, the form of the acceleration signature shown in Figure 6 is representative of all observed incipient breaking waves.
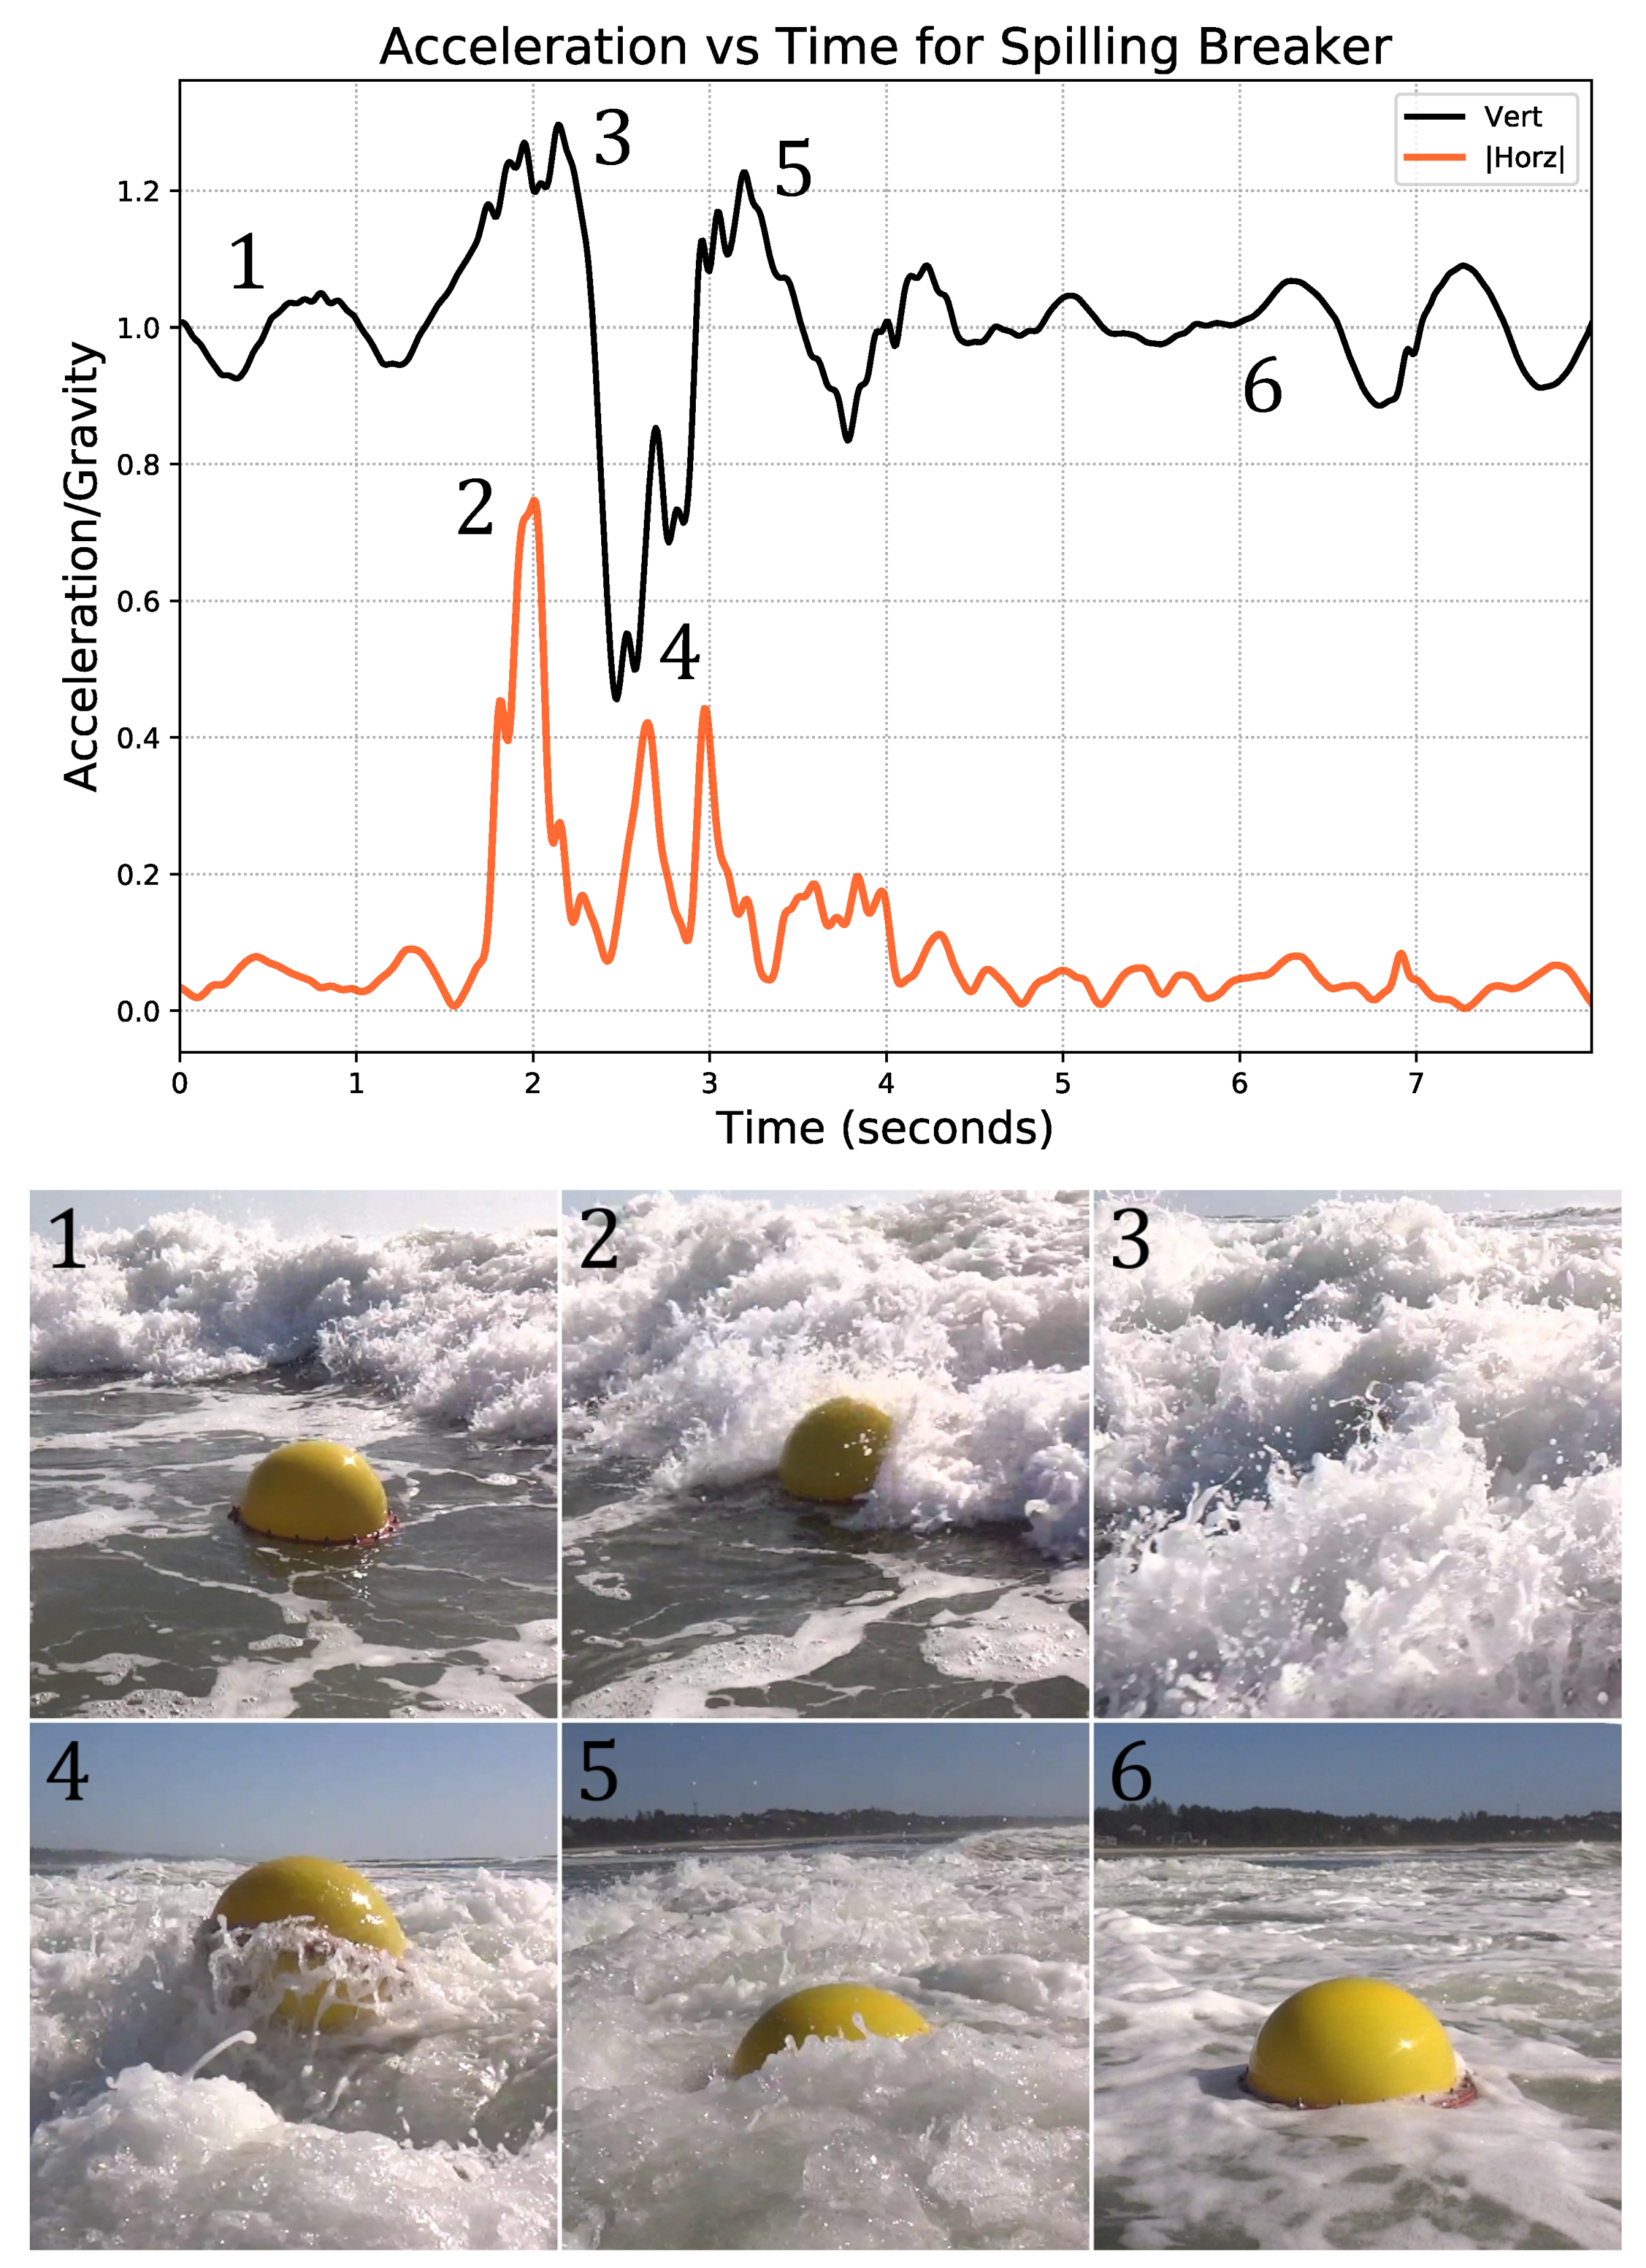
The impact of a spilling breaking wave on the buoy is shown in Figure 7. From the perspective of the buoy, a spilling breaker is essentially a turbulent flow of water with a slightly downward, but predominantly horizontal directionality. The buoy is first hit by the highly aerated turbulence of the wave. As the buoy is over-topped, the shoreward horizontal acceleration of the buoy reaches its maximum, and the now submerged buoy accelerates vertically toward the crest of the wave. The buoy explodes upward out of the wave, but the loss of buoyancy leads to a rapid deceleration of vertical motion. The buoy then falls back toward the surface. The buoy tends to emerge from the turbulence of the wave in a pitch and roll neutral orientation. As the buoy re-enters the water it will overshoot the point of neutral buoyancy and sink back into the turbulent wash of the wave. The turbulent water can induce additional vertical and horizontal accelerations in the buoy as it oscillates back to equilibrium. Just as with the response of the buoy to an incipient wave, the acceleration signature shown in Figure 7 is representative of all the spilling breakers observed in the data, although acceleration amplitudes do vary.
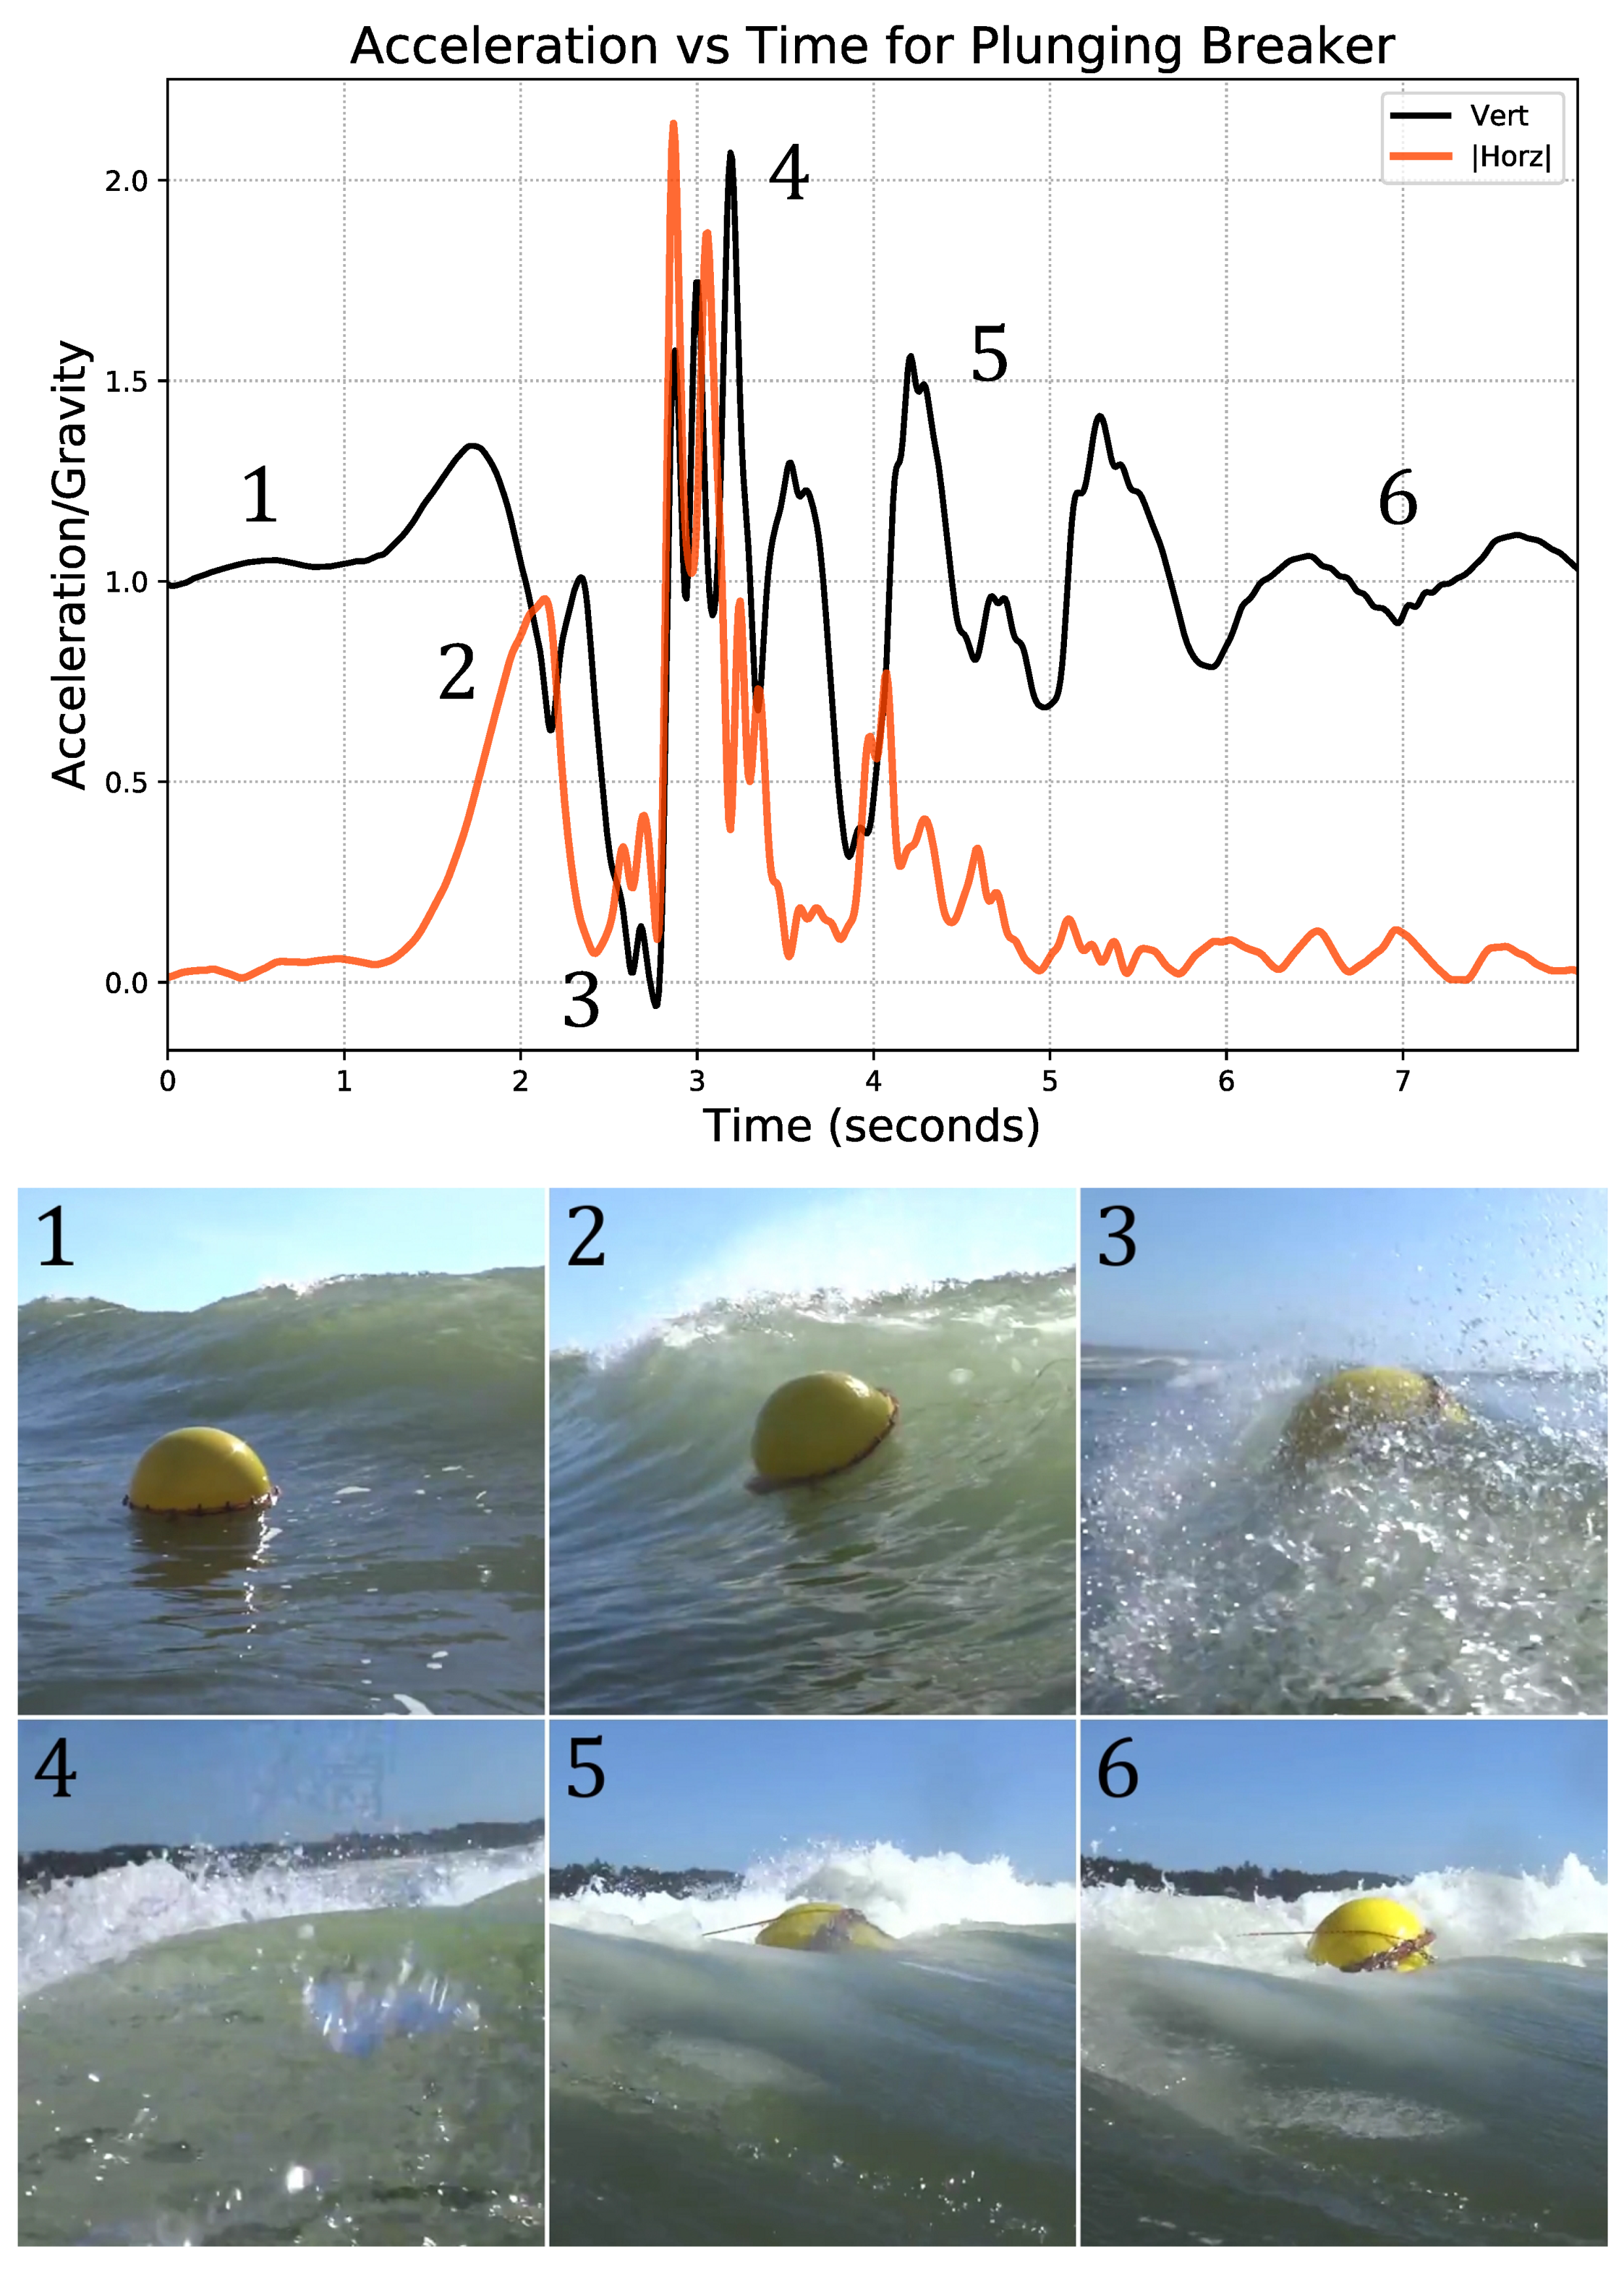
Plunging breakers produce similar accelerations to an incipient wave as the buoy climbs the forward face of the wave (Figure 8). A gradually increasing but strong shoreward acceleration is produced as the buoy reaches the wave crest, becomes entrained in the plunging jet, and is thrown forward. The buoy enters a brief moment of free-fall. Although plunging waves resulted in the largest accelerations observed during testing; the dominant acceleration was not associated with the impact of the wave crest; they are instead produced as the free-falling buoy re-enters the water in front of the wave and becomes trapped in the barrel, tumbling until the plunging wave transitions to spilling and the buoy emerges out of the turbulent wash. Just as with a spilling wave, the turbulence of the wash can produce secondary accelerations as the buoy returns to equilibrium. As intuitively expected, the signature of plunging breaking waves shows a great deal of variability after the buoy is trapped in the barrel. In the case of strong and persistent plunging events, the buoy may be carried a great distance shoreward before it is released. Despite the increased variability of plunging events, the signature shown in Figure 8 still well represents the events and accelerations common to plunging wave impacts.
The accelerations shown in Figure 6, Figure 7 and Figure 8 have been low-pass filtered using a Butterworth filter of fourth order with a cut-off frequency of 10 Hz. The filter is responsible for the vertical acceleration signal dropping below zero gravity as can be seen in Figure 8. An erroneous data spike in the unfiltered data occurred as the buoy transitioned to free-fall. Although the filter eliminates the data spike, the extreme value of the erroneous data point forces the filtered signal slightly below zero gravity. Although the data spikes are infrequent, their exact cause remains unknown, and may be a phenomenon specific to the IMU used in these tests. Their presence seems to coincide with periods of rapid buoy rotation. These spikes will be further discussed in Section 8.
6. Quantifying the Buoy Response
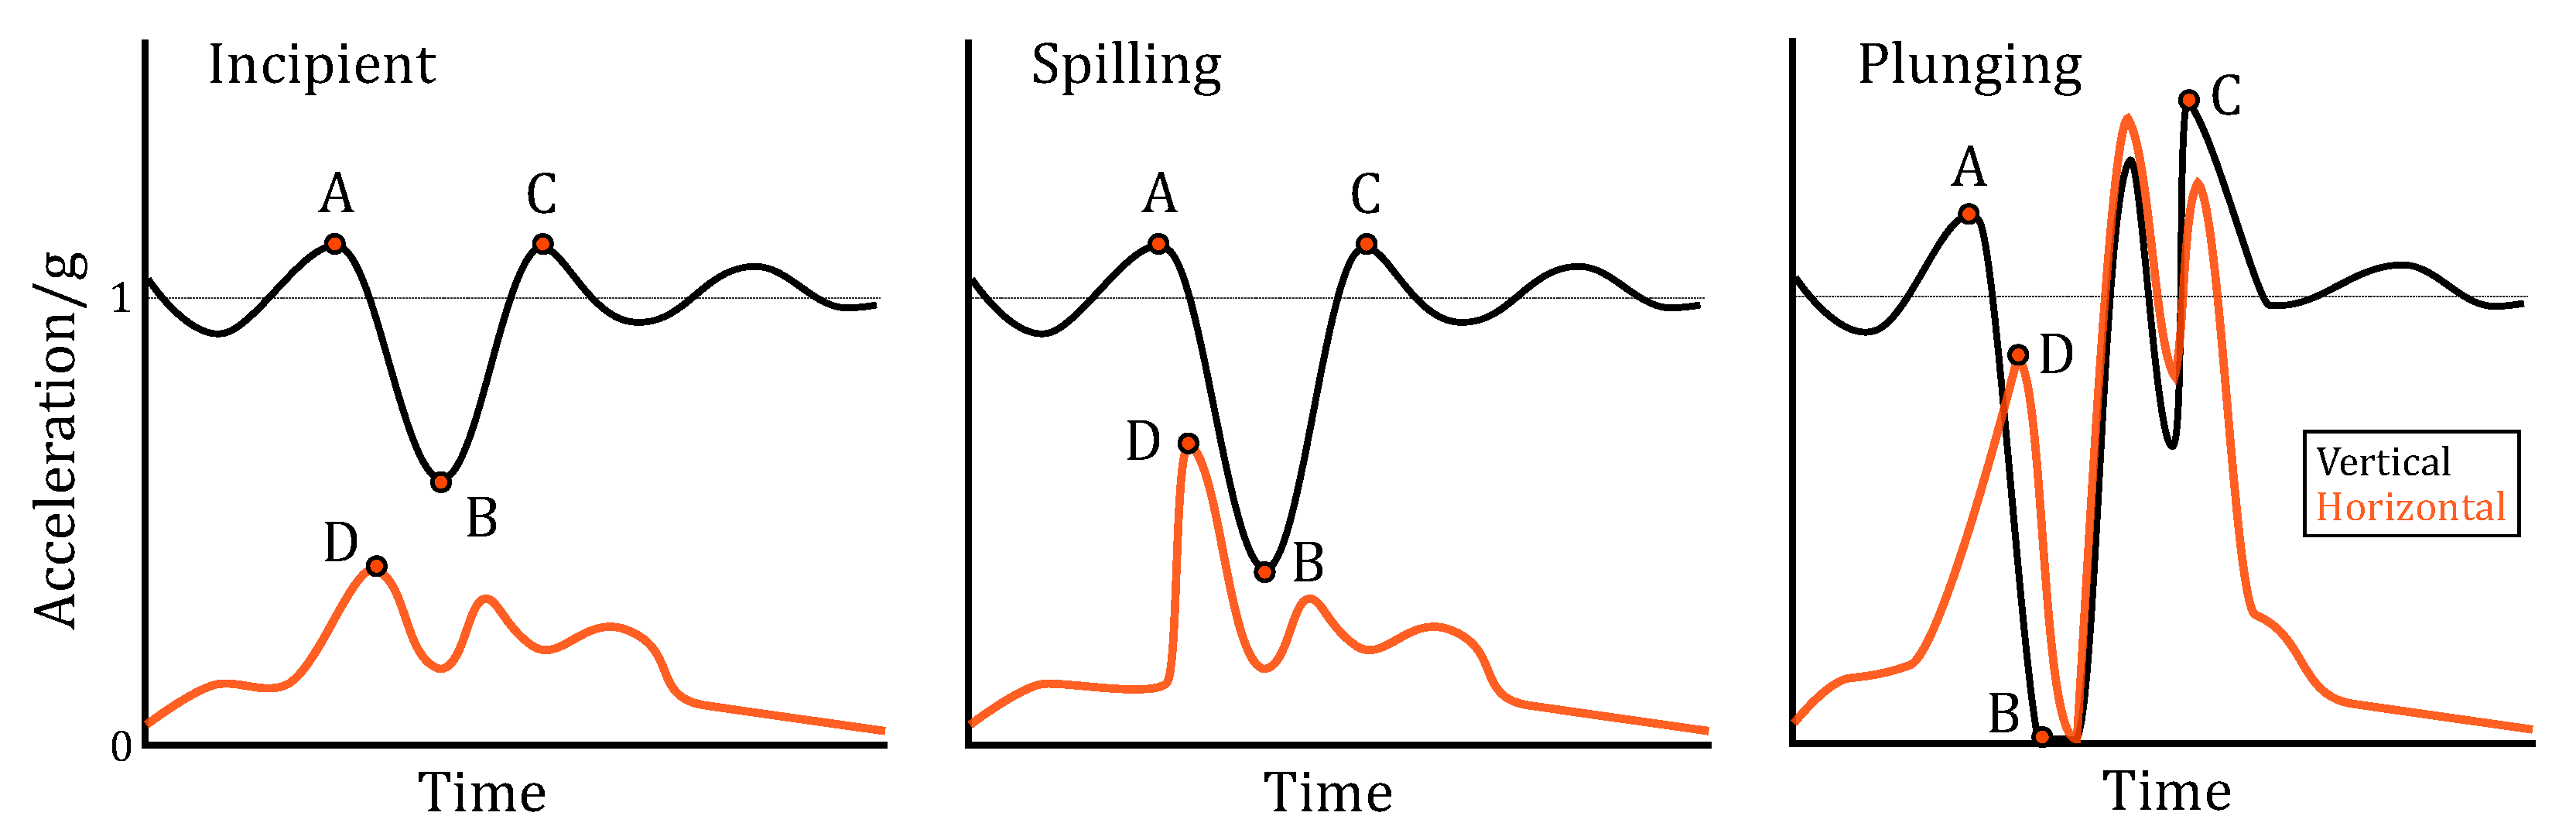
Due to the variation in breaker duration, and the subjectivity associated with identifying the “end” of a breaking wave impact, attempts at producing a numerically averaged breaking wave impact for each type resulted in an overly smoothed signal that was not representative of the acceleration data for individual impacts. For this reason, in order to quantify the acceleration signature of steep and breaking waves we instead chose to study four distinct qualitative points that are identifiable in all recorded impacts. Figure 9 provides a qualitative representation of the acceleration signature for the three wave types, and the associated features that are analyzed for each wave impact. For incipient and spilling breakers, point A is the maximum initial vertical acceleration developed as the buoy climbs the wave, while point B is the minimum acceleration reached as the buoy passes over the wave crest, and point C is the maximum vertical acceleration reached as the buoy returns to equilibrium in the wash of the wave. Point D is the only point used to characterize horizontal acceleration, as horizontal acceleration in the wash of the wave is heavily influenced by random accelerations associated with residual turbulence.
Four points were also used to characterize the signature of a plunging breaker; however, the points are generated by different physical processes. Point A remains similar to the case of incipient and spilling waves and it is the maximum initial vertical acceleration recorded as the buoy climbs the forward face of the wave. In the case of a plunging breaker, point B is the minimum acceleration reached as the buoy is thrown forward of the crest by the plunging jet. If the plunging wave is of sufficient height and energy, the buoy may attain free-fall. Point C is the maximum vertical acceleration attained as the buoy is tumbled in the barrel of the wave. Once again, only a single acceleration is used to characterize horizontal acceleration; point D is the maximum acceleration of the buoy as it is initially impacted by the wave.
The magnitude of rotational rate in pitch and roll was also calculated, and the maximum rotational rate produced by each wave was recorded. The buoy’s maximum rotational rate was usually attained near the beginning of the breaking wave impact. However, this finding is not ubiquitous, as several of the maximum rotational rates occurred as the buoy regained equilibrium in the wash of the wave. Yaw was not included in the calculation, as it was effected by the mooring configuration. An infrequent but strong instantaneous rotation in yaw was developed at moments when the mooring line became taut and the two bridle attachment points were forced perpendicular to the tensile mooring load.
Mean values and standard deviations are given for each of the five points in Table 2.
The mean accelerations experienced by a buoy are greatest when impacted by a plunging breaker. Incipient breakers generally produce the least intense accelerations. However, in terms of vertical acceleration, incipient and spilling waves can produce similar accelerations. The impact of both spilling and plunging waves produce intense horizontal accelerations that are not observed with incipient waves. The run up to the peak horizontal acceleration is typically steeper for spilling breakers than it is for either incipient or plunging waves, indicating an impact rather than a gradual acceleration. The largest accelerations produced by plunging waves are generated as the buoy, thrown forward of the crest, lands in the water and is tumbled by the wave.
To provide context for the acceleration values given in Table 2, it may be of use to examine several control data sets (Table 3). The three data sets used contain no breaking waves, although they do contain waves classified as incipient breakers. The three data sets represent a broad set of conditions. On 9 November 2013, the waves were composed of two independent swells, one with 20 s period, and the other with a 12 s period. The wave heights ranged from 1.2 to 2.2 m. 10 December 2013 provided a 1.2 m swell with a 12 s period; however, larger waves were present arriving in sets of three and separated by approximately 10 minutes. The first 45 min of data recorded on 10 December is used as a control data set, and contained no breaking waves. Finally, the 1.8 m waves, of 22 February 2014, were steep, consistent, and directionally spread with a period of approximately 12 s.
The vertical acceleration signatures identified in Figure 9 can be used to identify steep and breaking waves in the acceleration history of a wave measurement buoy. However, vertical acceleration is only partially effective at distinguishing breaking events from incipient waves. For instance, the maximum vertical acceleration recorded in the control data sets was 1.34-g which is still within the range of values observed in spilling and plunging breaking waves. The average minimum vertical acceleration reached during spilling and plunging breakers is substantially less than the minimum vertical acceleration recorded in the control data sets. However, there were spilling and plunging breakers that failed to produce accelerations less than the minimum recorded in the control data sets. This fact is partially explained by the difficulty involved in classifying breaker types. The waves were classified by examining the video of the impact. But, in reality, a spectrum of wave breaking possibilities exist, and waves in between classes may be difficult to correctly identify based on the video recording.
Horizontal acceleration provides a better distinction between incipient breakers and spilling and plunging breakers. Spilling breakers produce a mean horizontal acceleration of 0.80-g, while plungers average 1.18-g. Both of these values are substantially greater than the mean horizontal acceleration of incipient waves which is 0.26-g. However, several spilling breakers failed to produce horizontal accelerations in excess of the maximum horizontal acceleration measured in the control data sets. Again, this fact may be partially explained by discrepancies in the initial visual classification of the waves.
As previously mentioned, the run-up to the peak horizontal acceleration of spilling breakers is typically more abrupt than for incipient or plunging waves. Although the rate of increase in the magnitude of horizontal acceleration was not considered within this paper, it will be examined in future analyses.
The intense highly erratic accelerations in the plunging signature, defined by point C can be used to distinguish plunging from incipient and spilling breakers (Figure 9). The mean for this value was 1.91-g. However, if the plunging wave is approximately the same size as the buoy or smaller with short duration, the buoy can not become trapped in the barrel, and the response of the buoy resembles that of a strong spilling breaker.
Rotational rate provides a strong indication of plunging events, with rotational rates nearly an order of magnitude greater than the maximum recorded in any of the control data sets. Coupling rotational rate and the maximum vertical acceleration recorded for point C may provide a good indication of the strength of breaking.
7. The Effect of Mooring Loads and Water Depth
While developing the average buoy response to breaking waves, it was assumed that effects of both water depth and mooring loads were negligible. Qualitatively, the response of the buoy to breaking waves is similar regardless of water depth and mooring state. However, the validity of these assumptions are examined for spilling breakers in Table 4 and Table 5.
Considering first, the effect of water depth on breaking intensity, it can be seen that the initial vertical acceleration of the buoy and the magnitude of rotational rate in pitch and roll show little variation regardless of depth (Table 4). The downward acceleration associated with the buoy exploding over the crest of the wave is weakest in the mid-break tests. The maximum vertical acceleration of the buoy as it regains equilibrium in the wash of the wave was strongest in the outer-break tests. The magnitude of horizontal acceleration associated with the impact of the spilling crest was strongest in the outer-break tests, possibly due to the increased speed of the incoming wave. All recorded variations fall within a standard deviation, and are likely due, at least in part, to natural variation in the waves encountered.
The initial vertical acceleration (point A) and the secondary vertical acceleration (point C) as well as the rate of pitch and roll (point R) show little variation regardless of mooring state. Downward acceleration was strongest during moored testing, possibly due to the buoy being pulled through more of the wave prior to exploding out of the crest. The horizontal acceleration associated with the initial impact of the wave was marginally stronger during free-drifting tests. Again, the variations between moored and free-drifting tests fall within a standard deviation, and are likely due to natural variation in the waves recorded.
Bias could be present in the data presented here, as the testing variations were conducted on different days with different wave-fields. However, these results suggest that although both water-depth and the state of the mooring may effect the response of the buoy, the effect is small. Controlled flume testing would be required to prove a causal relation between the testing variables and variations in the buoy response.
8. Future Work
It was the original intent of this research to provide a breaking wave signature for spilling and plunging breakers which may be used to develop algorithms capable of performing real time detection and classification of breaking waves. The waves that have been recorded are clearly visible in the data; however, the number of breakers observed in the outer-break with a moored buoy is still low, and more data will be required to examine the effect of mooring and water depth on the signature of breaking.
Wavelet analysis has been used by other authors to distinguish non-linear and breaking wave events in wave data [29]. The breaking wave signature present in the horizontal acceleration data is similar in form to the first derivative of the Gaussian function while the vertical acceleration signature is similar to the second derivative. These functions may be appropriate mother wavelets for use in wavelet analysis. It was also observed that breaking typically occurred in wave sets, and within a wave set, the variability of wave period tends to collapse to a nearly constant value. This may be another effect that could be identified using wavelet analysis.
Observing the data, perhaps the most striking characteristic of the data near steep and breaking events is the rapid variation of acceleration amplitude and direction. It may be of use to consider the standard deviation of a small set of consecutive samples. A sudden increase in standard deviation would provide an indication of breaking. This technique would best be employed on a filtered signal to avoid false indications related to sensor noise.
Breaking wave impacts are intense short duration events. The wave measurement buoy recorded data at frequencies from 50 to 200 Hz depending on the deployment, but the choice of sampling rate was made arbitrarily. It would be valuable to perform a sensitivity experiment where the data set is systematically decimated, to determine the sampling frequency at which point the breaking wave signature can no longer be discerned. Such an experiment would provide valuable information that may help determine the necessary sampling rate chosen for wave measurement buoys deployed in deep water.
It may be useful to consider a fifth point in the characteristic signature of buoy acceleration due to breaking waves that describes the max horizontal acceleration after the initial vertical plunge. This point would be associated with the moment the buoy impacts the water in front of a plunging breaker, and may be useful to help distinguish plunging breakers from incipient and spilling waves.
It is uncommon for wave measurement buoys to be deployed so near the surf zone. Although it was originally envisioned that the data produced by this project would help determine the signature of a breaking wave, the data sets recorded in this experiment are unique, and may provide other information relevant to coastal research. Gemmrich and Garrett examined the presence of unexpected waves in the near-shore environment [30]. Several of our data sets contain waves matching their description.
Wave measurement buoys often record their data in spectral form, but in compressing the time-domain data to spectral form, the variation in the wave-field over the sampling period is generally lost if the component phase is not also recorded. It may be possible to examine the variation of near-shore wave-fields over varying time-scales to determine the maximum possible sampling duration that still allows wave-field variation to be resolved.
Despite its power and convenience, the IMU used in this project would not work, as a stand alone solution, for buoys deployed farther offshore in deep water. The capabilities of the IMU are not easily expanded; it can not accept the custom code required to detect breaking waves. The inclusion of additional instrumentation or telemetry within the buoy will demand a more versatile processing unit. Work toward this end has already begun.
9. Final Remarks
A wave measurement buoy, similar to commercial devices, was deployed off the coast of Newport Oregon, in water depths ranging from 1 to 9 m. Testing was conducted with the buoy moored and free-drifting. The acceleration signature produced by breaking waves is easily recognized in the data, and is qualitatively similar regardless of test configuration. Acceleration signatures characteristic of the three wave types examined in this paper were presented, and acceleration values were provided defining four points common to each wave type. A fifth point describing the max rotational rate of the buoy in pitch and roll was also provided.
Plunging breakers generate the most intense buoy accelerations and rotations, while the buoy response to an incipient wave is the weakest. Although the signature of incipient and spilling breakers is similar, the two can be distinguished by the elevated magnitude of horizontal acceleration produced by the impact of a spilling wave crest. It is also apparent that during a spilling impact, the magnitude of horizontal acceleration rises to its maximum more quickly than with an incipient breaker. Strong plunging breakers are readily identifiable in the data, as they produce accelerations and rotations far in excess of what would be expected in non-breaking waves. Plunging waves of short duration that are small relative to the size of the buoy have a signature similar to that of a spilling breaker with an intense initial horizontal acceleration.
This paper demonstrates that breaking waves can be identified and classified using a wave measurement buoy equipped with a low-cost 9 DoF IMU. The signatures provided in this paper may help inform the development of real-time breaker detection and classification algorithms. However, additional research and development is still required to fully characterize the traits that best distinguish spilling breakers from small plunging breakers.
Author Contributions
Conceptualization, A.C.B. and R.K.P.; methodology, A.C.B.; software, A.C.B.; validation, A.C.B.; formal analysis, A.C.B.; investigation, A.C.B.; resources, A.C.B. and R.K.P.; data curation, A.C.B.; writing–original draft preparation, A.C.B.; writing–review and editing, A.C.B. and R.K.P.; visualization, A.C.B.; supervision, R.K.P.; project administration, A.C.B. and R.K.P.; funding acquisition, A.C.B. and R.K.P. All authors have read and agreed to the published version of the manuscript.
Funding
This research received no external funding.
Institutional Review Board Statement
Not applicable.
Informed Consent Statement
Not applicable.
Data Availability Statement
Data available on request.
Conflicts of Interest
The authors declare no conflict of interest.
References
- Gemmrich, J.R.; Farmer, D.M. Observations of the scale and occurrence of breaking surface waves. J. Phys. Oceanogr. 1999, 29, 2595–2606. [Google Scholar] [CrossRef]
- Hann, M.R.; Greaves, D.M.; Raby, A. Physical measurements of breaking wave impact on a floating wave energy converter. In Proceedings of the EGU General Assembly, Vienna, Austria, 7–12 April 2013; Volume 15, p. 13879. [Google Scholar]
- Babanin, A.V.; Young, I.R.; Banner, M.L. Breaking probabilities for dominant surface waves on water of finite constant depth. J. Geophys. Res. 2006, 106, 11659–11676. [Google Scholar] [CrossRef]
- Banner, M.L.; Babanin, A.V.; Young, I.R. Breaking probability for dominant waves on the sea surface. J. Phys. Oceanogr. 2000, 30, 3145–3160. [Google Scholar] [CrossRef]
- Banner, M.L.; Gemmrich, J.R.; Farmer, D.M. Multiscale measurements of ocean wave breaking probability. J. Phys. Oceanogr. 2002, 32, 3364–3375. [Google Scholar] [CrossRef]
- Brown, A.C.; Thomson, J.; Ellenson, A.; Rollano, F.T.; Özkan-Haller, H.T.; Haller, M.C. Kinematics and statistics of breaking waves observed using SWIFT buoys. IEEE J. Ocean. Eng. 2018, 44, 1011–1023. [Google Scholar] [CrossRef]
- Holthuijsen, L.H.; Herbers, T.H.C. Statistics of breaking waves observed as whitecaps in the open sea. J. Phys. Oceanogr. 1986, 16, 290–297. [Google Scholar] [CrossRef] [Green Version]
- Cokelet, E.D. Breaking waves. Nature 1977, 267, 769–774. [Google Scholar] [CrossRef]
- Peregrine, D.H. Water-wave impact on walls. Annu. Rev. Fluid Mech. 2003, 35, 23–43. [Google Scholar] [CrossRef]
- Hu, Z.Z.; Mai, T.; Greaves, D.; Raby, A. Investigations of offshore breaking wave impacts on a large offshore structure. J. Fluids Struct. 2017, 99, 100–116. [Google Scholar] [CrossRef] [Green Version]
- Song, J.B.; Banner, M.L. On determining the onset and strength of breaking for deep water waves. Part I: Unforced irrotational wave groups. J. Phys. Oceanogr. 2002, 32, 2541–2558. [Google Scholar] [CrossRef]
- Melville, W.K. The role of surface-wave breaking in air-sea interaction. Annu. Rev. Fluid Mech. 1996, 28, 279–321. [Google Scholar] [CrossRef]
- Sutherland, P.; Melville, W.K. Field measurements and scaling of ocean surface wave-breaking statistics. Geophys. Res. Lett. 2013, 40, 3074–3079. [Google Scholar] [CrossRef]
- Babanin, A.V. Breaking of ocean surface waves. Acta Phys. Slovaca Rev. Tutor 2009, 59, 305–535. [Google Scholar] [CrossRef]
- Blenkinsopp, C.E.; Chaplin, J.R. Void fraction measurements and scale effects in breaking waves in freshwater and seawater. Coast. Eng. 2011, 58, 417–428. [Google Scholar] [CrossRef]
- Jessup, A.T.; Melville, W.K.; Keller, W.C. Breaking waves affecting microwave backscatter: 2. Dependence on wind and wave conditions. J. Geophys. Res. Ocean. 1991, 96, 20561–20569. [Google Scholar] [CrossRef]
- Manasseh, R.; Babanin, A.V.; Forbes, C.; Rickards, K.; Bobevski, I.; Ooi, A. Passive acoustic determination of wave-breaking events and their severity across the spectrum. J. Atmos. Ocean. Technol. 2006, 23, 599–618. [Google Scholar] [CrossRef]
- Schwendeman, M.C.; Thomson, J. Sharp-crested breaking surface waves observed from a ship-based stereo video system. J. Phys. Oceanogr. 2017, 47, 775–792. [Google Scholar] [CrossRef]
- Longuet-Higgins, M.S.; Smith, N.D. Measurement of breaking waves by a surface jump meter. J. Geophys. Res. 1983, 88, 9823–9831. [Google Scholar] [CrossRef]
- Pascal, R.W.; Yelland, M.J.; Srokosz, M.A.; Moat, B.I.; Waugh, E.M.; Comben, D.H.; Cansdale, A.G.; Hartman, M.C.; Coles, D.G.H.; Chang Hsueh, P.; et al. A spar buoy for high-frequency wave measurements and detection of wave breaking in the open ocean. J. Atmos. Ocean. Technol. 2011, 28, 590–605. [Google Scholar] [CrossRef]
- Thorpe, S.A.; Humphries, P.N. Bubbles and breaking waves. Nature 1980, 283, 463–465. [Google Scholar] [CrossRef]
- Schwendeman, M.; Thomson, J.; Gemmrich, J.R. Wave breaking dissipation in a young wind sea. J. Phys. Oceanogr. 2014, 44, 104–127. [Google Scholar] [CrossRef]
- Thomson, J. Wave breaking dissipation observed with "SWIFT" drifters. J. Atmos. Ocean. Technol. 2012, 29, 1866–1882. [Google Scholar] [CrossRef]
- Balaji, R.; Sannasiraj, S.A.; Sundar, V. Identification of breaking events from the responses of a data buoy. Proc. Inst. Mech. Eng. Part J. Eng. Marit. Environ. 2010, 224, 127–139. [Google Scholar] [CrossRef]
- Balaji, R.; Sannasiraj, S.A.; Sundar, V. Development of novel instrumented Lagrangian drifters to probe the internal structure of breaking surface waves. In Proceedings of the OCEANS 2012, Hampton Roads, VA, USA, 14–19 October 2012; Volume 224, pp. 1–6. [Google Scholar]
- Sinclair, A. FlowRider: A lagrangian float to measure 3-D dynamics of plunging breakers in the surf zone. J. Coast. Res. 2014, 293, 205–209. [Google Scholar] [CrossRef]
- Yost Labs. 3-Space Data Logger. Available online: https://yostlabs.com/product/3-space-data-logger/ (accessed on 16 February 2021).
- Hanson, A.J. Visualizing Quaternions; Kaufmann, M., Ed.; Elsevier Science: San Francisco, CA, USA, 2006. [Google Scholar]
- Liu, P.C.; Babanin, A.V. Using wavelet spectrum analysis to resolve breaking events in the wind wave time series. Ann. Geophys. 2004, 22, 3335–3345. [Google Scholar] [CrossRef]
- Gemmrich, J.R.; Garrett, C. Unexpected waves: Intermediate depth simulations and comparison with observations. Ocean Eng. 2010, 37, 262–267. [Google Scholar] [CrossRef]
Figure 1.
Exploded view of the developed wave measurement buoy hull assembly.

Figure 2.
Exploded view of the ballast assembly for the wave measurement buoy.

Figure 3.
The wave measurement buoy and anchor line developed for the research project are shown laid out on Agate Beach. (A) buoy, (B) damping chain, (C) bridle, (D) bridle float, (E) rubber cord, (F) surface float, (G) rubber cord, (H) sinker, (I) chain, (J) nylon line, (K) anchor chain, (L) drag anchor.

Figure 4.
(Top) The buoy is tied down in the kayak prior to deployment with Yaquina Head in the background. (Bottom) The approximate deployment location off Agate Beach, OR is marked with an orange dot.
Figure 4.
(Top) The buoy is tied down in the kayak prior to deployment with Yaquina Head in the background. (Bottom) The approximate deployment location off Agate Beach, OR is marked with an orange dot.

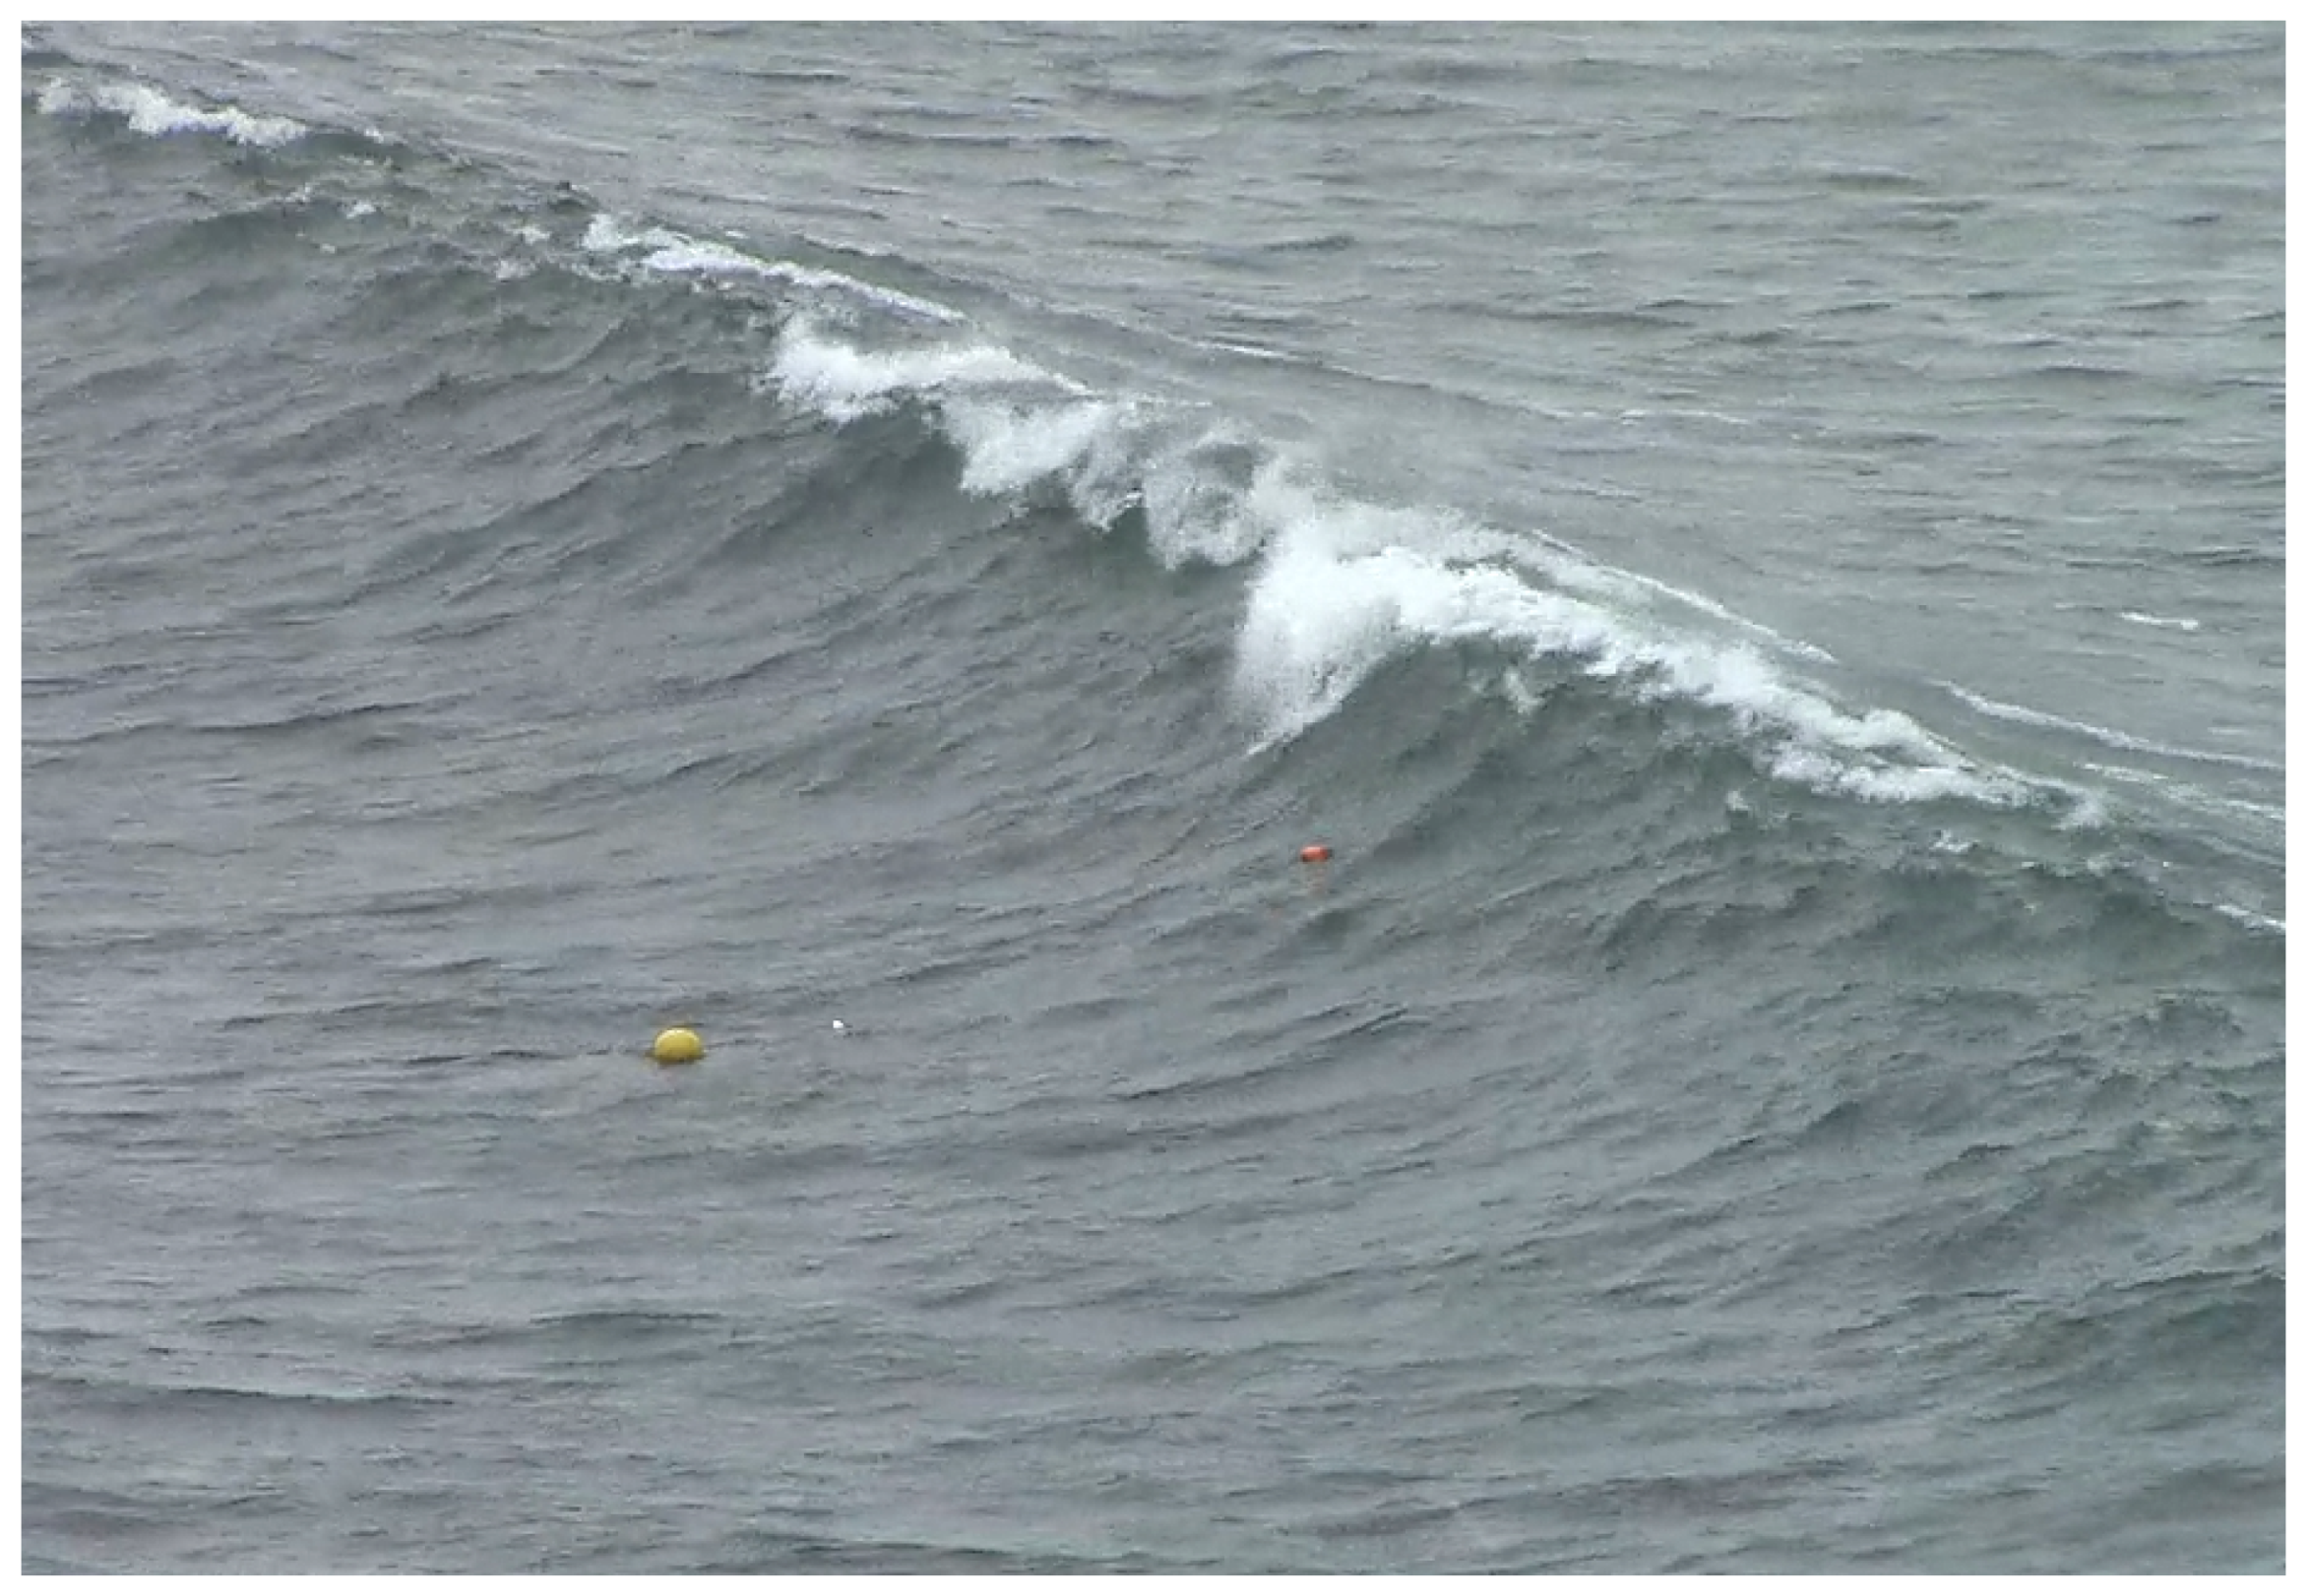
Figure 5.
A breaking wave approaches the wave measurement buoy on 23 February 2014. The image is a screen capture from the recorded video.
Figure 5.
A breaking wave approaches the wave measurement buoy on 23 February 2014. The image is a screen capture from the recorded video.

Figure 6.
A sequence of screen captures from the video of an incipient wave encounter is shown below a plot of the induced buoy accelerations. The buoy is shown: (1) floating in the preceding wave trough, (2) rising up the front face of the wave, (3) just prior to cresting the wave, (4) passing over the wave crest, (5) diving into the rear face of the wave, and (6) regaining equilibrium after the wave has passed. Wave recorded on 10 April 2014 at 16:20:06 PDT.

Figure 7.
A sequence of screen captures from the video of a spilling wave impact is shown below a plot of the induced buoy accelerations. The buoy is shown: (1) free floating before impact, (2) during the initial impact of the spilling breaker, (3) as it is over-topped and submerged by the spilling wave, (4) rising vertically out of the spilling wash, (5) falling back into the stabilizing rear face of the wave, and (6) regaining stability. Wave recorded on 10 April 2014 at 16:21:06 PDT.

Figure 8.
A sequence of screen captures from the video of a plunging wave impact. The buoy is shown: (1) floating in the preceding wave trough, (2) rising vertically on the front face of the wave, (3) entering the plunging jet, (4) falling forward of the wave, (5) emerging from the wave as it transitions to spilling, and (6) regaining equilibrium in the waves wash. Wave recorded on 10 April 2014 at 16:10:41 PDT.

Figure 9.
Approximate representations of the acceleration signature produced by incipient, spilling, and plunging breakers. Four points were used to quantify the acceleration magnitudes generated by the different breaker types. Point A is the maximum vertical heave acceleration generated as the wave approaches, while point B is the minimum vertical acceleration reached as the buoy reaches the wave crest. Point C, in the case of incipient and spilling waves, is the maximum vertical acceleration of the buoy as it falls back into the wash behind the wave, or in the case of plunging, lands in the water forward of the wave and tumbles in the barrel. Point D is the maximum horizontal acceleration generated by the initial impact of the wave.


Table 1.
Composition of the data for each wave type. This table provides the number of waves recorded in varying conditions.
Table 1.
Composition of the data for each wave type. This table provides the number of waves recorded in varying conditions.
| Wave Type | Total | Outer-Break (4.5–9 m Depth) | Mid-Break (2–4.5 m Depth) | Surf Zone (1–2 m Depth) | Moored | Free-Drifting |
|---|---|---|---|---|---|---|
| Incipient | 45 | 28 | 9 | 8 | 34 | 11 |
| Spilling | 180 | 9 | 34 | 137 | 95 | 85 |
| Plunging | 16 | 2 | 0 | 14 | 3 | 13 |
Table 2.
Mean and standard deviation for the five characteristic points defining the wave signature. Points A through D have units of acceleration/g, while the R column is the maximum magnitude of pitch and roll rotational rate recorded during the breaking event having units of rad/s.
Table 2.
Mean and standard deviation for the five characteristic points defining the wave signature. Points A through D have units of acceleration/g, while the R column is the maximum magnitude of pitch and roll rotational rate recorded during the breaking event having units of rad/s.
| Type | A | B | C | D | R | |||||
|---|---|---|---|---|---|---|---|---|---|---|
| Mean | StD | Mean | StD | Mean | StD | Mean | StD | Mean | StD | |
| Incipient | 1.19 | 0.04 | 0.53 | 0.15 | 1.24 | 0.11 | 0.26 | 0.08 | 2.13 | 0.98 |
| Spilling | 1.36 | 0.17 | 0.34 | 0.17 | 1.29 | 0.17 | 0.80 | 0.32 | 4.15 | 1.26 |
| Plunging | 1.42 | 0.16 | 0.15 | 0.19 | 1.91 | 0.48 | 1.18 | 0.44 | 8.70 | 4.89 |
Table 3.
Accelerations and maximum magnitude of rotational rate for three control data sets. Although these data sets contain steep waves and incipient breakers, they contain no spilling or plunging breakers. Vertical and horizontal acceleration are given in units of acceleration/g as and , respectively. The magnitude of rotational rate in pitch and roll is given in units of rad/s as R.
| Date | Time | Duration | R | |||||
|---|---|---|---|---|---|---|---|---|
| Max | Min | Mean | Max | Mean | Max | |||
| 9 November 2013 | 10:10 | 03:00 | 1.33 | 0.578 | 0.0398 | 0.314 | 0.296 | 1.37 |
| 10 December 2013 | 11:45 | 00:45 | 1.23 | 0.683 | 0.0342 | 0.335 | 0.403 | 2.16 |
| 22 February 2014 | 11:15 | 02:15 | 1.34 | 0.478 | 0.0550 | 0.518 | 0.581 | 2.80 |
Table 4.
Mean and standard deviation for the five characteristic points defining the wave signature for impacts by spilling breakers in varying depths. Points A through D have units of acceleration/g, while the R column is the maximum magnitude of pitch and roll rotational rate recorded during the breaking event having units of rad/s.
| Type | A | B | C | D | R | |||||
|---|---|---|---|---|---|---|---|---|---|---|
| Mean | StD | Mean | StD | Mean | StD | Mean | StD | Mean | StD | |
| Outer-Break | 1.35 | 0.18 | 0.37 | 0.18 | 1.39 | 0.23 | 0.95 | 0.50 | 4.77 | 1.75 |
| Mid-Break | 1.25 | 0.13 | 0.46 | 0.15 | 1.27 | 0.25 | 0.75 | 0.35 | 4.10 | 1.75 |
| Surf Zone | 1.35 | 0.15 | 0.34 | 0.17 | 1.29 | 0.17 | 0.80 | 0.30 | 4.13 | 1.26 |
Table 5.
Mean and standard deviation for the five characteristic points defining the wave signature for impacts by spilling breakers with the buoy moored and free-drifting in the surf zone. Points A through D have units of acceleration/g, while the R column is the maximum magnitude of pitch and roll rotational rate recorded during the breaking event having units of rad/s.
| Type | A | B | C | D | R | |||||
|---|---|---|---|---|---|---|---|---|---|---|
| Mean | StD | Mean | StD | Mean | StD | Mean | StD | Mean | StD | |
| Moored | 1.36 | 0.15 | 0.30 | 0.16 | 1.28 | 0.13 | 0.77 | 0.25 | 4.01 | 1.13 |
| Free-Drifting | 1.34 | 0.15 | 0.41 | 0.18 | 1.30 | 0.22 | 0.83 | 0.36 | 4.33 | 1.43 |
Publisher’s Note: MDPI stays neutral with regard to jurisdictional claims in published maps and institutional affiliations. |
© 2021 by the authors. Licensee MDPI, Basel, Switzerland. This article is an open access article distributed under the terms and conditions of the Creative Commons Attribution (CC BY) license (http://creativecommons.org/licenses/by/4.0/).
Share and Cite
MDPI and ACS Style
Brown, A.C.; Paasch, R.K. The Accelerations of a Wave Measurement Buoy Impacted by Breaking Waves in the Surf Zone. J. Mar. Sci. Eng. 2021, 9, 214. https://0-doi-org.brum.beds.ac.uk/10.3390/jmse9020214
AMA Style
Brown AC, Paasch RK. The Accelerations of a Wave Measurement Buoy Impacted by Breaking Waves in the Surf Zone. Journal of Marine Science and Engineering. 2021; 9(2):214. https://0-doi-org.brum.beds.ac.uk/10.3390/jmse9020214
Chicago/Turabian StyleBrown, Adam C., and Robert K. Paasch. 2021. "The Accelerations of a Wave Measurement Buoy Impacted by Breaking Waves in the Surf Zone" Journal of Marine Science and Engineering 9, no. 2: 214. https://0-doi-org.brum.beds.ac.uk/10.3390/jmse9020214
Note that from the first issue of 2016, this journal uses article numbers instead of page numbers. See further details here.