
Dynamic Evacuation Planning on Cruise Ships Based on an Improved Ant Colony System (IACS)


School of Automotion, Wuhan University of Technology, Wuhan 430070, China
*
Author to whom correspondence should be addressed.
J. Mar. Sci. Eng. 2021, 9(2), 220; https://0-doi-org.brum.beds.ac.uk/10.3390/jmse9020220
Submission received: 18 January 2021
/
Revised: 10 February 2021
/
Accepted: 17 February 2021
/
Published: 19 February 2021
(This article belongs to the Special Issue Advances in Maritime Safety)
Abstract
:The emergency evacuation route planning of cruise ships directly affects the safety of all crew members and passengers during emergencies. Research on the planning of emergency evacuation routes for cruise ships is a frontier subject of maritime safety. This study proposes an improved ant colony system (IACS) to solve the evacuation route planning of crowds on cruise ships. The IACS, which is different from common single-path ant colony system (ACS) evacuation algorithms, is used to solve the multipath planning problem of crowd evacuation from cruise ships by considering crowd density and speed in the model. An increasing flow method is introduced into the IACS to improve the efficiency of the proposed algorithm. Numerical experiments show that this method meets the requirements of evacuation analysis guidelines for new and existing passenger ships (MSC.1/Circ.1533)and can effectively and efficiently plan the emergency evacuation path for cruise ship crowd.
1. Introduction
Cruise ships are public places where dense crowds gather. The protection of the safety of all crew members and passengers and the reduction in property losses are current hotspots in maritime safety research [1,2,3]. The “Interim Guidelines for the Evacuation Analysis for New and Existing Passenger Ships” (MSC.1/Circ.1533)issued by the International Maritime Organization clarified the technical requirements for emergency evacuation [4,5,6]. Cruise ship commanders can offer the crowd an optimal evacuation route through an evacuation planning procedure using evacuation signs [7,8]. The planning of emergency evacuation routes becomes considerably difficult as the structure of cruise ships becomes increasingly complex. Therefore, emergency evacuation route planning methods should be improved and perfected constantly due to these challenges.
At present, research on crowd evacuation is mainly divided into two aspects. On the one hand, the research starts from the microsimulation of the relationship between crowds. The main models include multi-agent, social force, and cellular automata models [9,10,11]. The multi-agent model simulates crowd evacuation through an intelligent agent; in this model, each person is an intelligent agent, and a certain number of commanders are set to reproduce the evacuation scene [12,13,14,15]. The cellular automata model divides the evacuated places into regular grids and uses cells to simulate the movement of people on the grid according to certain transition rules [16]. The social force model simulates the forces between crowds. The simulation effect describes the characteristics of crowds at the micro level effectively but requires substantial running memory [17]. The complex structure of cruise ships have led to some bottlenecks in the research on combining actual cruise ship evacuation.
On the other hand, local and international scholars have been studying crowd evacuation methods based on meta-heuristic algorithms, achieving good results [18,19,20]. Li et al. [21] proposed a genetic algorithm to optimize the design of crowd evacuation facilities. Dulebenets et al. [22] combined the mixed-integer programming model and meta-heuristic algorithm to solve the emergency evacuation route planning problem in Broward. Ni et al. [23] studied the capacity-constrained contraflow emergency traffic network evacuation path planning algorithm to improve the road traffic capacity limit and the evacuation path efficiency. Goerigk et al. [24] established a macro multi-objective optimization model based on genetic algorithm for the evacuation of the urban population in disaster situations.
Many studies have also applied ant colony optimization (ACO) in the field of emergency evacuation of a single path. Liu et al. [25] proposed a quantum ant colony algorithm and applied it to the route planning from a single departure point to a single destination. Batmetan et al. [26] used ACO to study the evacuation guidance method suitable for disasters. Forcael et al. [27] studied ACO to find the best evacuation route during a tsunami. Researchers using the network flow algorithm have seldom considered crowd density and speed. Lim et al. [28] proposed a capacity-constrained network flow optimization method to find evacuation routes, flow rates, and time arrangements to improve evacuation efficiency. Cova et al. [29] introduced a network flow model for optimal evacuation routes when solving traffic emergency evacuation problems. Chen et al. [30] studied the emergency evacuation of buildings and proposed a fast flow control algorithm. Therefore, solving the multipath planning of crowds is a difficult aspect for the emergency evacuation on cruise ships considering parameters such as crowd density and speed.
The emergency evacuation of cruise ships can prevent possible dangerous situations on cruise ships. In recent years, many scholars have devoted themselves to research on risk prevention in emergency evacuation [31,32]. Di Gangi et al. [33] established a mesoscopic simulation model of an emergency evacuation, which can truly reproduce user behavior. Russo et al. [34] proposed a model for risk evaluation in transportation systems and successfully applied this model in engineering practice. Yoo et al. [35] introduced a real-time risk analysis tool based on a geographic information system to establish emergency response and risk communication plans to assist personnel in emergency evacuations. This study proposes the method of the improved ant colony system (IACS) to solve the difficulties in emergency evacuations on cruise ships. A network diagram of the evacuation nodes on cruise ships is established in accordance with the layout of the ship. A mathematical model for emergency evacuations on cruise ships is established by considering crowd density and speed. The IACS is used to solve the multipath planning problem of emergency evacuations, which verifies the effectiveness of the algorithm.
2. Establishment of an Algorithm Model
2.1. ACS
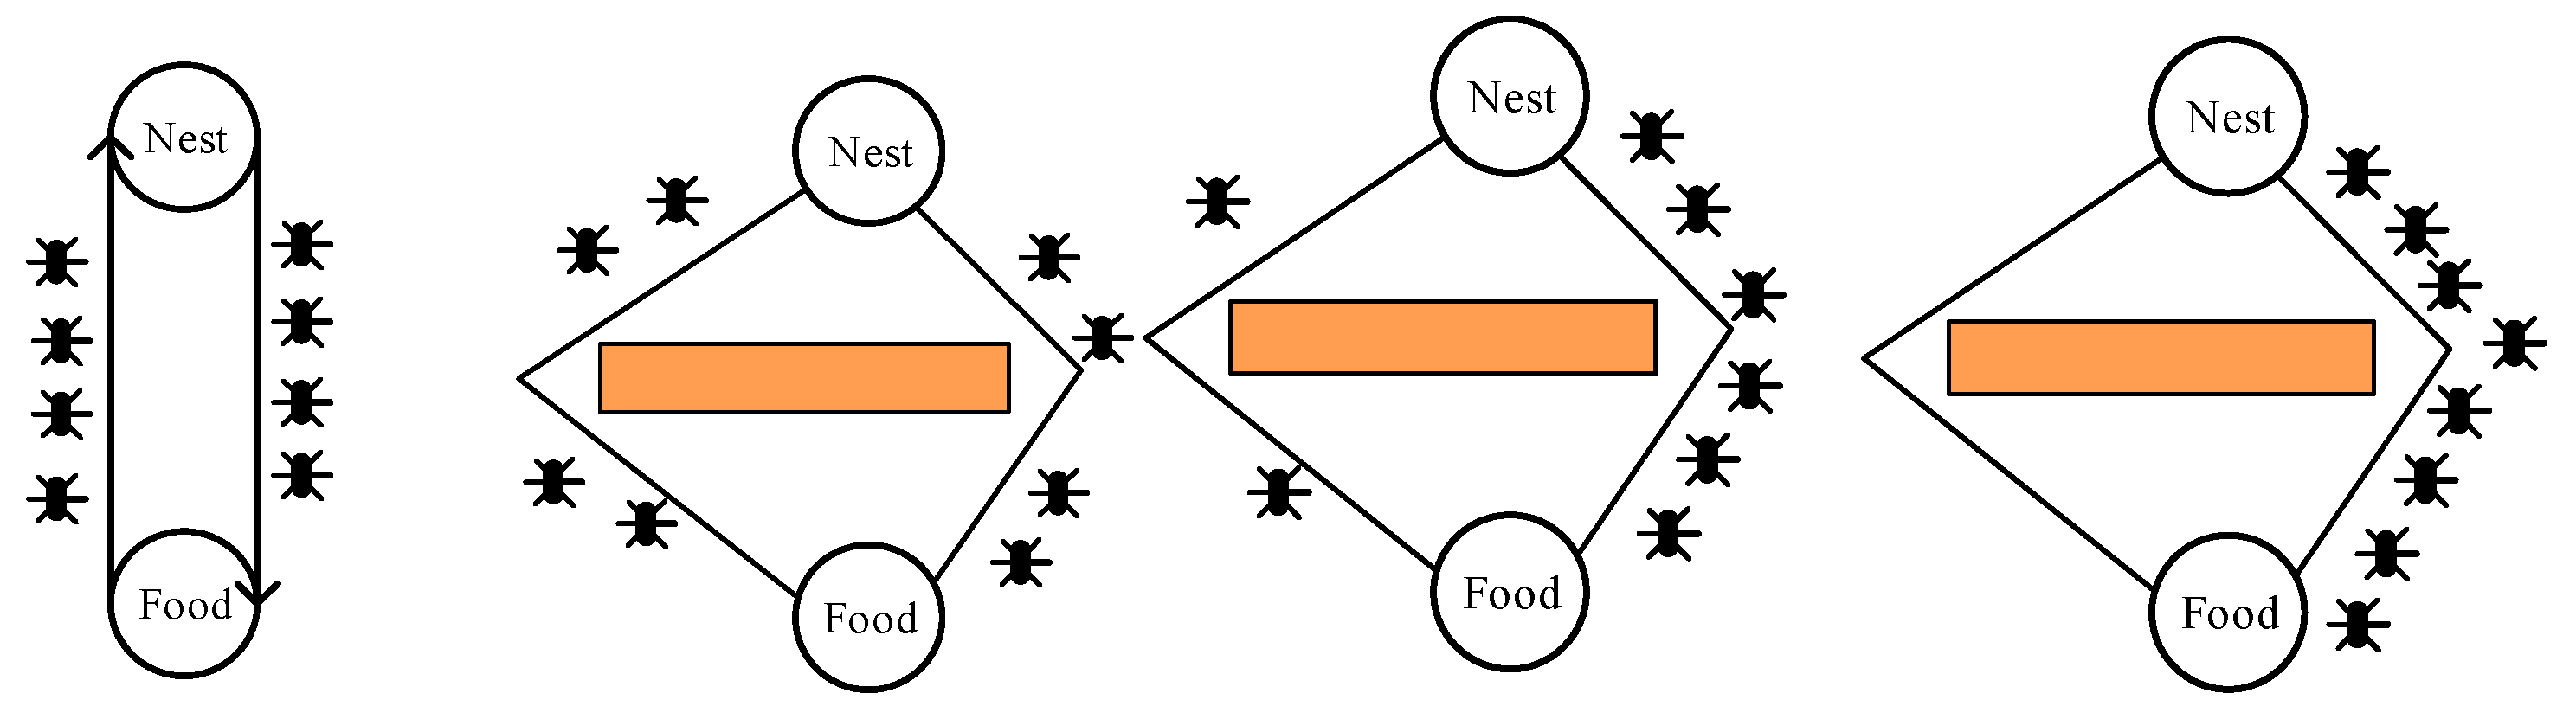
ACO is currently one of the most popular algorithms in swarm intelligence research [36]. This algorithm simulates the foraging behavior of ant colonies and is continuously studied and applied in new application fields. The idea of the ACO is shown in Figure 1.
Ants will leave pheromones after passing a path and can perceive the pheromones left by other ants. The passage of additional ants through a path leads to a high pheromone concentration during the foraging process; thus, other ants may possibly choose the path. The pheromone concentration on the optimal path increases, and the ant colony eventually finds the optimal foraging path.
Scholars have proposed a rank ant colony system (ACS) to solve the shortcomings of ACO in practical engineering problems. Each ant in the rank ACS is sorted in accordance with the length of its path, and the released pheromone value is determined by the respective levels. A rank ACS is a classic improved algorithm. The current study improves the rank ACS to solve the evacuation problem on cruise ships.
2.2. Mathematical Modeling
In the mathematical modeling, the influence of crowd density on time is considered in this study. Moreover, density is defined as follows:
where indicates T time node i and the number of people on j (unit: person), represents the distance between nodes i and j (unit: m), and represents the density between nodes i and j (unit: person/m).
The speed of the crowd will change during an emergency on a cruise ship because of panic and obstacles. Corresponding research indicates that the relationship between population speed and density is as follows [37]:
where is the speed of the crowd on the path from nodes i to j (unit: m/s); c is a constant, which controls the change in speed; represents the speed of person m between nodes i and j at time T, which will then change with the crowd density on the path (unit: m/s); and represents the time spent by the mth person from nodes i to j (unit: s).
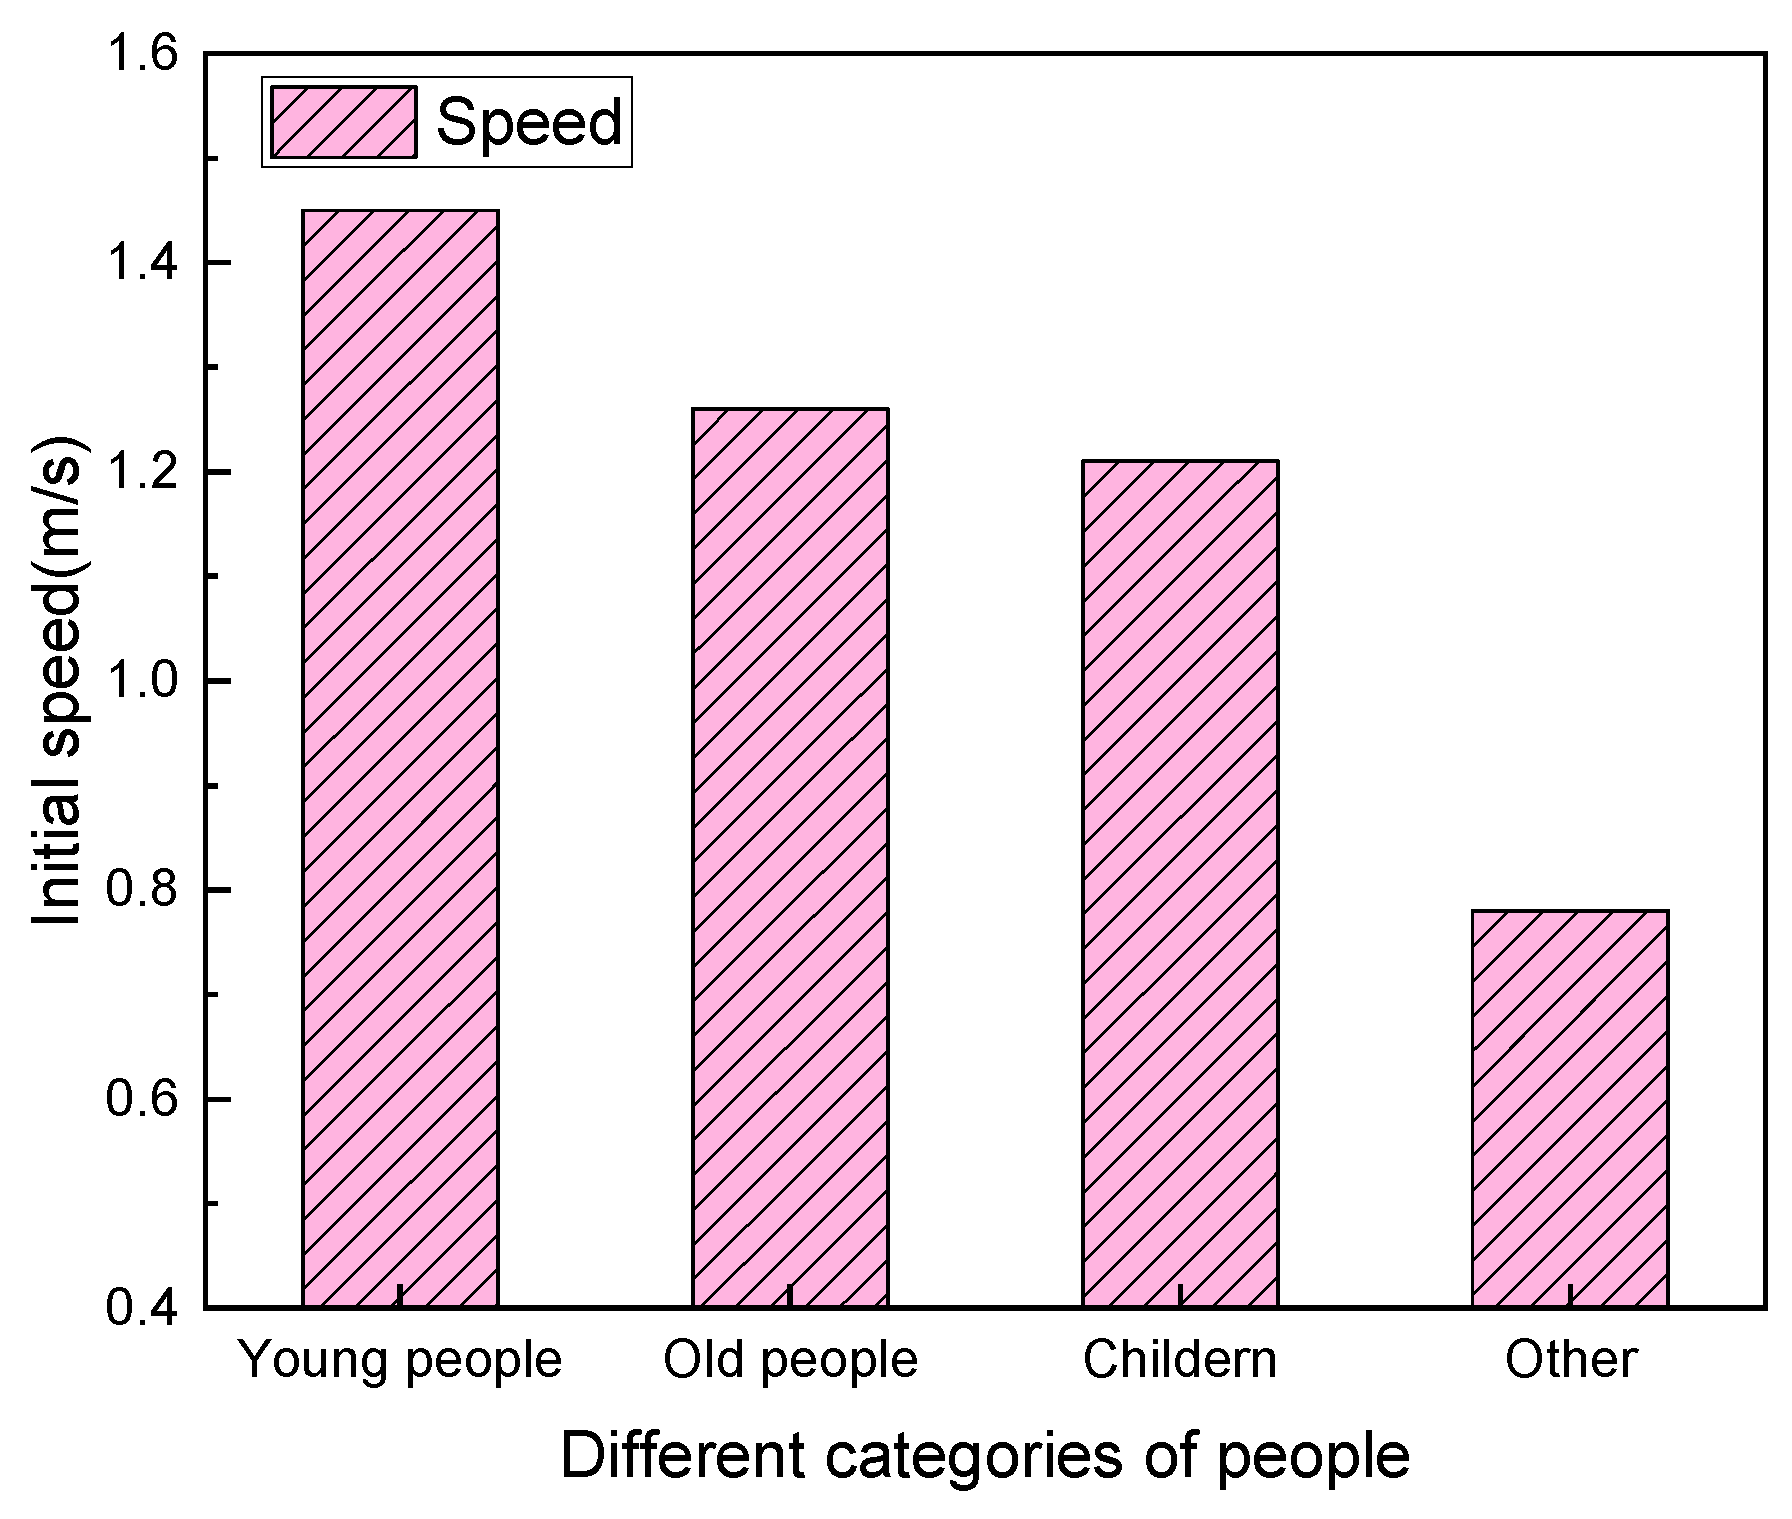
People with different age structures have varying initial average speeds, as shown in Figure 2.
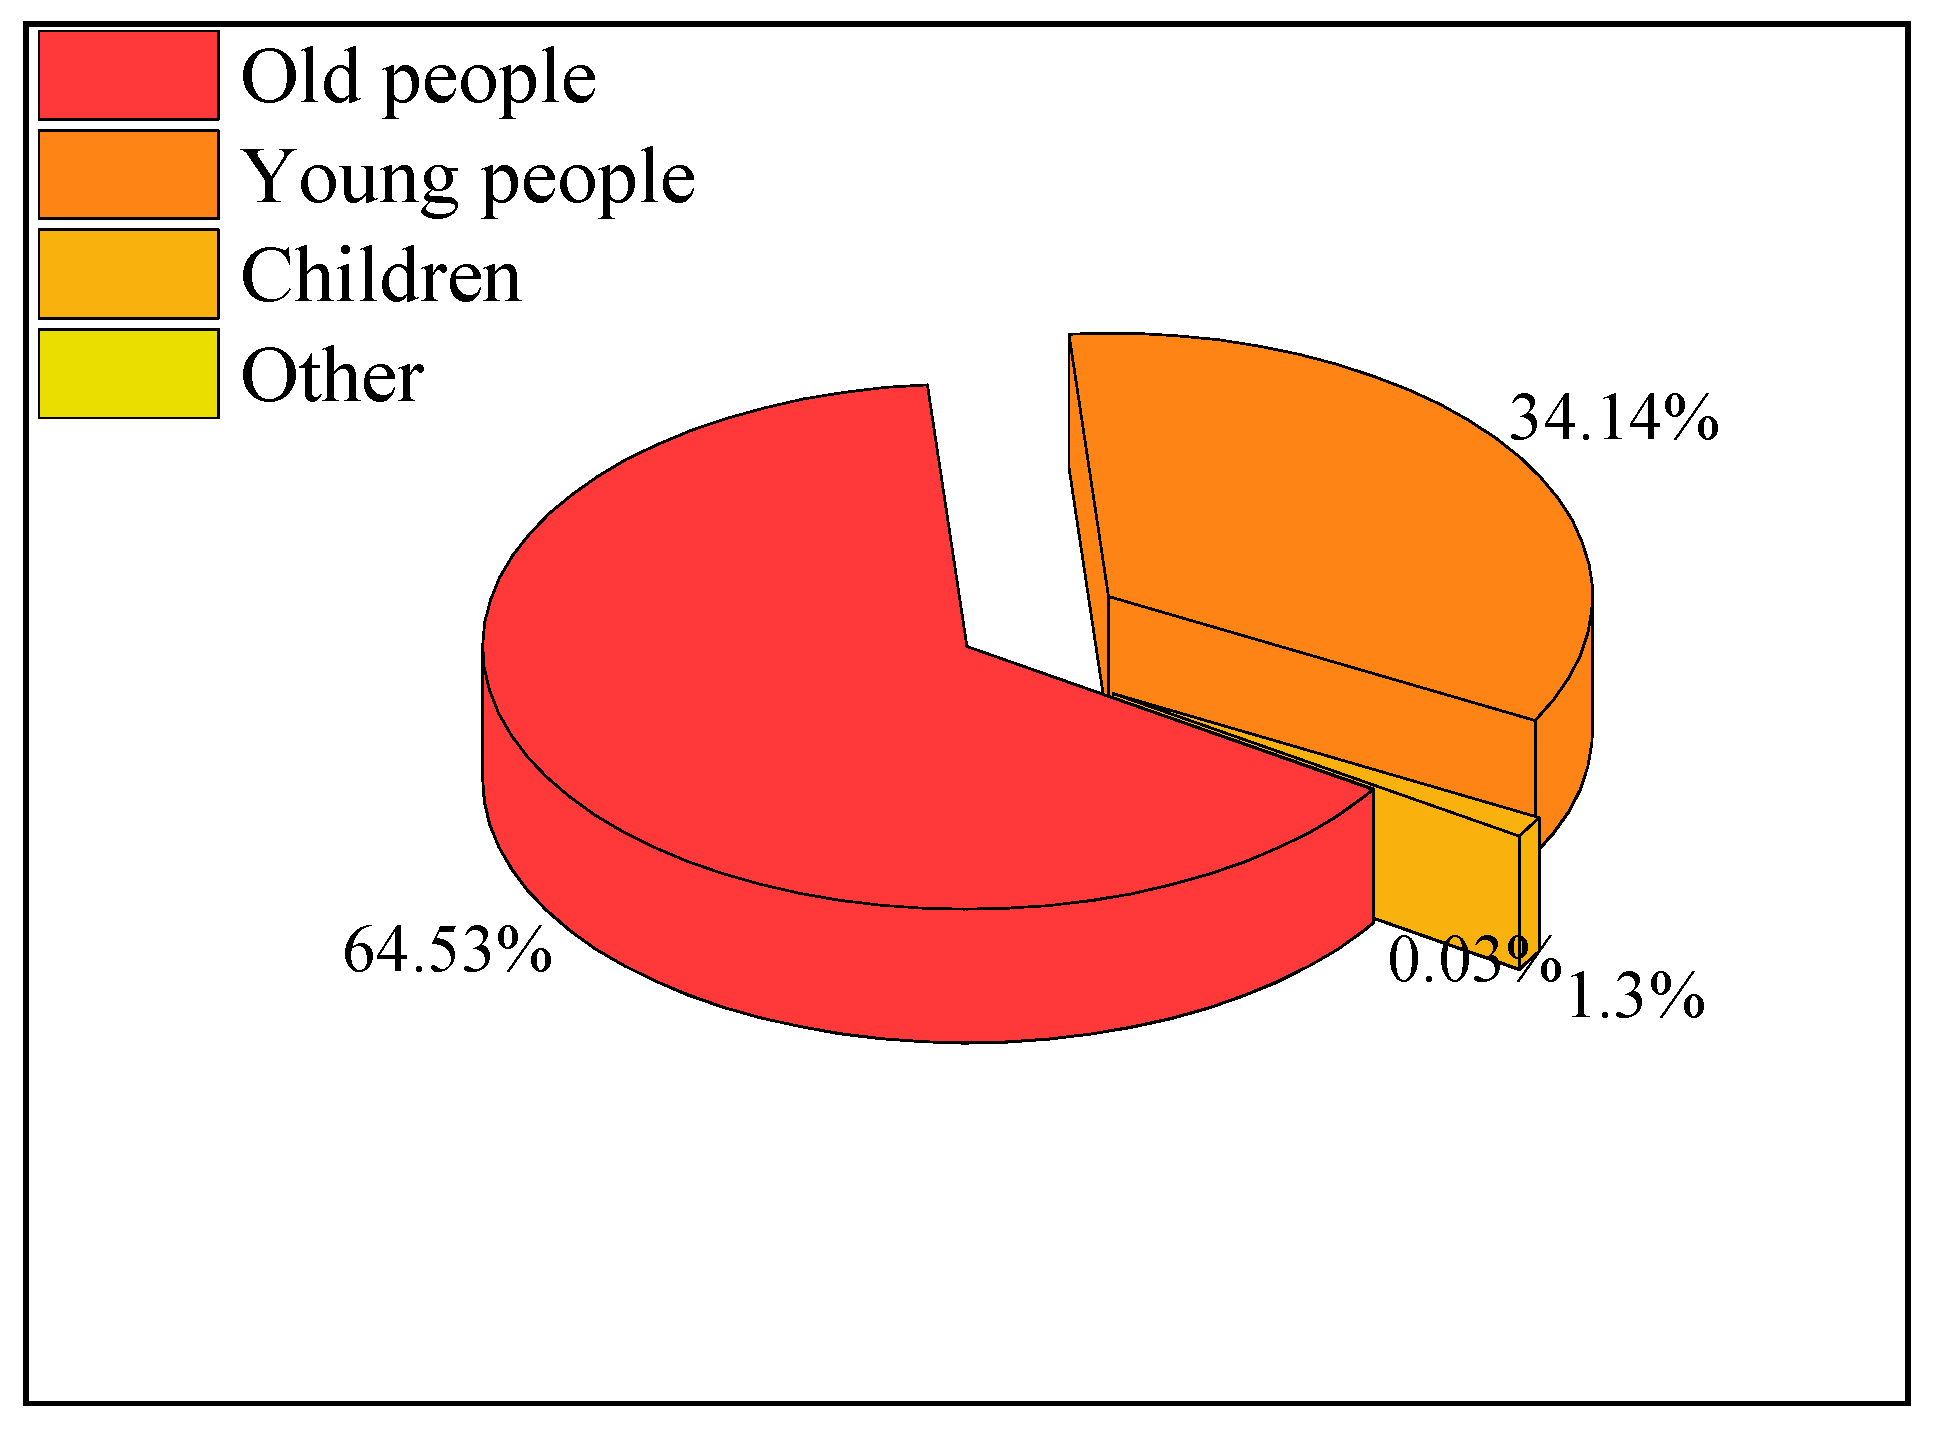
Studies have shown that the initial speed of young people, old people, children, and other ages is 1.46, 1.23, 1.21, and 0.78 m/s, respectively [38]. The crowd composition of the cruise ship is shown in Figure 3.
Figure 3 shows that the old, young, children, and others in a population account for 64.53%, 34.14%, 1.3%, and 0.03%, respectively.
Emergency evacuations on ships are based on the premise that all personnel reach the destination safely, and the aim is to minimize the time consumed by the last person on these ships to reach the destination. Therefore, the emergency evacuation time of ships is determined by the time when the last person arrives at the safe assembly area.
where M is the collection of all people on the ship, and m indicates one of these personnel; is the initial node for the emergency evacuation, and routem is the path of the person m (unit: m); and represents the time spent by the person m from nodes i to j (unit: s).
2.3. Proposed the IACS
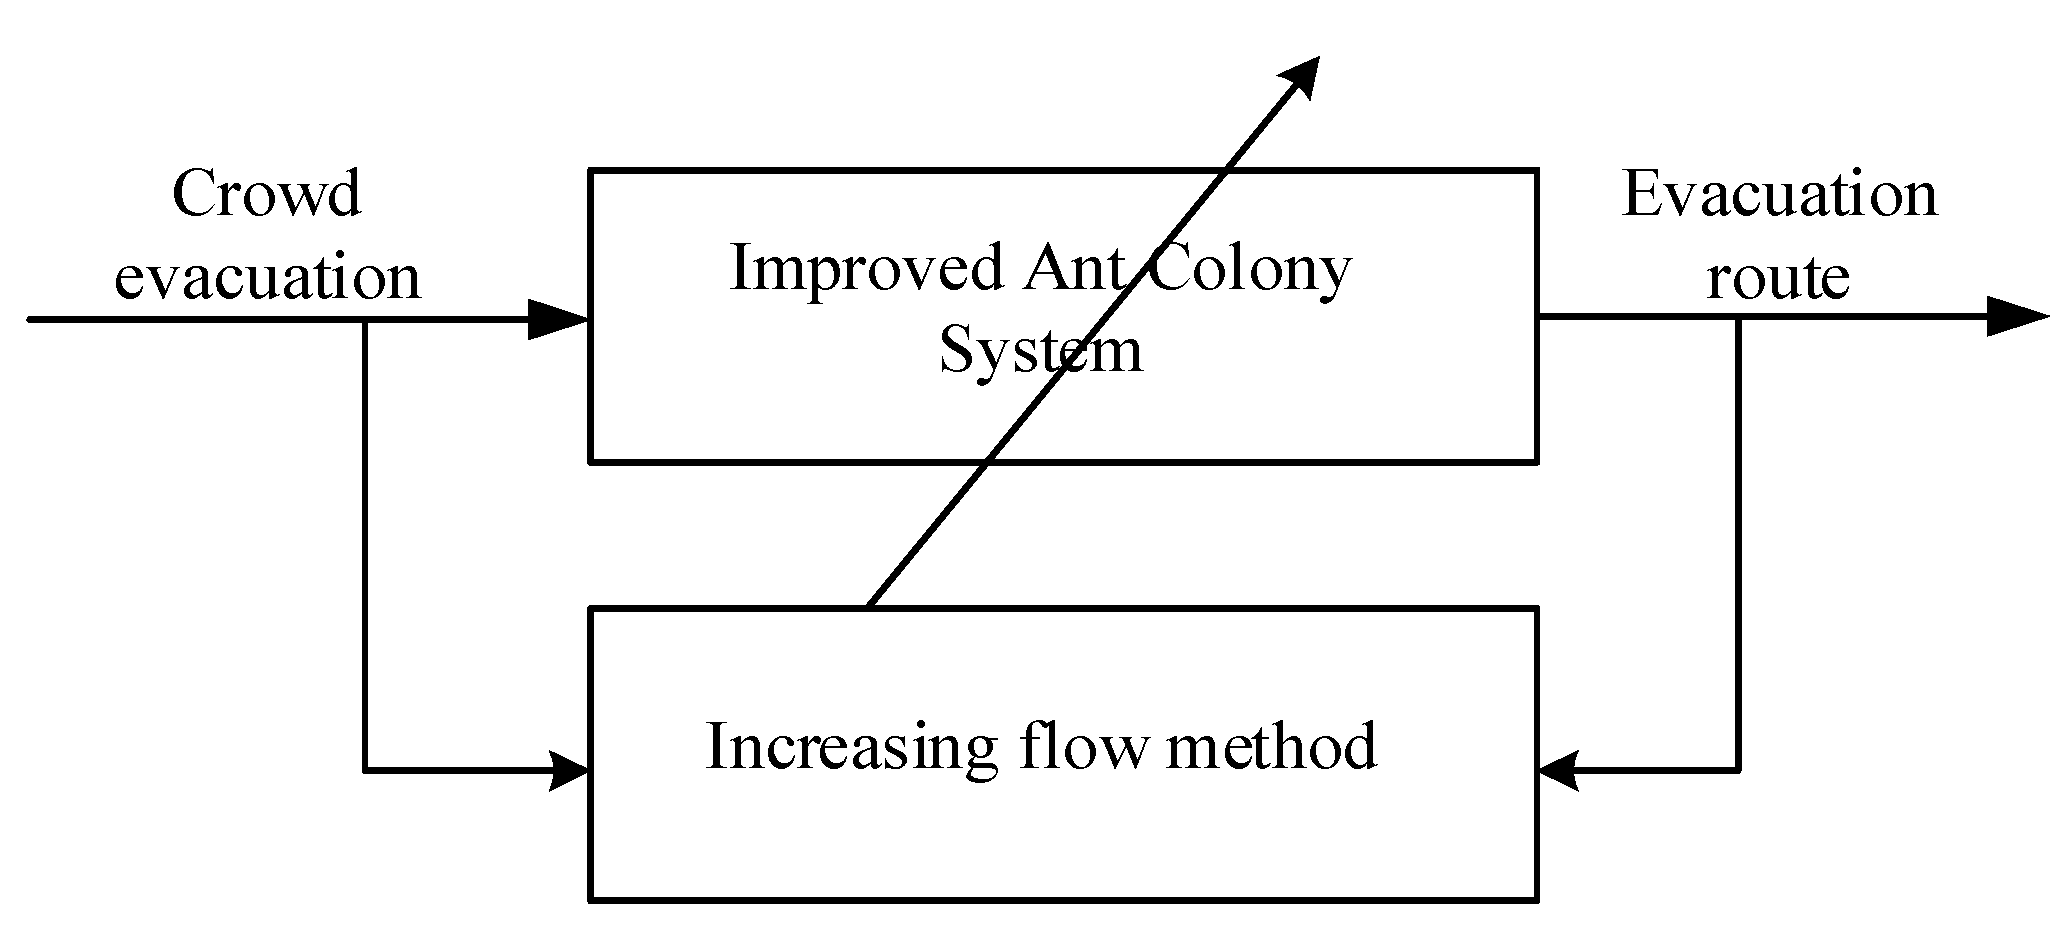
In emergency evacuations on cruise ships, which consider the occurrence of such emergency situations as fire and stranding, the crowd must reach the safe areas in the shortest time. This research uses IACS to simulate the behavior of a crowd from the current location to a safe area, and each ant is regarded as a group of people. The IACS, which is different from the ACS, can obtain a complete solution only when all ants reach the end. That is, this system must plan an optimal evacuation path for each group of the crowd. In solving practical problems, the IACS has often been found to simulate the evacuation of ship crowds gradually. The increasing flow method is introduced into the IACS to improve the efficiency of emergency evacuations.
The crowd is divided into many small groups in the aforementioned method. Each ant in the IACS represents a group of people, and the number of people in each group is called the cardinal number, which determines the granularity level of flow increase. The IACS can effectively solve the route planning problem for emergency evacuation of crowds on cruise ships and enhance operational efficiency using an appropriate level of granularity. The solution of crowd evacuation based on the IACS is proposed in this study, as shown in Figure 4.
The related ACS calculation formula is improved below to solve the multipath crowd emergency evacuation problem.
State transition rules: the ant selects the next node according to the pseudo-random ratio rule when it reaches a certain network node on the path.
where S is determined by Formula (6) [39,40]:
where represents the nodes that the ant colony i can visit, is the heuristic function and represents the expected degree of the ants from the current node i to node j, is the expected heuristic factor, is the pheromone concentration on , and represents the number of ants passing from nodes i to j at time T (unit: person).
The IACS adopts bolder behavior selection rules and only enhances the pheromone on the path with the global optimal solution. The update rules of the local pheromones are as follows:
where and represent the initial pheromone concentration on each path, U represents the set of departure points, D indicates muster stations, is the total length of the path between each departure point u and each end point v, and is the number of nodes along the path between a specific departure point u and specific end point v. The Floyd algorithm is used to calculate the values of and .
In recent years, some scholars have proposed a rank ACS and applied it to practical engineering problems [41,42]. An IACS is used in this paper to solve the queue phenomenon of crowds in the evacuation process effectively. Update rules of the global pheromones are as follows:
where is the total number of ants placing pheromones after each iteration, is the evaporation rate of the pheromones on the edge, is the time consumption corresponding to the kth generation of the optimal ants (unit: s), is the number of pheromones released by ant colony with the kth generation of the optimal solution, is the time consumption of the ant with the current best solution(unit: s), and is the amount of pheromone released by the ant.
The increasing flow method-based cardinal number is as follows:
- If the capacity is sufficiently large to meet the cardinal number, then the flow of will increase the cardinal number when a group of people move from nodes i to j.
- If the capacity is sufficiently small to meet the cardinal number, then part of the people will be allocated to other paths until the end of the evacuation with the maximum capacity of when a group of people move from nodes i to j.where represents the number of people passing by in unit time from nodes i to j.
The local pheromone of the IACS is still updated following Formulas (8) and (9). The global pheromone is updated as follows:
The parameters and have been previously defined, represents the average flow of the crowd on the path from nodes i to j of the kth generation, represents the historical optimal average flow on the path from nodes i to j of the kth generation, P represents the total number of people evacuated in the entire network, and is the total evacuation time (i.e., the time it takes for the last person to reach the safe area).
The specific process of the IACS is as follows:
Input: layout of the ship and personnel distribution location, such as the length and width of the space, maximum and minimum capacities of the path, location of the exit, and actual location of the crowd.
Output: path aggregation and time consumption for crowd evacuation.
- Initialize the parameters, number of ant colonies m, expected heuristic factor , maximum number of iterations , pheromone volatilization factor , random number , and number of ants placing pheromone after each iteration ;
- Start the iteration and initialize the position of the ants according to the position of the actual crowd;
- Calculate the next node j selected by the current crowd and the probability of selecting this node using Formulas (5) and (6);
- Increase the flow according to Formulas (13)–(15) and form a complete path set by minimizing the total evacuation time;
- Update the local pheromones in Formulas (8) and (9) ;
- Evaluate whether the number of iterations reaches the maximum number . If yes, then end the iterations and output the optimal path set; otherwise, update the global pheromones according to Formulas (16) and (17) and return to Step 2;
- End the algorithm and output the results.
3. Definition of Problems
3.1. Establishment of a Ship Node Network
A three-tier cruise ship is taken as the object to establish a node network. The cruise ship has a three-layer structure. The first and second layers are 138 × 24 × 3 m, and the third layer is 42 × 15 × 2.8 m. The cruise ship has areas with different functions such as seating, bar, restaurant, shopping, and cabin areas, and a certain number of people are distributed in each area.
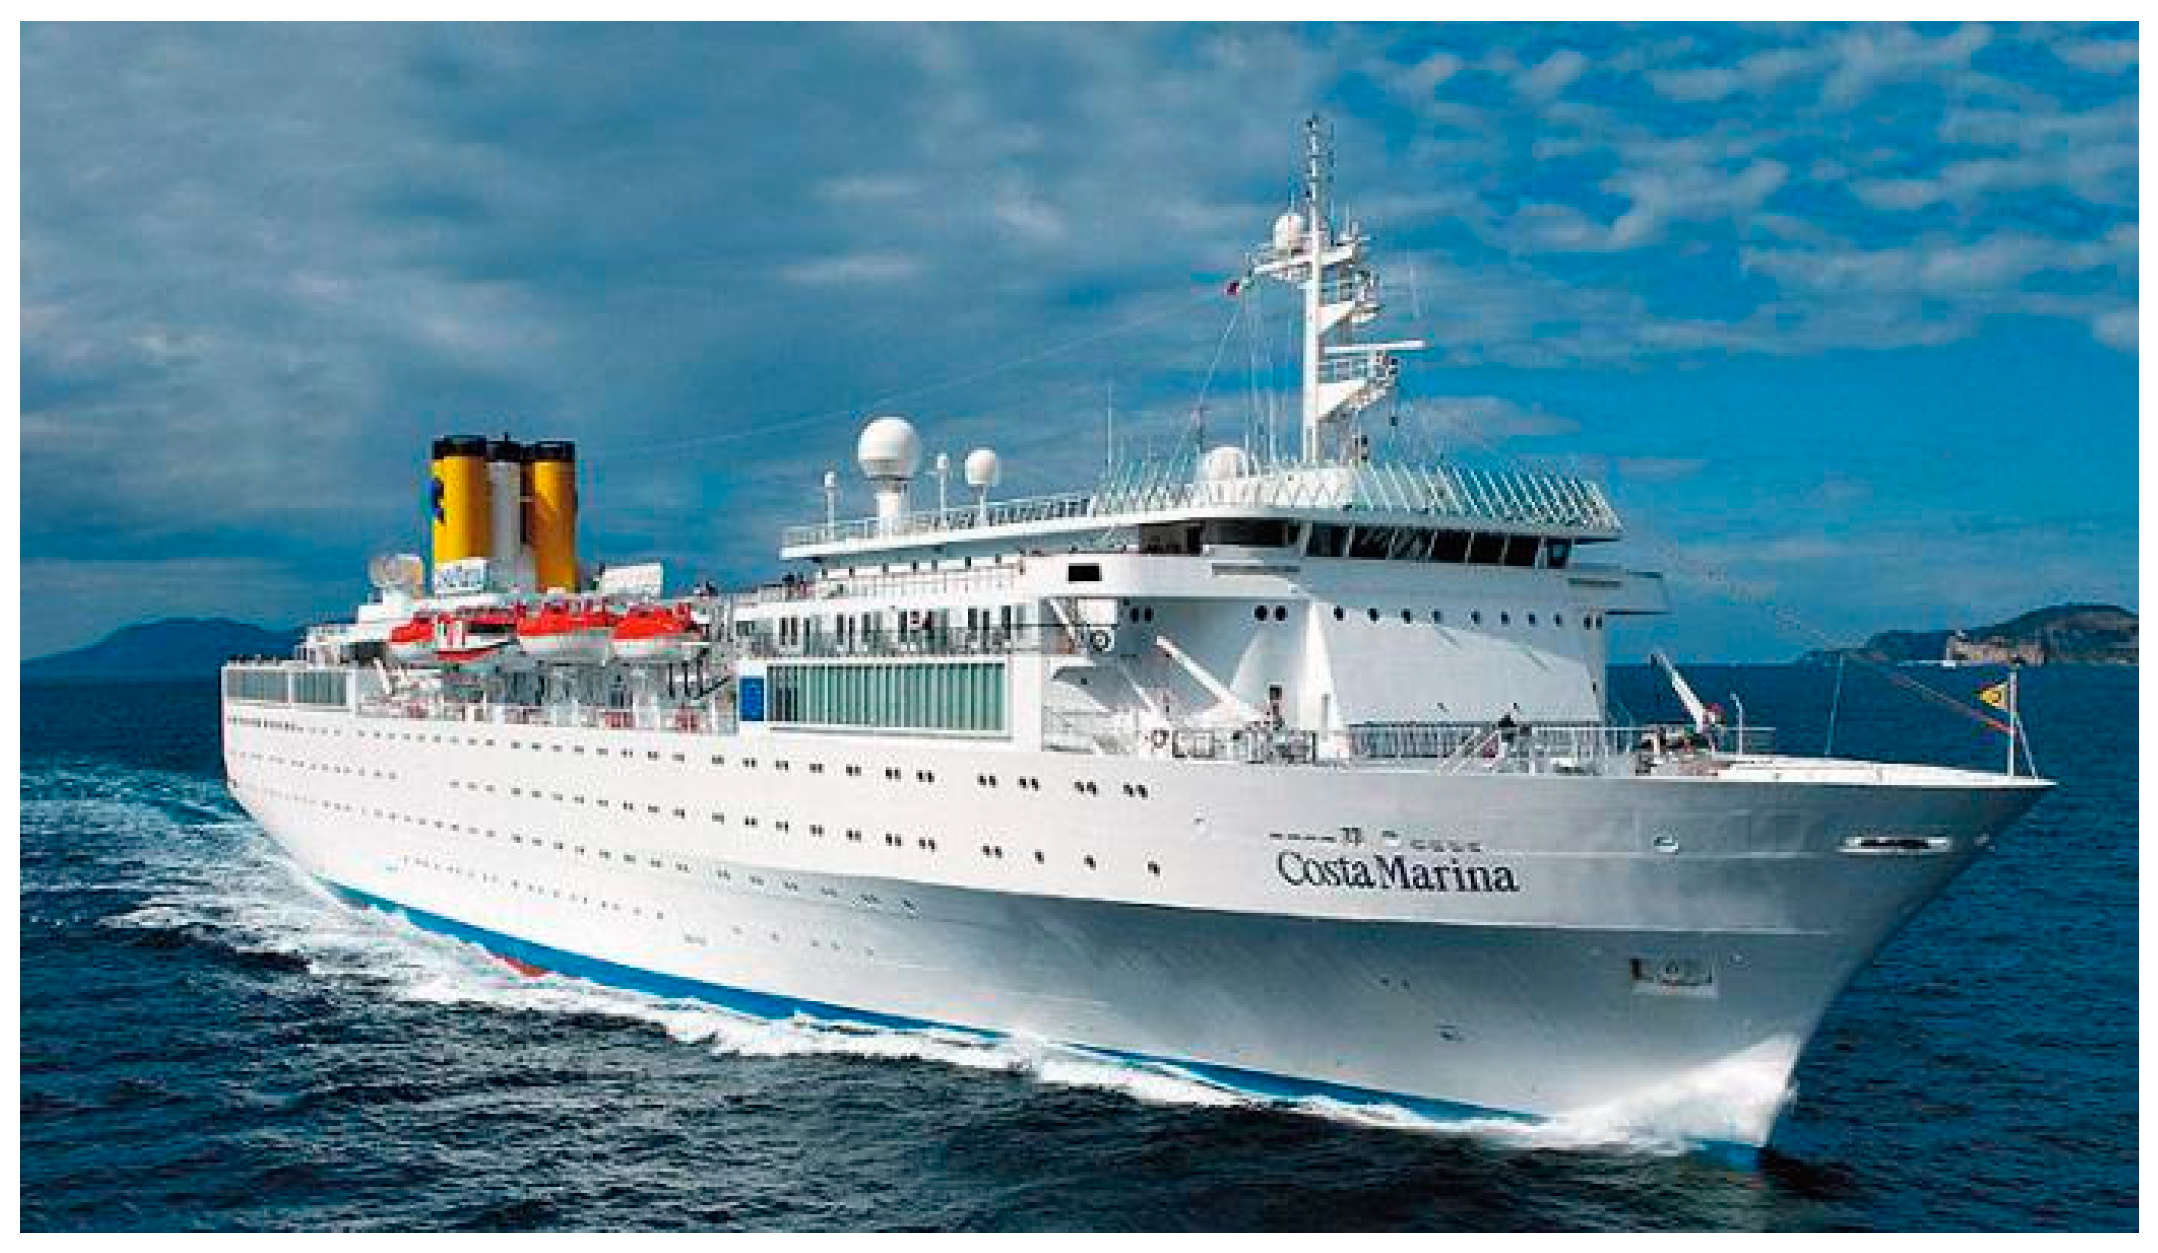
Figure 5 shows the Costa cruise ship. A ship network graph G(V, H) is established, where V is a collection of nodes, H represents the path between connecting nodes. u is the specific departure node of the crowd, in which u∈U, U is the set of departure nodes, U∈V. v is the specific muster station of the crowd, v∈D, D is the muster stations. The constraint conditions of the capacity limit of each edge are considered in node modeling, and the relevant parameters can be obtained from the design manual. The principles for establishing the network nodes of cruise ships are as follows:
- The departure points are set in person activity areas, such as guest rooms, staff areas, and cockpit and so on, and transfer nodes are set at turns or corridor intersections;
- Considering the actual layout of the cruise ship, muster station D contains many nodes.
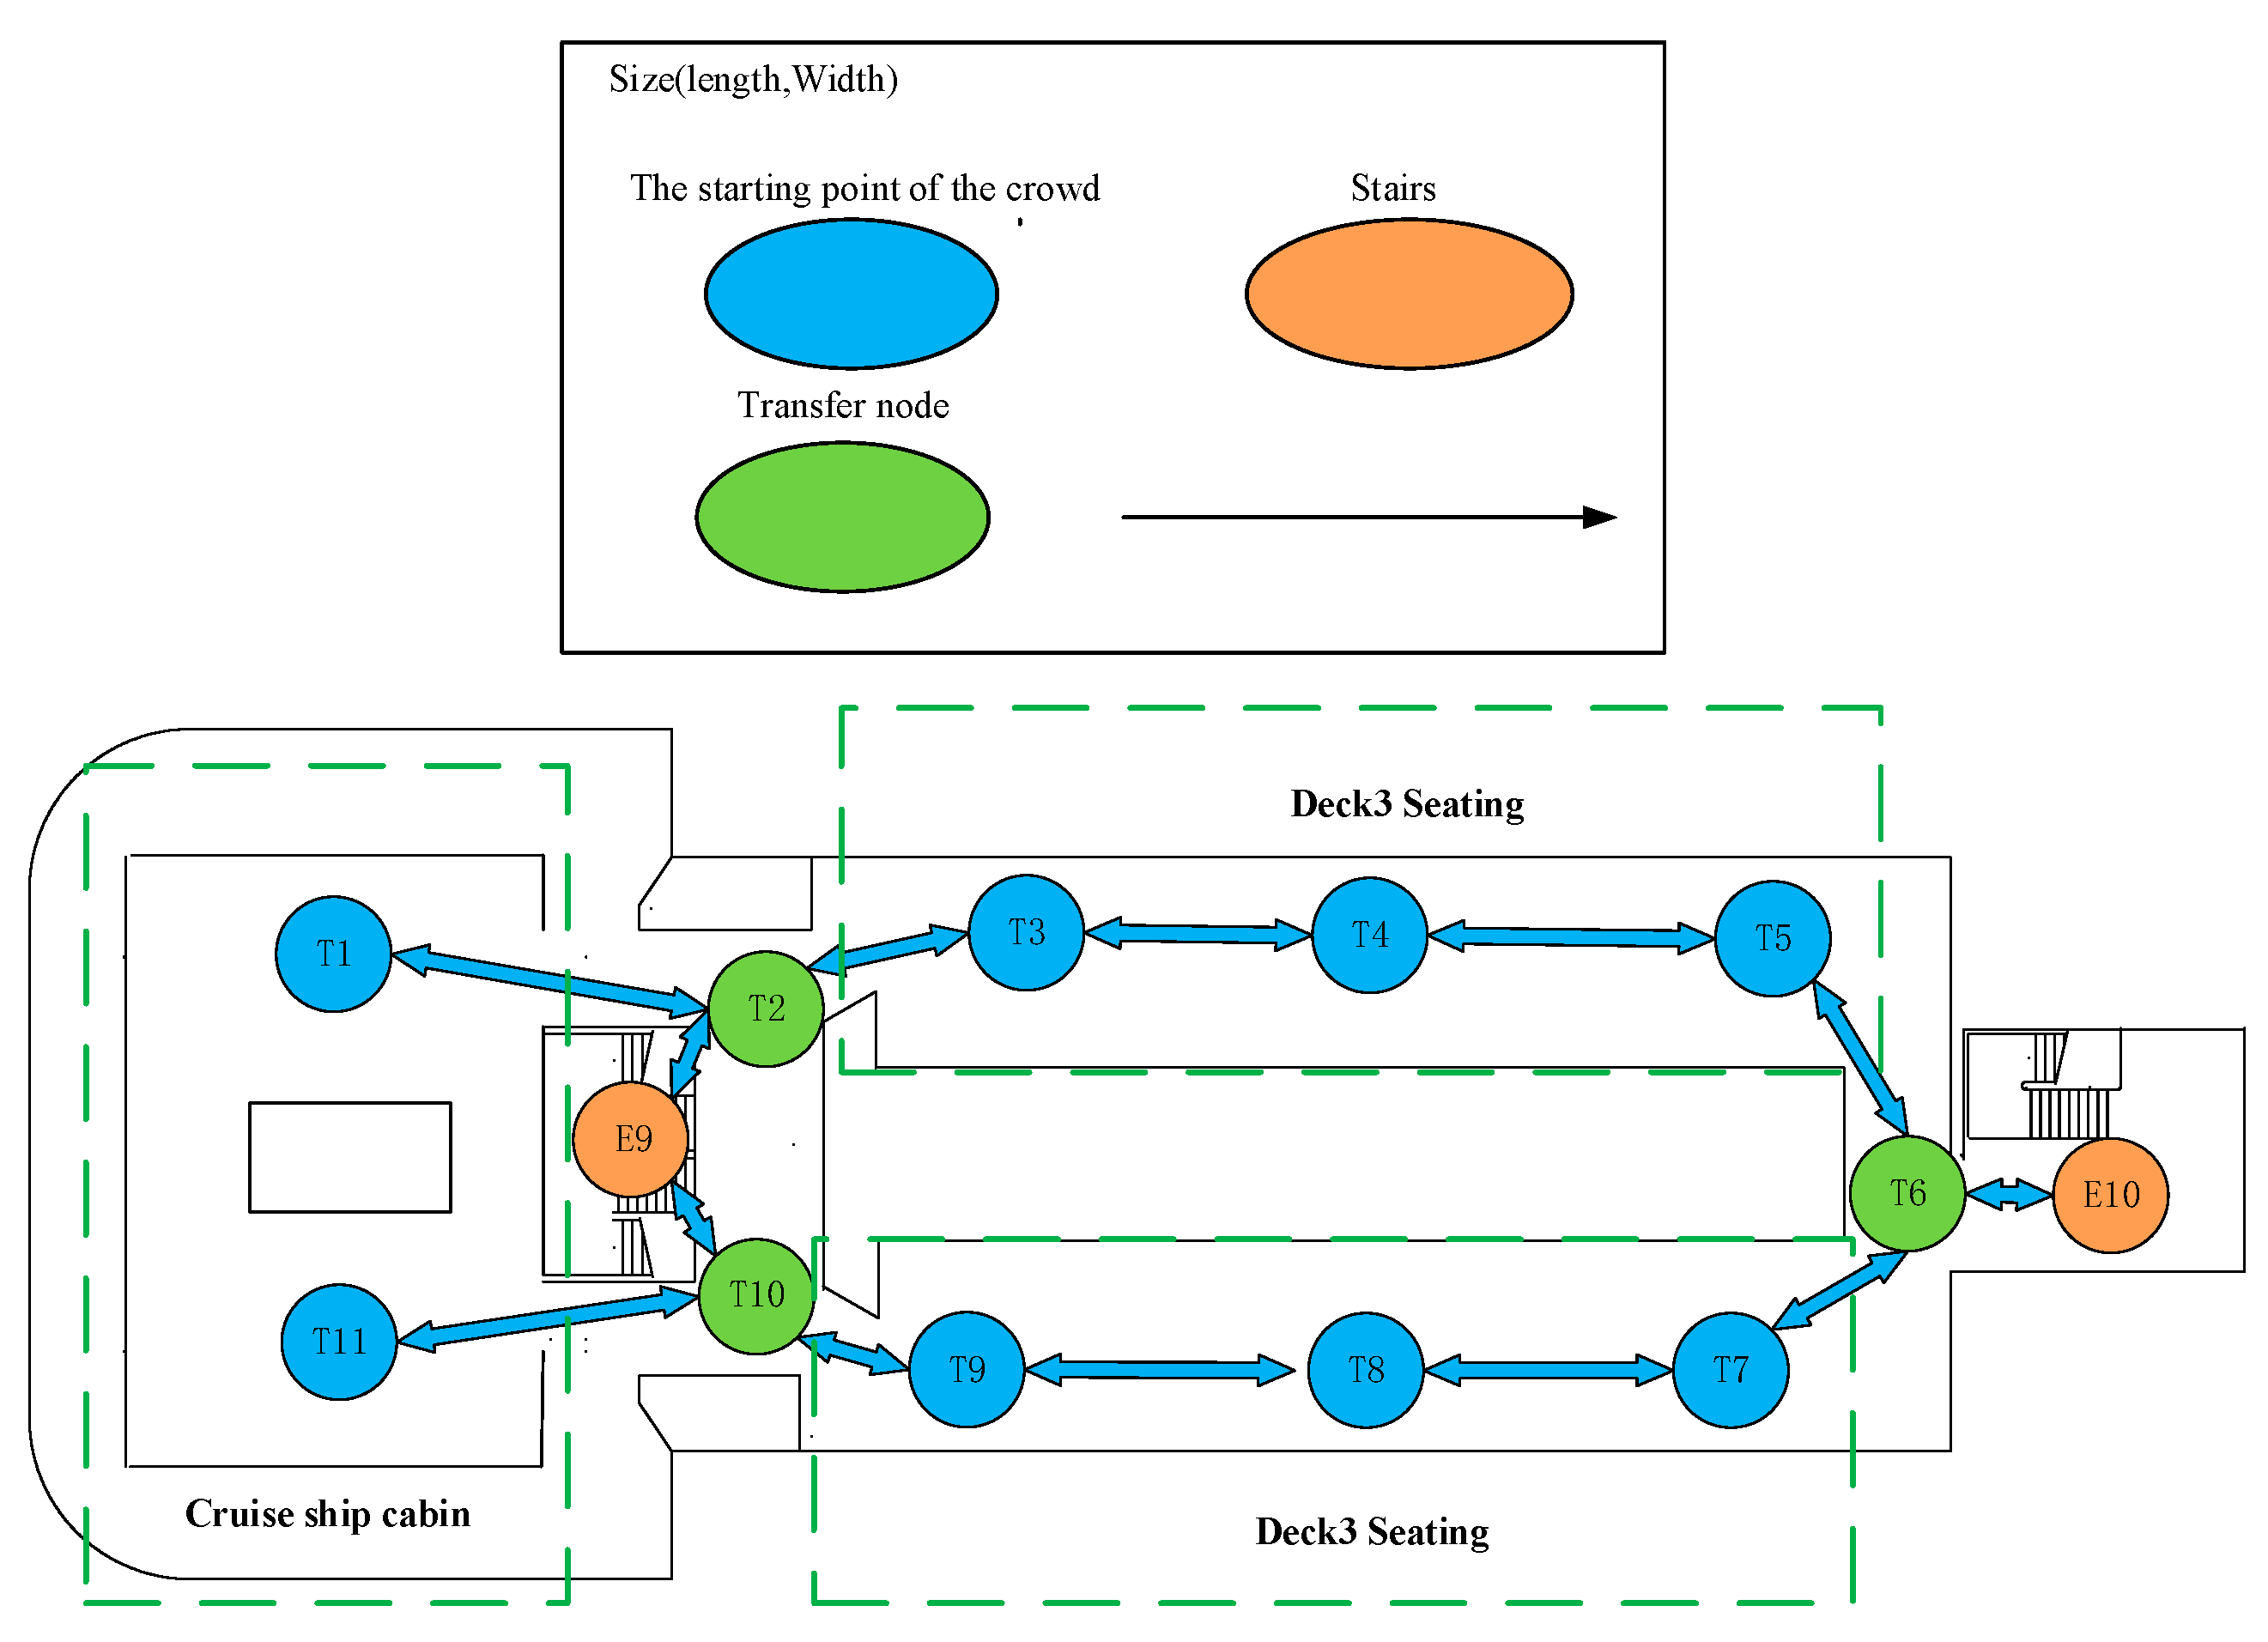
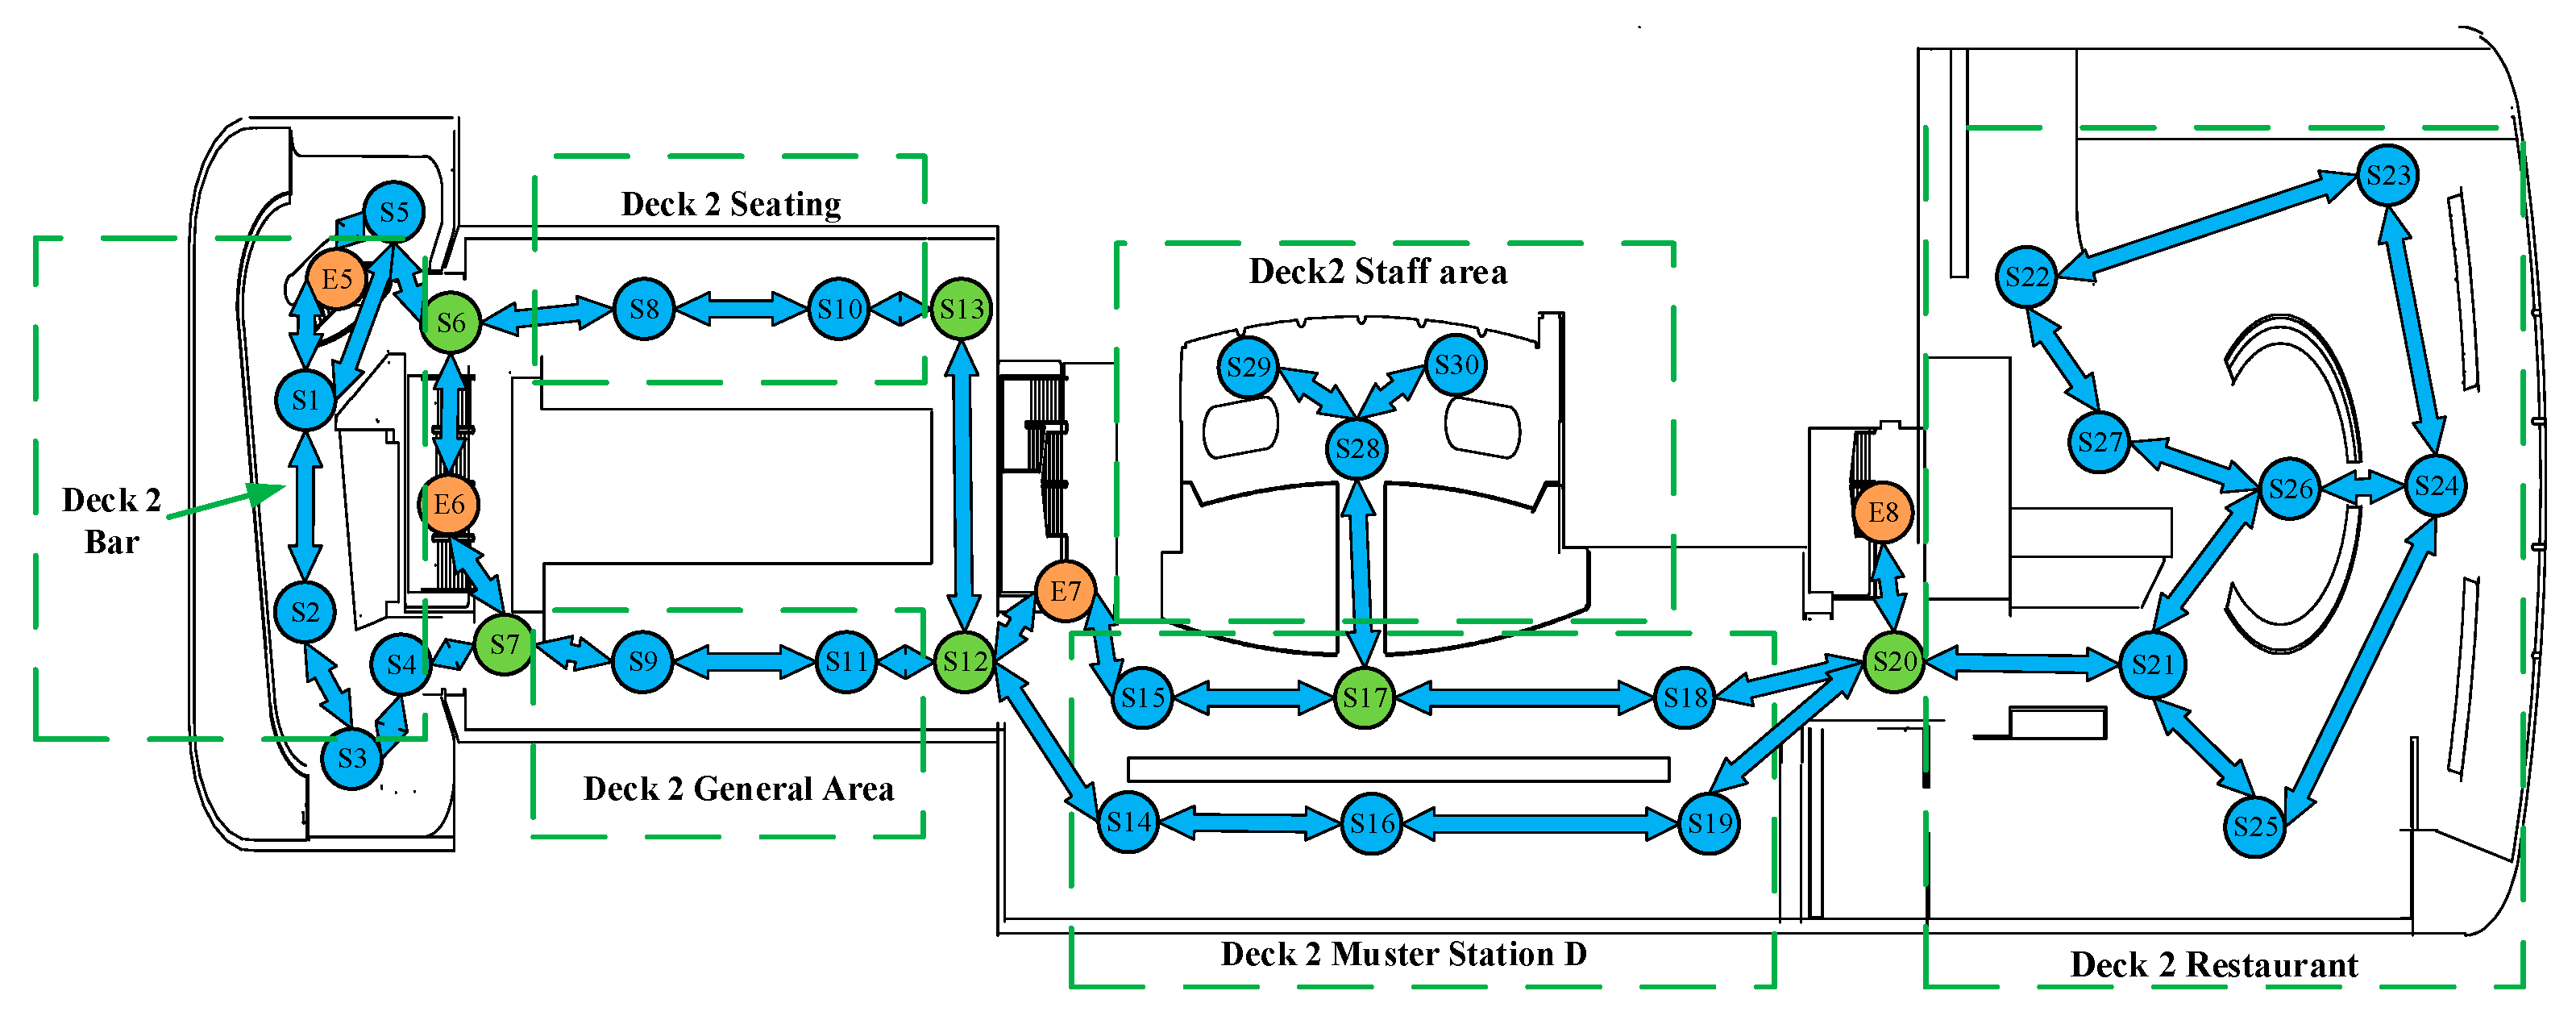
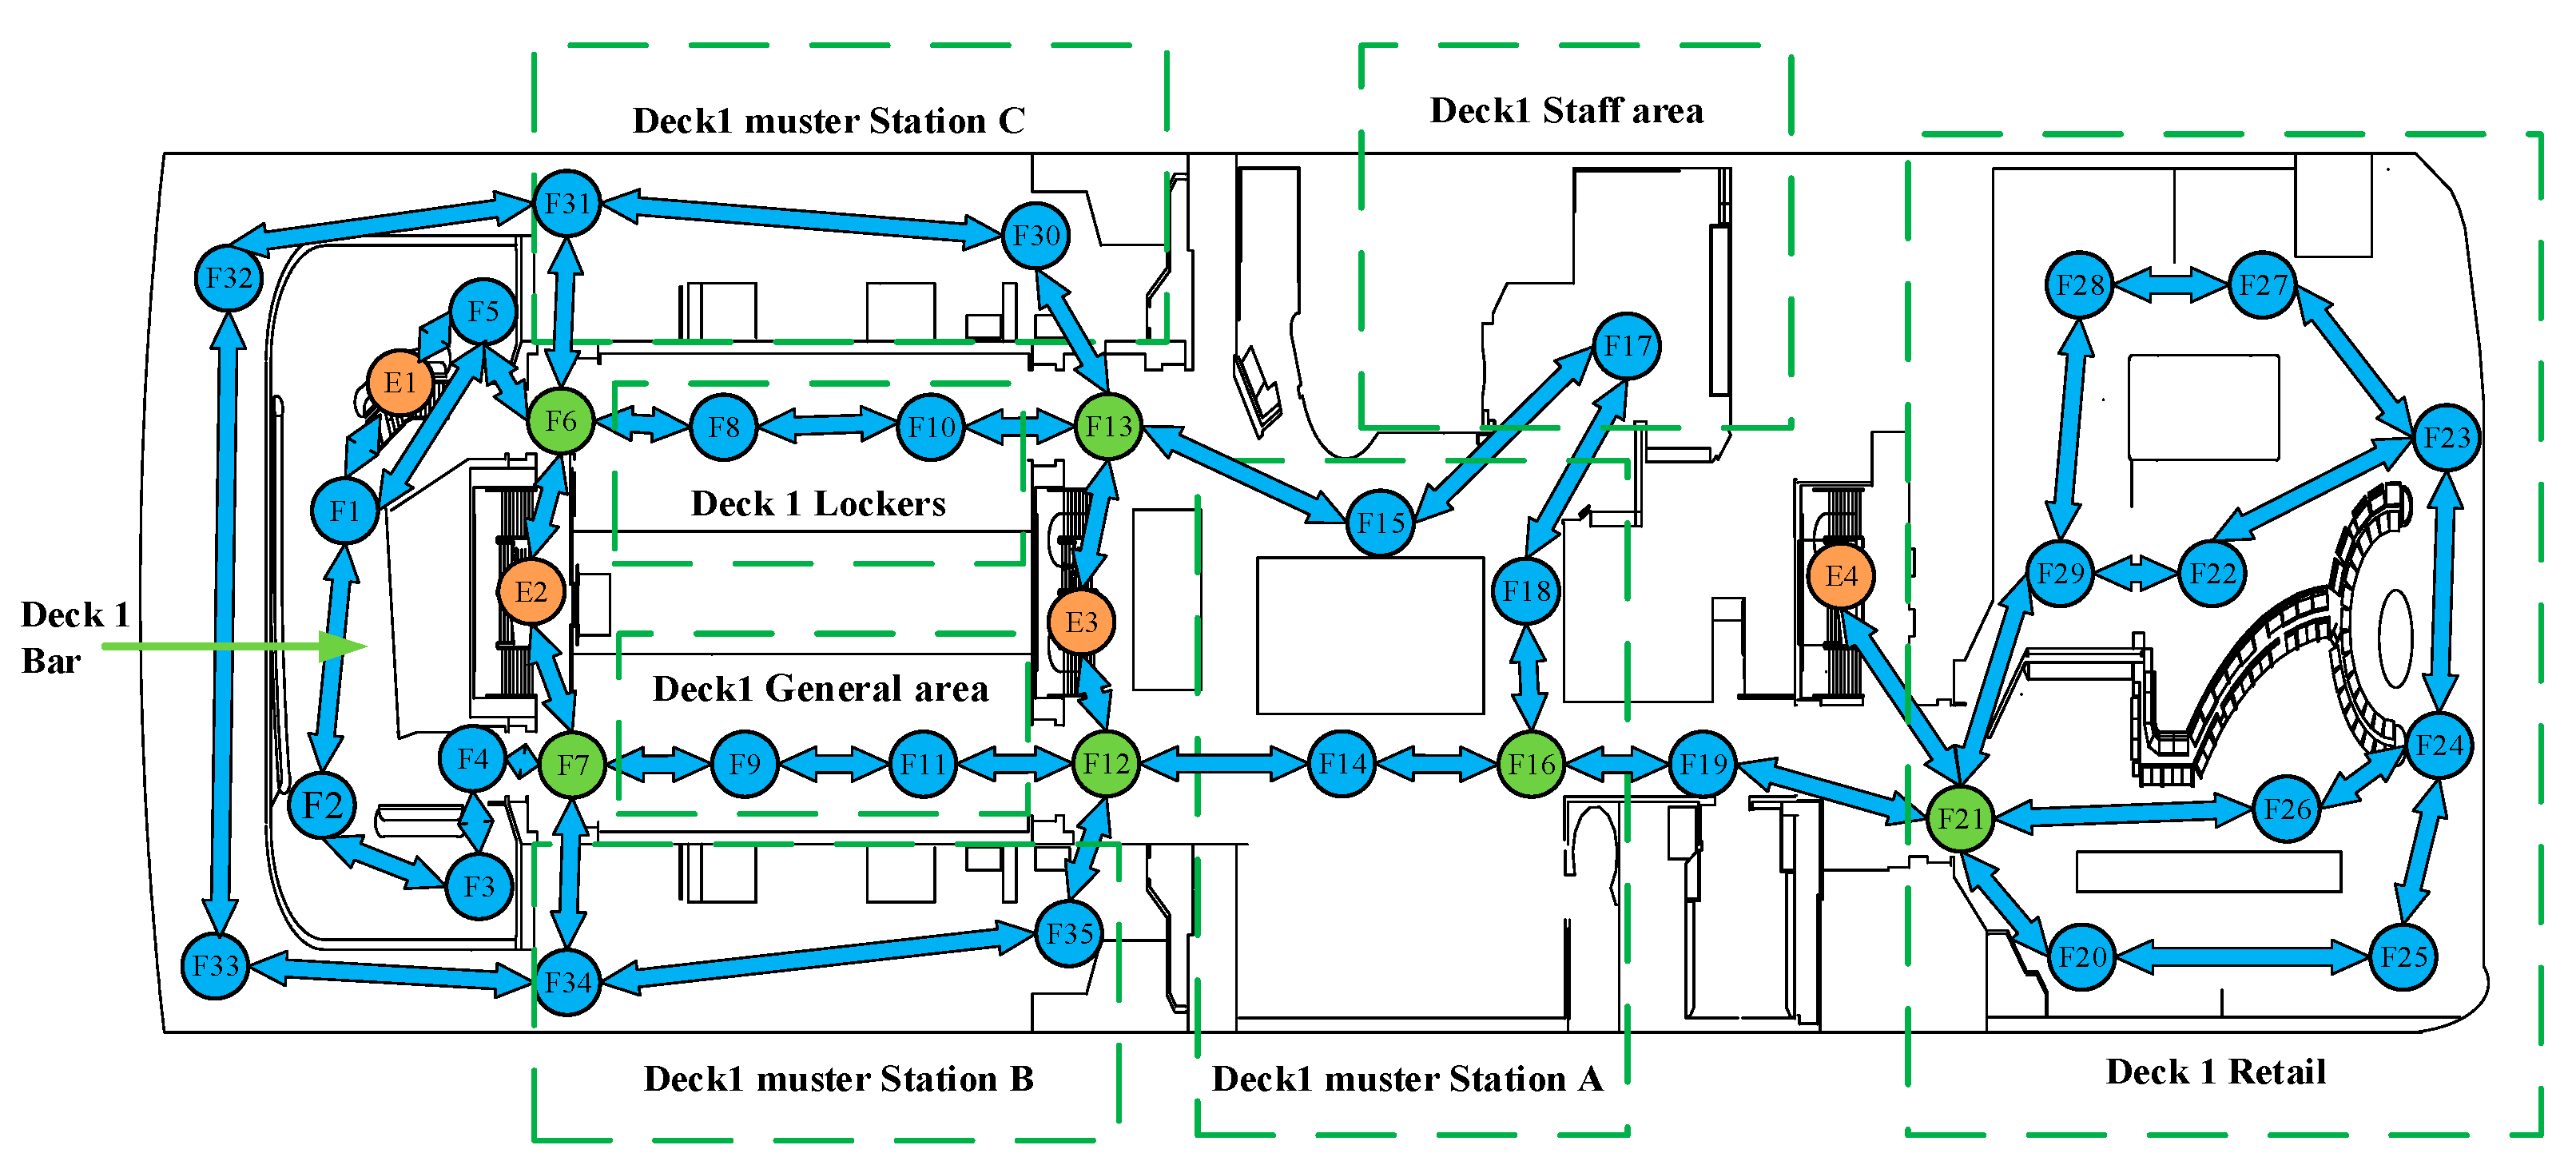
Figure 6, Figure 7 and Figure 8 show a three-layer ship network node diagram: (F1, F2, …F35) represent the nodes on the first floor of the cruise ship, (S1, S2, …S28) indicate the nodes on the second floor, T represents the nodes on the third floor, and (E1, E2, E3, E4, E5, E6, E7, E8, E9, E10) represent the stairs. The first floor has 35 nodes and 4 stair nodes, the second floor has 30 nodes and 4 stair nodes, and the third floor has 11 nodes and 2 stair nodes. Each pathway from one node to another node is thus represented.
The maximum capacity of each channel on cruise ships depends on the width of the door or the length and width of the channel. Relevant parameters can be found in relevant papers.
Figure 6 illustrates an example of a node network diagram. The blue nodes (T1, T3, T4, T5, T7, T8, T9, T11) represent the departure nodes of the crowd, indicating the location of the crowd distribution during the normal course of the ship. The green nodes (T2, T6, T10) represent the transition nodes, which are typically set at the intersection of the turn and path. The orange nodes (E1, E2) represent the position of the stairs. The remaining blue nodes represent the departure nodes of the crowd.
As shown in Figure 7, the green nodes (S6, S7, S12, S13, S17, S20) represent the transition nodes, which are typically set at the intersection of the turn and path. The orange nodes (E5, E6, E7, E8) represent the position of the stairs. The blue nodes (S14, S15, S16, S18, S19) represent the muster stations, the remaining blue nodes represent departure nodes of the crowd.
As shown in Figure 8, the green nodes (F6, F7, F12, F13, F16, F21) also represent the transition nodes, which are typically set at the intersection of the turn and path. The orange nodes (E1, E2, E3, E4) represent the position of the stairs. The blue nodes (F14, F15, F18, F30, F31, F34, F35) represent the muster stations, the remaining blue nodes represent departure nodes of the crowd.
The decks are connected to each other by stairs, allowing visitors to reach the muster stations in the shortest time. Figure 7 and Figure 8 show four muster stations: muster station D on the second floor and muster stations A, B, and C on the first floor. The stair dimensions are as follows (Table 1).
3.2. Edge Maximum Capacity
3.3. Problem Description
Cruise ships have different functional areas, including the bar, restaurant, and staff areas and so on. The structure of these ships is transformed into an evacuation network. In the emergency evacuation of cruise ships, which considers the occurrence of such emergency situations as fire and stranding, people must reach the muster stations in the shortest time.
During the establishment of the actual model, the following assumptions below were introduced in accordance with the requirements of the “Guidelines for the Evacuation Analysis of New Passenger Ships and Existing Passenger Ships” (MSC.1/Circ.1533).
- Everyone can reach the safe area;
- Do not consider family group behavior;
- Ship motion, heeling, and trimming are not considered;
- Does not consider the effects of smoke, heat and toxic fire products on passenger/crew performance.
An effective evacuation organization can substantially improve the efficiency of emergency evacuation [44,45]. Russo et al. [46] proposed that training activities improve evacuation planning. Guan et al. [47] studied the self-organization phenomenon in crowd evacuation based on the cellular automata theory. These studies provide effective guidance for emergency evacuation preparations. The crowd will wear bracelets when boarding the ship. Before the evacuation, the evacuation commander and related organizers can use the information obtained by the bracelets to grasp the distribution characteristics of the crowd. The evacuation process indicates that the evacuation commander can guide the best evacuation route for the crowd through broadcast and dynamic safety instructions. The IACS can provide path planning for the emergency evacuation of people.
4. Results with Discussion
The experiment data are obtained from the “SAFEGUARD” project [48,49]. A total of 1200 people participated in the emergency evacuation. The method of increasing flow is used in the IACS. Each ant represents three people according to the above parameters. The software used in the experiment is Matlab2019b and Anylogic. The IACS was run on a computer with Intel Core i7-10750H and RAM 8 GB. The parameters used in the experiment are as follows (Table 3).
This study analyzes the effects of the expected heuristic factor , the number of ants releasing pheromone after each iteration , and the parameters of the allocation flow method on the evacuation time. The experimental results are shown in Figure 9, Figure 10 and Figure 11. The relationship between the number of iterations and evacuation time is shown in Figure 12.
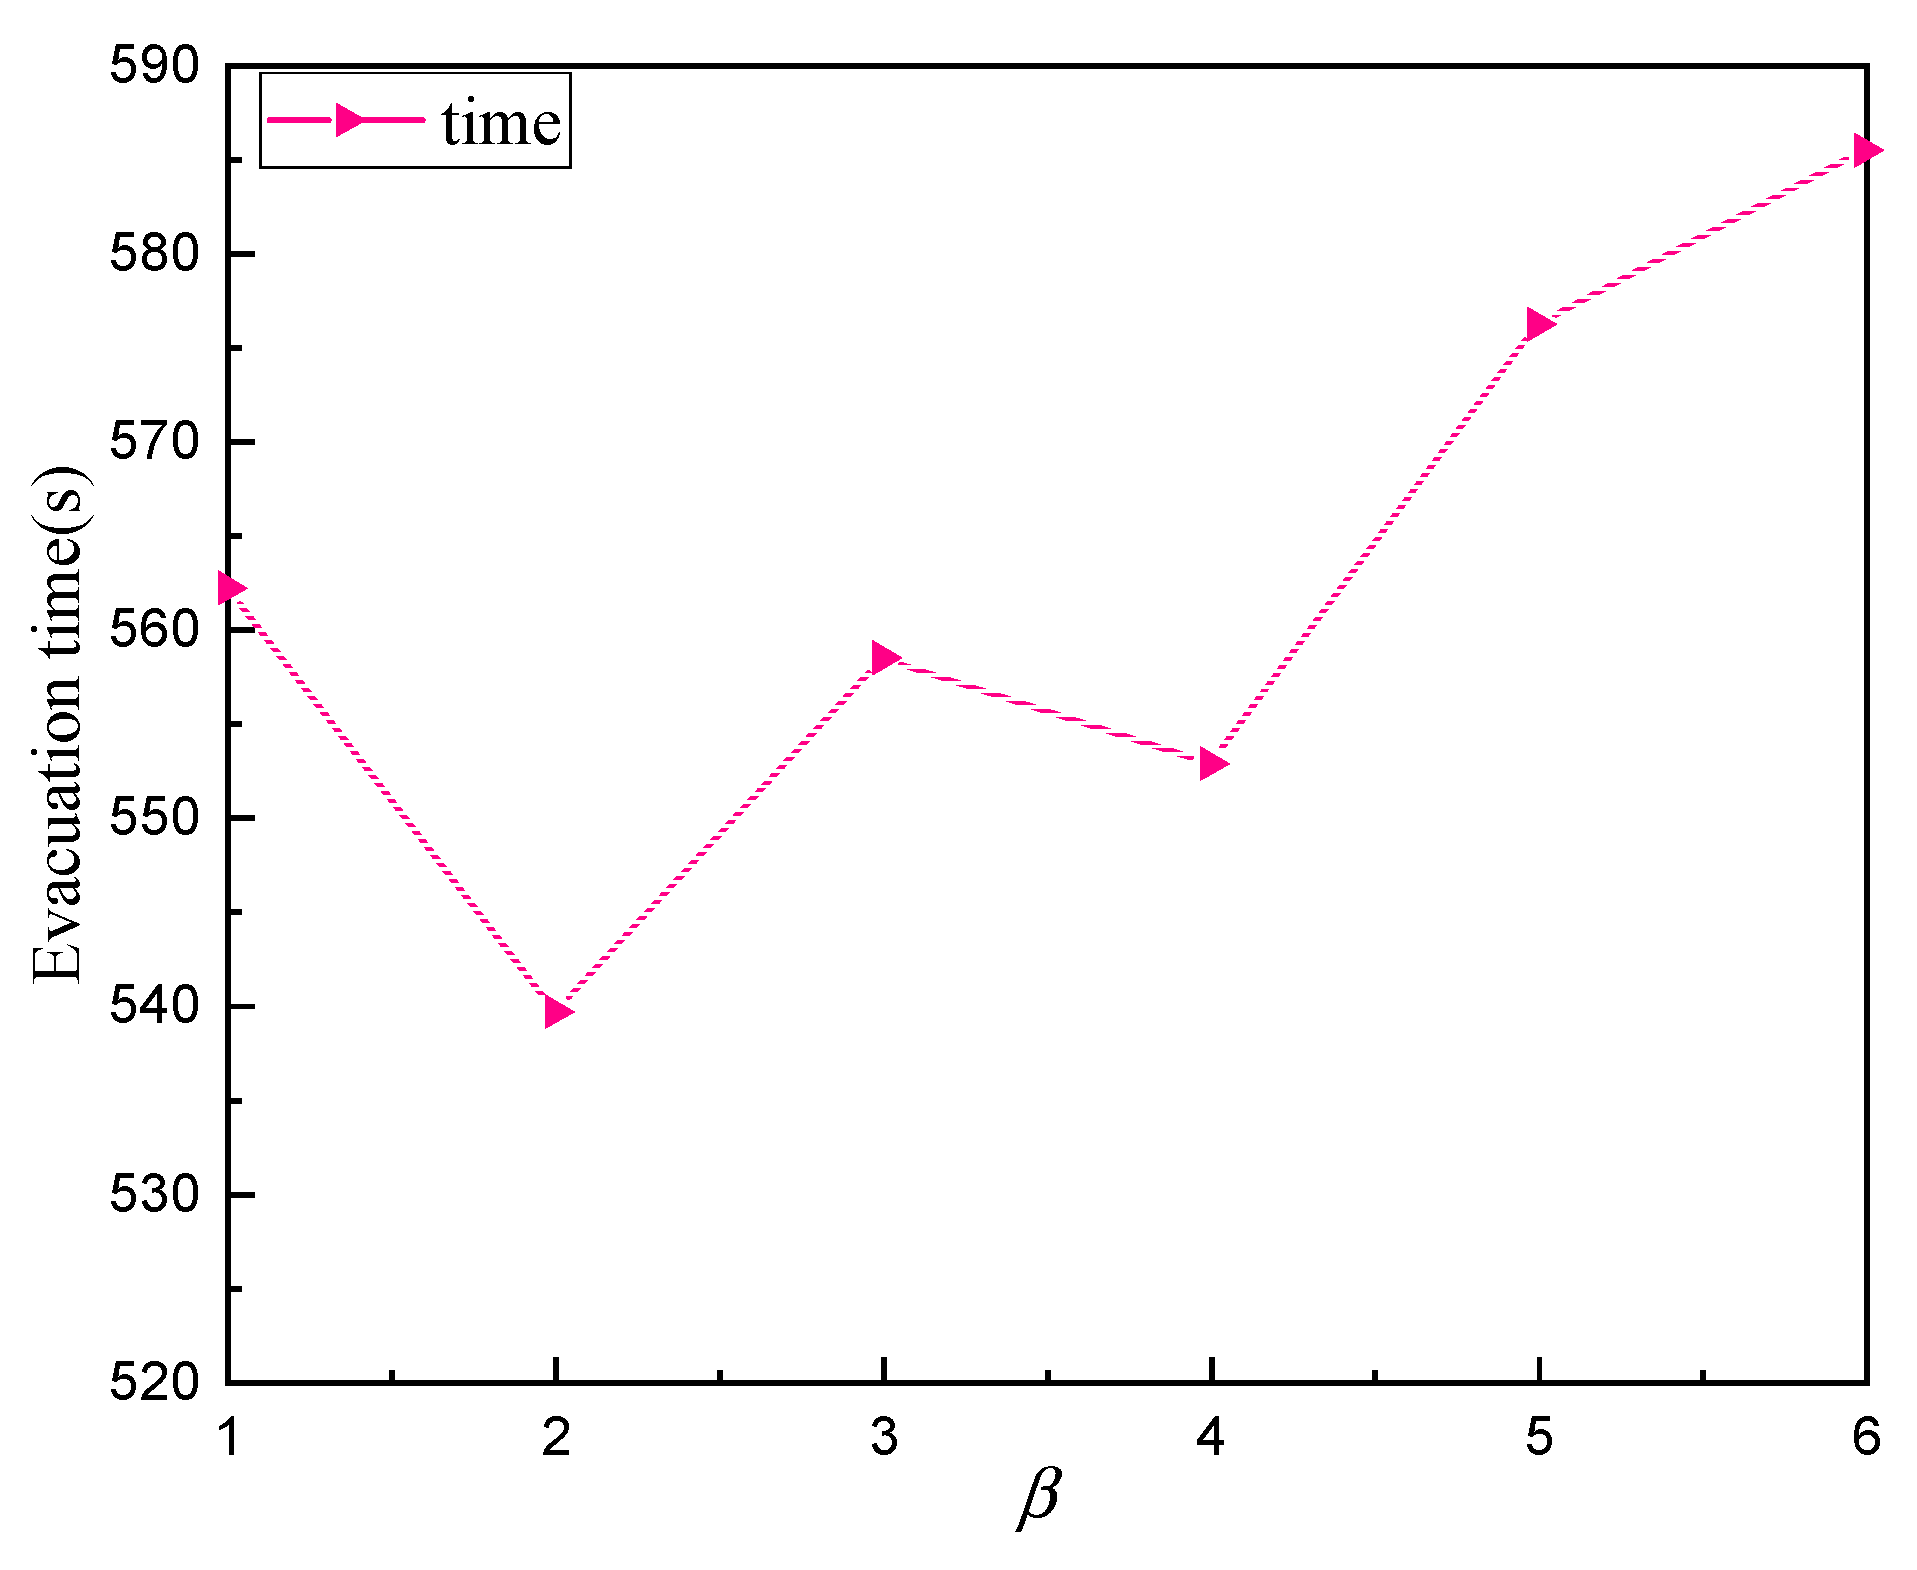
Figure 9 shows that a large expected heuristic factor leads to an expected heuristic factor value of two according to the experimental results. The expected heuristic factor determines the search direction of the algorithm and affects the search capability of the IACS. In the experiment, the IACS can converge when the maximum number of iterations of the IACS is set to 100. When is 1, the evacuation time is 562 s; when is 2, the evacuation time is the smallest with a value of 539 s; when is 3, the evacuation time is 558 s; when ranges from 4 to 6, the evacuation time increased from 552 s to 585 s. Parameter is set to two considering its influence on evacuation time.
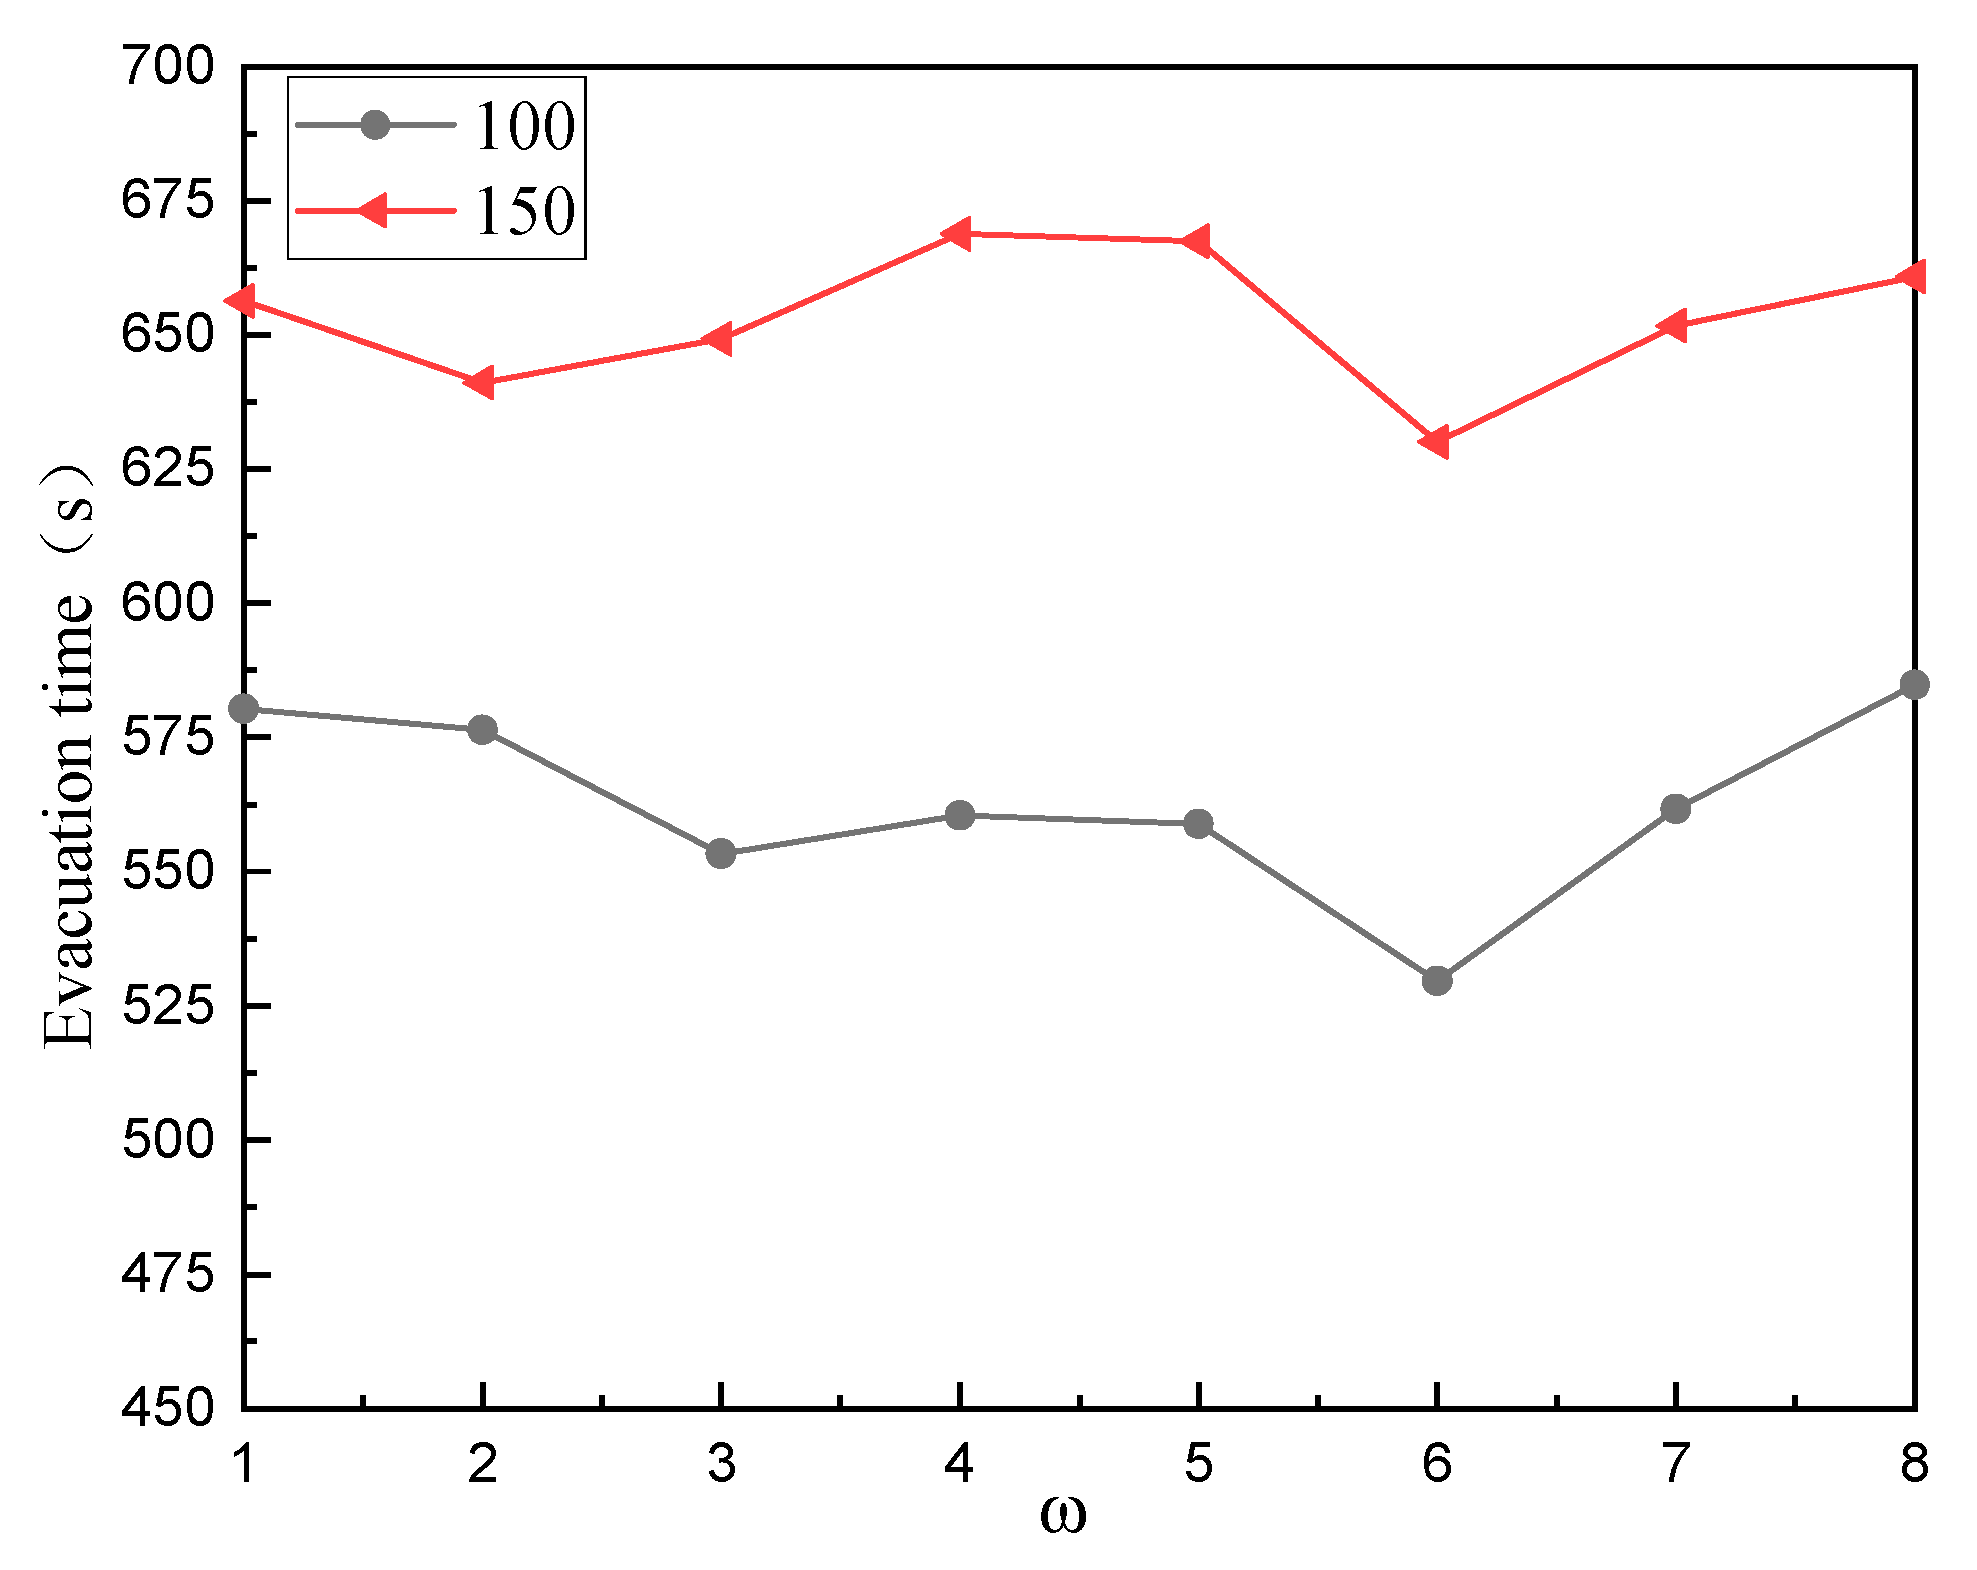
Figure 10 shows that the effects of the number of ants releasing pheromone after each iteration on the evacuation time are compared under 100, 150, and 200 iterations. The required time for evacuation simulation will be considerably raised with the increase in the maximum iteration times. When is 6, the evacuation time under the maximum iterations of 150 is 101 s, which is longer than that under the maximum iterations of 100. The evacuation time is short when the number of ants releasing pheromones after each iteration is six, and the value of is selected as six in the experiment.
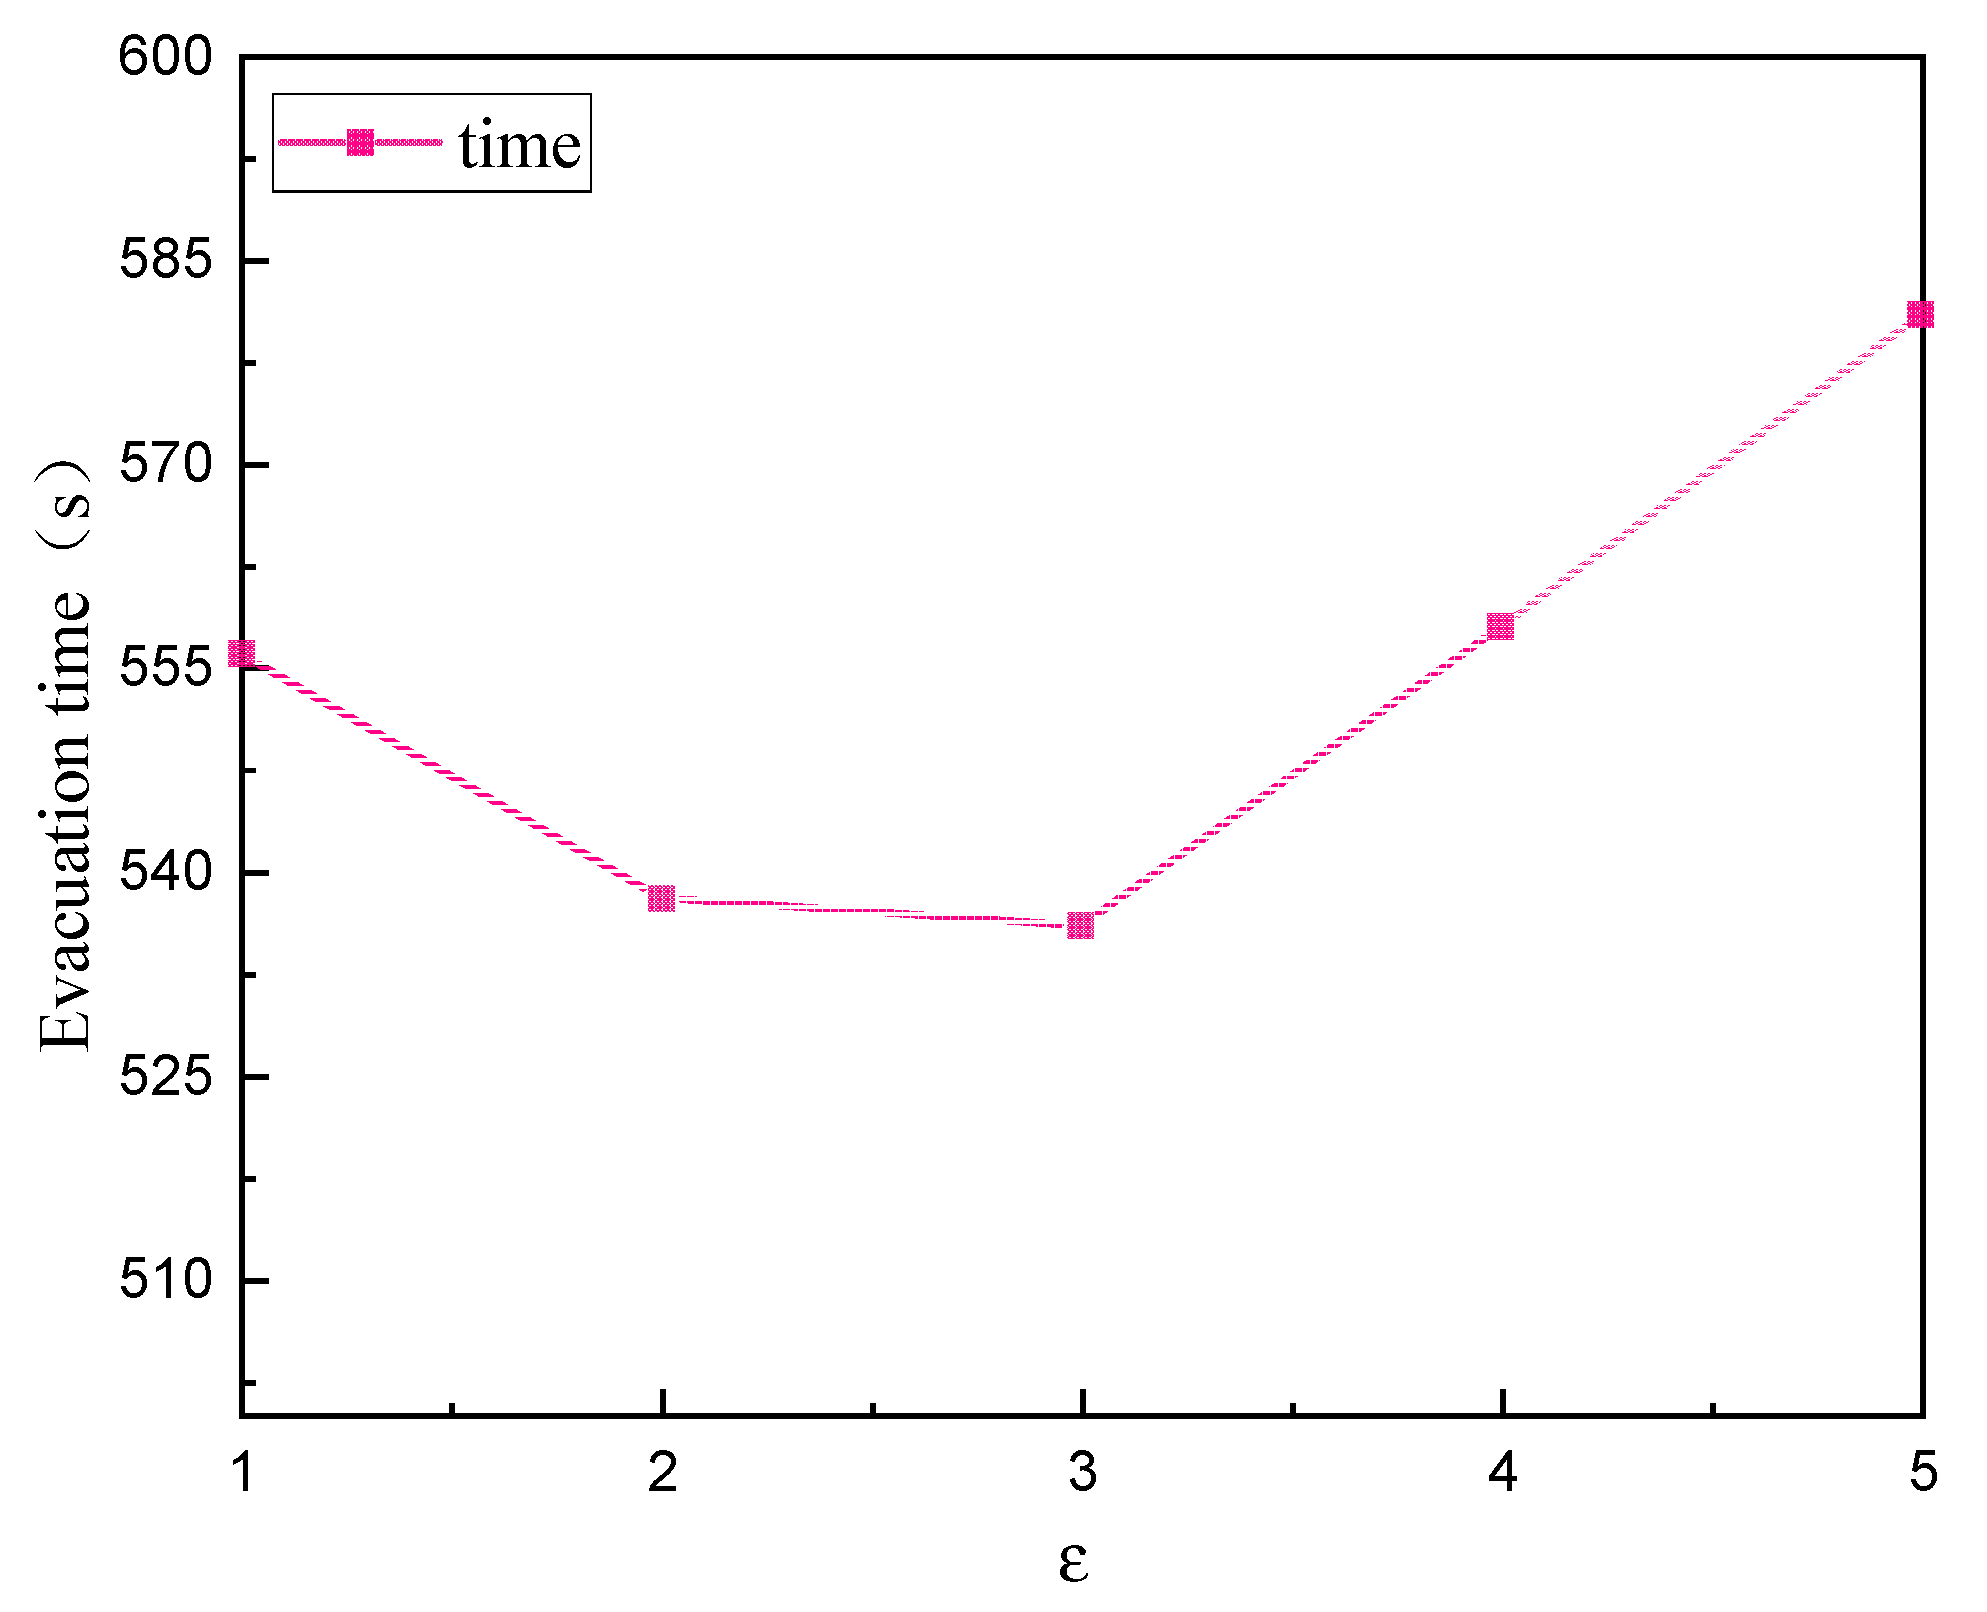
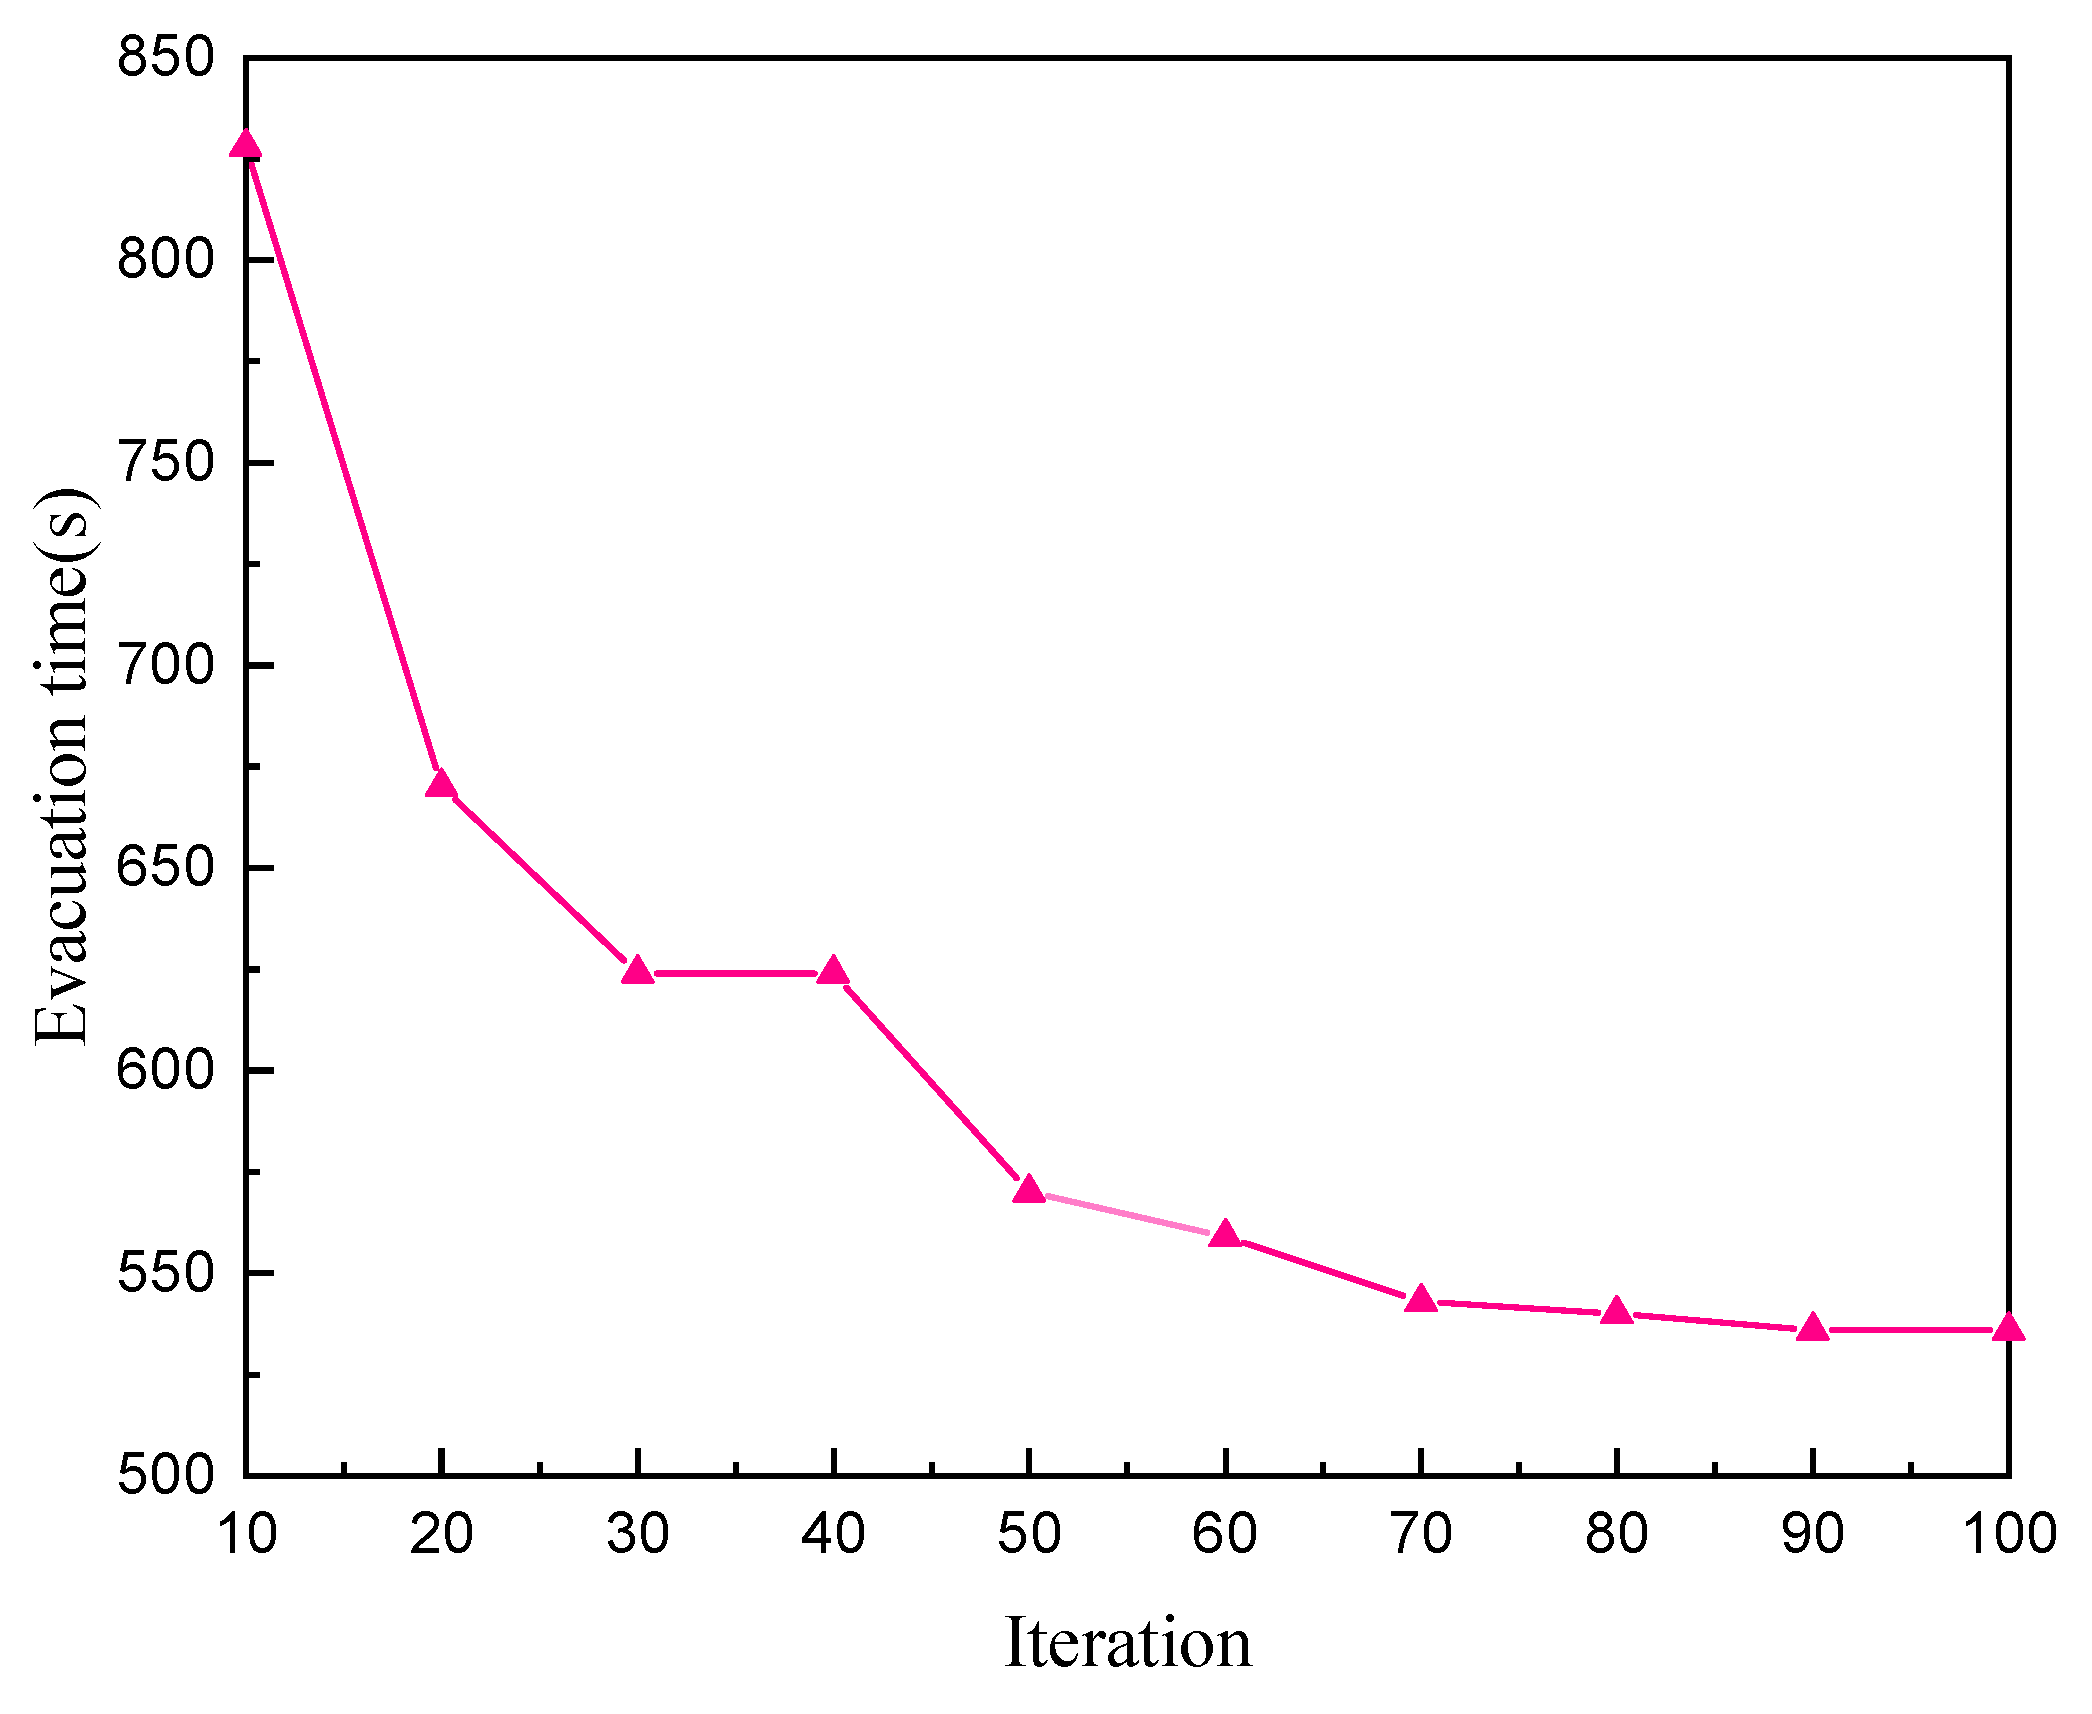
Figure 11 shows that an appropriate the increasing flow method parameter is the prerequisite for the rapid operation of the simulation method. Only the ACS is used when is one. Hence, the running time is slow. If the increasing flow method parameter is considerably large, then the crowd density will also be large, which will lead to crowd congestion and slow running. Therefore, the value of is taken as three. Figure 12 shows that the IACS can converge as the number of iterations increases. The IACS evacuation time converges to 536 s.
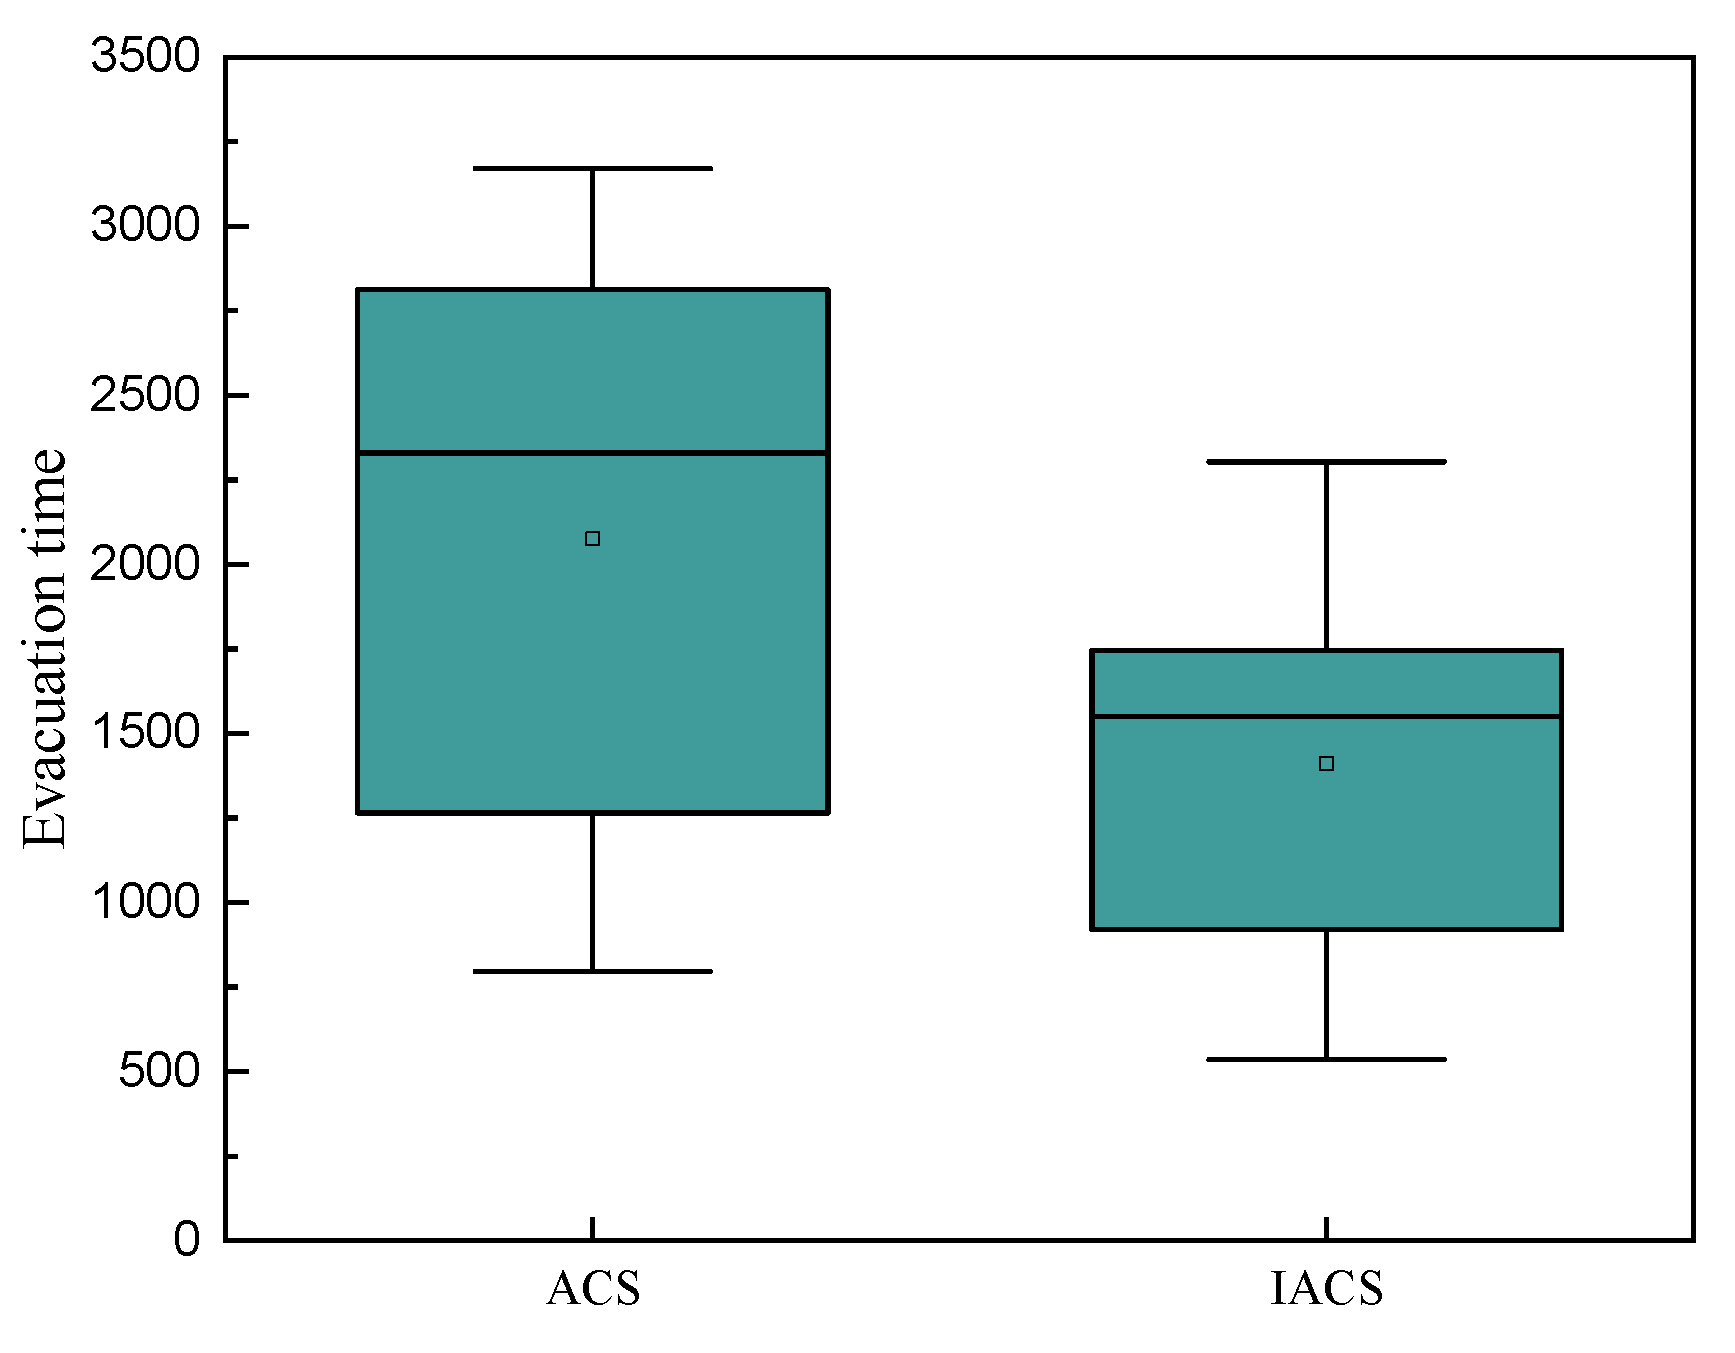
The proposed IACS is compared with the ACS method to test the performance of the selected method. The test population data and parameters used in the process are completely consistent. The maximum iterations of the ACS and the IACS were set to (100, 150, 200, 250, and 300), and the experiment was repeated 50 times. The results are shown in Figure 13 and Table 4.
Figure 13 shows that the maximum, minimum, and average evacuation times of the ACS are 3169, 796, and 2074 s, respectively. Meanwhile, the maximum, minimum, and average evacuation times of the IACS are 2304, 536, and 1411 s, respectively.
The results are shown in Table 4. The ACS takes 260 s longer than the IACS when the maximum number of iterations is 100. By contrast, the ACS takes 780 s longer than the IACS when the maximum number of iterations is 200. The ACS takes 865 s longer than the IACS when the maximum number of iterations is 300.
The evacuation routes of the crowd are obtained by simulating the typical scene of emergency evacuations on cruise ships (Table 5).
Table 5 shows the evacuation routes of part of the crowd. The planned real-time route will be displayed in the emergency evacuation signs of ships during the evacuation process. Take the first and second groups as examples. The small group of people located at the T5 node on the third floor of the cruise ship will follow the path nodes T5→T6→E10→E7→S15 during the evacuation process and safely arrive in Muster station D, and the small group of people located at the S1 node on the second floor of the cruise ship would safely arrive at Muster station C along the path nodes S1→E5→E1→F5→F6→F31.
In addition, this research focused on emergency evacuations on cruise ships. Future studies will be conducted on crowd behaviors in emergency evacuations, such as setting up guides in the crowd, reverse movement, and pairing behavior of the crowd. Evidently, these undertakings will be challenging tasks.
5. Conclusions
The research on emergency evacuation route planning strategy is the basis of guaranteeing the safe navigation of cruise ships. This study uses an IACS to analyze the multipath dynamic planning of emergency evacuations on cruise ships. The influence of crowd density on the speed of crowd movement is considered in solving practical problems. Meanwhile, the ACS is combined with the increasing flow method to improve the evacuation efficiency and reduce the time for the emergency evacuation of the crowd. The experimental results show that the IACS can effectively provide route planning for emergency evacuations on cruise ships. In different emergencies, the proposed model can be modified in accordance with specific actual situations to realize an optimal evacuation effect.
Author Contributions
L.L.: software, writing, methodology. Q.Z.: supervision. J.X.: investigation. H.Z.: conceptualization. All authors have read and agreed to the published version of the manuscript.
Funding
This research received no external funding.
Institutional Review Board Statement
Not applicable.
Informed Consent Statement
Not applicable.
Data Availability Statement
In this research, data supporting reported results can be found at https://fseg.gre.ac.uk/validation/ship_evacuation (accessed on 1 February 2021).
Conflicts of Interest
The authors declare no conflict of interest.
References
- Hu, M.; Cai, W.; Zhao, H. Simulation of Passenger Evacuation Process in Cruise Ships Based on A Multi-Grid Model. Symmetry 2019, 11, 1166. [Google Scholar] [CrossRef] [Green Version]
- Park, Y.S.; Park, S.W.; Cho, I.S. A Basic Study on Prediction Module Development of Collision Risk based on Ship’s Operator’s Consciousness. J. Navig. Port. Res. 2018, 39, 199–207. [Google Scholar] [CrossRef]
- Park, Y.S.; Kim, J.S.; Park, J.S. A Study on the Future Traffic Volume Estimation for Kwangyang Port Using the Consideration Factors of Marine Traffic Engineering. J. Navig. Port. Res. 2007, 31, 447–454. [Google Scholar] [CrossRef] [Green Version]
- Xie, Q.; Li, S.; Ma, C.; Wang, J.; Liu, J.; Wang, Y. Uncertainty analysis of passenger evacuation time for ships’ safe return to port in fires using polynomial chaos expansion with Gauss quadrature. Appl. Ocean. Res. 2020, 101, 102190. [Google Scholar] [CrossRef]
- Grandison, A.; Deere, S.; Lawrence, P.; Galea, E.R. The use of confidence intervals to determine convergence of the total evacuation time for stochastic evacuation models. Ocean. Eng. 2017, 146, 234–245. [Google Scholar] [CrossRef]
- Aydogdu, Y.V.; Aksoy, S. A study on quantitative benefits of port community systems. Marit. Policy Manag. 2015, 42, 1–10. [Google Scholar] [CrossRef]
- Vanem, E.; Skjong, R. Designing for safety in passenger ships utilizing advanced evacuation analyses—A risk based approach. Safety Sci. 2006, 44, 111–135. [Google Scholar] [CrossRef]
- Lee, D.; Kim, H.; Park, J.H.; Park, B.J. The current status and future issues in human evacuation from ships. Safety Sci. 2003, 41, 861–876. [Google Scholar] [CrossRef]
- Jiang, R.; Wu, Q.S. The adaptive cruise control vehicles in the cellular automata model. Phys. Lett. A 2006, 359, 99–102. [Google Scholar] [CrossRef]
- Pelechano, N.; Malkawi, A. Evacuation simulation models: Challenges in modeling high rise building evacuation with cellular automata approaches. Automat. Constr. 2008, 17, 377–385. [Google Scholar] [CrossRef]
- Xia, C.; Wang, H.; Zhang, A.; Zhang, W. A high-performance cellular automata model for urban simulation based on vectorization and parallel computing technology. Int. J. Geograp. Inf. Sci. 2018, 32, 399–424. [Google Scholar] [CrossRef]
- Uno, K.; Kashiyama, K. Development of simulation system for the disaster evacuation based on multi-agent model using GIS. Tsinghua Sci. Technol. 2008, 13, 348–353. [Google Scholar] [CrossRef]
- Zhou, M.; Dong, H.; Zhao, Y.; Ioannou, P.A.; Wang, F.Y. Optimization of crowd evacuation with leaders in urban rail transit stations. IEEE Trans. Intel. Transp. 2019, 20, 4476–4487. [Google Scholar] [CrossRef]
- Yu, J.; Zhang, C.; Wen, J.; Li, W.; Liu, R.; Xu, H. Integrating multi-agent evacuation simulation and multi-criteria evaluation for spatial allocation of urban emergency shelters. Int. J. Geogr. Inf. Sci. 2018, 32, 1884–1910. [Google Scholar] [CrossRef]
- Wang, C.; Wang, K.; Tao, J.; Zhou, Y. Research on Real-Time Optimal Path Planning Model and Algorithm for Ship Block Transportation in Shipyard. J. Mar. Sci. Eng. 2020, 8, 991. [Google Scholar] [CrossRef]
- Zhou, J.W.; Liu, M.R.; Kong, L.J.; Kuang, H. Paired behavior effect on pedestrian evacuation dynamics. Acta Phys. Sin. 2009, 58, 3001–3007. [Google Scholar]
- Kinsey, M.J.; Gwynne, S.M.V.; Kuligowski, E.D.; Kinateder, M. Cognitive biases within decision making during fire evacuations. Fire Technol. 2019, 55, 465–485. [Google Scholar] [CrossRef]
- Aydogdu, Y.V. A comparison of maritime risk perception and accident statistics in the Istanbul Straight. J. Navig. 2014, 67, 129. [Google Scholar] [CrossRef]
- Jeong, J.S.; Kim, S.Y. A Design of Communication Network Architecture for E-Navigation Services. J. Navig. Port. Res. 2008, 32, 37–45. [Google Scholar] [CrossRef]
- Jeong, J.S.; Sakaguchi, K.; Araki, K.; Takada, J.I. Generalization of MUSIC using extended array mode vector for joint estimation of instantaneous DOA and angular spread. IEICE Trans. Commun. 2001, 84, 1781–1789. [Google Scholar]
- Li, Y.; Cai, W.; Kana, A.A. Design of level of service on facilities for crowd evacuation using genetic algorithm optimization. Safety Sci. 2019, 120, 237–247. [Google Scholar] [CrossRef]
- Dulebenets, M.A.; Pasha, J.; Abioye, O.F.; Kavoosi, M.; Ozguven, E.E.; Moses, R.; Sando, T. Exact and heuristic solution algorithms for efficient emergency evacuation in areas with vulnerable populations. Int. J. Disaster Risk Reduct. 2019, 39, 101114. [Google Scholar] [CrossRef]
- Ni, W.; Li, W.; Wang, H.; Xiong, C.; Guo, D. Capacity-constrained contraflow adaption for lane reconfiguration in evacuation planning. J. Adv. Transport. 2018, 2018. [Google Scholar] [CrossRef]
- Goerigk, M.; Deghdak, K.; Heßler, P. A comprehensive evacuation planning model and genetic solution algorithm. Transport. Res. E-log. 2014, 71, 82–97. [Google Scholar] [CrossRef] [Green Version]
- Liu, M.; Zhang, F.; Ma, Y.; Pota, H.R.; Shen, W. Evacuation path optimization based on quantum ant colony algorithm. Adv. Eng. Inform. 2016, 30, 259–267. [Google Scholar] [CrossRef]
- Batmetan, J.R.; Santoso, A. A multiple-objective ant colony algorithm for optimizing disaster relief logistics. Adv. Sci. Lett. 2017, 23, 2344–2347. [Google Scholar] [CrossRef]
- Forcael, E.; González, V.; Orozco, F.; Vargas, S.; Pantoja, A.; Moscoso, P. Ant colony optimization model for tsunamis evacuation routes. Comput. Aided Civ. Inf. 2014, 29, 723–737. [Google Scholar] [CrossRef]
- Lim, G.J.; Zangeneh, S.; Baharnemati, M.R.; Assavapokee, T. A capacitated network flow optimization approach for short notice evacuation planning. Eur. J. Oper. Res. 2012, 223, 234–245. [Google Scholar] [CrossRef]
- Cova, T.J.; Johnson, J.P. A network flow model for lane-based evacuation routing. Transport. Res. A Pol. 2003, 37, 579–604. [Google Scholar] [CrossRef]
- Chen, P.H.; Feng, F. A fast flow control algorithm for real-time emergency evacuation in large indoor areas. Fire Saf. J. 2009, 44, 732–740. [Google Scholar] [CrossRef]
- Russo, F.; Rindone, C. Planning in road evacuation: Classification of exogenous activities. WIT Trans. Built Environ. 2011, 116, 639–651. [Google Scholar]
- Gai, W.M.; Du, Y.; Deng, Y.F. Evacuation risk assessment of regional evacuation for major accidents and its application in emergency planning: A case study. Saf. Sci. 2018, 106, 203–218. [Google Scholar] [CrossRef]
- Di Gangi, M.; Velonà, P. Multimodal mesoscopic approach in modeling pedestrian evacuation. Transport. Res. Rec. 2009, 2090, 51–58. [Google Scholar] [CrossRef]
- Russo, F.; Vitetta, A. Risk evaluation in a transportation system. Int. J. Sustain. Dev. Plan. 2006, 1, 170–191. [Google Scholar] [CrossRef] [Green Version]
- Yoo, B.; Choi, S.D. Emergency evacuation plan for hazardous chemicals leakage accidents using GIS-based risk analysis techniques in South Korea. Int. J. Environ. Res. Public Health 2019, 16, 1948. [Google Scholar] [CrossRef] [PubMed] [Green Version]
- Dorigo, M.; Gambardella, L.M. Ant colony system: A cooperative learning approach to the traveling salesman problem. IEEE Trans. Evol. Comput. 1997, 1, 53–66. [Google Scholar] [CrossRef] [Green Version]
- Zhang, X. Study on rapid evacuation in high-rise buildings. Eng. Sci. Technol. 2017, 20, 1203–1210. [Google Scholar] [CrossRef]
- Seike, M.; Kawabata, N.; Hasegawa, M. Experiments of evacuation speed in smoke-filled tunnel. Tunn. Undergr. Space Tech. 2016, 53, 61–67. [Google Scholar] [CrossRef]
- Huang, Z.M.; Chen, W.N.; Li, Q.; Luo, X.N.; Yuan, H.Q.; Zhang, J. Ant Colony Evacuation Planner: An Ant Colony System With Incremental Flow Assignment for Multipath Crowd Evacuation. IEEE Trans. Cybern. 2020, 2168–2275. [Google Scholar] [CrossRef]
- Gajpal, Y.; Abad, P.L. Multi-ant colony system (MACS) for a vehicle routing problem with backhauls. Eur. J. Oper. Res. 2009, 196, 102–117. [Google Scholar] [CrossRef]
- Wang, T.I.; Wang, K.T.; Huang, Y.M. Using a style-based ant colony system for adaptive learning. Expert Syst. Appl. 2008, 34, 2449–2464. [Google Scholar] [CrossRef]
- Xiong, S. Hierarchical multi-objective evacuation routing in stadium using ant colony optimization approach. J. Transp. Geogr. 2011, 19, 443–451. [Google Scholar]
- Lui, C.H.; Fong, N.K.; Lorente, S.; Bejan, A.; Chow, W.K. Constructal design of pedestrian evacuation from an area. J. Appl. Phys. 2013, 113, 034904. [Google Scholar] [CrossRef] [Green Version]
- Russo, F.; Vitetta, A. Safety of users in road evacuation: General methodology and main results. WIT Trans. Built Environ. 2007, 96, 763–772. [Google Scholar]
- Russo, F.; Chilà, G. Safety of users in road evacuation: RP vs. SP surveys in demand analysis. WIT Trans. Built Environ. 2008, 101, 703–713. [Google Scholar]
- Russo, F.; Rindone, C.; Trecozzi, M.R. The role of training in evacuation. WIT Trans. Inf. Commun. 2012, 44, 491–502. [Google Scholar]
- Guan, J.; Wang, K.; Chen, F. Self-organization Phenomena in an Evacuation Flow. J. Cell. Autom. 2016, 11, 461–473. [Google Scholar]
- Lovreglio, R.; Ronchi, E.; Borri, D. The validation of evacuation simulation models through the analysis of behavioural uncertainty. Reliab. Eng. Syst. Saf. 2014, 131, 166–174. [Google Scholar] [CrossRef]
- Galea, E.R.; Deere, S.; Brown, R.; Filippidis, L. An experimental validation of an evacuation model using data sets generated from two large passenger ships. J. Ship Res. 2013, 57, 155–170. [Google Scholar] [CrossRef]
Figure 1.
Schematic diagram of ant colony optimization (ACO).

Figure 2.
Average speeds of people of different ages.

Figure 3.
Crowd composition of cruise ships.

Figure 4.
Improved ant colony system (IACS) for a dense crowd evacuation solution.

Figure 5.
Costa cruise ship (https://baike.baidu.com (accessed on 1 February 2021)).
Figure 5.
Costa cruise ship (https://baike.baidu.com (accessed on 1 February 2021)).

Figure 6.
Third-tier node diagram of the cruise ship.

Figure 7.
Second-tier node diagram of the cruise ship.

Figure 8.
First-tier node diagram of the cruise ship.

Figure 9.
Effects of the expected heuristic factor on evacuation time.

Figure 10.
Effects of number of ants placing pheromone on evacuation time.

Figure 11.
Effects of the increasing flow method parameters on evacuation time.

Figure 12.
Relationship between the number of iterations and evacuation time.

Figure 13.
Comparison of the ant colony system (ACS) and IACS.


Table 1.
Stair dimensions (unit: m).
| Stairs | Function | From | To | Wide | High | Long |
|---|---|---|---|---|---|---|
| Stair 1 and Stair 5 | connect deck 1 and deck 2 | Deck 1 | landing | 1 | 1.5 | 2 |
| landing | Deck 2 | 1 | 1.5 | 2 | ||
| Stair 2 and Stair 6 | connect deck 1 and deck 2 | Deck 1 | landing | 1.35 | 1.5 | 1.9 |
| landing | Deck 2 | 1.35 | 1.5 | 1.9 | ||
| Stair 3 and Stair 7 | connect deck 1 and deck 2 | Deck 1 | landing | 1.35 | 1.5 | 1.9 |
| landing | Deck 2 | 1.35 | 1.5 | 1.9 | ||
| Stair 4 and Stair 8 | connect deck 1 and deck 2, | Deck 1 | landing | 1.35 | 1.5 | 1.9 |
| landing | Deck 2 | 1.35 | 1.5 | 1.9 | ||
| Stair 6 and Stair 9 | Deck 2 and Deck 3 | Deck 2 | landing | 1.35 | 1.5 | 1.9 |
| landing | Deck3 | 1.35 | 1.5 | 1.9 | ||
| Stair 7 and Stair 10 | Deck 2 and Deck 3 | Deck 2 | landing | 1.2 | 1.5 | 1.9 |
| landing | Deck 3 | 1.2 | 1.5 | 1.9 |
Table 2.
Average Flow Volume.
| Range (Person/min/ft) | Median (Person/m/s) |
|---|---|
| 0–7 | 0.191 |
| 7–10 | 0.465 |
| 10–15 | 0.684 |
| 15–20 | 0.957 |
| 20–25 | 1.230 |
| ≥25 | 1.367 |
Table 3.
Parameters of the IACS.
| Symbol | Attribute | Value |
|---|---|---|
| m | number of ants | 400 |
| expected heuristic factor | 2 | |
| maximum number of iterations | 100 | |
| parameters of the allocation flow method | 3 | |
| pheromone volatilization factor | 0.5 | |
| random number | 0.5 | |
| number of ants placing pheromone after each iteration | 6 |
Table 4.
Comparison of ACS and IACS.
| Maximum Number of Iterations | ACS(s) | IACS(s) |
|---|---|---|
| 100 | 796 | 536 |
| 150 | 1265 | 921 |
| 200 | 2330 | 1550 |
| 250 | 2812 | 1746 |
| 300 | 3169 | 2304 |
Table 5.
Evacuation routes of part of the crowd.
| People ID | Staring Node | Muster Station | Path Collection |
|---|---|---|---|
| 1 | T5 | Muster station D | T5→T6→E10→E7→S15 |
| 2 | S1 | Muster station C | S1→E5→E1→F5→F6→F31 |
| 3 | F25 | Muster station A | F25→F20→F21→F19→F16→F18 |
| 4 | T1 | Muster station C | T1→T2→E9→E6→E2→F6→F31 |
| 5 | S9 | Muster station D | S9→S11→S12→S14 |
| 6 | S3 | Muster station B | S3→S4→S7→E6→E2→F7→F34 |
| 7 | S23 | Muster station A | S23→S22→S27→S26→S21→S20→S19 |
| 8 | F3 | Muster station B | F3→F4→F7→F34 |
| 9 | S8 | Muster station D | S8→S10→S13→S12→S14 |
| 10 | F5 | Muster station C | F5→F6→F31 |
| 11 | T8 | Muster station D | T8→T7→T6→E10→E7→S15 |
| 12 | T4 | Muster station C | T4→T3→T2→E9→E6→E2→F6→F31 |
| 13 | T11 | Muster station D | T11→T10→E9→E6→E2→F6→F31 |
| 14 | F2 | Muster station B | F2→F3→F4→F7→F34 |
| 15 | F1 | Muster station C | F1→F5→F6→F31 |
| 16 | S8 | Muster station D | S8→S10→S13→S12→S14 |
| 17 | S25 | Muster station D | S25→S21→S20→S19 |
| 18 | S1 | Muster station C | S1→E5→E1→F5→F6→F31 |
| 19 | S26 | Muster station D | S26→S27→S21→S18 |
| 20 | F5 | Muster station C | F5→F6→F31 |
Publisher’s Note: MDPI stays neutral with regard to jurisdictional claims in published maps and institutional affiliations. |
© 2021 by the authors. Licensee MDPI, Basel, Switzerland. This article is an open access article distributed under the terms and conditions of the Creative Commons Attribution (CC BY) license (http://creativecommons.org/licenses/by/4.0/).
Share and Cite
MDPI and ACS Style
Liu, L.; Zhang, H.; Xie, J.; Zhao, Q. Dynamic Evacuation Planning on Cruise Ships Based on an Improved Ant Colony System (IACS). J. Mar. Sci. Eng. 2021, 9, 220. https://0-doi-org.brum.beds.ac.uk/10.3390/jmse9020220
AMA Style
Liu L, Zhang H, Xie J, Zhao Q. Dynamic Evacuation Planning on Cruise Ships Based on an Improved Ant Colony System (IACS). Journal of Marine Science and Engineering. 2021; 9(2):220. https://0-doi-org.brum.beds.ac.uk/10.3390/jmse9020220
Chicago/Turabian StyleLiu, Linfan, Huajun Zhang, Jupeng Xie, and Qin Zhao. 2021. "Dynamic Evacuation Planning on Cruise Ships Based on an Improved Ant Colony System (IACS)" Journal of Marine Science and Engineering 9, no. 2: 220. https://0-doi-org.brum.beds.ac.uk/10.3390/jmse9020220
Note that from the first issue of 2016, this journal uses article numbers instead of page numbers. See further details here.