Article

Proof of Concept of a Breakwater-Integrated Hybrid Wave Energy Converter Using a Composite Modelling Approach

by
Theofano I. Koutrouveli
1,
Enrico Di Lauro
1,
Luciana das Neves
1,2,*,
Tomás Calheiros-Cabral
2,
Paulo Rosa-Santos
2 and
Francisco Taveira-Pinto
2
1
IMDC—International Marine and Dredging Consultants, Van Immerseelstraat 66, 2018 Antwerp, Belgium
2
Department of Civil Engineering, FEUP—Faculty of Engineering of the University of Porto, Rua Dr. Roberto Frias, s/n, 4200-465 Porto, Portugal
*
Author to whom correspondence should be addressed.
J. Mar. Sci. Eng. 2021, 9(2), 226; https://0-doi-org.brum.beds.ac.uk/10.3390/jmse9020226
Submission received: 30 December 2020 / Revised: 12 February 2021 / Accepted: 16 February 2021 / Published: 20 February 2021
(This article belongs to the Special Issue Hybrid Systems for Marine Energy Harvesting)

Abstract

:
Despite the efforts of developers, investors and scientific community, the successful development of a competitive wave energy industry is proving elusive. One of the most important barriers against wave energy conversion is the efficiency of the devices compared with all the associated costs over the lifetime of an electricity generating plant, which translates into a very high Levelised Cost of Energy (LCoE) compared to that of other renewable energy technologies such as wind or solar photovoltaic. Furthermore, the industrial roll-out of Wave Energy Converter (WEC) devices is severely hampered by problems related to their reliability and operability, particularly in open waters and during harsh environmental sea conditions. WEC technologies in multi-purpose breakwaters—i.e., a structure that retains its primary function of providing sheltered conditions for port operations to develop and includes electricity production as an added co-benefit—appears to be a promising approach to improve cost-effectiveness in terms of energy production. This paper presents the proof of concept study of a novel hybrid-WEC (HWEC) that uses two well understood power generating technologies, air and water turbines, integrated in breakwaters, by means of a composite modelling approach. Preliminary results indicate: firstly, hybridisation is an adequate approach to harness the available energy most efficiently over a wide range of metocean conditions; secondly, the hydraulic performance of the breakwater improves; finally, no evident negative impacts in the overall structural stability specific to the integration were observed.

1. Introduction

Over the past years, global decarbonisation efforts have accelerated the quest for finding diverse, clean and renewable energy sources in order to achieve the targets in energy and climate that have been set out. Oceans are a safe, inexhaustible and largely untapped source of renewable energy that may significantly contribute to the electrical energy supply of vast coastal regions in the world [1]. Therefore, is not surprising that more than a thousand Wave Energy Converters (hereafter WECs) have been designed and developed worldwide [2] to varying stages, from concept to pre-commercial roll out.
Despite the efforts of developers, investors and scientific community, the successful development of a competitive wave energy industry is proving elusive. One of the most important barriers against wave energy conversion is the efficiency of the devices compared with all the associated costs over the lifetime of an electricity generating plant, which translates into a very high LCoE compared to that of other renewable energy technologies such as wind or solar photovoltaic. High costs make the devices still not economically feasible and not competitive on the global market [3]. Furthermore, the industrial roll-out of WEC devices is severely hampered by problems related to their reliability and operability, particularly in open waters and during harsh environmental sea conditions. There are currently a vast number of concepts at varying stages of development, supported by a very substantial investment effort and the hope that a competitive wave energy industry will successfully develop soon; however, to date, only a few technologies have gone from the research design and prototyping stage through demonstration and pre-commercial phases.
Because wave energy is a sizeable prize, relentless and determined effort should continue to be put in order to find the solutions to overcome the similar challenges experienced by wave energy technologies while progressing through each development phase. In this respect, many authors (e.g., [4,5,6]) argue that a good idea is integrating WEC devices in harbour defence structures, in so-called multi-purpose breakwaters. Firstly, capital expenditure costs can be shared between WEC and breakwater [7]. Secondly, the breakwater offers a reliable foundation for the WEC [8]. Furthermore, access to the main power grid is assured [9]. Finally, access for maintenance and repairs is facilitated [10]. In such multi-purpose breakwaters, the structure retains its primary function—that is providing sheltered conditions for port operations to develop—and electricity production is an added co-benefit. Therefore, a part of the energy that is usually dissipated by traditional harbour defence structures and consequently lost, can be captured.
Despite the added advantages of the integration, the wave energy locally available to be extracted with nearshore technologies is lower than that available in deeper water conditions. Furthermore, the integration of a WEC is not adequate for all breakwater types, in particular for already existing breakwaters, as the benefit of the integration strongly depends on the configuration, geographic location and orientation of the breakwater with respect to the prevalent wave climate conditions. Studying the combination of a WEC and a breakwater requires considering distinct aspects that concern both, the multi-purpose breakwater as a harbour defence structure, and the renewable energy device. It is clear that the most important goal for the integration of a WEC device into harbour breakwaters is to guarantee their functionality as protection works. Detailed studies are required to evaluate the hydraulic performance and structural response/stability of the breakwater, in terms of wave reflection, wave overtopping, wave loading, as well as local and global stability. Secondly, the performance of the system as a WEC device, focusing on the evaluation of the WEC generated power and performance as well as the reliability and survivability of the WEC technology when subjected to harsh maritime conditions, need to be examined. The integration of WECs into breakwaters has shown significant results in terms of hydraulic response of the device [10]. However, more research and innovation is needed in terms of improving the energy produced by WEC devices. In this context, the hybridisation of different WEC technologies in multi-purpose breakwaters appears to be a promising approach to improve their efficiency. This is the underlying idea behind a novel and innovative device, the hybrid-WEC (HWEC), which was first presented under the framework of the OCEANERA-NET Second Joint Call 2016 project SE@PORTS project (e.g., [11,12]) and is now being further developed under the OCEANERA-NET Second Joint Call 2019 project WEC4PORTS. The principal goal of the SE@PORTS project was to assess the suitability of existing WECs to be integrated in port infrastructures, bringing the selected concepts to the next Technology Readiness Level (TRL). By combining the main current and well-established principles in harnessing wave energy (i.e., the Oscillating Water Column—OWC and the Overtopping Device—OTD), the HWEC concept is aiming to exploit the strengths of each technology and overcome their individual limitations when implemented separately, thereby presenting a breakthrough and efficient approach to harness the wave energy at ports.
Following this introductory section on the integration of WECs into harbour defence structures and the novel concept HWEC, the present paper is organised as follows: Section 2 is devoted to the description of the performances of the OWC integrated into a breakwater, while Section 3 describes the performances of the OTD device embedded in breakwaters; the detailed description and discussion of the performances of the HWEC obtained with the physical and numerical model tests under the SE@PORTS project is presented in Section 4; finally, the main conclusions are drawn in the last section.

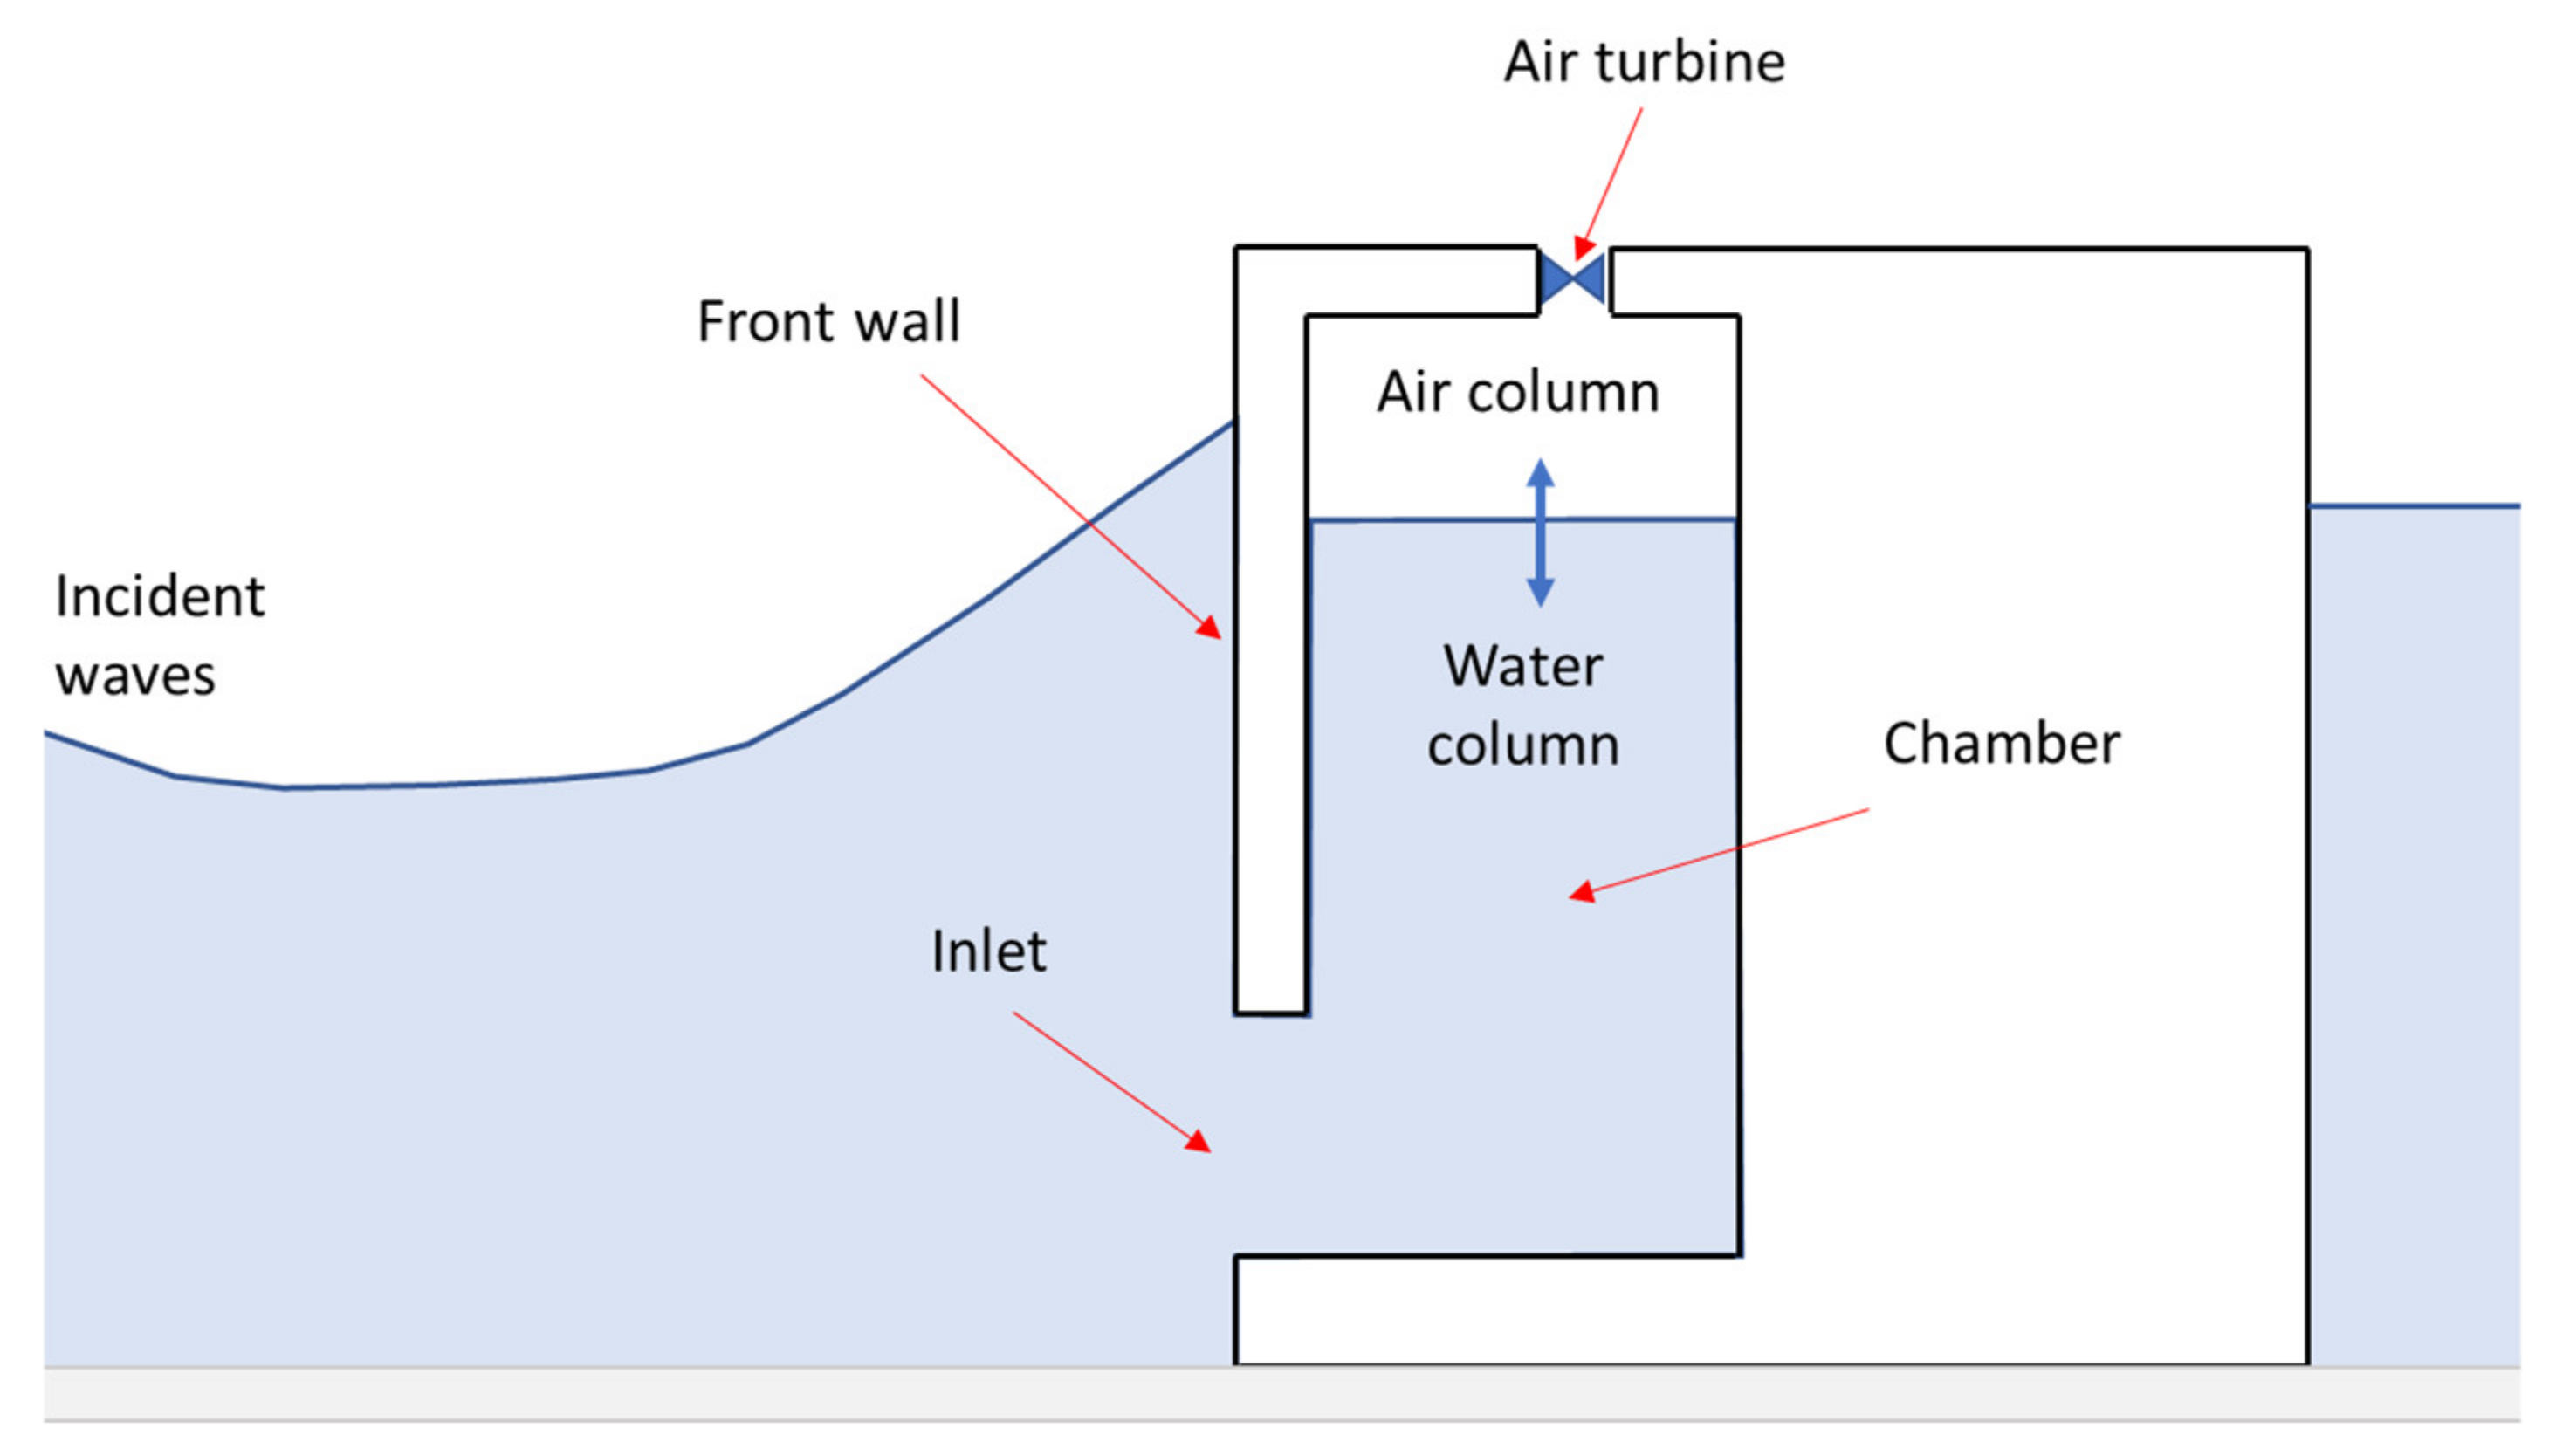
2. Breakwater-Integrated OWC

With two pre-commercial pilot plants currently installed in Spain [4] and Italy [5], the breakwater-integrated OWC is currently the most prominent and probably the most successful example of a multi-purpose breakwater for energy production. The technology consists of a breakwater with a chamber, having a submerged and open inlet in its exposed face to allow water to enter into the chamber (Figure 1). An air-duct with an air turbine installed connects the chamber to the atmosphere. Under wave loading, the air in the chamber is alternately compressed and decompressed, creating a bi-directional flow through the duct. This flow drives a self-rectifying turbine connected with a generator for electricity production.
The main advantage of the breakwater-integrated OWC is the simplicity of the concept, a rigid structure without any moving parts except the rotor of the air turbine. In addition, air turbines are a very well-understood technology that has been around for many decades. The integration of an OWC in a new vertical caisson breakwater is probably the most straightforward solution of integration from the economic, construction and operation viewpoints [11]. With respect to disadvantages, the low operability of the OWC device in highly energetic sea states, caused by problems of loss of efficiency or damage of the turbine due to excessive air pressure in the chamber and green water droplets/jets reaching it, is the most challenging. Finally, it is worth underlining that the integration of this device in existing breakwaters might change the original cross-section of the breakwater, which can have a relevant impact on the structural response/stability to wave loading, as well as in its hydraulic performance mostly in terms of wave reflection and overtopping.

2.1. Structural Response/Stability to Waves

Although many studies using physical and numerical modelling have been conducted to evaluate the wave loading and the structural response to incident waves of Breakwater-integrated OWC, there is no widely accepted and well-established methodology to design such innovative configurations. Early studies conducted in Japan by Takahashi [13] suggested calculating the force distribution on a vertical breakwater integrated OWC adopting a modified Goda’s formulae [14], which is traditionally adopted for conventional vertical caisson breakwaters. Other authors focused their research on the influence of the device geometry on the wave pressure distribution at the OWC front wall [15,16] and back wall inside the chamber [17], as well as on making a detailed evaluation of the maximum impact pressure [18,19]. New design methods for the calculation of the wave forces on an OWC front wall were presented by Thiruvenkatasamy et al. [20], Patterson [21], Huang et al. [22], Liu et al. [23] conducted physical model testing focusing on the analysis of the stability of a vertical breakwater-integrated OWC. Research results generally confirm that the wave forces on a vertical breakwater-integrated OWC are smaller than those acting on a conventional vertical breakwaters. Similar results confirming that Goda’s formulae overestimates the maximum resultant forces for a vertical breakwater-integrated OWC, were obtained by Kuo et al. [24] based on measured data obtained in physical model testing of a vertical breakwater-integrated OWC under regular waves. Conversely, according to Kuo et al. [24], Goda’s formulae underestimates the momentum due to a different wave-induced pressure distribution on the surface of the structure, which could affect the overall stability of the OWC caissons against overturning. Viviano et al. [25] evaluated the wave loading on these innovative breakwaters focusing on the influence of the turbine-orifice opening, while Naty et al. [26] showed that the wave forces on the front wall for an optimised OWC configuration could be accurately predicted by Sainflou [27] as used for vertical walls if they were increased by a safety factor equal to 1.1. Ashlin et al. [28] compared measured horizontal wave forces with those obtained by applying the Goda’s formulae [14] to show that this formula overpredicts the shoreward peak forces by 46–90%, while underpredicting the seaward peaks by 5–50%. More recently, Pawitan et al. [29] proposed a novel method to estimate forces acting on an OWC chamber in a vertical caisson breakwater, validated against results from large scale physical model measurements described in Allsop et al. [30].
Despite a few discrepancies caused by different OWC configurations across the research conducted over the last decades on vertical breakwater-integrated OWC, results suggest that the nature and magnitude of wave loading acting on the front-wall of a OWC device differs from those acting on conventional vertical breakwaters. In particular, the total horizontal forces can be greater or lower than those acting on conventional vertical breakwaters, depending on the inner geometry of the chamber and turbine dimensions. Research on structural stability/response of a breakwater-integrated OWC was carried out essentially for vertical breakwaters to date. Very little or no studies focusing on a rubble-mound breakwater-integrated OWC were found.

2.2. Hydraulic Performance

Only limited information exists in the literature on the hydraulic performance of a non-conventional breakwater-integrated OWC in terms of wave overtopping and transmission. Zanuttigh et al. [31] analysed wave reflections from an OWC device, showing that reflection coefficients are lower than 0.55, which is very low compared to the typical values on vertical caissons that are around 0.9 [32]. Viviano et al. [25] evaluated the influence of the turbine-orifice opening on the wave reflection, to propose an optimisation of the orifice dimension that minimises the reflection coefficient to values lower than 0.6. Recently, Simonetti and Cappietti [33] studied the effectiveness of a the integration of an OWC in a structure as an anti-reflection device to reduce harbour agitation using a numerical wave tank model developed in OpenFOAM®, reaching reflection coefficients of around 15%.

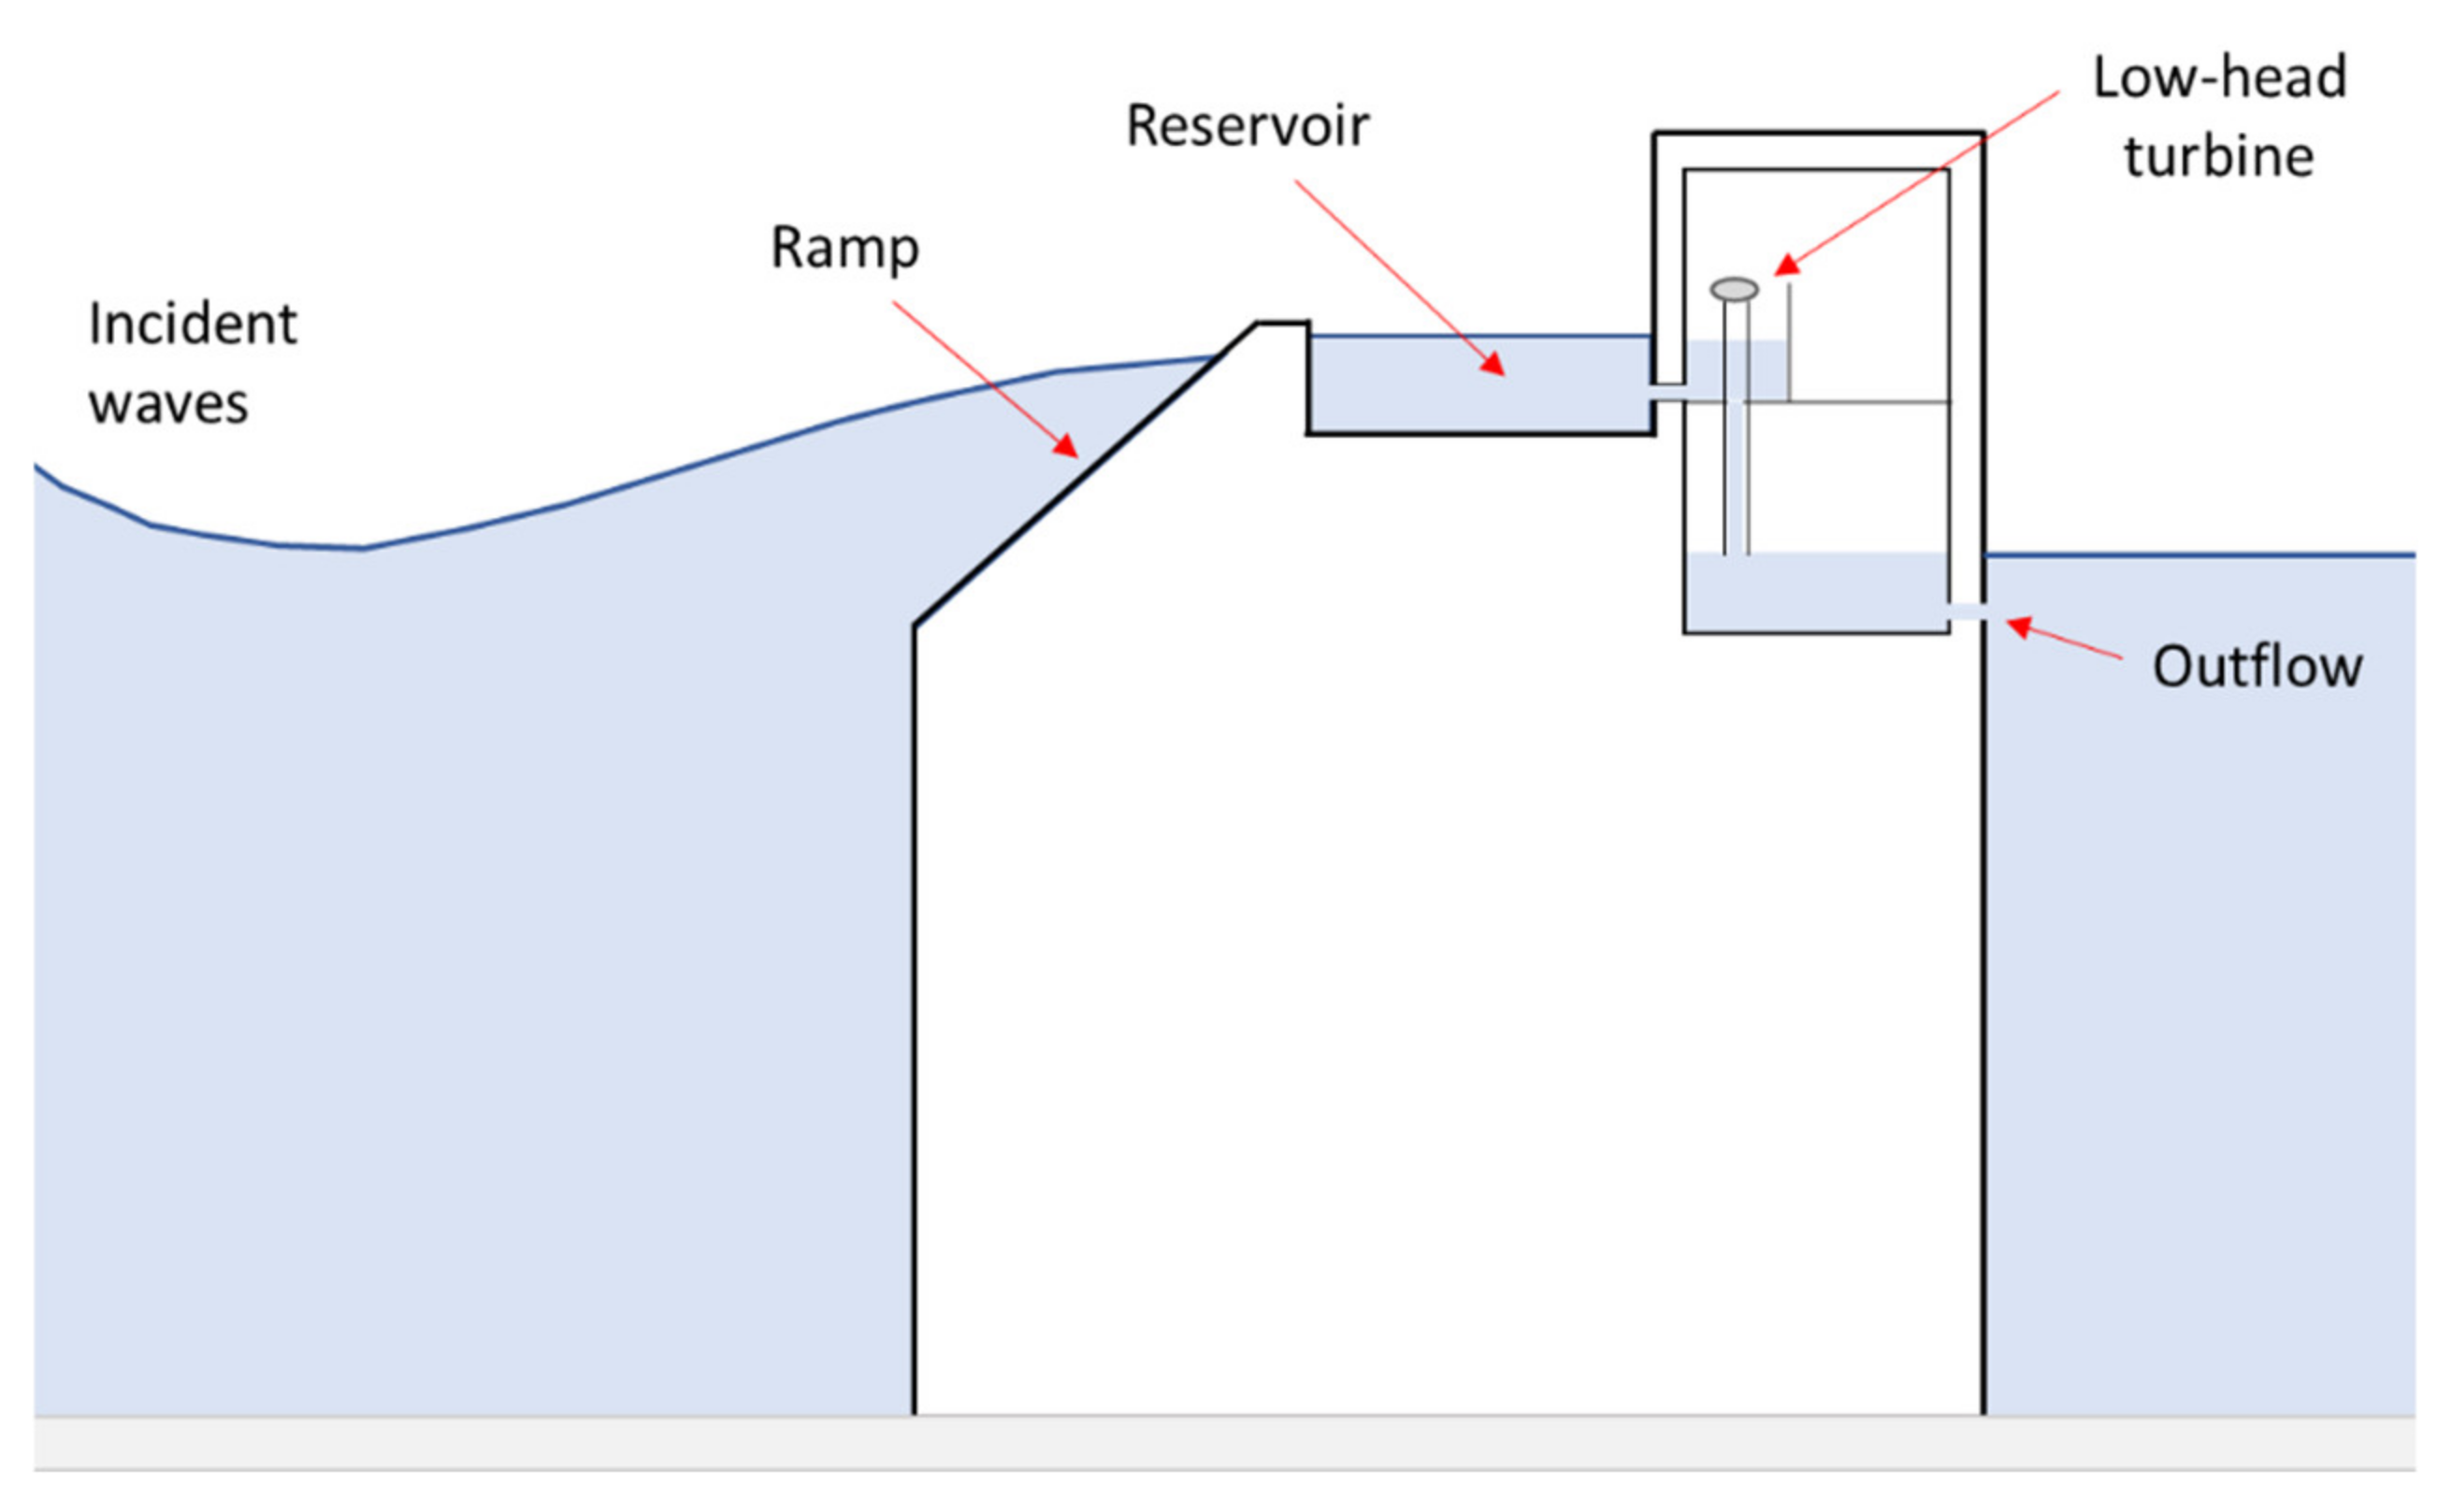
3. Breakwater-Integrated OTD

Another type of WEC suitable to be integrated in both rubble mound and vertical breakwaters is the OTD device (Figure 2). This technology consists of a frontal ramp slope that leads the incident waves to overtop into one or more storage basins (or reservoirs), placed at a level higher than the sea water level. The water stored in the frontal reservoir(s) flows through the turbine(s) combined with a generator that converts the energy from incoming waves into electricity.
The OTD can also be installed on existing breakwaters as demonstrated by [34]. These OTD offers the possibility to store the wave energy, discontinuous in its availability, in the form of relatively stable potential energy. Furthermore, the low head hydraulic turbines used for the energy conversion is a well-established, well-understood and efficient technology.
The biggest disadvantage of this technology is that the energy that can be extracted by the breakwater-integrated OTD device is relatively low from the commercial standpoint. Moreover, the geometry with only one ramp does not appear to be suitable for locations with relevant tidal variations. Seawave Slot-cone Generator (SSG) like systems having two or more ramps have shown to be more efficient regarding energy extraction [35] but, on the other hand, more difficult to handle in prototype-scale breakwaters [36].
A test campaign of an Overtopping BReakwater for Energy Conversion (OBREC) prototype device integrated in an existing rubble mound breakwater is currently ongoing in Italy [6]. This test campaign focus on the wave pressures acting on different parts of the structure, which are being collected during storm events. No information regarding the energy production from the OBREC device is available in literature to date.

3.1. Structural Response/Stability to Waves

The structural response to the wave loading on the breakwater-integrated OTD device has been investigated for many years using physical and numerical model testing. Physical model testing carried out on OTDs with one (OBREC type devices) or more (SSG like devices) ramps have shown that due to their complex geometry, the wave-structure interaction is not comparable to the one observed for traditional breakwaters. Several authors [7,37,38] have shown relevant differences between the forces measured in laboratory on the different parts of the OTD structures and those obtained based on traditional methods used in breakwater design [32]. The performance of a breakwater-integrated OTD has also been investigated by several authors (see e.g., [39,40,41,42]) using advanced Computational Fluid Dynamics (CFD) modelling, following which new approaches to evaluate the wave forces and pressure distribution on such innovative breakwaters have been proposed.

3.2. Hydraulic Performance
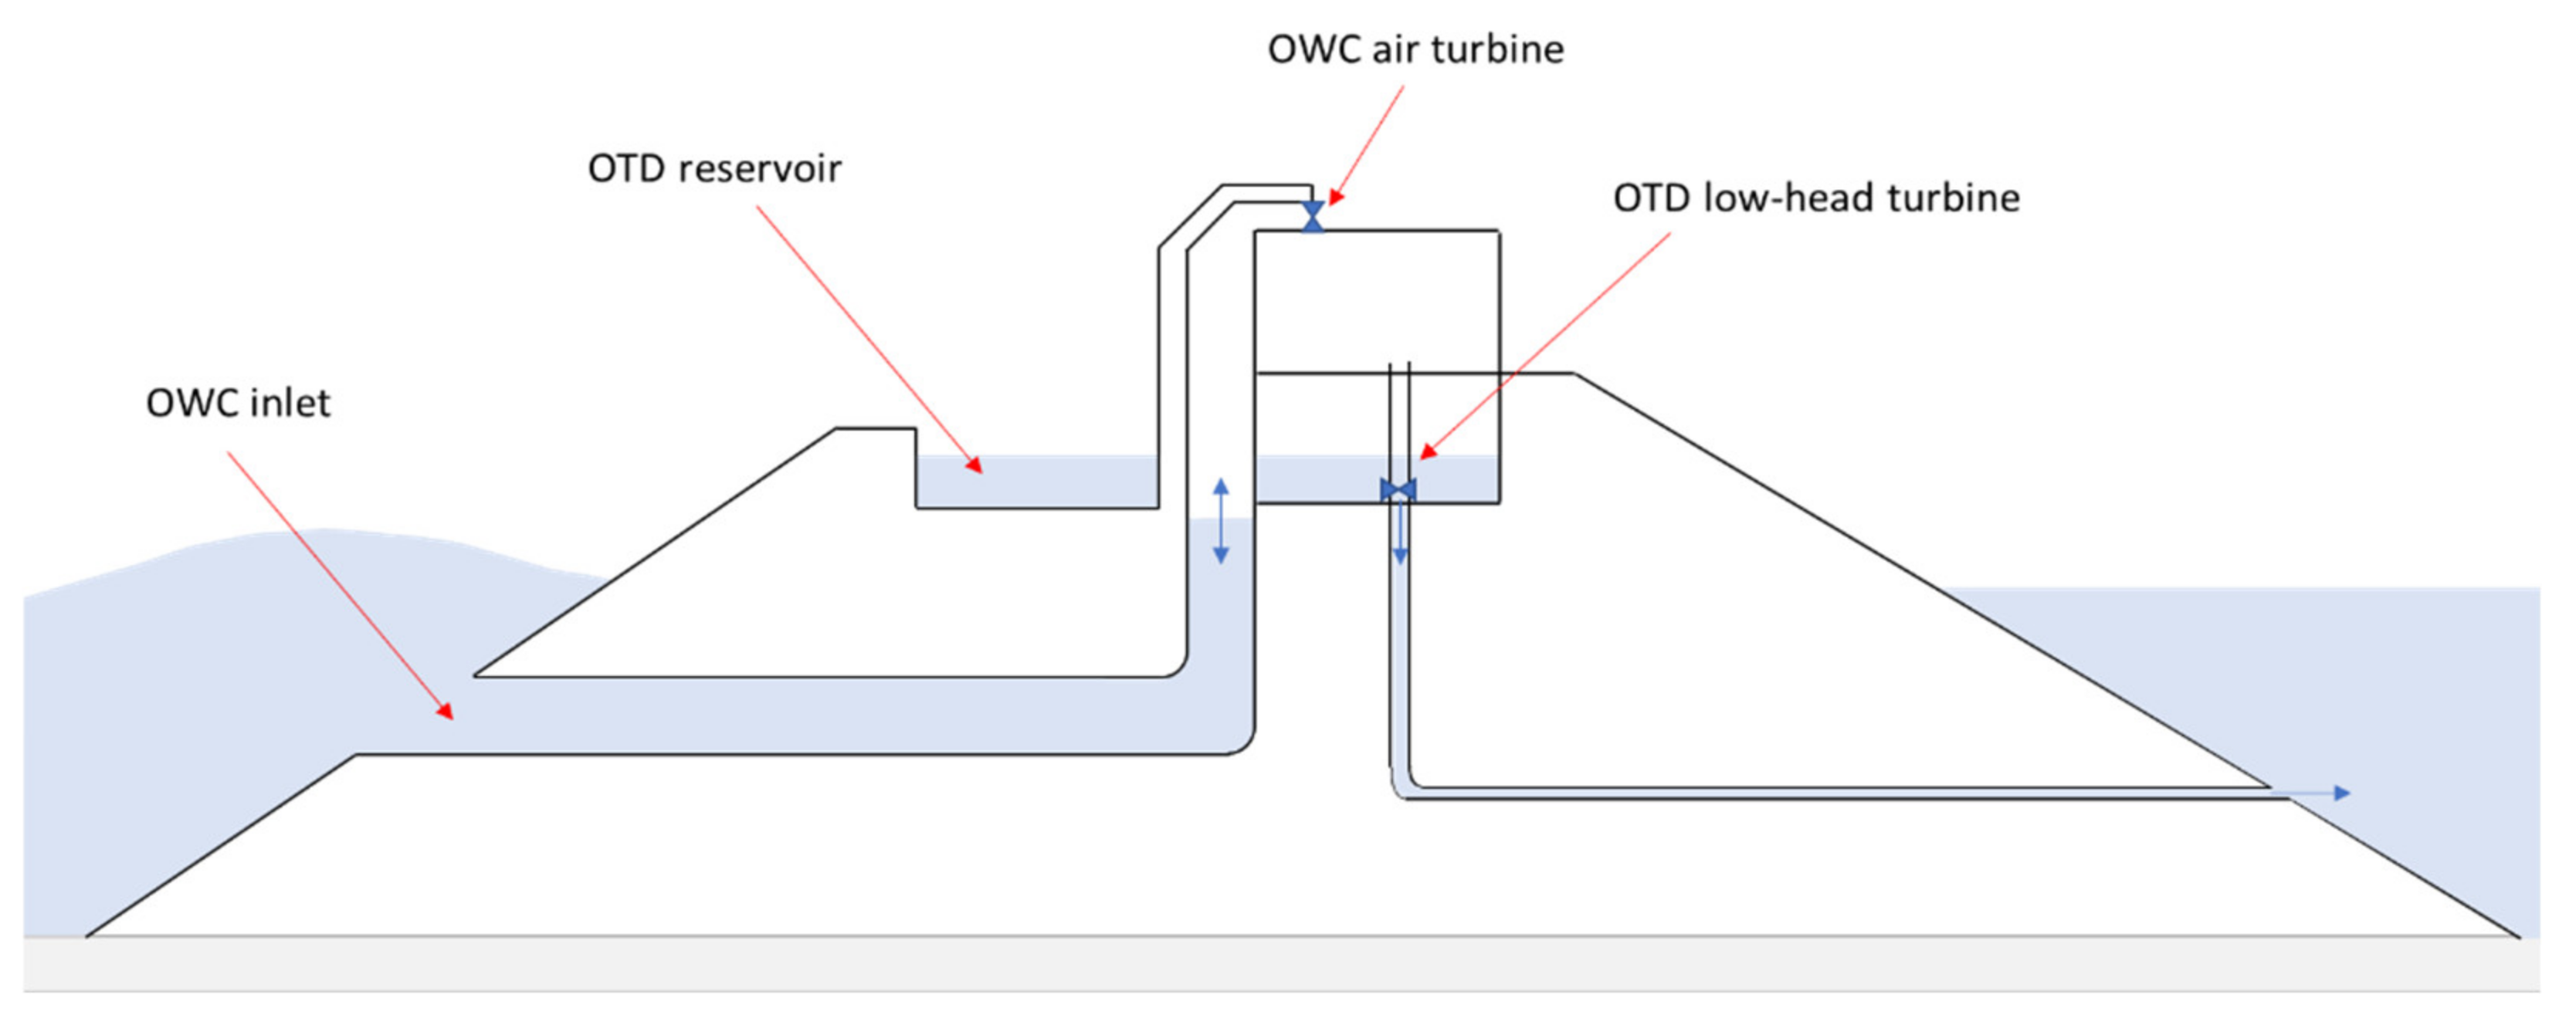
The hydraulic performance of breakwater-integrated OTDs has been also investigated with the use of physical and numerical model testing. Iuppa et al. [43] and Di Lauro et al. [40] demonstrated that the wave reflection and overtopping at the rear side of a breakwater-integrated OTD with one ramp cannot be evaluated directly considering the formulas proposed in the [43,44] for traditional harbour defence structures. In general, due to the wave dissipation on the ramp and reservoir, the reflection coefficient computed in front of the structure is lower than that computed in front of conventional vertical breakwaters.
Regarding the wave overtopping, results presented by Vicinanza et al. [7] showed that an OTD device integrated into rubble mound breakwaters leads to higher mean overtopping compared to the values measured on traditional breakwaters, due to the presence of a smooth frontal ramp. Contrarily, when the OTD device is integrated into vertical breakwaters, the presence of a setback wall generally reduces the wave overtopping when compared to the typical values observed on conventional caissons. Recently, Iuppa et al. [45] performed additional physical model testing on the OBREC aiming at providing reliable methods for evaluating the energy that can be extracted by said device. In particular, the tests aimed at investigating the probability distribution of the individual overtopping volumes entering the OBREC’s reservoir. Cavallaro et al. [46] proposed a numerical model based on the stochastic description of the wave overtopping phenomenon for the optimization of the OBREC device performance.
Specific formulas were presented by Iuppa et al. [43,45] for a rubble mound breakwater-integrated OTD and by Di Lauro et al. [41] for a vertical caisson breakwater-integrated OTD to estimate the reflection coefficient and the mean wave overtopping discharge at the rear side of such non-conventional breakwaters.

4. Hybridisation

As introduced earlier, the hybridisation of different WEC devices and its integration in harbour defence structures appears to be a promising approach to improve the overall efficiency and overcome some of the issues associated with the stand-alone OTD and OWC technologies. The hybridisation has the potential to realistically contribute to the development of WEC technologies in a way that they can compete on the market with more established renewable energy systems, such as wind or solar photovoltaic.
From the research carried out over the last few years on single WEC devices, it is clear that there is an opportunity for the combination of two (or more) WEC technologies into a single system, thus incorporating the advantages of each stand-alone WEC, whilst mitigating their inherent weaknesses. Cappietti et al. [47] presented an experimental study of a concept design of an original HWEC in which the energy is harvested by means of the combination of a frontal OWC and OTD integrated into a vertical caisson, showing that the combination of technologies generally leads to an improved overall efficiency.
The hybridisation is, obviously, not without its challenges. The design of WEC devices integrated in breakwaters is mostly based on several assumptions, which are device specific and cannot be directly extrapolated from one device to another. Assumptions are generally a function of the characteristics of one device and may not necessarily hold true for the hybrid solution. On the other hand, harbour defence structures must accommodate different concepts, which adds complexity in terms of the geometry and integration into the breakwater.
Within the SE@PORTS project, existing WEC devices were assessed on their suitability to be hybridised and integrated in vertical and rubble mound breakwaters (see e.g., [11,12,48]). Several variables/parameters were considered while comparing different preliminary hybrid concepts in multi-criteria analysis: cost-effectiveness; constructability; WEC level of maturity; scalability/modularity; maintenance; reliability; and innovation.
As a result, an innovative HWEC concept combining two well-established principles in harnessing wave energy (OTD + OWC) was designed having as prototypes for the breakwaters and environmental conditions, the ports of Leixões (Portugal) and las Palmas (Spain). These two locations were selected as prototype case studies for several reasons. Firstly, these harbours are protected by breakwaters with a good exposure to incident waves, with maximum significant wave heights that can be higher than 8 m. On the other hand, these harbour facilities have high electricity demands that can be, at least partially, ensured by the harnessed wave energy. Finally, the combination between the local environmental conditions and distinct characteristics of the breakwaters—rubble mound in the case of Leixões and vertical in the case of Las Palmas—make them representative of very many structures protecting EU harbours.
The devised HWEC enables to exploit the strengths of each stand-alone technology and help overcome individual limitations and weaknesses, while presenting a breakthrough and efficient approach to harness wave energy in ports; one that can contribute to increase the capacity for greening the ports.

5. Proof of Concept of the Breakwater-Integrated HWEC

A scheme of the developed HWEC when integrated into a rubble mound breakwater is shown in Figure 3.
In this design, the reservoir of the OTD device is located in front of the OWC chamber. In the OTD device, the water that overtops the reservoir crest produces electricity by passing through low head turbines coupled with generators located in a machinery room placed at the rear side of the breakwater. The water passing through the turbines is then discharged behind the structure and below the still water level via a rear duct. The OWC inlet is located in front of the structure well below the still water level. The oscillation of the water that enters into the OWC chamber drives an air turbine located at the top, as depicted in Figure 3.
From the combined WEC devices, it is possible to harness wave energy over a wider range of metocean conditions using two different yet complementary technologies.
The geometrical optimisation of the innovative HWEC when integrated into a rubble mound or a vertical breakwater and its assessment with respect to its hydraulic and energy performances, were studied through a composite modelling approach [49]. Composite Modelling, defined as ‘the integrated and balanced use of physical and numerical models’ [49], is the most advanced approach to study complex problems in marine engineering and design, because it exploits the strengths and overcomes the weaknesses of each approach thereby reducing uncertainties, and therefore is the most suitable to study the breakwater-integrated HWEC.

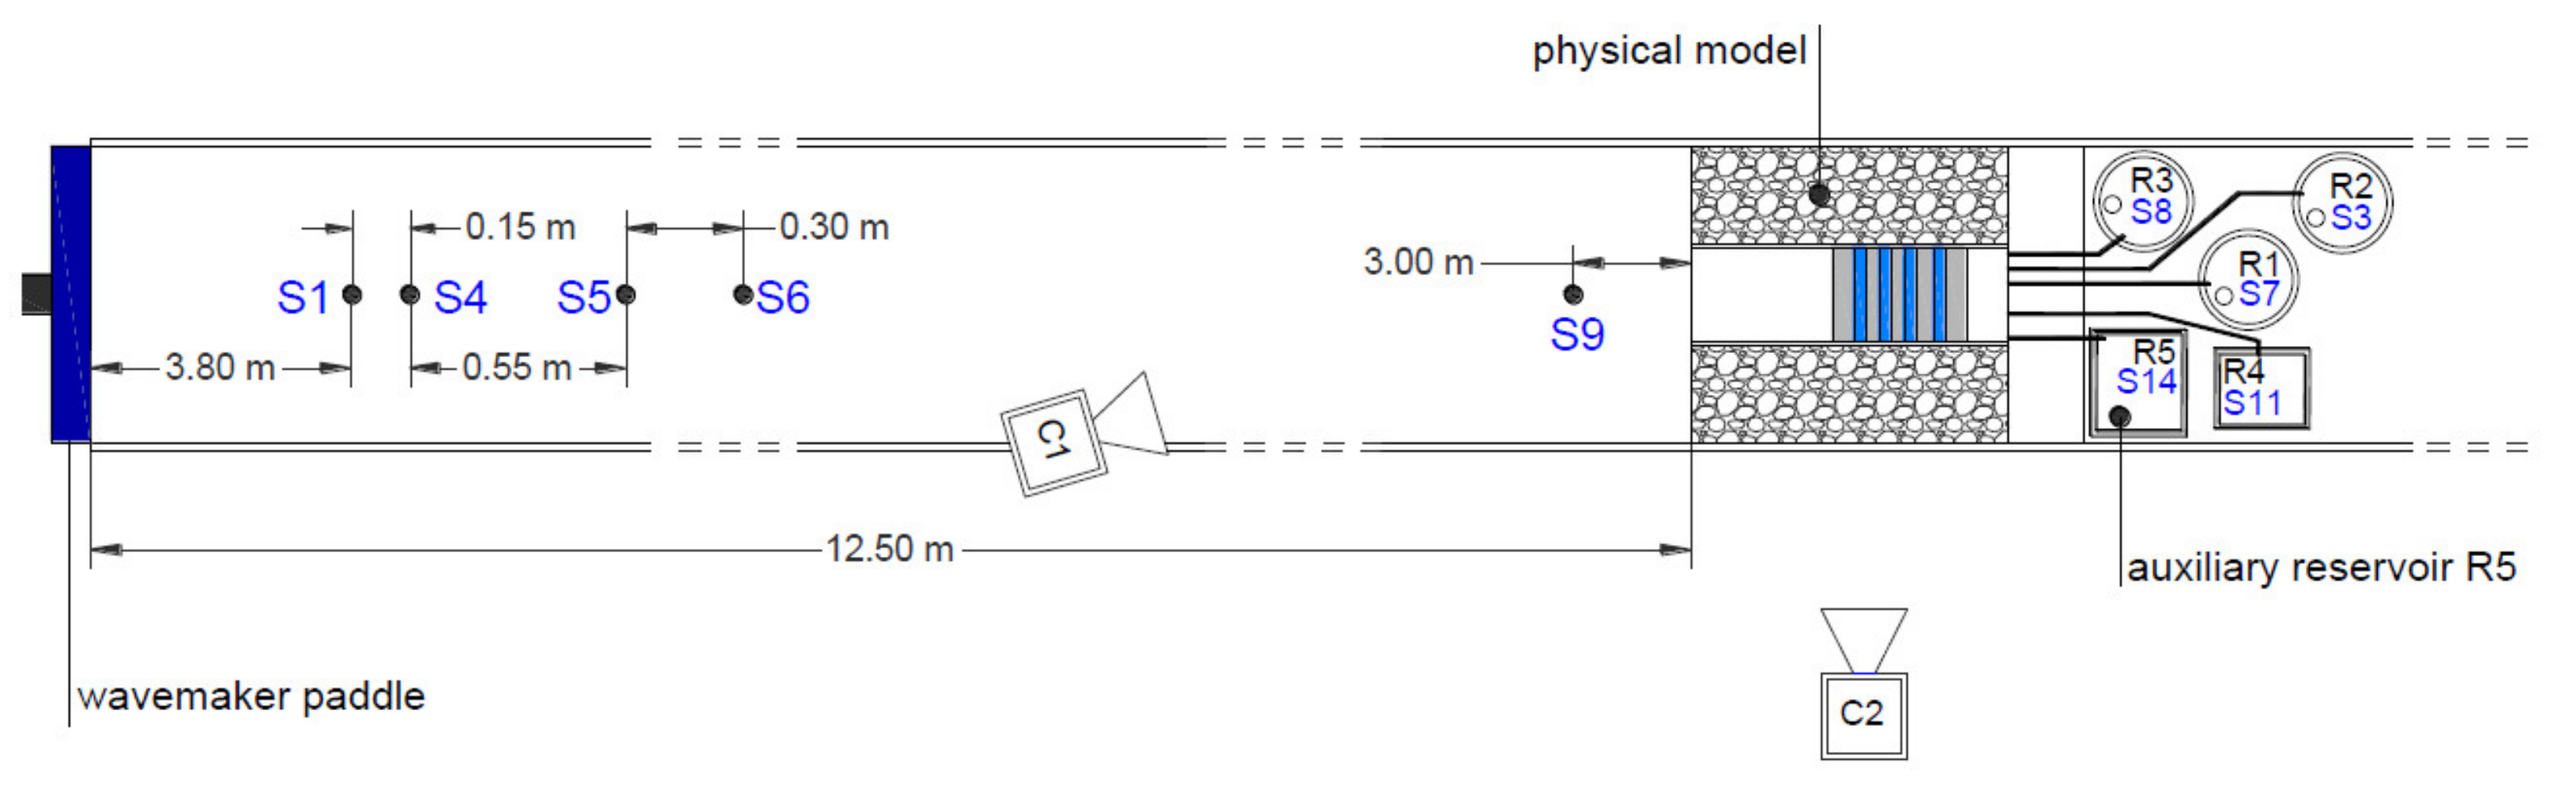
5.1. Physical Model Testing

Rosa-Santos et al. [12] investigated the influence of the integration of a HWEC module (OWC + OTD with 4 reservoirs) on the structural response/stability and hydraulic performance on the rubble-mound cross-section proposed for the extension of the north breakwater of the Port of Leixões in Portugal. Experimental tests of the hybrid device were performed on a geometrical scale of 1:50 in the wave basin of the Faculty of Engineering of the University of Porto (FEUP) in Portugal, using both regular and irregular waves. This wave basin is equipped with a multi-element wave generation system from HR Wallingford. Wave reflections were minimised by a dynamic reflection absorption system integrated in the wavemaker [50]. The duration of the tests was long enough to contain around 100 waves for regular wave tests and around 1000 waves for tests with irregular sea state [12].
At an early stage, experimental testing under regular wave conditions was carried out to investigate three geometries (A, B and C) with different OWC inlet configurations and identify the most efficient among those. The study focused on the evaluation of the wave reflection from the structure, scour development and toe stability, and average wave overtopping discharge over the crest of the innovative structure. Preliminary results by Rosa-Santos et al. [12] highlighted the hydraulic performance of the HWEC integrated into the rubble-mound breakwater. The authors showed that wave reflection was not significantly affected by the integration of the HWEC module, for which values of the reflection coefficient around 0.35 were found. Furthermore, the presence of the HWEC leads to a reduction of the transmitted wave by overtopping at the rear side of the structure compared to the conventional cross-section, thus improving the functional performance of the breakwater. The experimental tests also indicate that the integration of the HWEC in the rubble-mound breakwater does not significantly affect the stability of the toe berm and does not contribute to the further development of scour in front of the structure. Overall, these preliminary results indicate that the integration of the HWEC in rubble-mound breakwaters can be a promising solution, as it does not seem to compromise its stability nor functionality as a harbour defence structure.
The structural response/stability and hydraulic performance of the vertical caisson breakwater-integrated HWEC was tested in model scale in the wave flume of the University of Cantabria [48] with an optimised geometry suitable to be integrated in the Nelson Mandela breakwater at Port of Las Palmas in Spain. Different configurations of this innovative structure were tested with detailed evaluations of the operational performance of the combined devices under mild conditions, as well as calculations of the wave forces on the structure for the stability and functionality assessment of the breakwater under extreme conditions. Preliminary results by Lara et al. [47] indicate that the combination of a one reservoir OTD with a OWC reduces the reflection coefficient to a value up to 0.3 for the cases where the wave period coincides with the resonant period of the OWC due to the large amount of water flowing inside the OWC chamber. This result represents a remarkable improvement of the innovative breakwater compared to vertical caisson breakwaters, as the typical values of the reflection coefficient for these are around 0.9 [32]. Therefore, the study by Lara et al. [48] suggests that the HWEC integration can improve the hydraulic performance of the breakwater, reducing thereby e.g., problems for navigation caused by reflected waves.
The performance of the HWEC in terms of energy production have been presented by Cabral et al. [50,51] by analysing the data of the experimental tests of the three different alternative HWEC geometries (A, B and C) when integrated in a rubble mound breakwater constructed to a 1:50 geometrical scale. As mentioned earlier, the only difference between these geometries was the design of the OWC chamber inlet. The authors analysed the hydraulic efficiency, i.e., the ratio between the average power absorbed by the device and the average power of the incident waves in front of the structure, of the HWEC device and the stand-alone OTD and OWC devices installed into the breakwater for each of the three alternatives. The analysis showed that the combination of the OTD with the OWC leads to higher hydraulic efficiencies than those typically reported in the literature for the independent components, for a broader range of hydrodynamic conditions, reaching a maximum overall hydraulic efficiency of around 40% for geometries B and C [50,51]. Due to the combination of different WEC systems, the overall performance is improved since the two selected technologies complement each other well, thus extending the range of wave conditions where the efficiency is high. In detail, the multiple reservoir OTD was shown to be efficient for the lower wave periods, while the opposite occurs for the OWC system for all three alternatives (A, B and C). Consequently, the range of hydrodynamic conditions—i.e., waves and tidal levels—for which the device’s power production is low was reduced. This is an important advantage of the HWEC device because it allows a more constant power production with a significant reduction of the power production peaks, which is usually difficult to obtain in the renewable energy sector.

5.2. Numerical Modelling
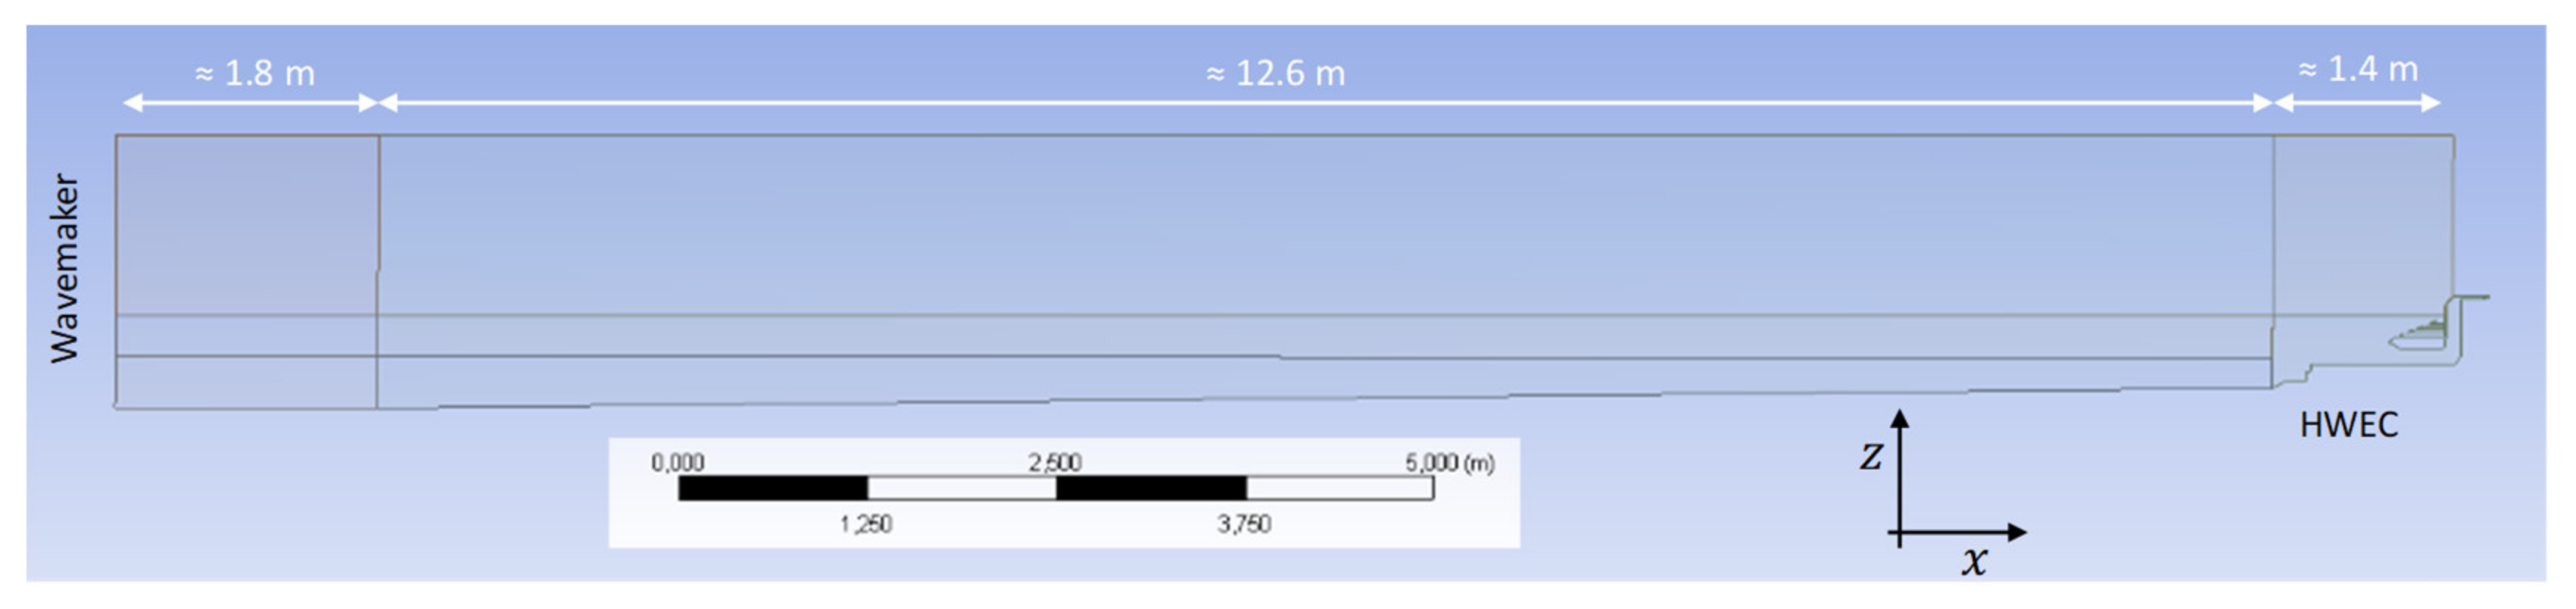
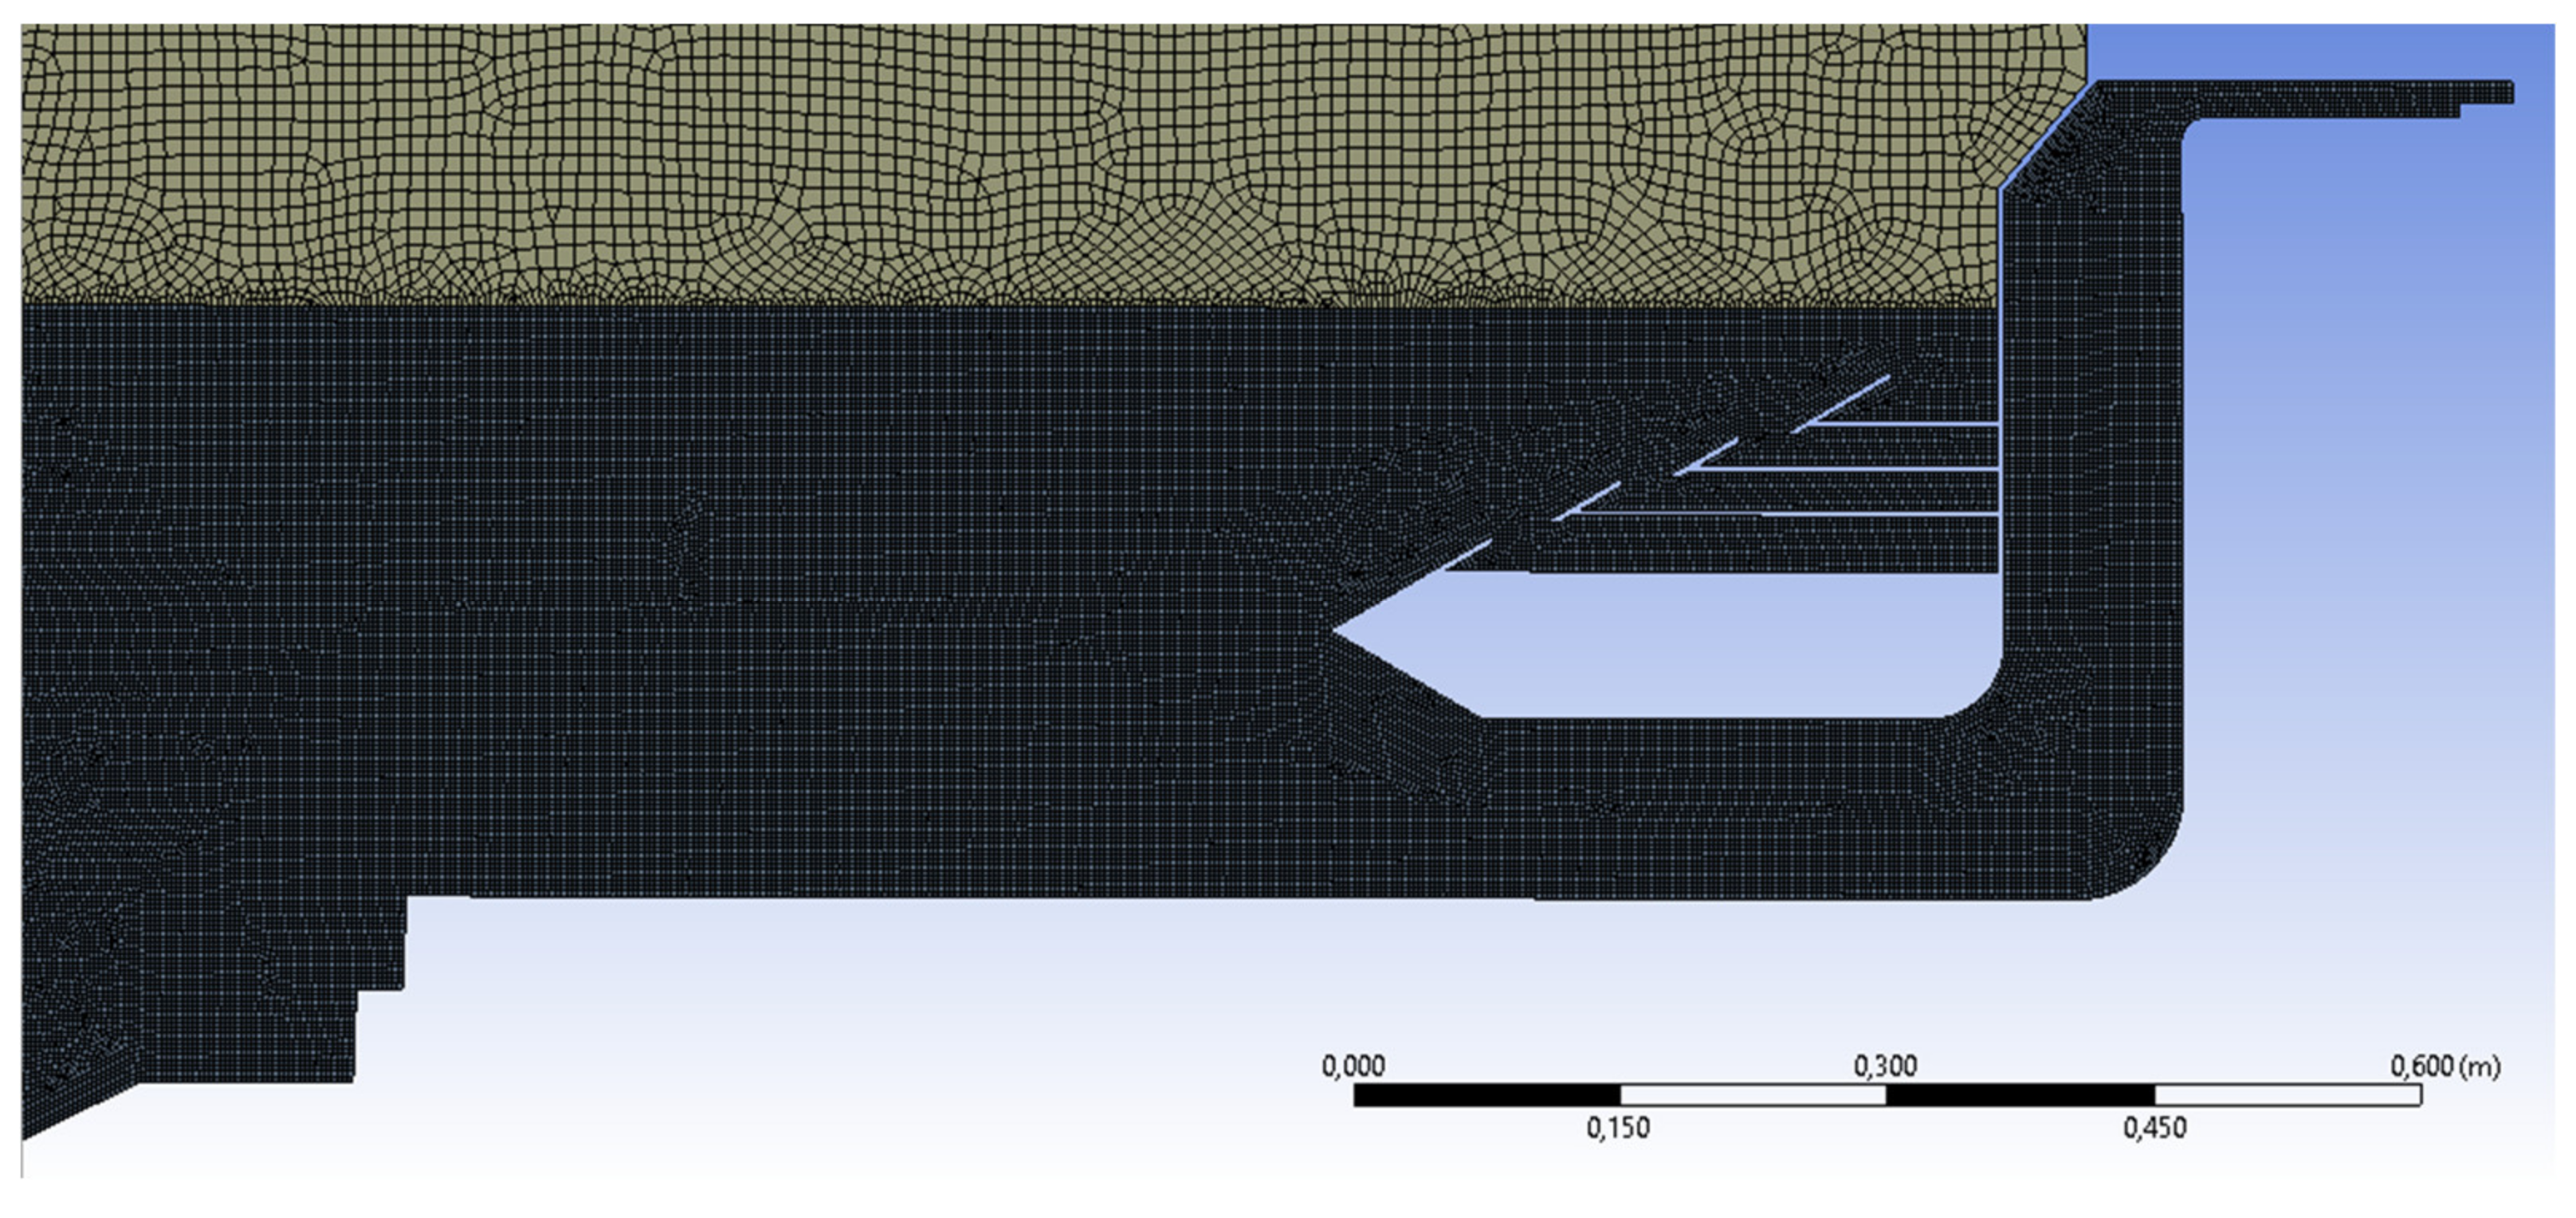
In parallel with the physical model testing conducted in the wave basin at FEUP (see e.g., [12,50,51], two-dimensional numerical modelling using ANSYS Fluent CFD model [52] has been performed as well for identifying the most efficient HWEC geometry and then using it for performing additional tests under various wave and water level conditions.
The geometry of the numerical model consisted of a wave flume, a breakwater, and the integrated HWEC device selected according to the physical model tests conducted in Portugal. Firstly, the model was validated with the preliminary data of the experimental tests assuming a specific geometry for the HWEC (Geometry B). Then, Geometry B was compared numerically with the alternative Geometry C from which the most efficient geometry was identified, thereby confirming the outcome of the experimental study. Finally, the most efficient geometry was adopted to examine more sea state conditions that were not tested in the laboratory. The numerical analysis focused on the evaluation of: (a) the free surface elevation in various locations along the wave flume and at the breakwater toe; (b) the water level oscillations and the amplification coefficient inside the OWC chamber; and (c) the wave overtopping discharges in the OTD multiple reservoirs.
Said parameters were perceived as being the most relevant to investigate the performance of the innovative HWEC device during this proof of concept stage. In the future, additional simulations will be performed involving three-dimensional models of the breakwater-integrated HWEC for further evaluation of its structural response/stability and hydraulic performance and the performance of the HWEC in harvesting wave energy, as well as to determine specific and more detailed parameters necessary in the design of the turbines.

5.2.1. Model Set-Up

As already mentioned, a two-dimensional numerical model was implemented using the commercial software ANSYS Fluent. For the simulations, the two-dimensional Reynolds-Averaged Navier-Stokes (RANS) equations for incompressible flow were employed, while for turbulence closure the shear-stress transport (SST) k-ω turbulence model was chosen. For the free surface elevation tracking the Volume of Fluid (VOF) method was used. The VOF formulation is based on the assumption that two or more fluids are immiscible. In open-channel flow (as is the case being tested), the governing equations across the water–air interface are expressed as a single fluid whose physical properties are defined by the volume fraction weighted average of the corresponding physical properties of air and water, i.e., for density ρ = α ρwater + (1 − α) ρair, where α is the water volume fraction. In a finite volume method (ANSYS Fluent), α is defined in each computational cell as α = δVwater/δVcell, where δVcell is the volume of the computational cell and δVwater is the volume of water in the cell. Therefore, α = 1 if the cell is full of water, α = 0 if the cell is full of air or 0 < α < 1 if the cell contains the water–air interface, respectively.
The model was set-up to replicate exactly the mid-transverse cross section of the wave flume geometry and HWEC designed and tested in the laboratory (see e.g., [50,51]). As already mentioned, one geometry of the HWEC (Geometry B from Cabral et al. [50]) was used for validation purposes.
The numerical domain was 15.80 m long and 1.82 m high (Figure 4). The water level in the numerical domain was kept constant for all the validation tests, with a water depth of 0.488 m at the left boundary of the domain (offshore). This water depth represents the value of the Mean Water Level (MWL) at the port of Leixões Port, constructed to a 1:50 geometrical scale.
The numerical domain was divided into several sections having different mesh resolutions: three different zones in the longitudinal direction and two to three zones in the vertical direction as indicated in Figure 4. The three different regions in the longitudinal direction were: the region close to the wavemaker (around 1.8 m long), the central region covering the main channel region (around 12.6 m in length) and the one around the HWEC model (around 1.4 m long). The vertical levels corresponding to the water region on the bottom (around 0.46 m high), the region near the free surface (around 0.16 m high) and the air region on the top (around 1.2 m high). The final height of the air region was selected after following a trial and error approach until the top boundary stops affecting the results in the water region.
The computational grid had a non-uniform size. From a sensitivity analysis on the mesh resolution, it was decided that the mesh size in the region near the free surface and close to the HWEC device was where the highest resolution was needed. The mesh size in this region was 0.003 m. For the top region (air region) a lower resolution was set with mesh sizes varying from 0.003 m to 0.036 m. The other regions of the numerical wave flume were set with mesh sizes varying from 0.003 m to 0.018 m. The refined mesh generated around the area of the HWEC is shown Figure 5. The entire mesh contained around 750,000 elements and its overall quality was controlled by keeping the maximum skewness below 0.8.
The HWEC device consists of an OTD device with four reservoirs (Figure 6). The crest heights of the reservoirs were set at 0.015 m, 0.040 m, 0.065 m and 0.100 m (model scale) from the bottom reservoir (R1) to the top one (R4), respectively. An angle of 30° relative to the horizontal was chosen for the ramps of the OTD device, aiming at not only ensuring the occurrence of slightly breaking surging waves, which produce low energy dissipation [10], but also approximately preserving the original slope of the breakwater extension of the Port of Leixões (Portugal), equal to circa 27°. Note here that the geometry of the ramps, reservoirs, and OWC chambers tested with the CFD is the same as the Geometry B tested in laboratory by Cabral et al. [50].
In the numerical model, the following discretization schemes were utilised: Pressure Staggering Option (PRESTO) for pressure; Second Order Upwind for momentum; Compressive for the VOF implementation; First Order Upwind for turbulent kinetic energy k; and specific dissipation rate ω and Least Squares Cell Based for the Gradients. The Semi- Implicit Method for Pressure Linked Equations (SIMPLE) scheme was utilised for the velocity–pressure coupling. For the transient discretization a Second Order Implicit scheme was used. The time step in all simulations, which was constant and equal to 6.25 × 10⁻³ s, was selected so that the CFL (Courant-Friedrichs-Lewy) criterion was always satisfied.
In order for the numerical model to reproduce the wave field measured in the laboratory and the HWEC-wave interaction, several boundary conditions were considered:
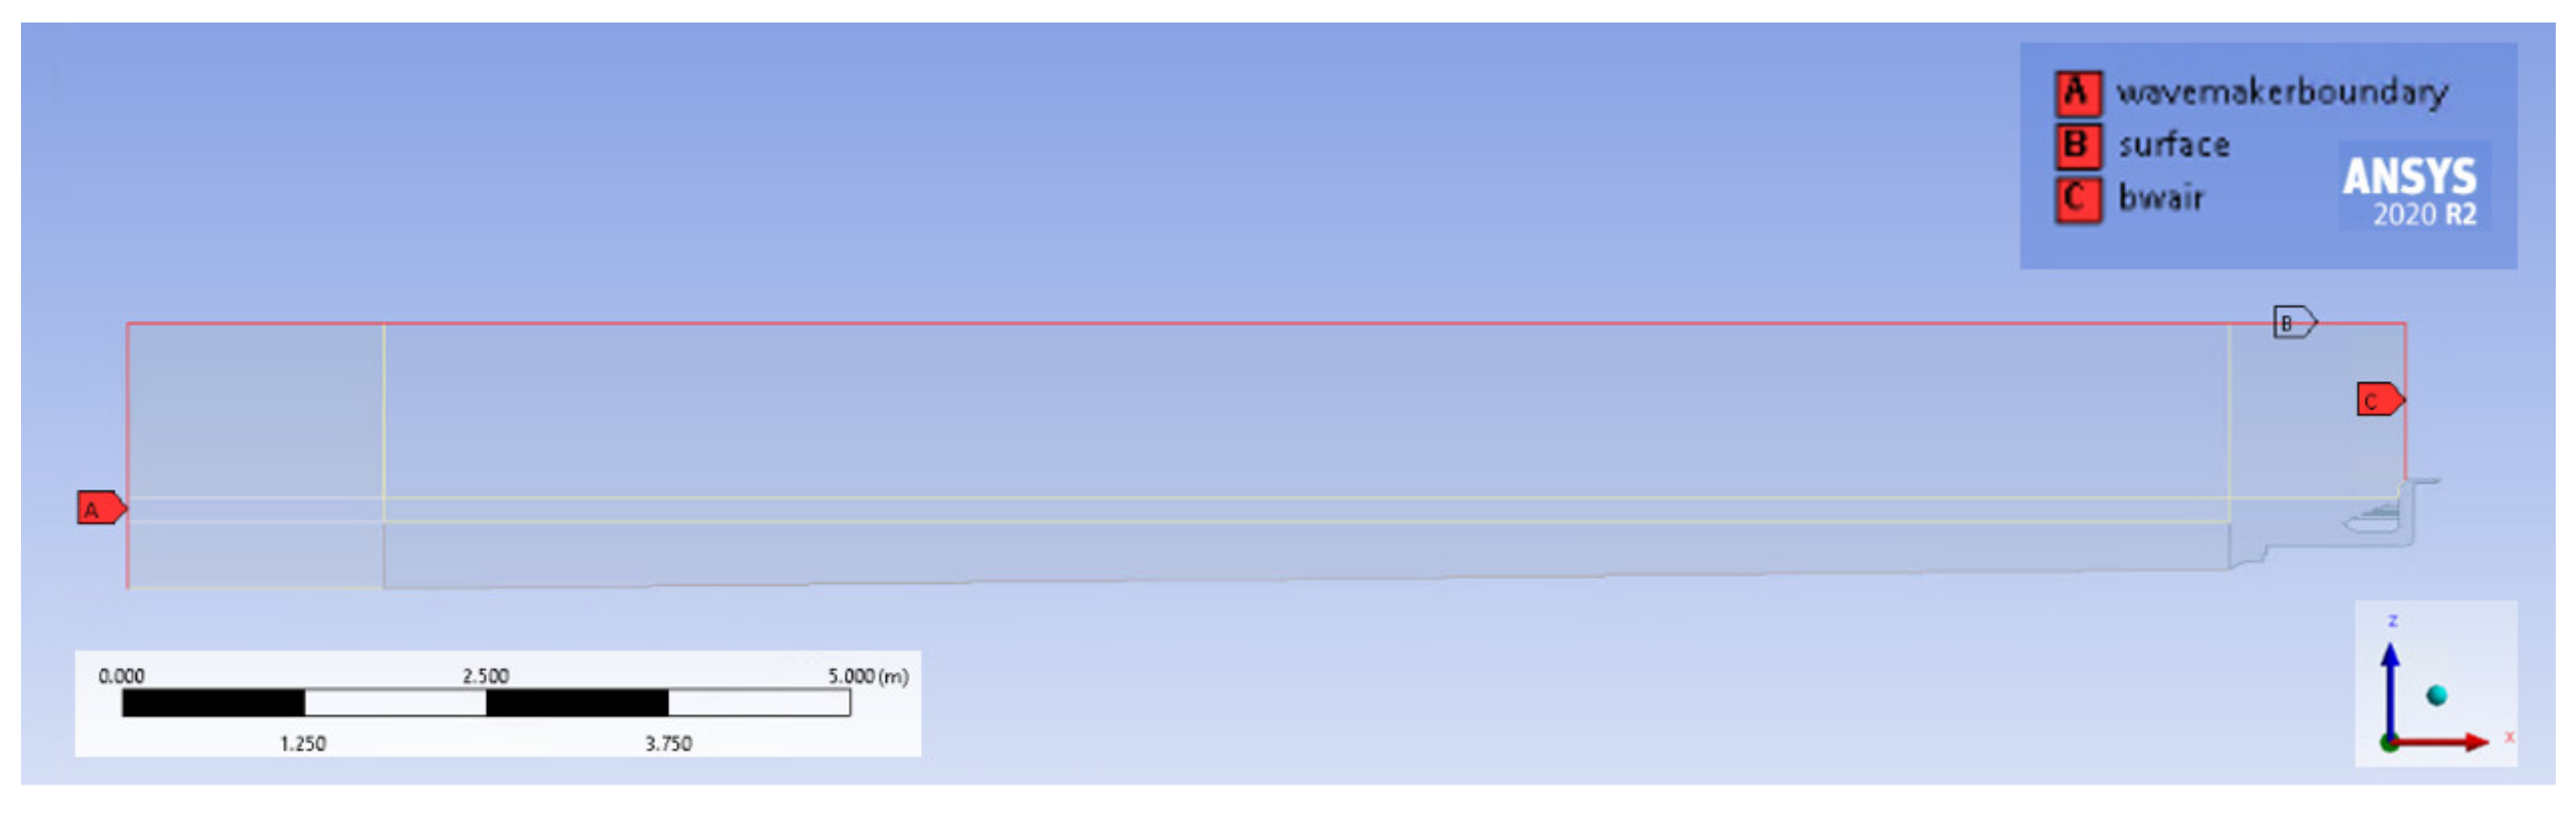
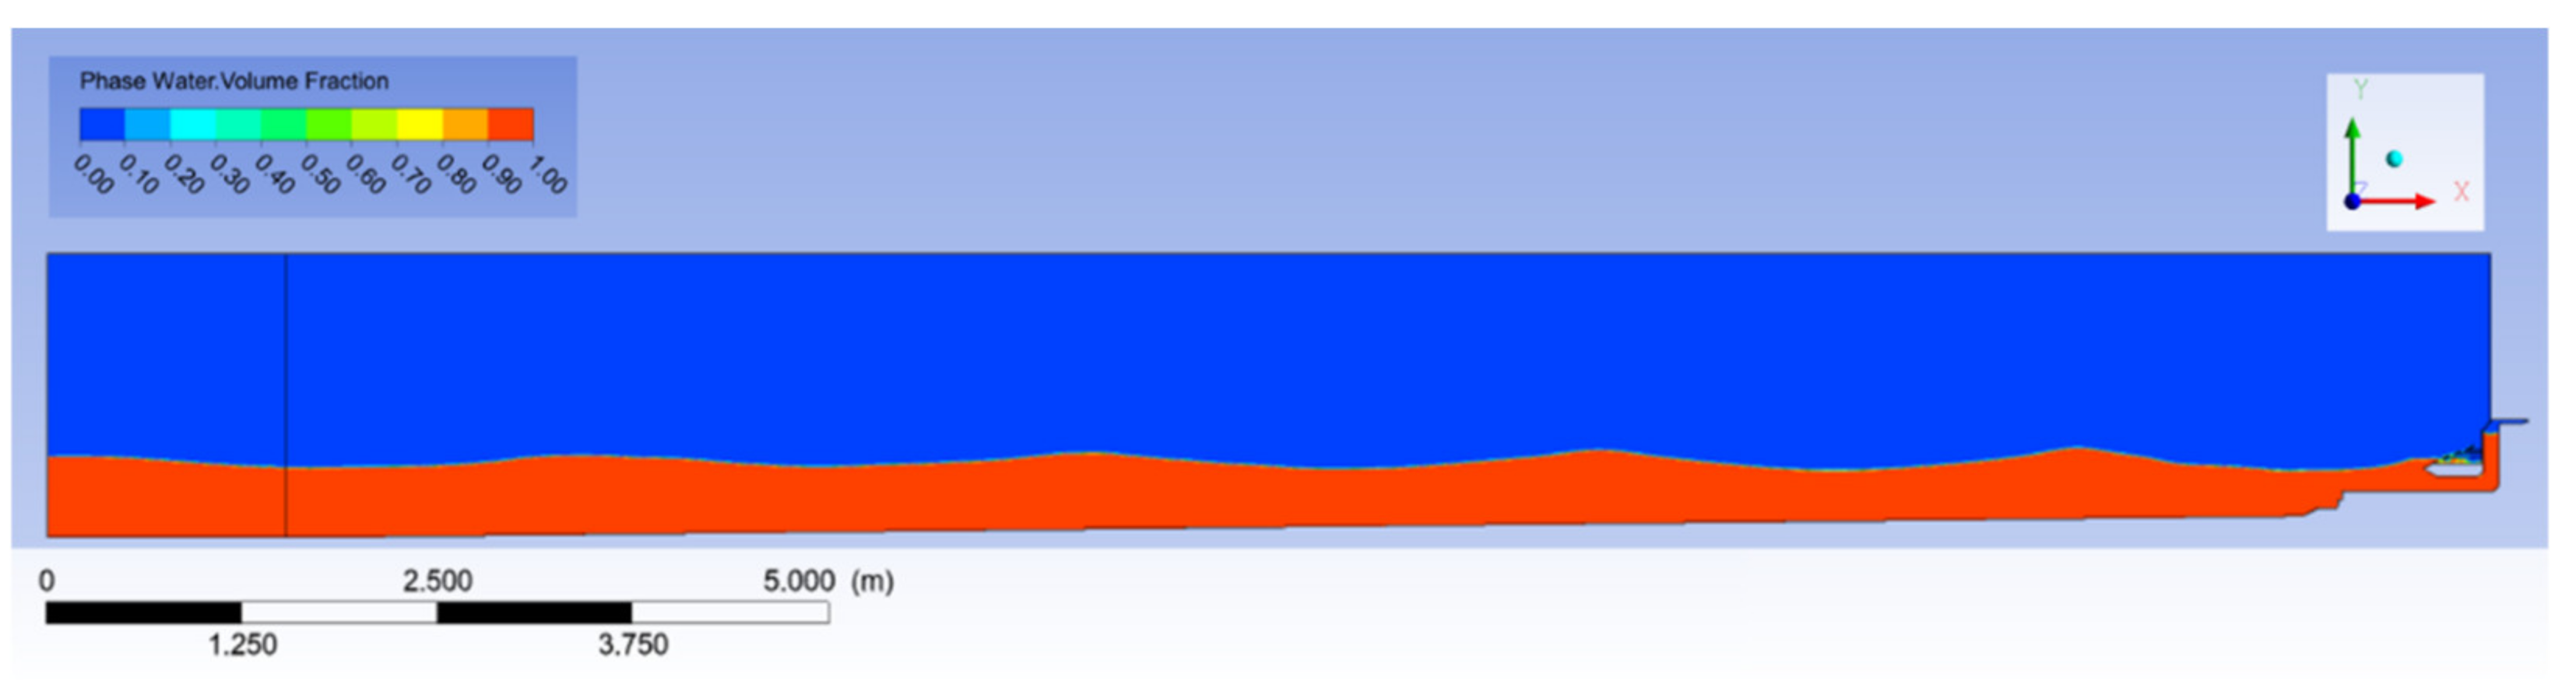
  • In the laboratory a piston-type wavemaker with an active absorption system was used at the offshore boundary of the wave tank for the generation of various regular and irregular wave conditions. Likewise, in the numerical model a moving wall at the left offshore boundary of the computational domain was implemented to replicate the exact wavemaker motion measured during the experimental tests. Thus, regular and irregular wave time series were generated in FLUENT using the corresponding wave paddle motion measured in the laboratory. This movement was transferred to the model using the measured wave paddle position over time, X(t), and the associated velocity, V(t). This procedure allows replicating wave-by-wave conditions tested in the laboratory (see A in Figure 7).
  • Symmetry for the top boundary of the domain (see B in Figure 7) since it has been confirmed that the length of the air region above the water is big enough so not to affect the results in the water region.
  • A pressure outlet for the boundary in the air phase just above the HWEC device (see C in Figure 7).
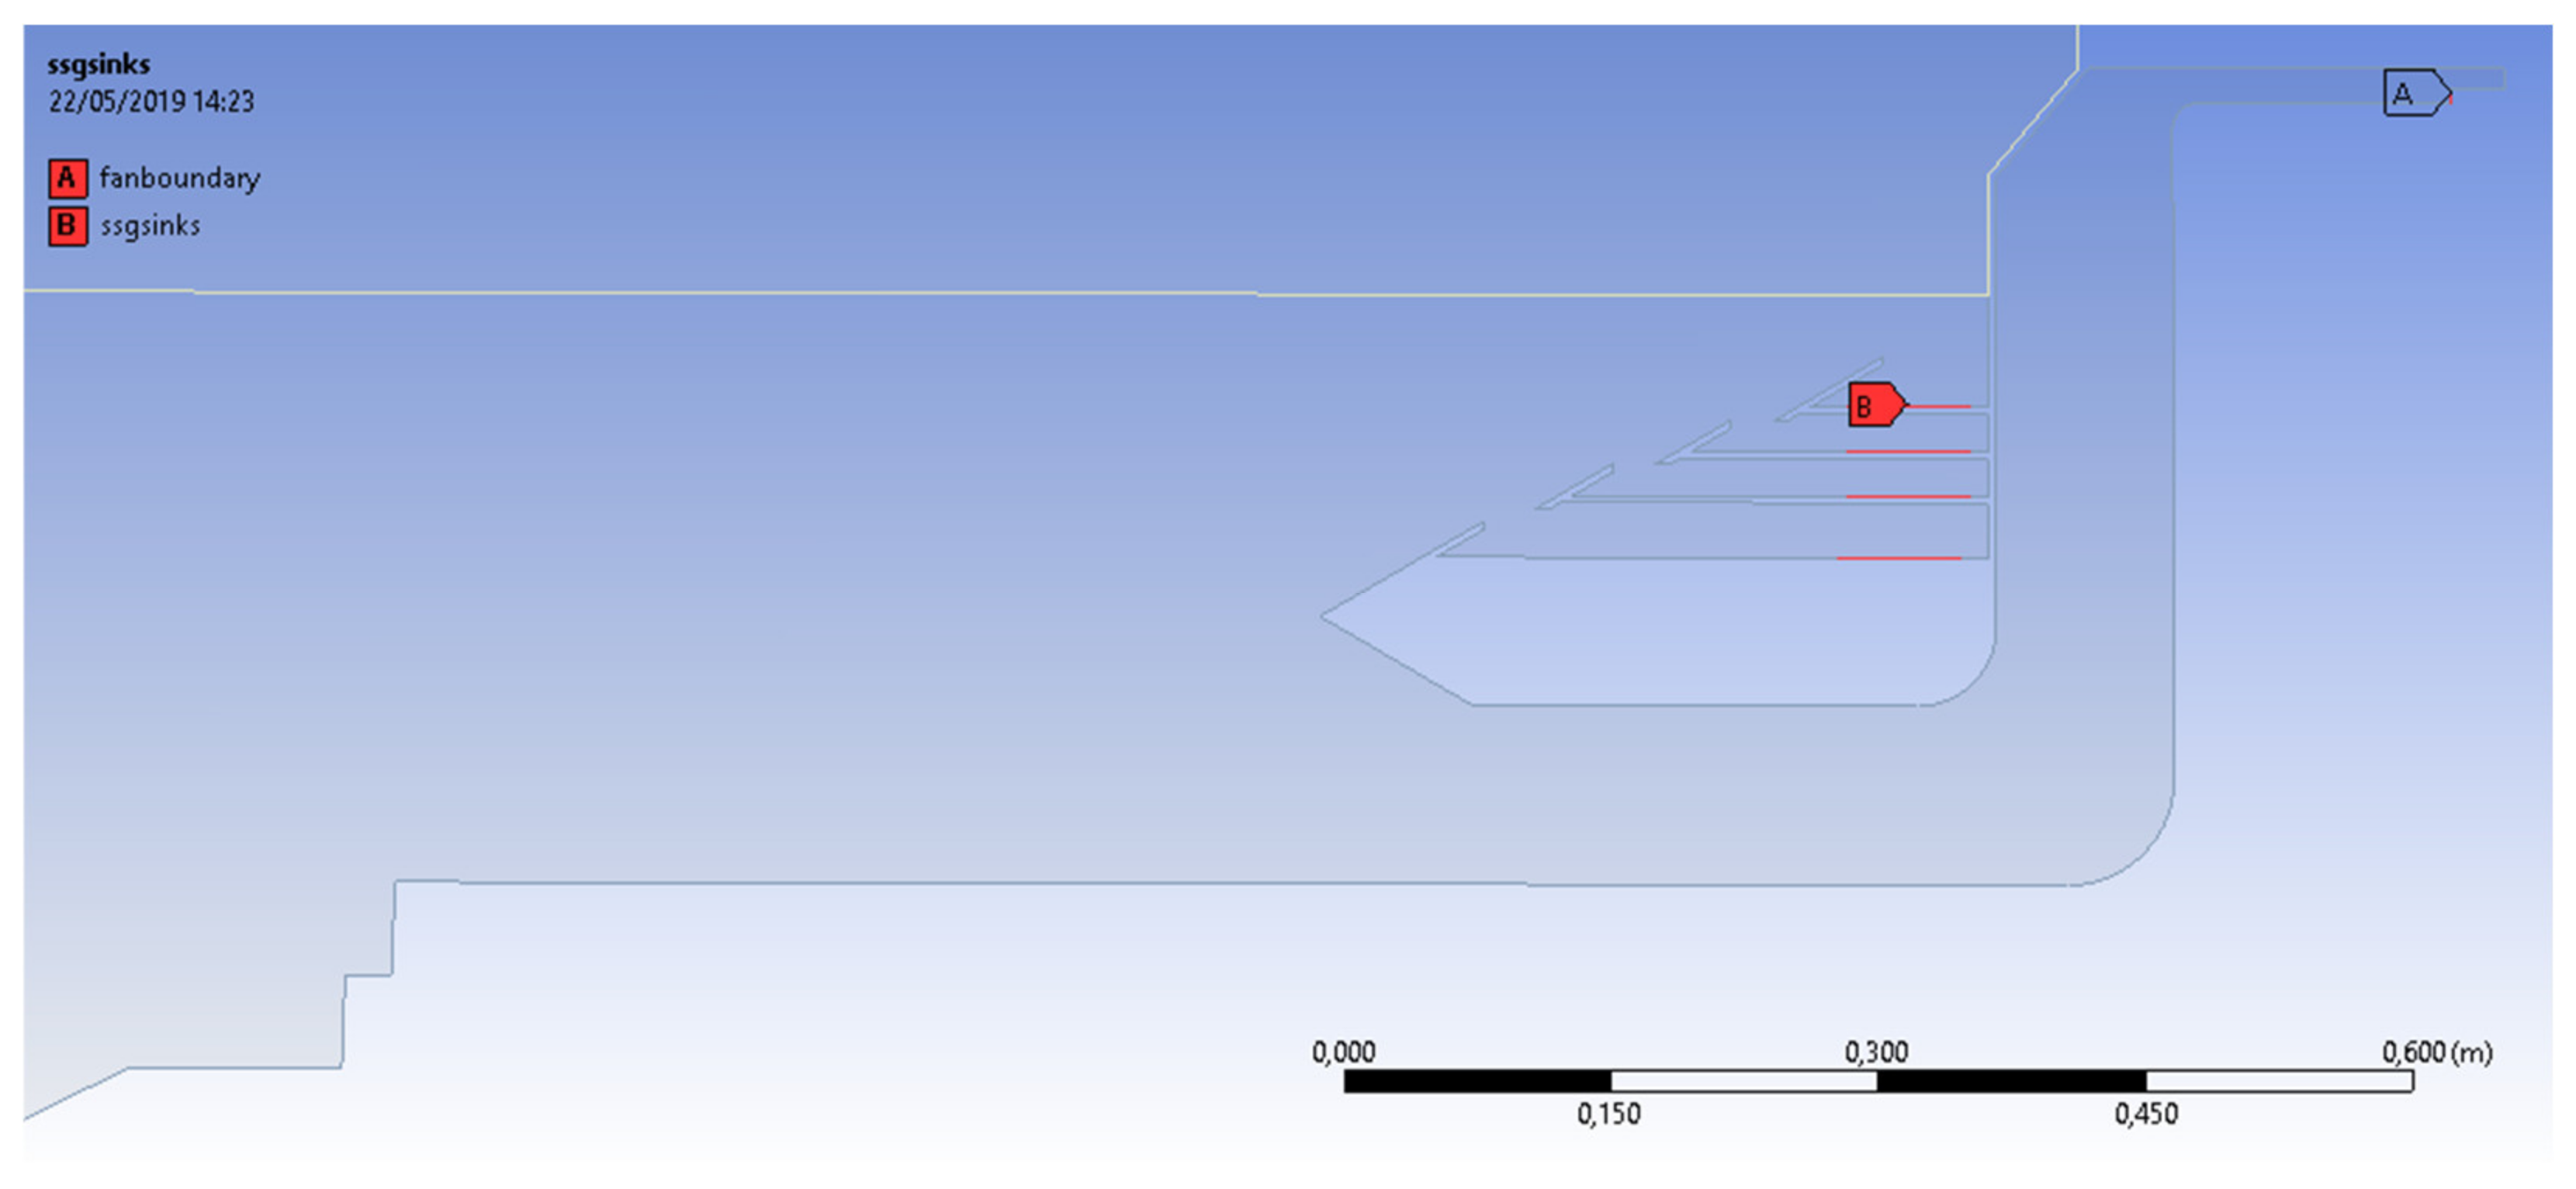
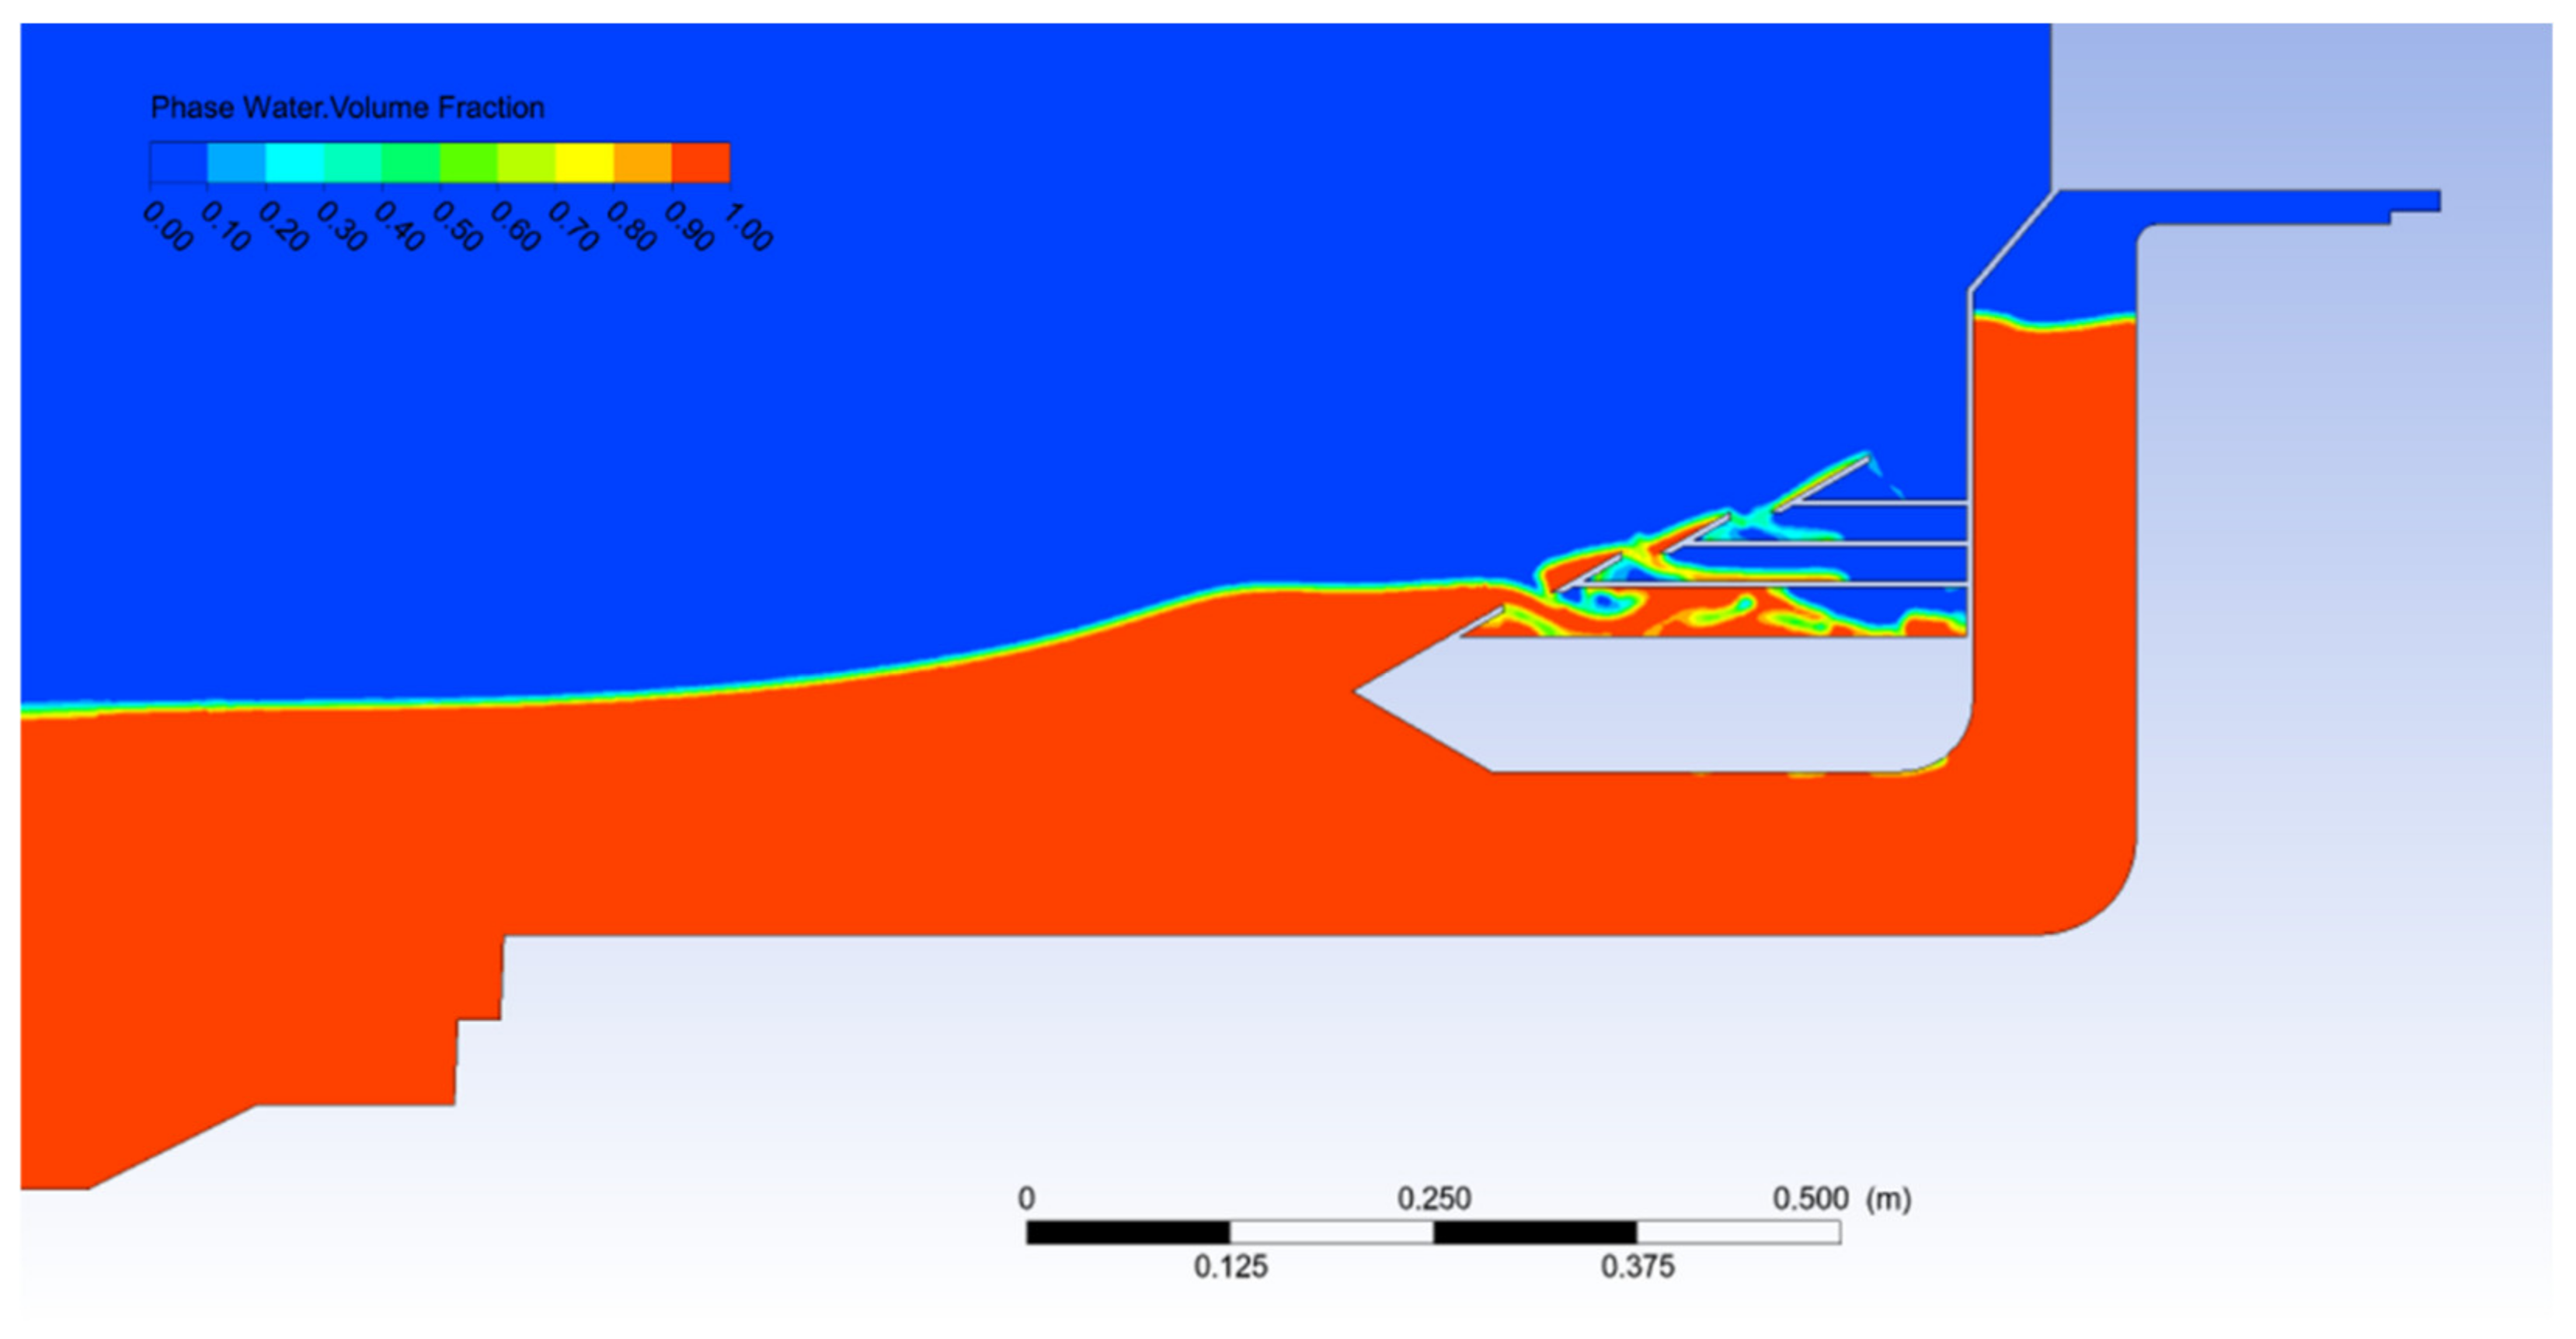
  • A fan boundary condition for the OWC (see A in Figure 8).
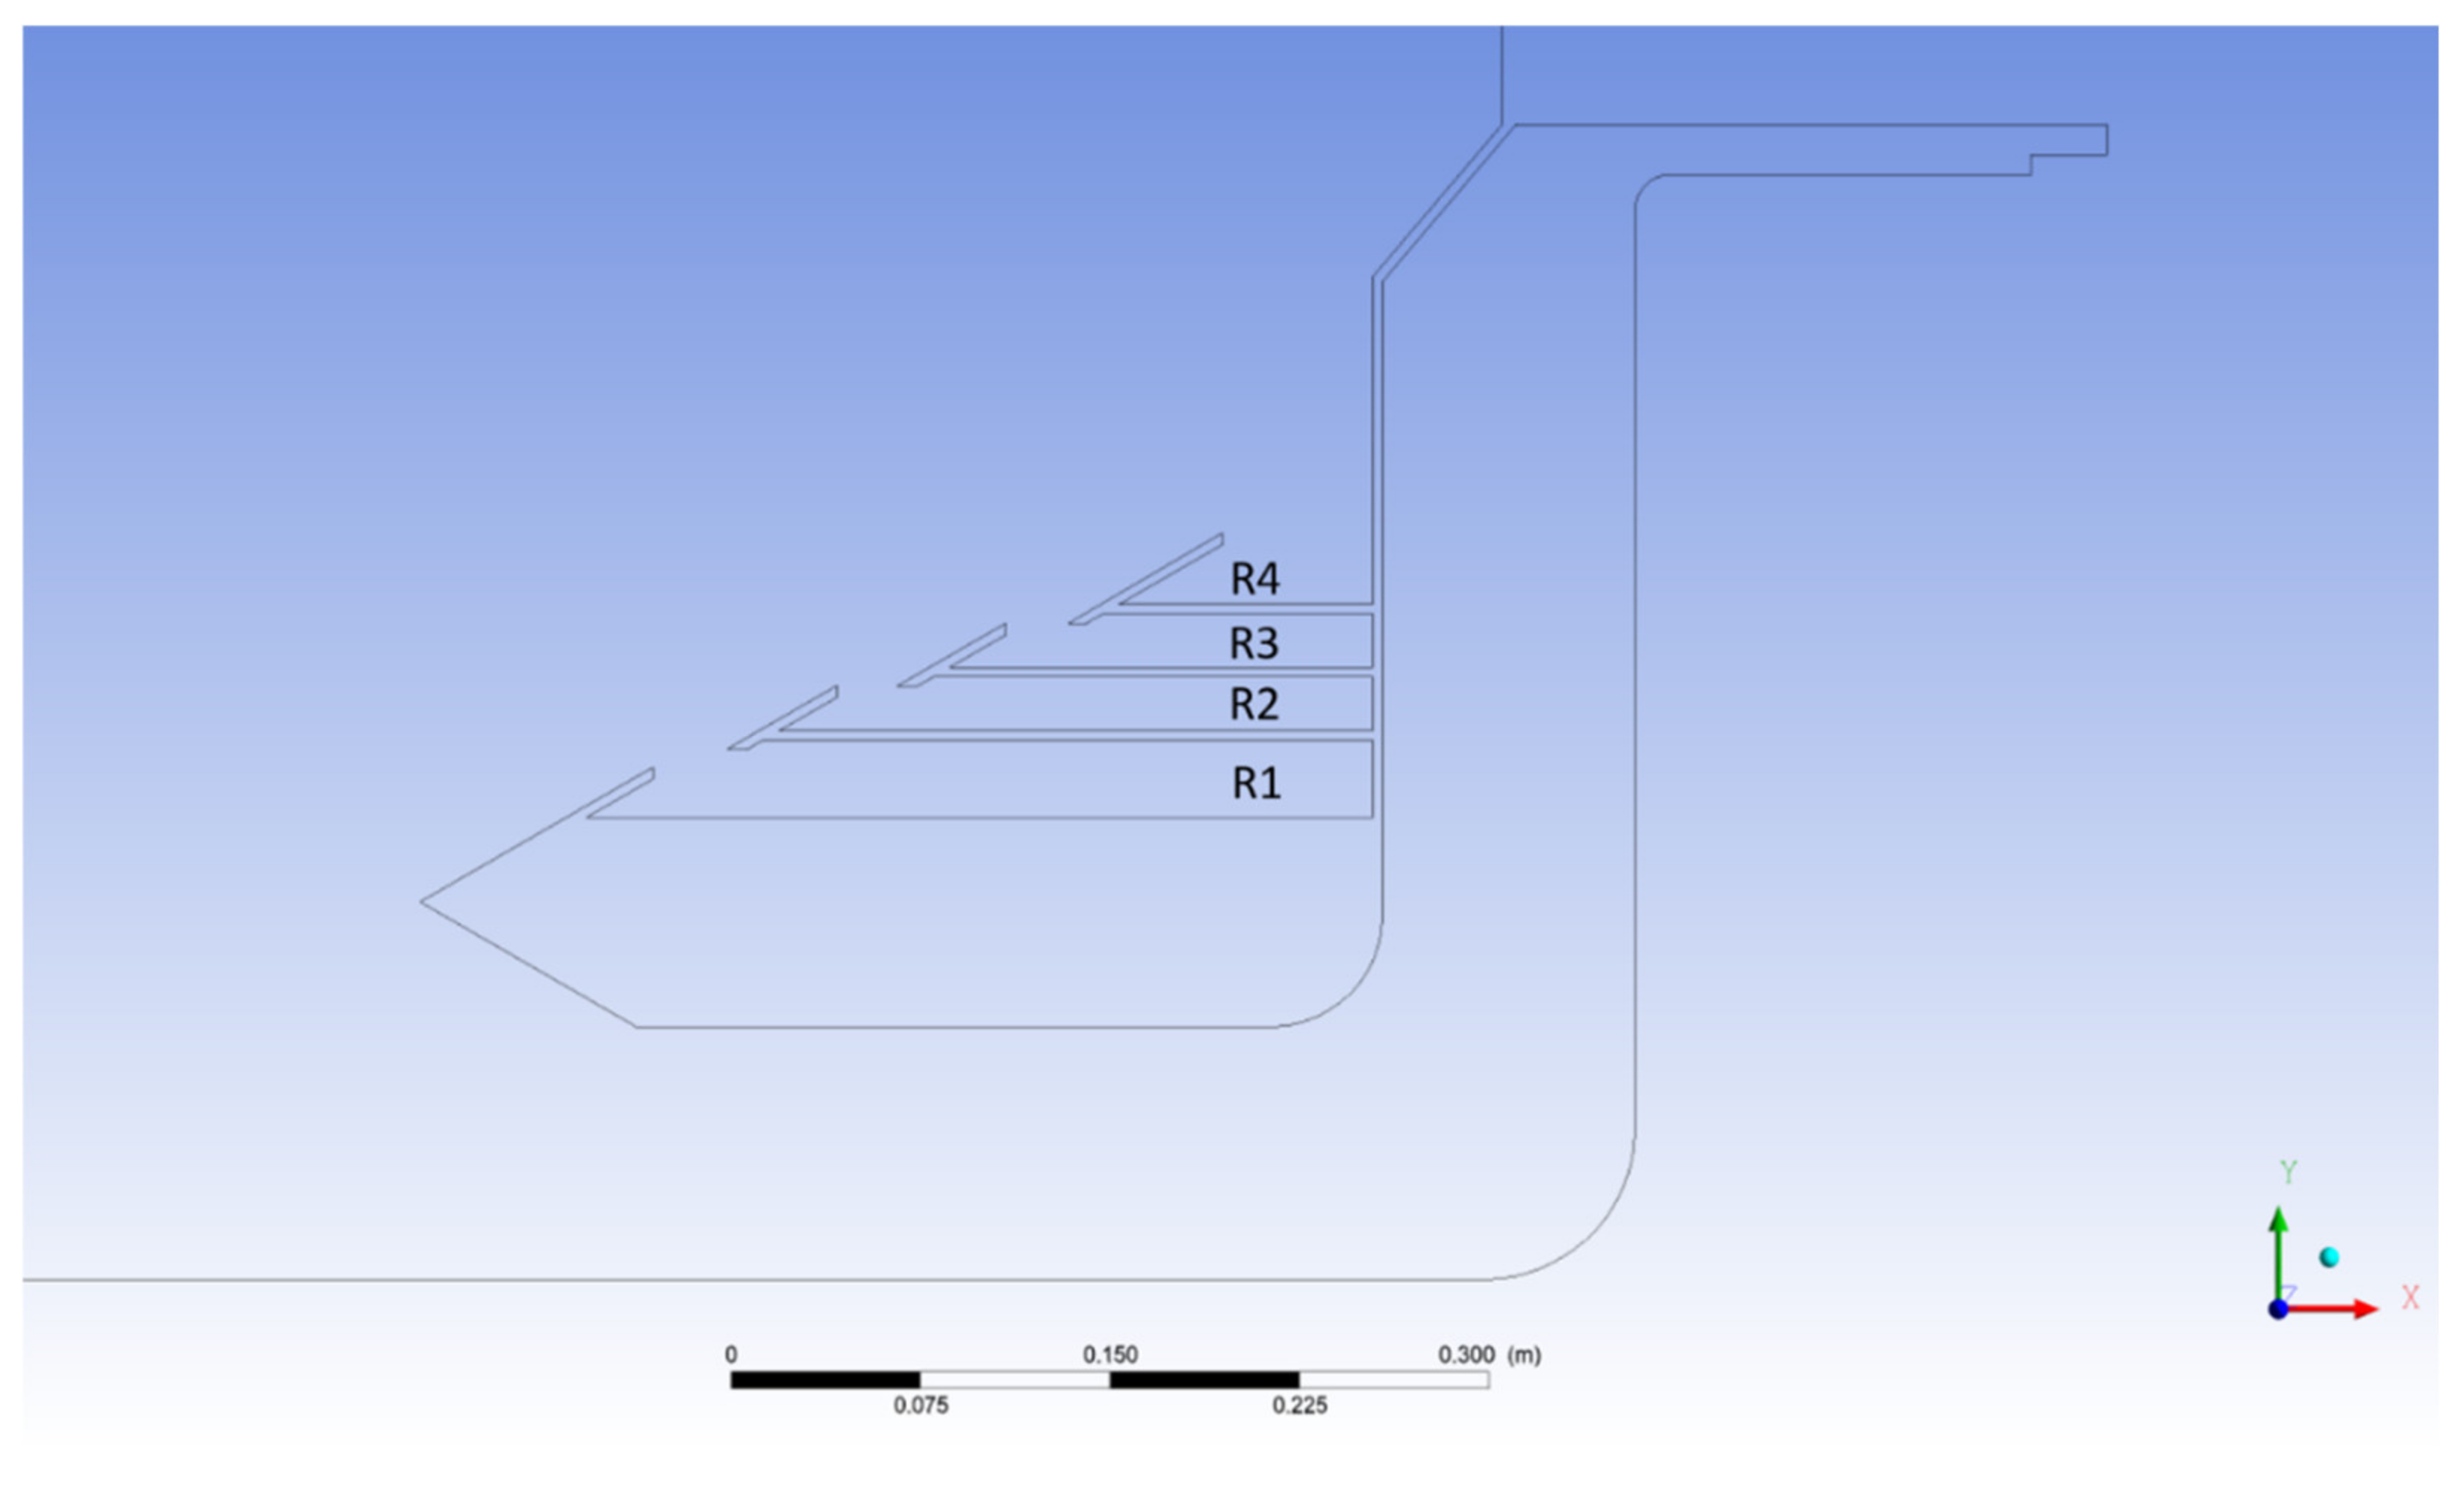
  • A pressure outlet for the sinks of the OTD devices (see B in Figure 8).
  • No slip conditions at the bottom, breakwater toe and all other parts of the HWEC device.

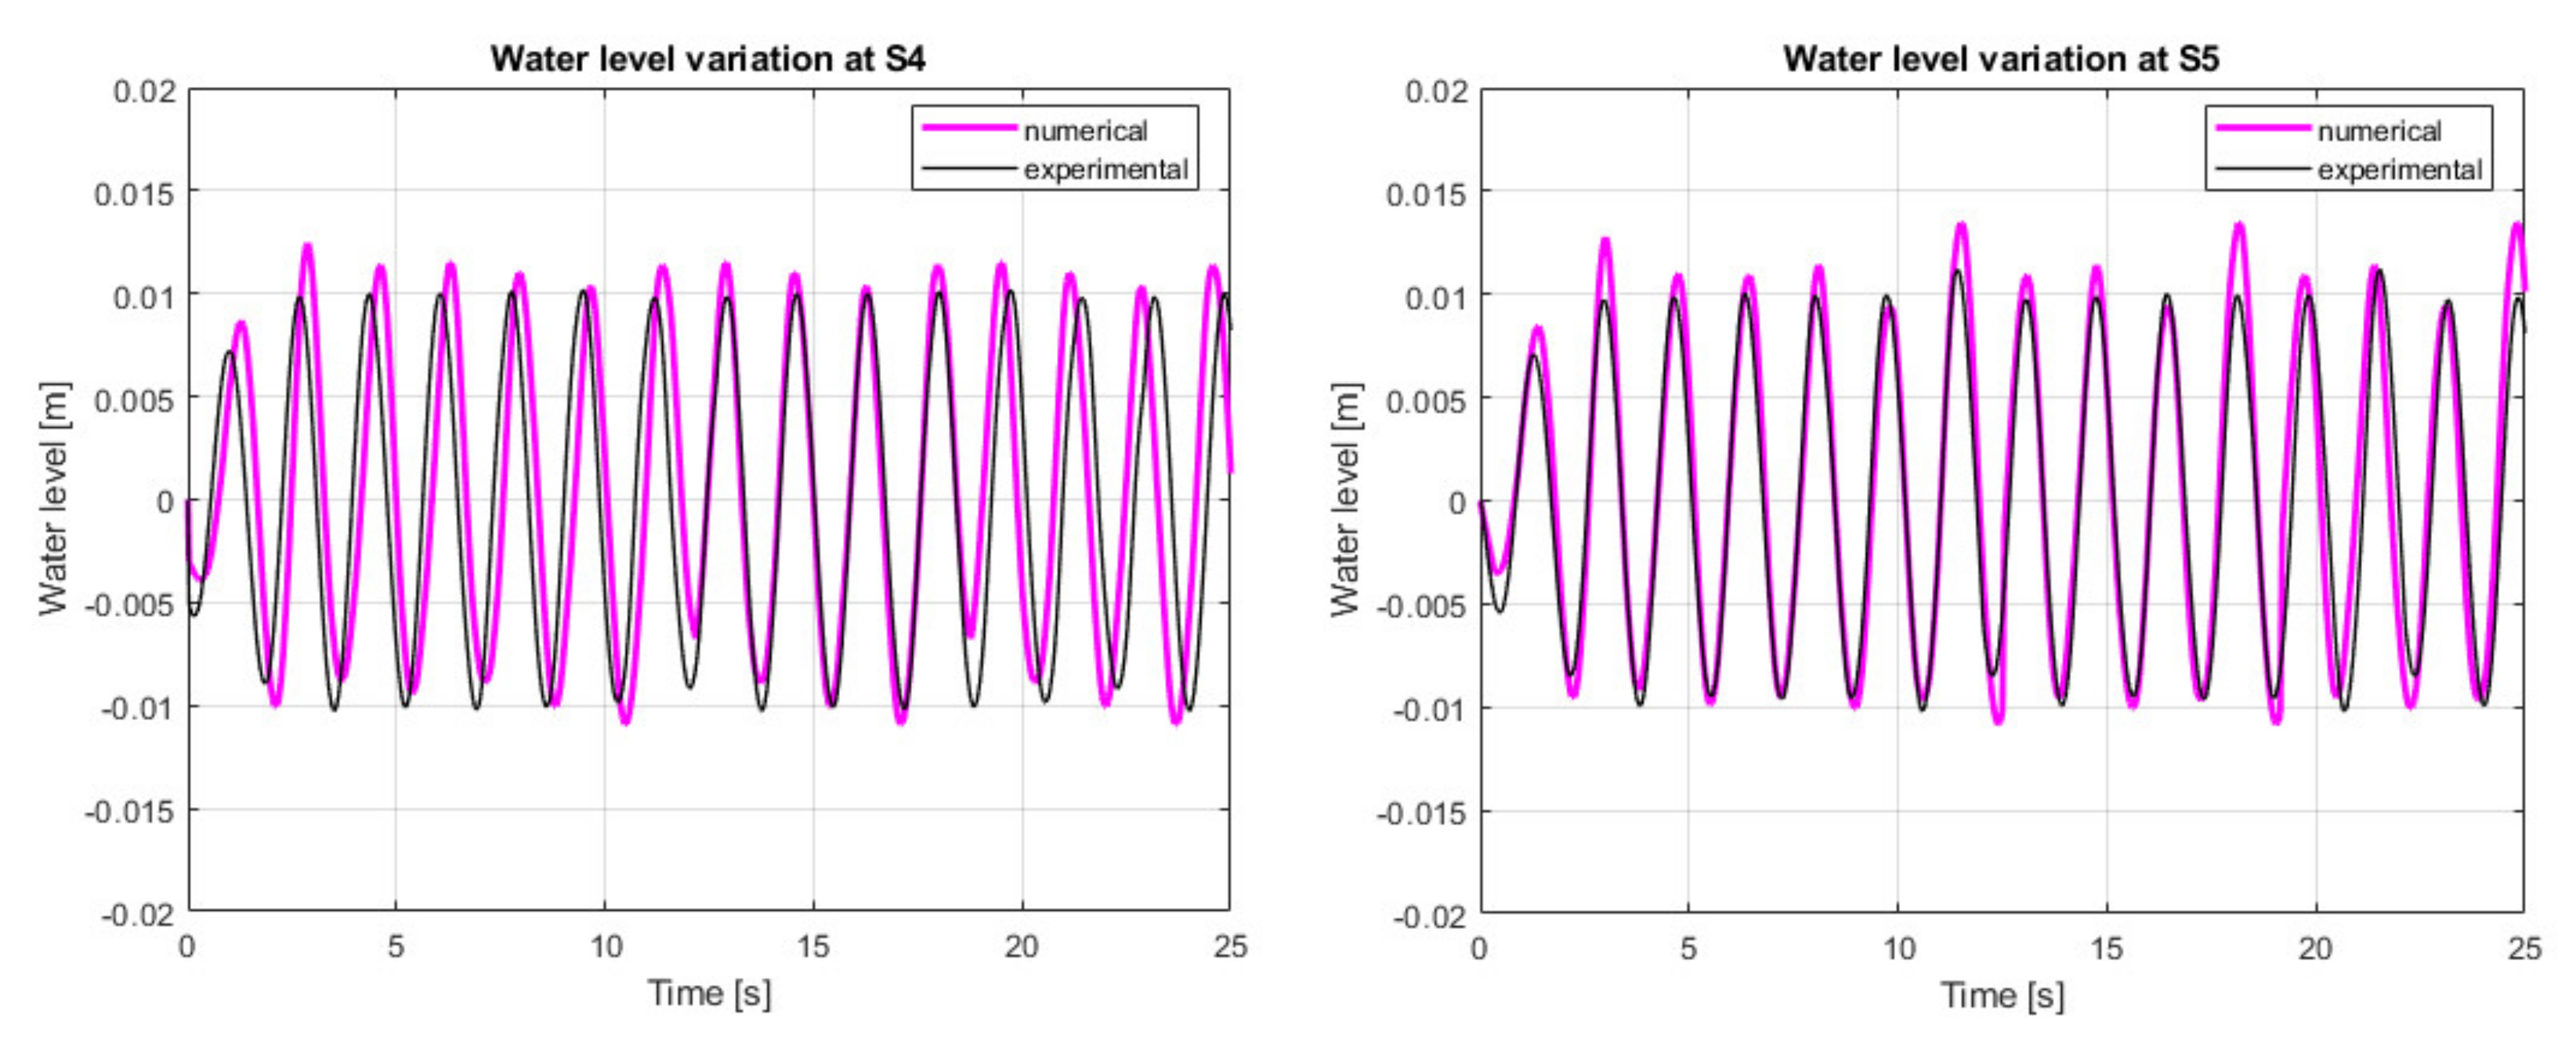
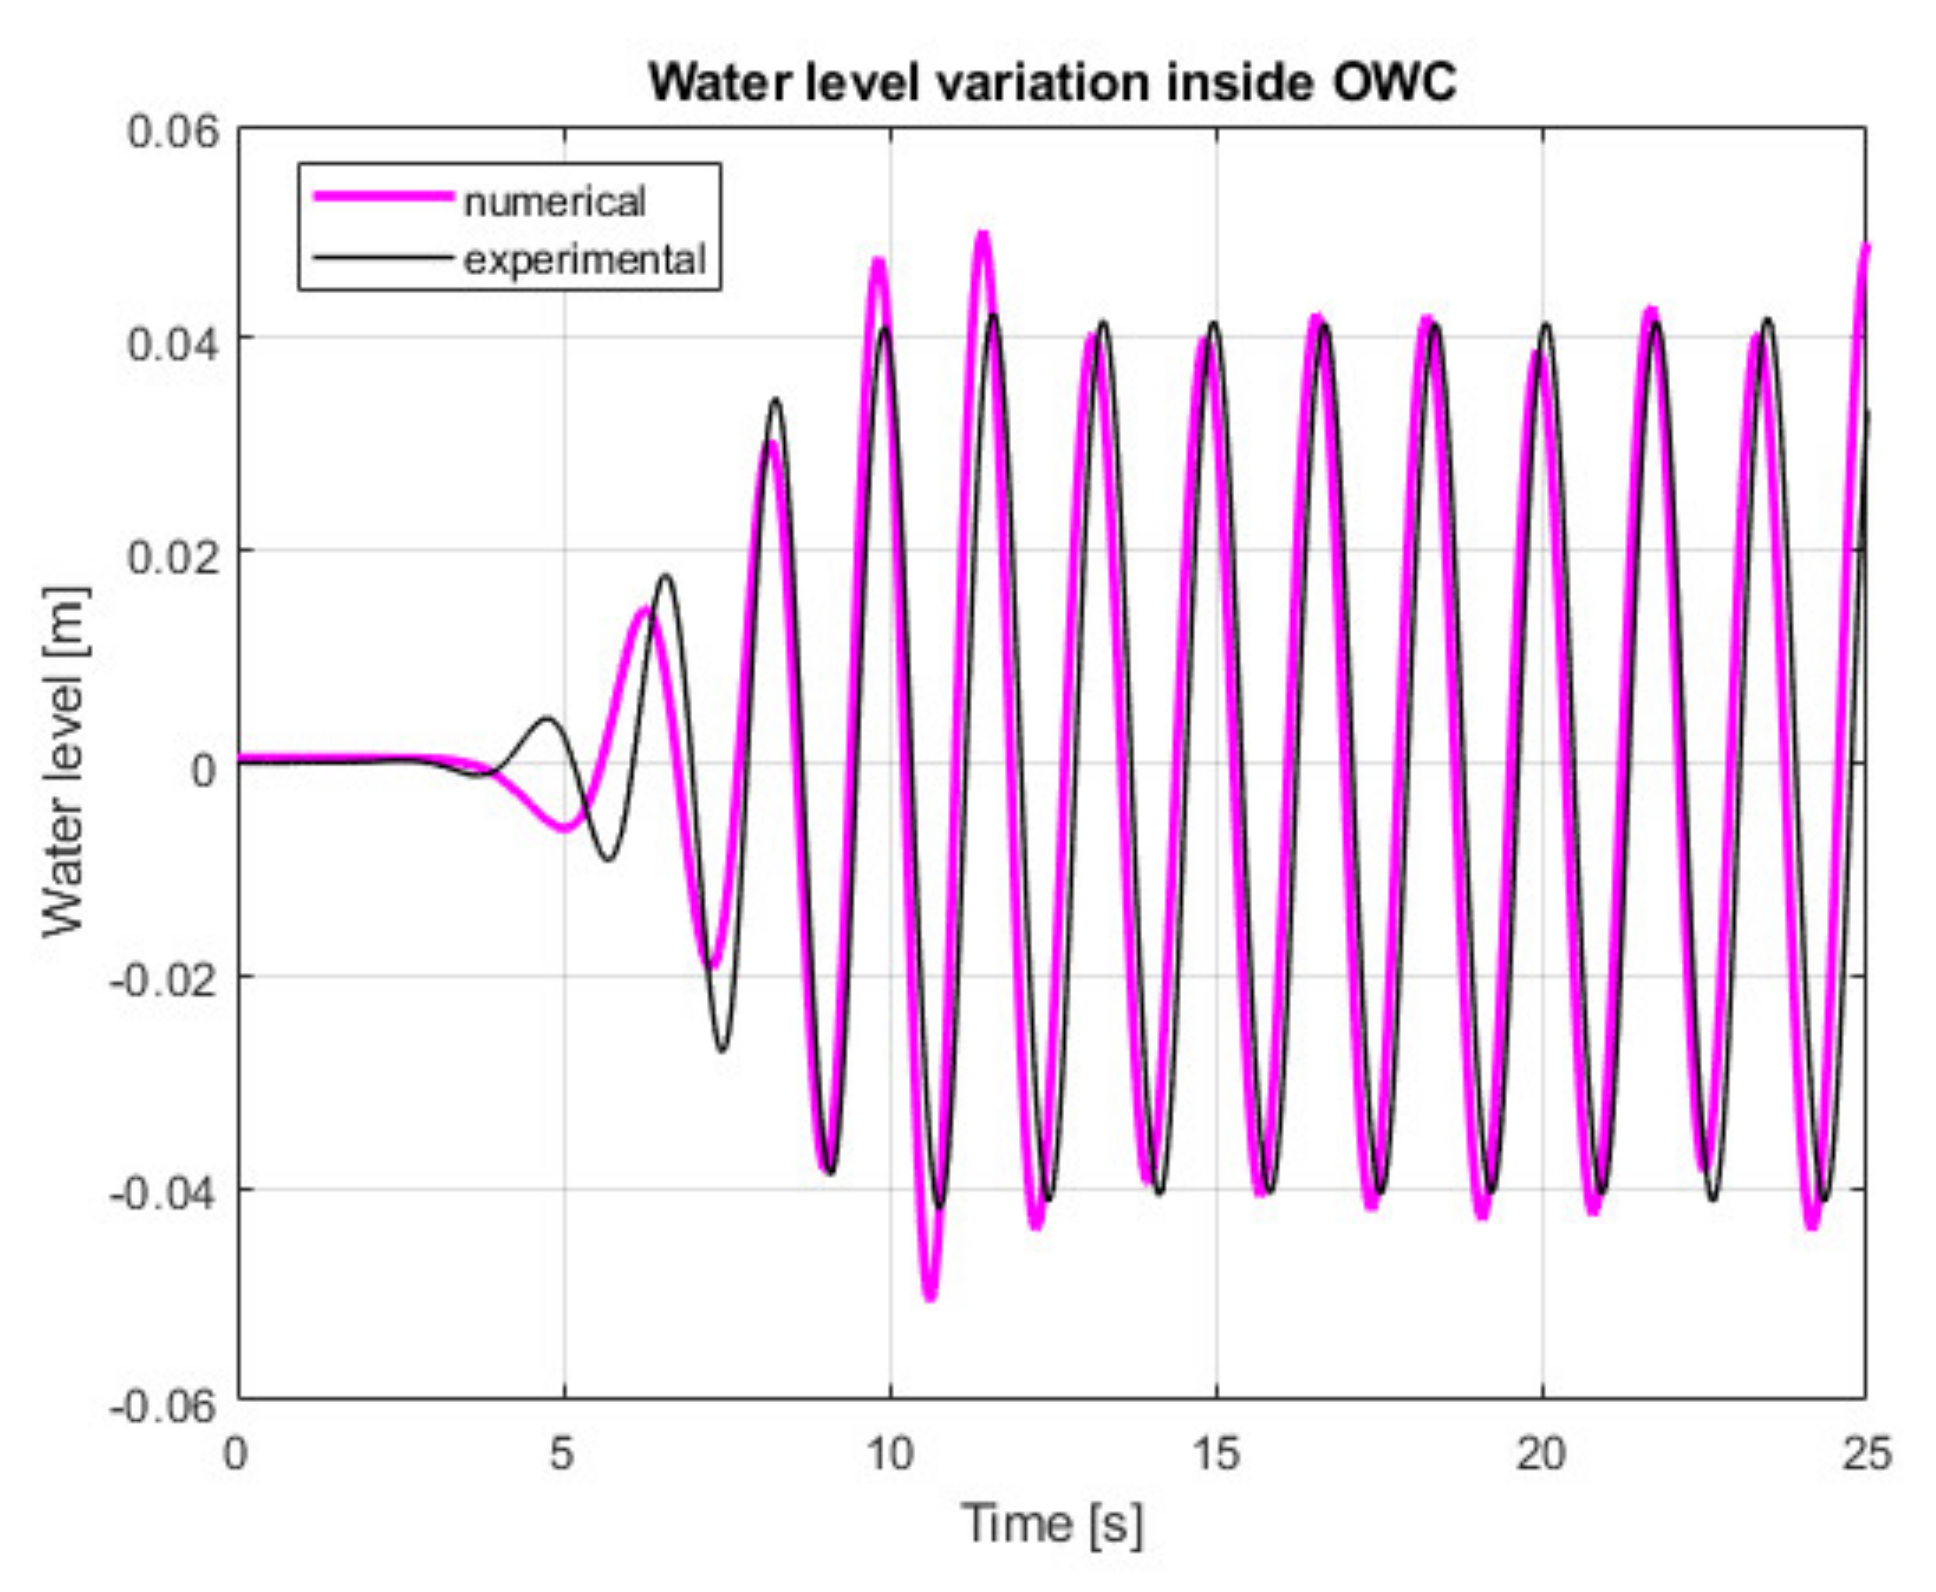
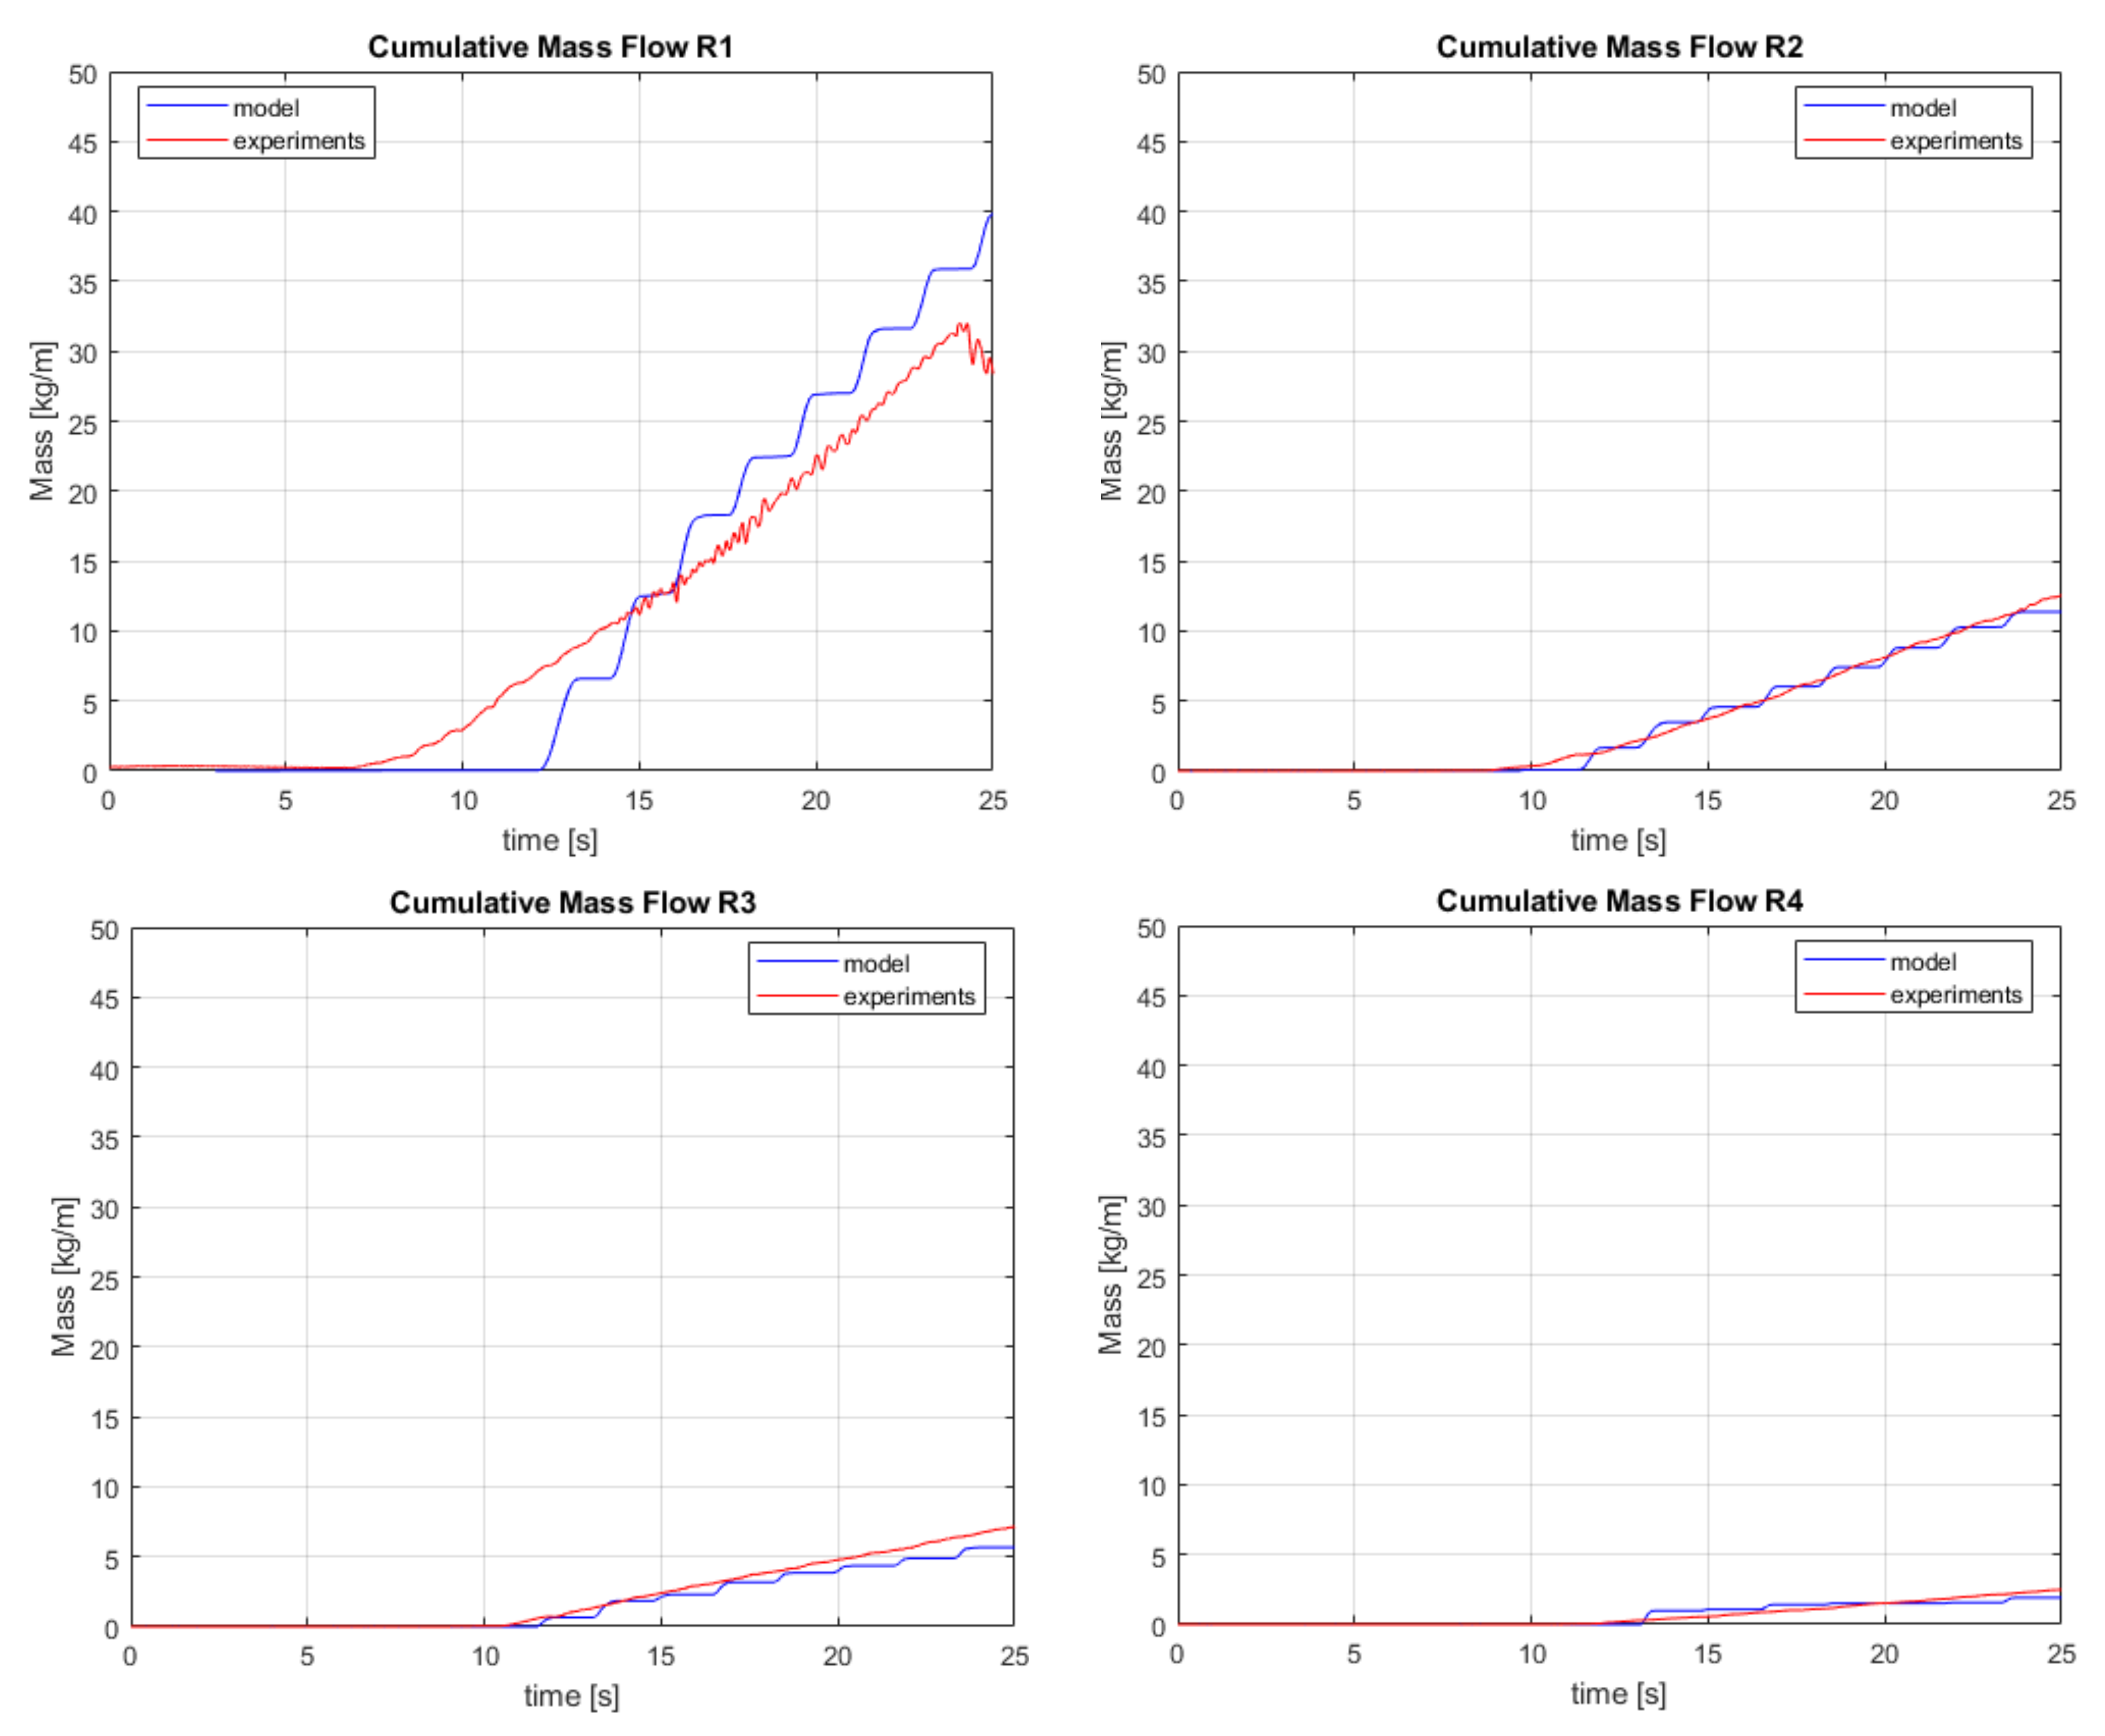
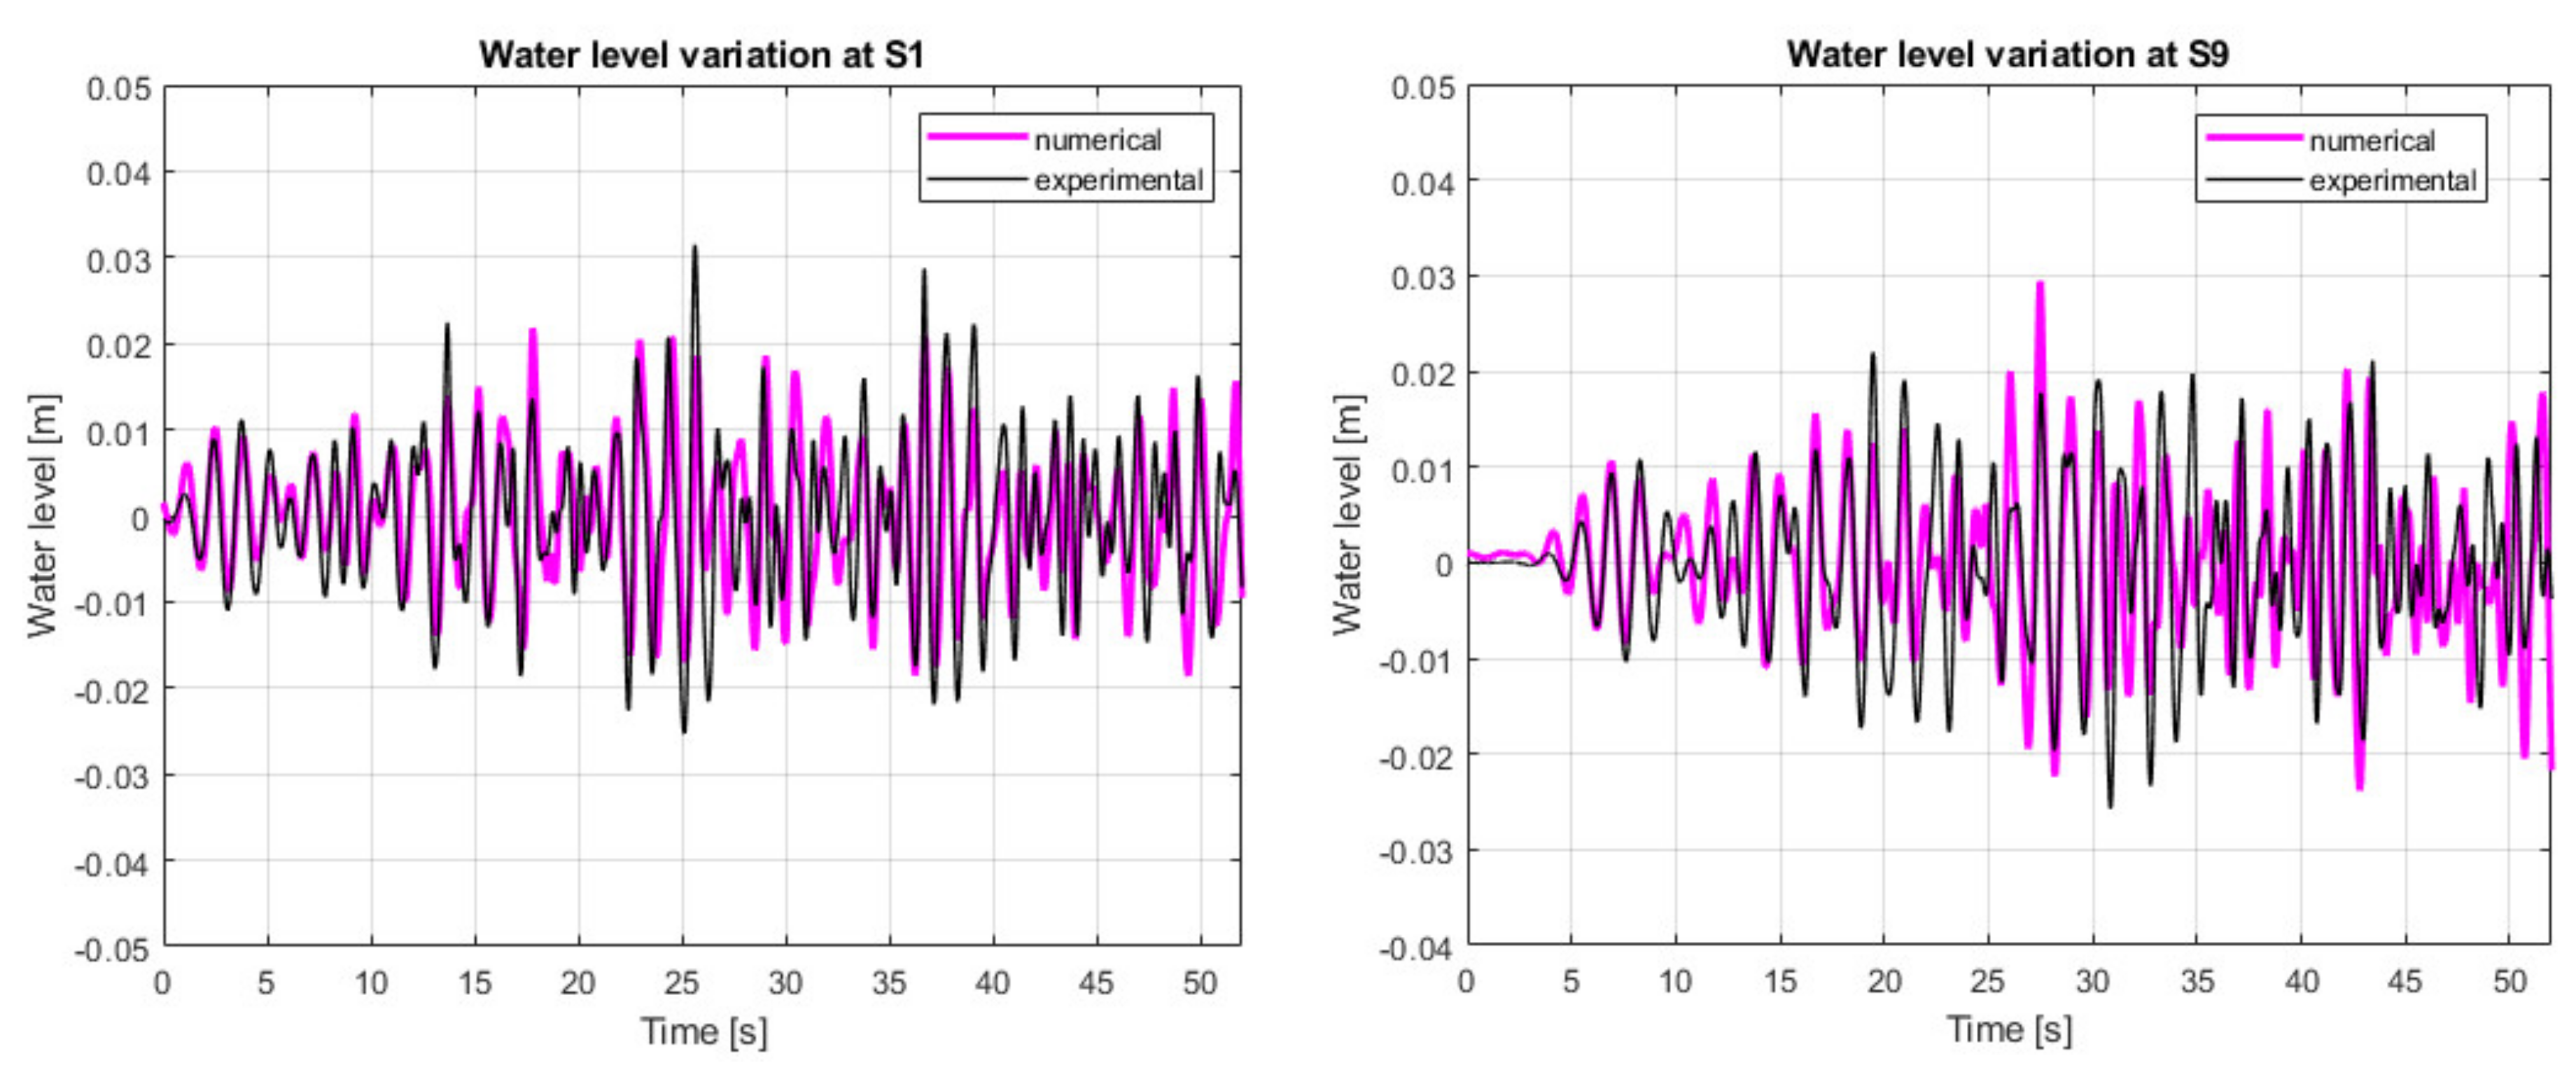
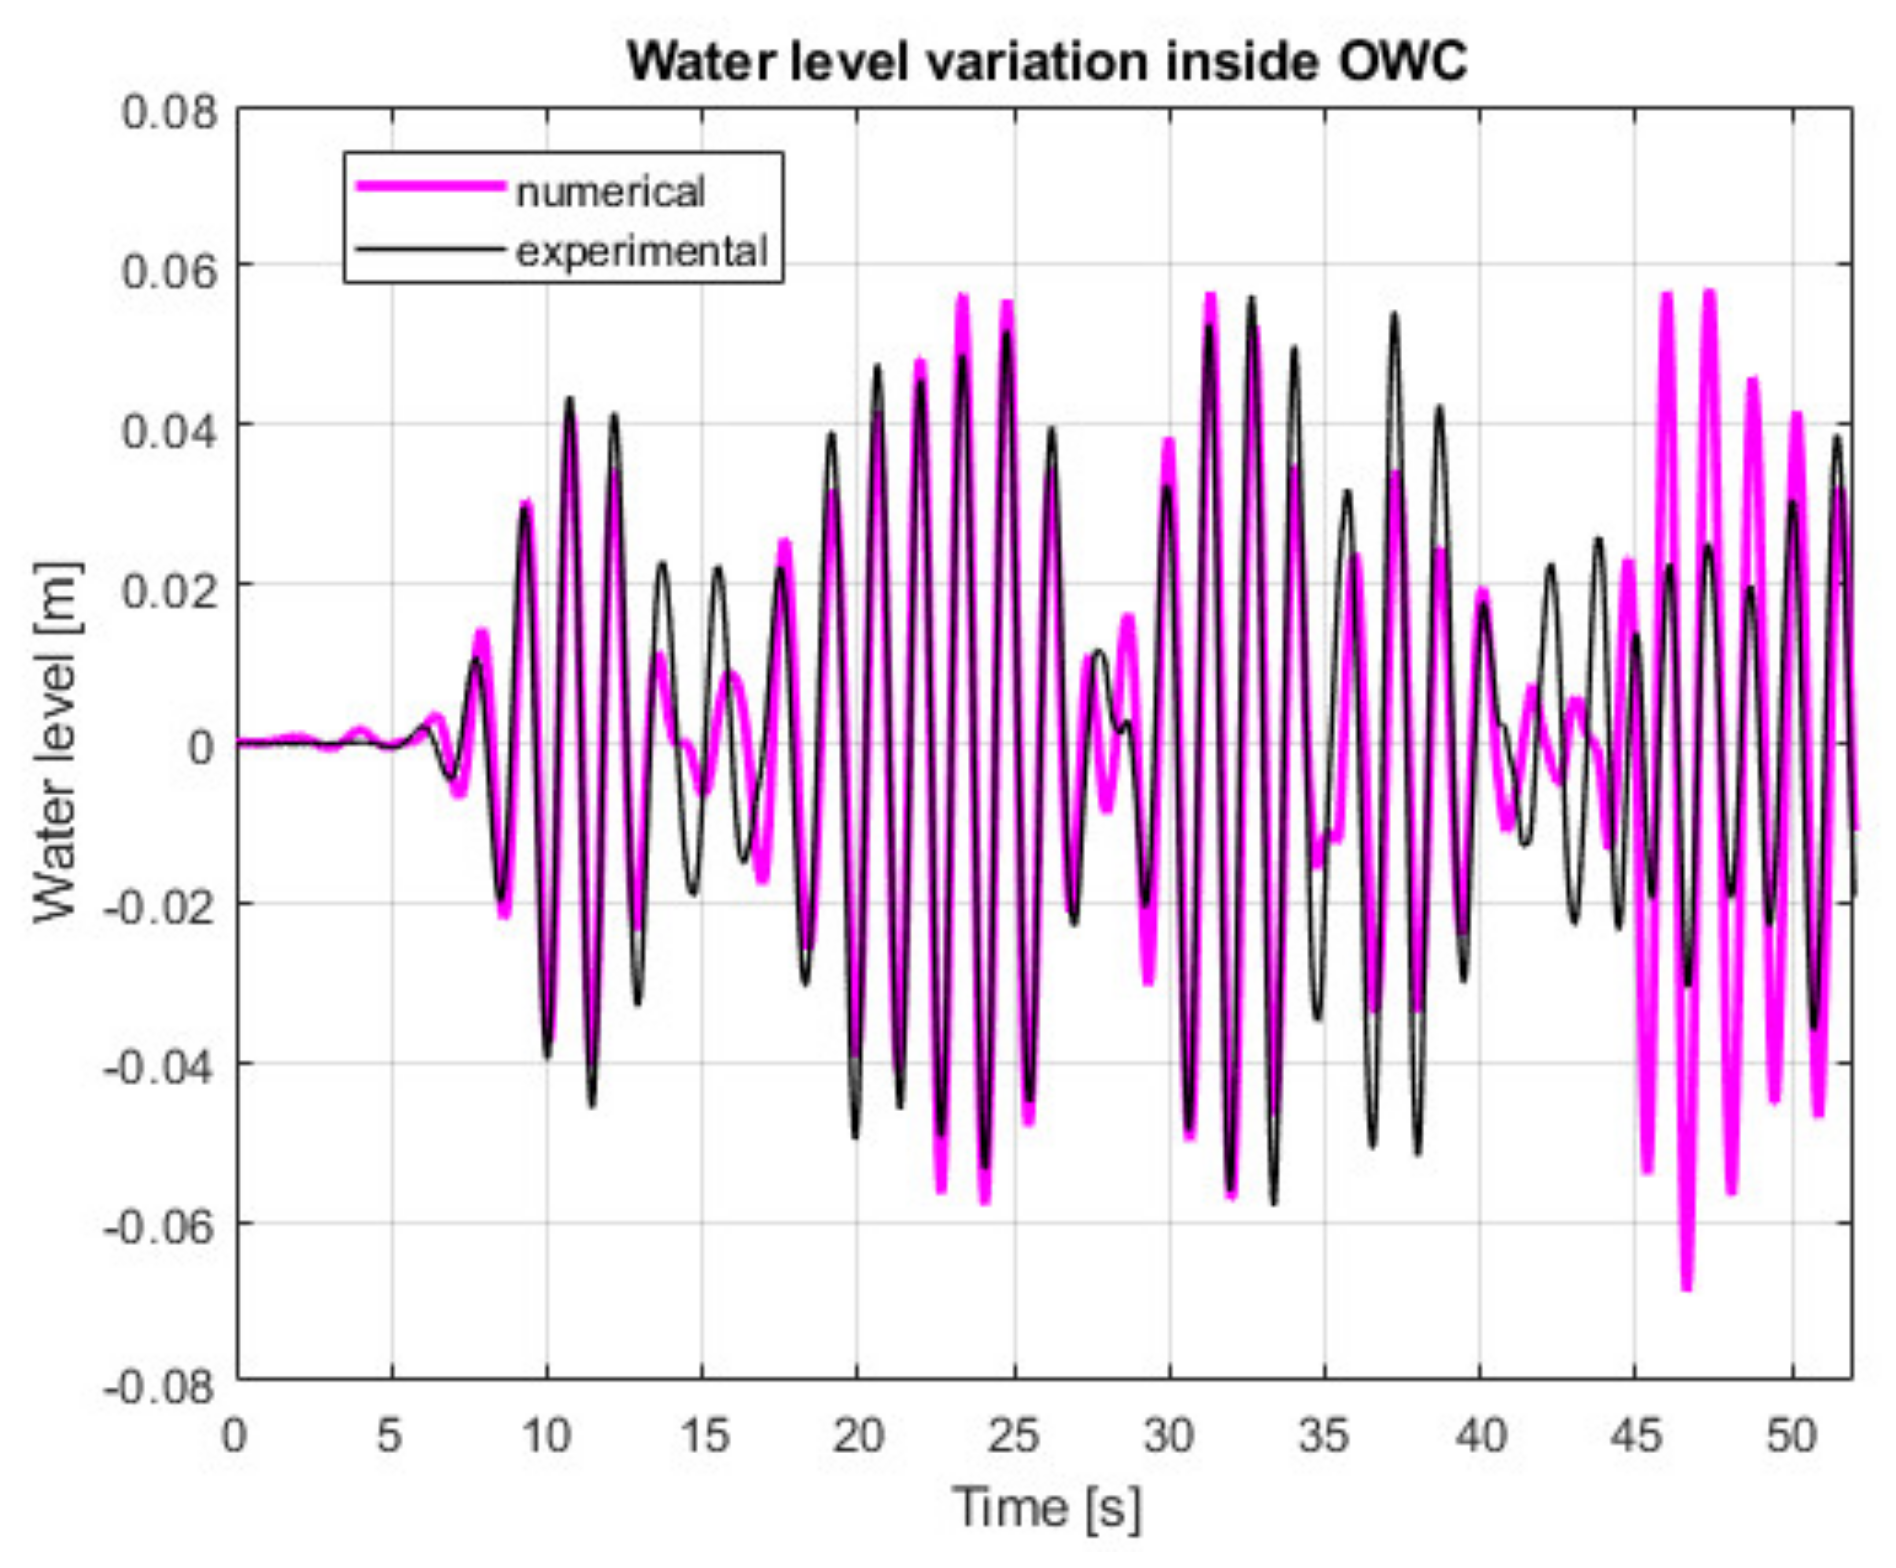
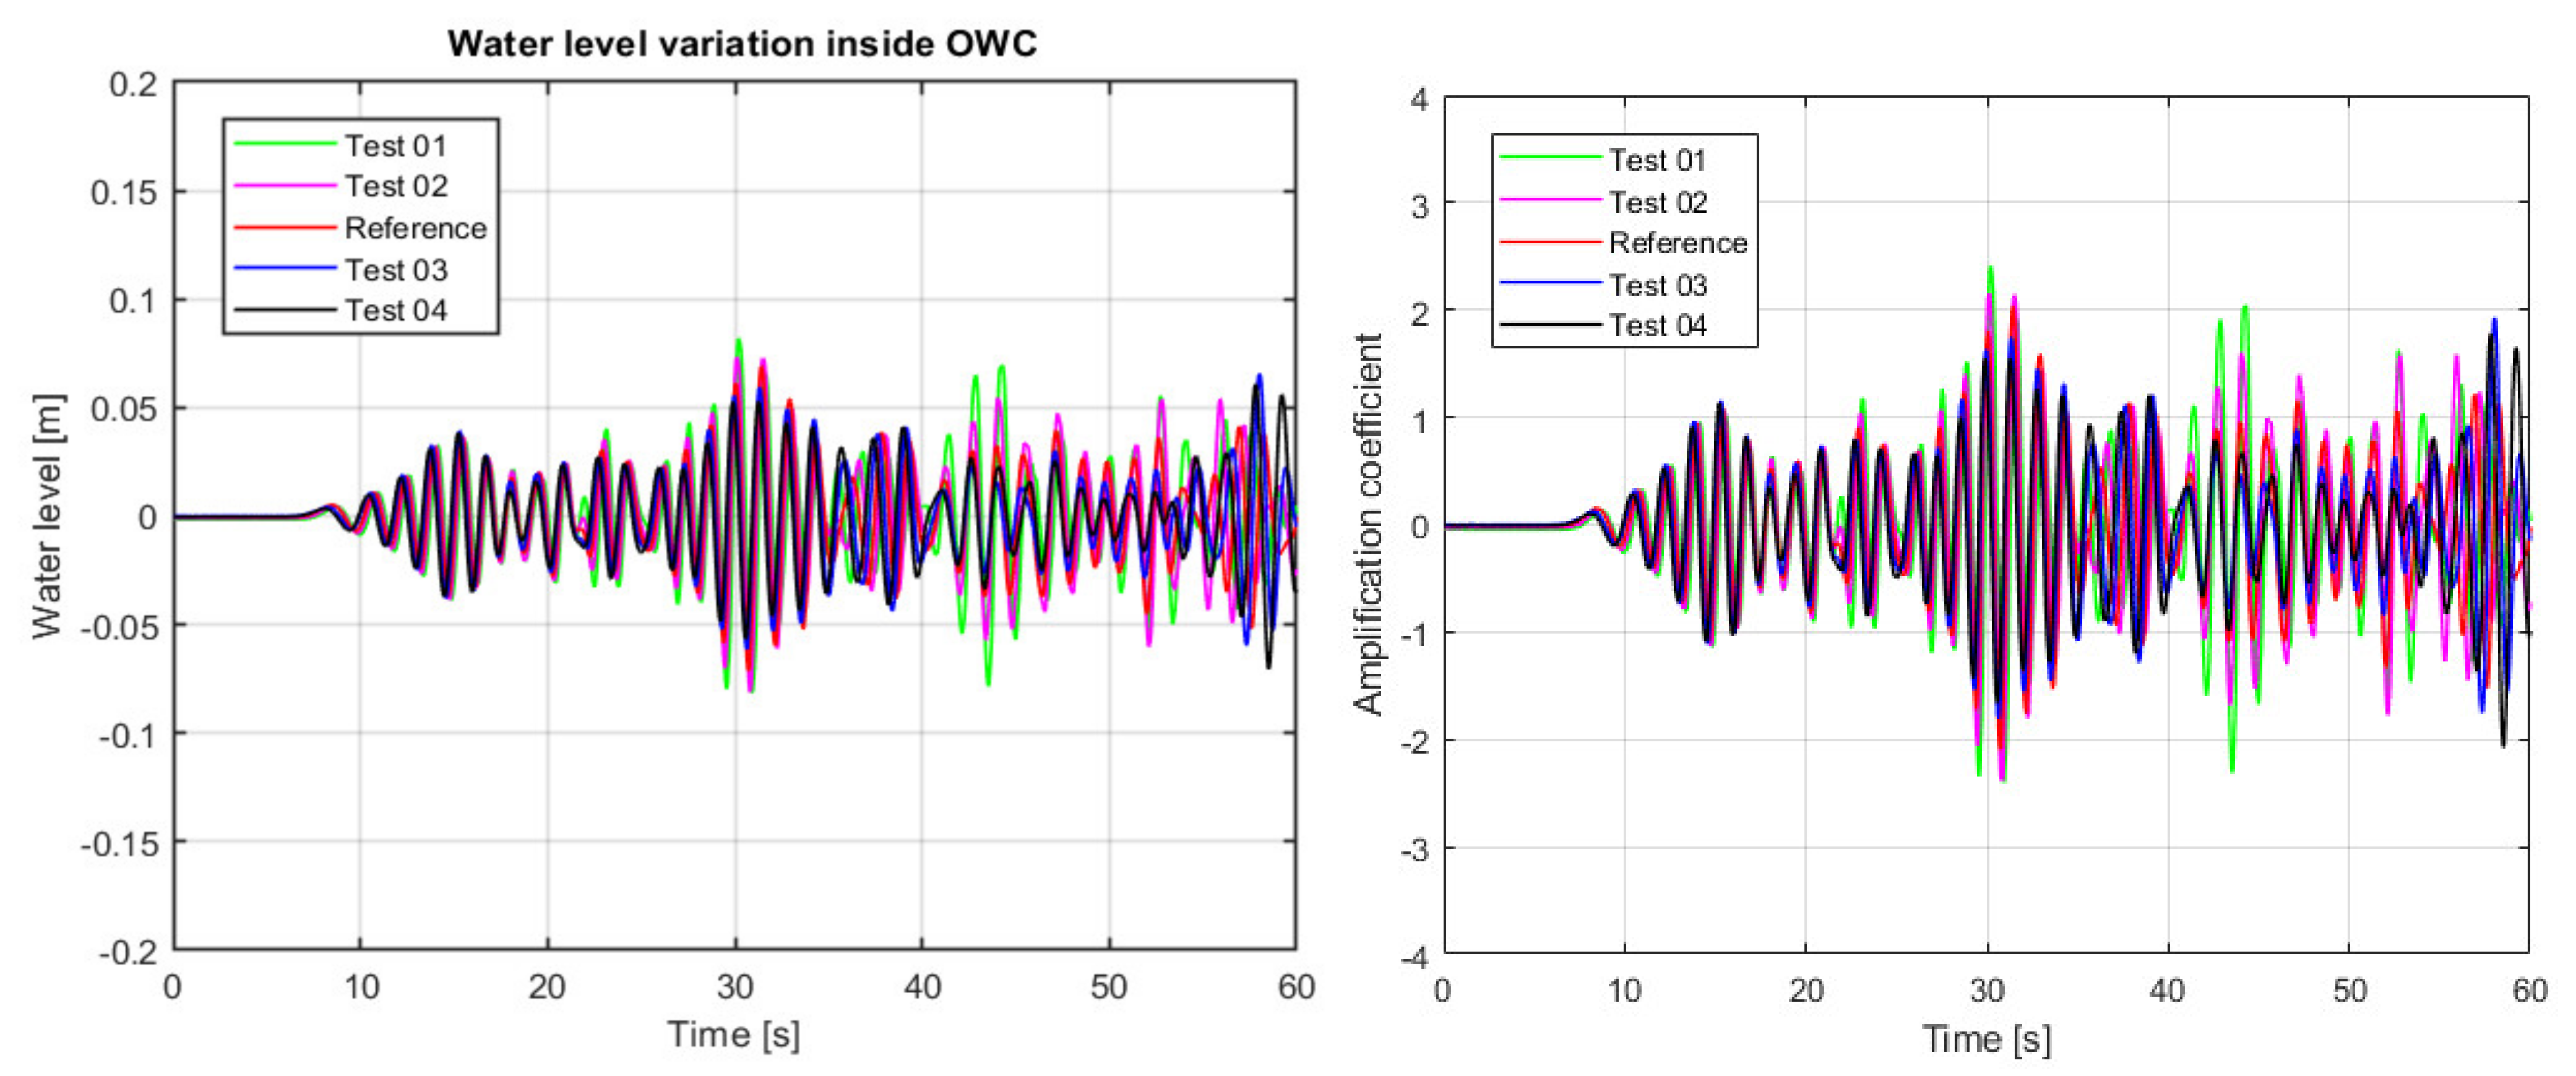
5.2.2. Model Validation

Numerical data were validated against data measured in FEUP’s laboratory for three different regular and irregular wave conditions for Geometry B [50]. The waves selected to be validated (in model scale) correspond to the most representative wave conditions in the Port of Leixões in Portugal. The variables compared with the experimental data were the free surface elevation at different locations along the wave flume, the variation of the water level inside the OWC chamber and the mean overtopping discharges over the OTD reservoirs’ crest. The experimental setup in the wave basin at FEUP is presented in Figure 9. It is reminded, that the wave tank had a wavemaker at the left boundary and an active absorption system for dealing with reflection issues, as mentioned above (Section 5.2.1 Model Set-up).
Whereas Figure 10 shows the comparison between the measured and calculated values of the water free surface elevation at two locations (S4 and S5) inside the wave flume (Figure 9), Figure 11 shows the water level comparison inside the OWC chamber. These results refer to a test with regular waves (Val_Test_01) of a wave height, H, equal to 0.02 m and a wave period, T, equal to 1.7 s. The offshore water depth was equal to h = 0.488 m. Thus, the time series presented in Figure 10 and Figure 11 correspond to 15 wave periods, which is an adequate simulation time taking into account the big computational cost of the simulations and the limited variations of the free surface elevation. The small oscillations of the free surface elevation that appear in Figure 10 are attributed to the expected reflection from the HWEC device itself. Nevertheless, it can be concluded that the numerical model is able to represent satisfactorily well the water free surface elevation at the two locations in the wave flume. Regarding the comparison presented in Figure 11 it is clear that the model captures almost precisely the water level oscillations measured inside the OWC chamber.
The second phase of the validation process included the comparison of the wave overtopping. It is worth noting that in the numerical model, the discharges entering each reservoir were estimated by considering the total amount of wave discharge overtopping the crest of each reservoir. Contrarily, in the physical model testing, the overtopping in the reservoirs was indirectly assessed by measuring the volume of water collected in auxiliary reservoirs located behind the model and connected with each reservoir through rigid pipes (Figure 9). Therefore, the overtopping discharges in the HWEC reservoirs were estimated using the measurements of the water level gauges installed in each of these auxiliary reservoirs. From the variation of the water level inside each auxiliary reservoir, the volume variation was computed from the cross-sectional area of the auxiliary reservoir.
The wave overtopping in the different reservoirs, represented in terms of the cumulative mass flow (kg/m) derived from the numerical model, was compared with the volume variation in the auxiliary reservoirs derived from the experiments and translated into mass flow (kg/m), as depicted in Figure 12. Results refer to a regular wave test (Val_Test_02) with H = 0.08 m and T = 1.7 s. The offshore water depth was equal to h = 0.488 m. Reservoirs are numbered from R1 to R4, where R1 is the lowest and R4 the highest one in the OTD system. Results shown in Figure 12 indicate that the model predicts accurately the mass flow in reservoirs R2, R3 and R4, while it slightly overestimates the mass flow in the lowest reservoir R1. This slight overestimation was expected since the first reservoir was partially saturated during the physical model test due to the low crest freeboard of the first ramp.
For this validation test a snapshot of the free surface elevation during a time instant after 14 wave periods is presented in Figure 13, while the same snapshot but with a focus near the HWEC device is presented in Figure 14, respectively. It can be verified that the overtopping is less pronounced in the reservoirs R2 and R3 comparing with the lowermost R1 reservoir, while the overtopping in the uppermost R4 reservoir is very small.
The third test used for the validation of the model corresponds to an irregular wave test (Val_Test_03) with a significant wave height, Hs, equal to 0.034 m and a peak wave period, Tp, equal to 1.27 s. The offshore water depth was equal to h = 0.488 m. The simulation time was equal to 30 wave periods, two times bigger than in regular wave cases since we wanted to ensure that possible variations occurring are captured. The comparison between the measured and calculated values of the free surface elevation at two locations (S1 and S9) in the wave flume is presented in Figure 15. These results show that the numerical model captures satisfactorily well the water free surface elevation also for the case of irregular waves, although some discrepancies can be observed. Figure 16 displays the comparison between measured and simulated oscillation of the water surface inside the OWC chamber for Val_Test_03. It is noted that the model is able to capture adequately the water level oscillations inside the chamber for the first 45 s, which correspond to around 26 incident waves. After around 45 s the comparison is not as good. This is attributed to the fact that the model is two-dimensional and therefore not able to capture three-dimensional phenomena occurring in the physical model testing. In the laboratory experiments it was observed that after some time the three-dimensional effects were not insignificant inside the OWC. More specifically, inside the OWC chamber waves in the transverse direction were created. These waves are responsible for the unsteady pattern of the black wave signal observed after around 45 s in Figure 16, which cannot be captured by the numerical model. Regarding the wave flume in front of the device the three-dimensional effects during the experiments were not that pronounced after the 45 s, thus the comparison with the numerical results presented in Figure 15 is much better.
Table 1 indicates the Root-Mean-Square Error (RMSE) of the free surface elevation between measured and calculated data for the five wave gauges locations along the wave flume (as shown in Figure 9) and inside the OWC chamber for the three tests described before. The RMSE was calculated according to the equation presented herein below. Although discrepancies can be noted due to the complex interaction between the waves and the non-conventional geometry of the HWEC, results of this validation indicate that the numerical model is capable of sufficiently reproducing the wave field inside the wave flume as well as the oscillation inside the OWC chamber for all cases tested.
RMSE % = s q r t 1 N i = 1 N H n u m e r H e x p e r 2 1 N i = 1 N H e x p e r 2 100

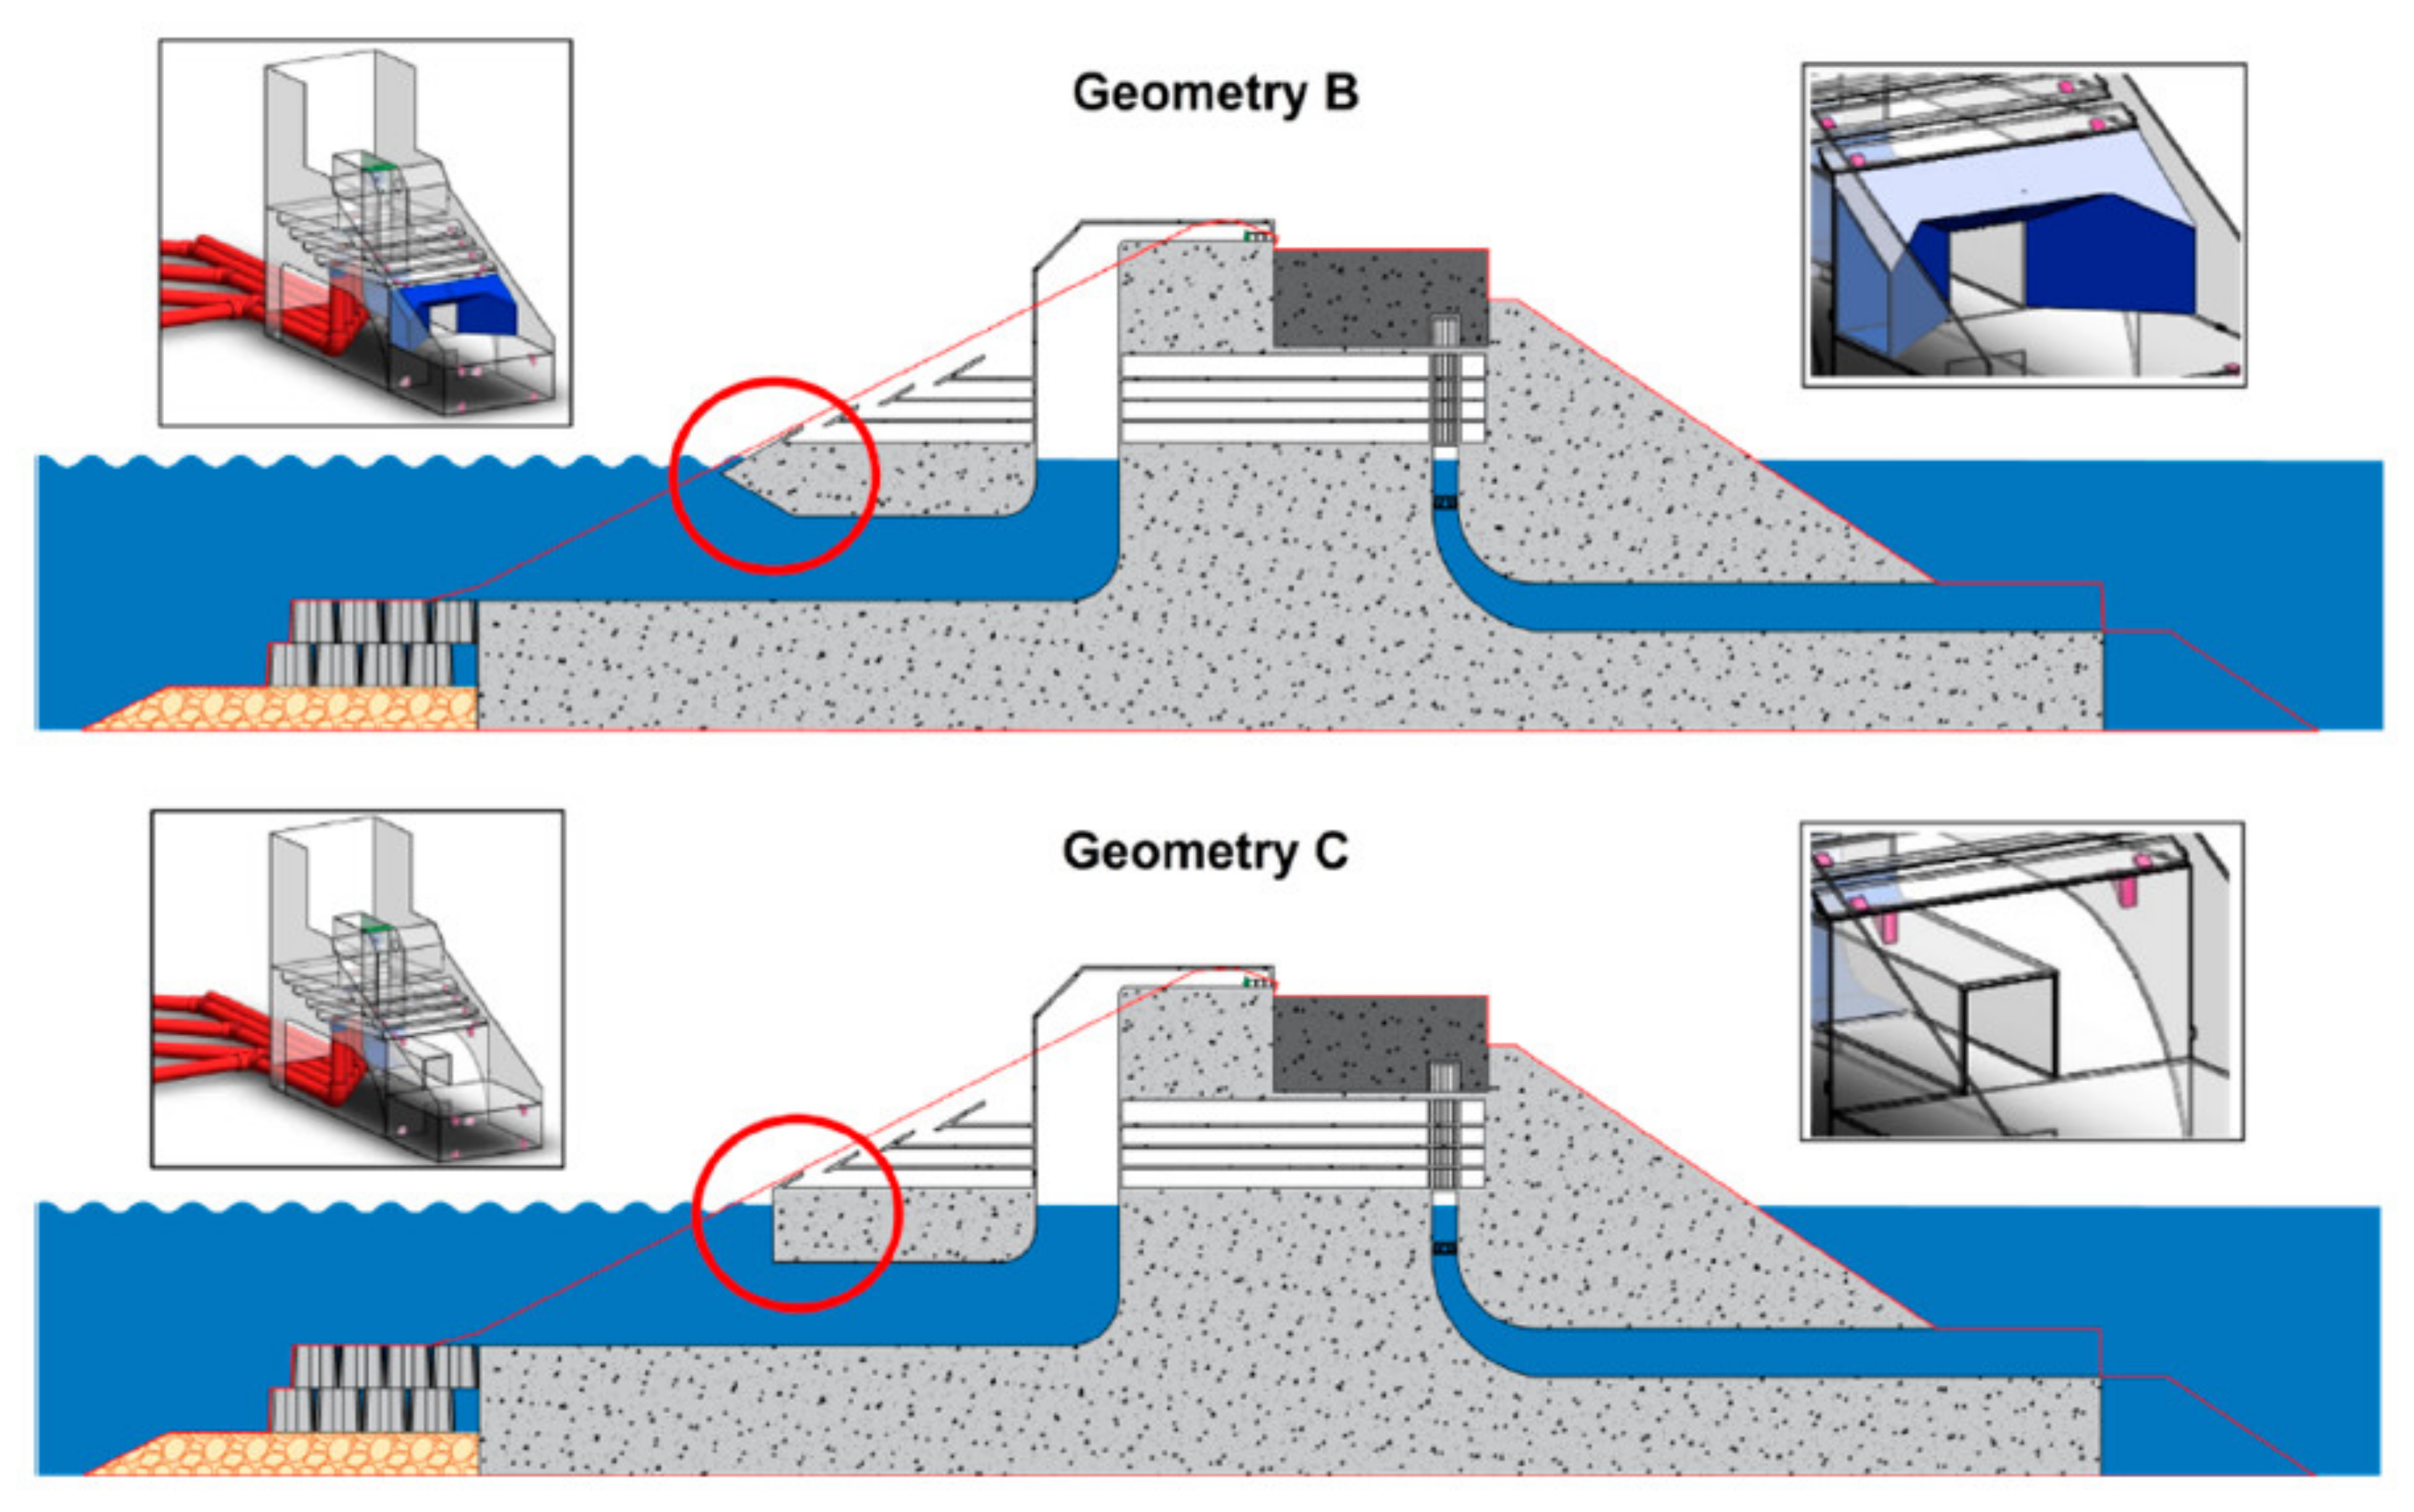
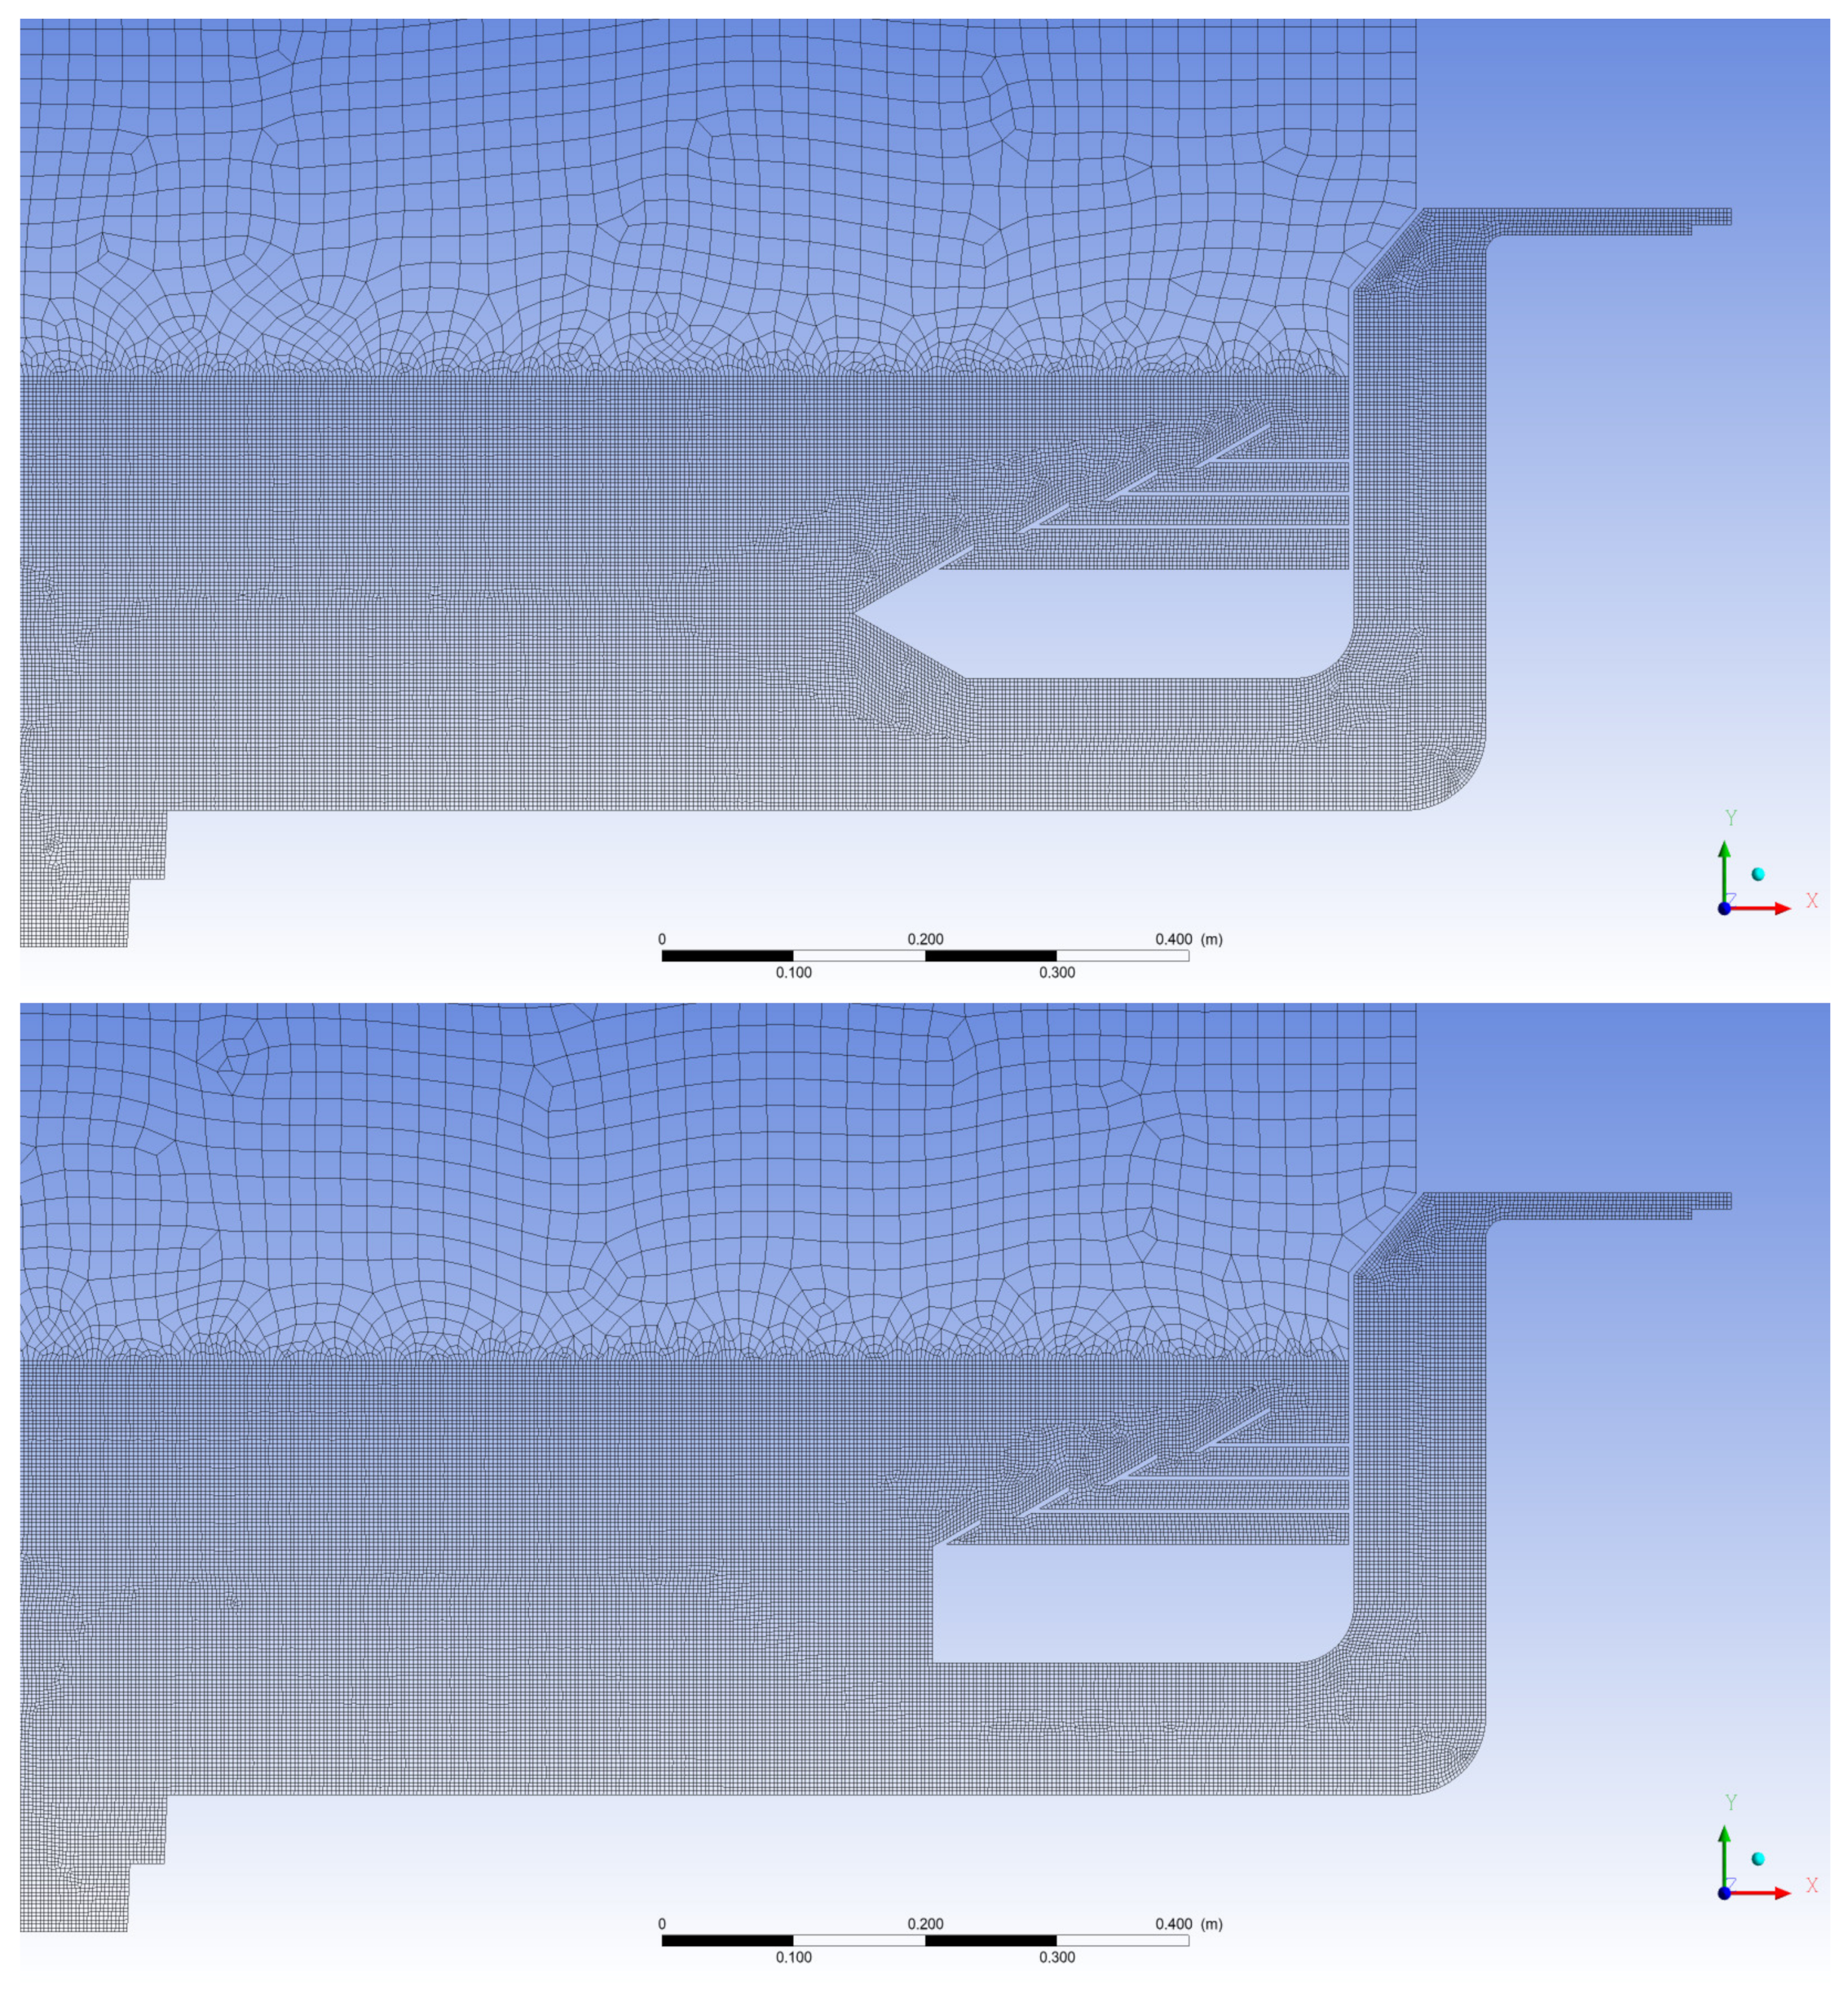
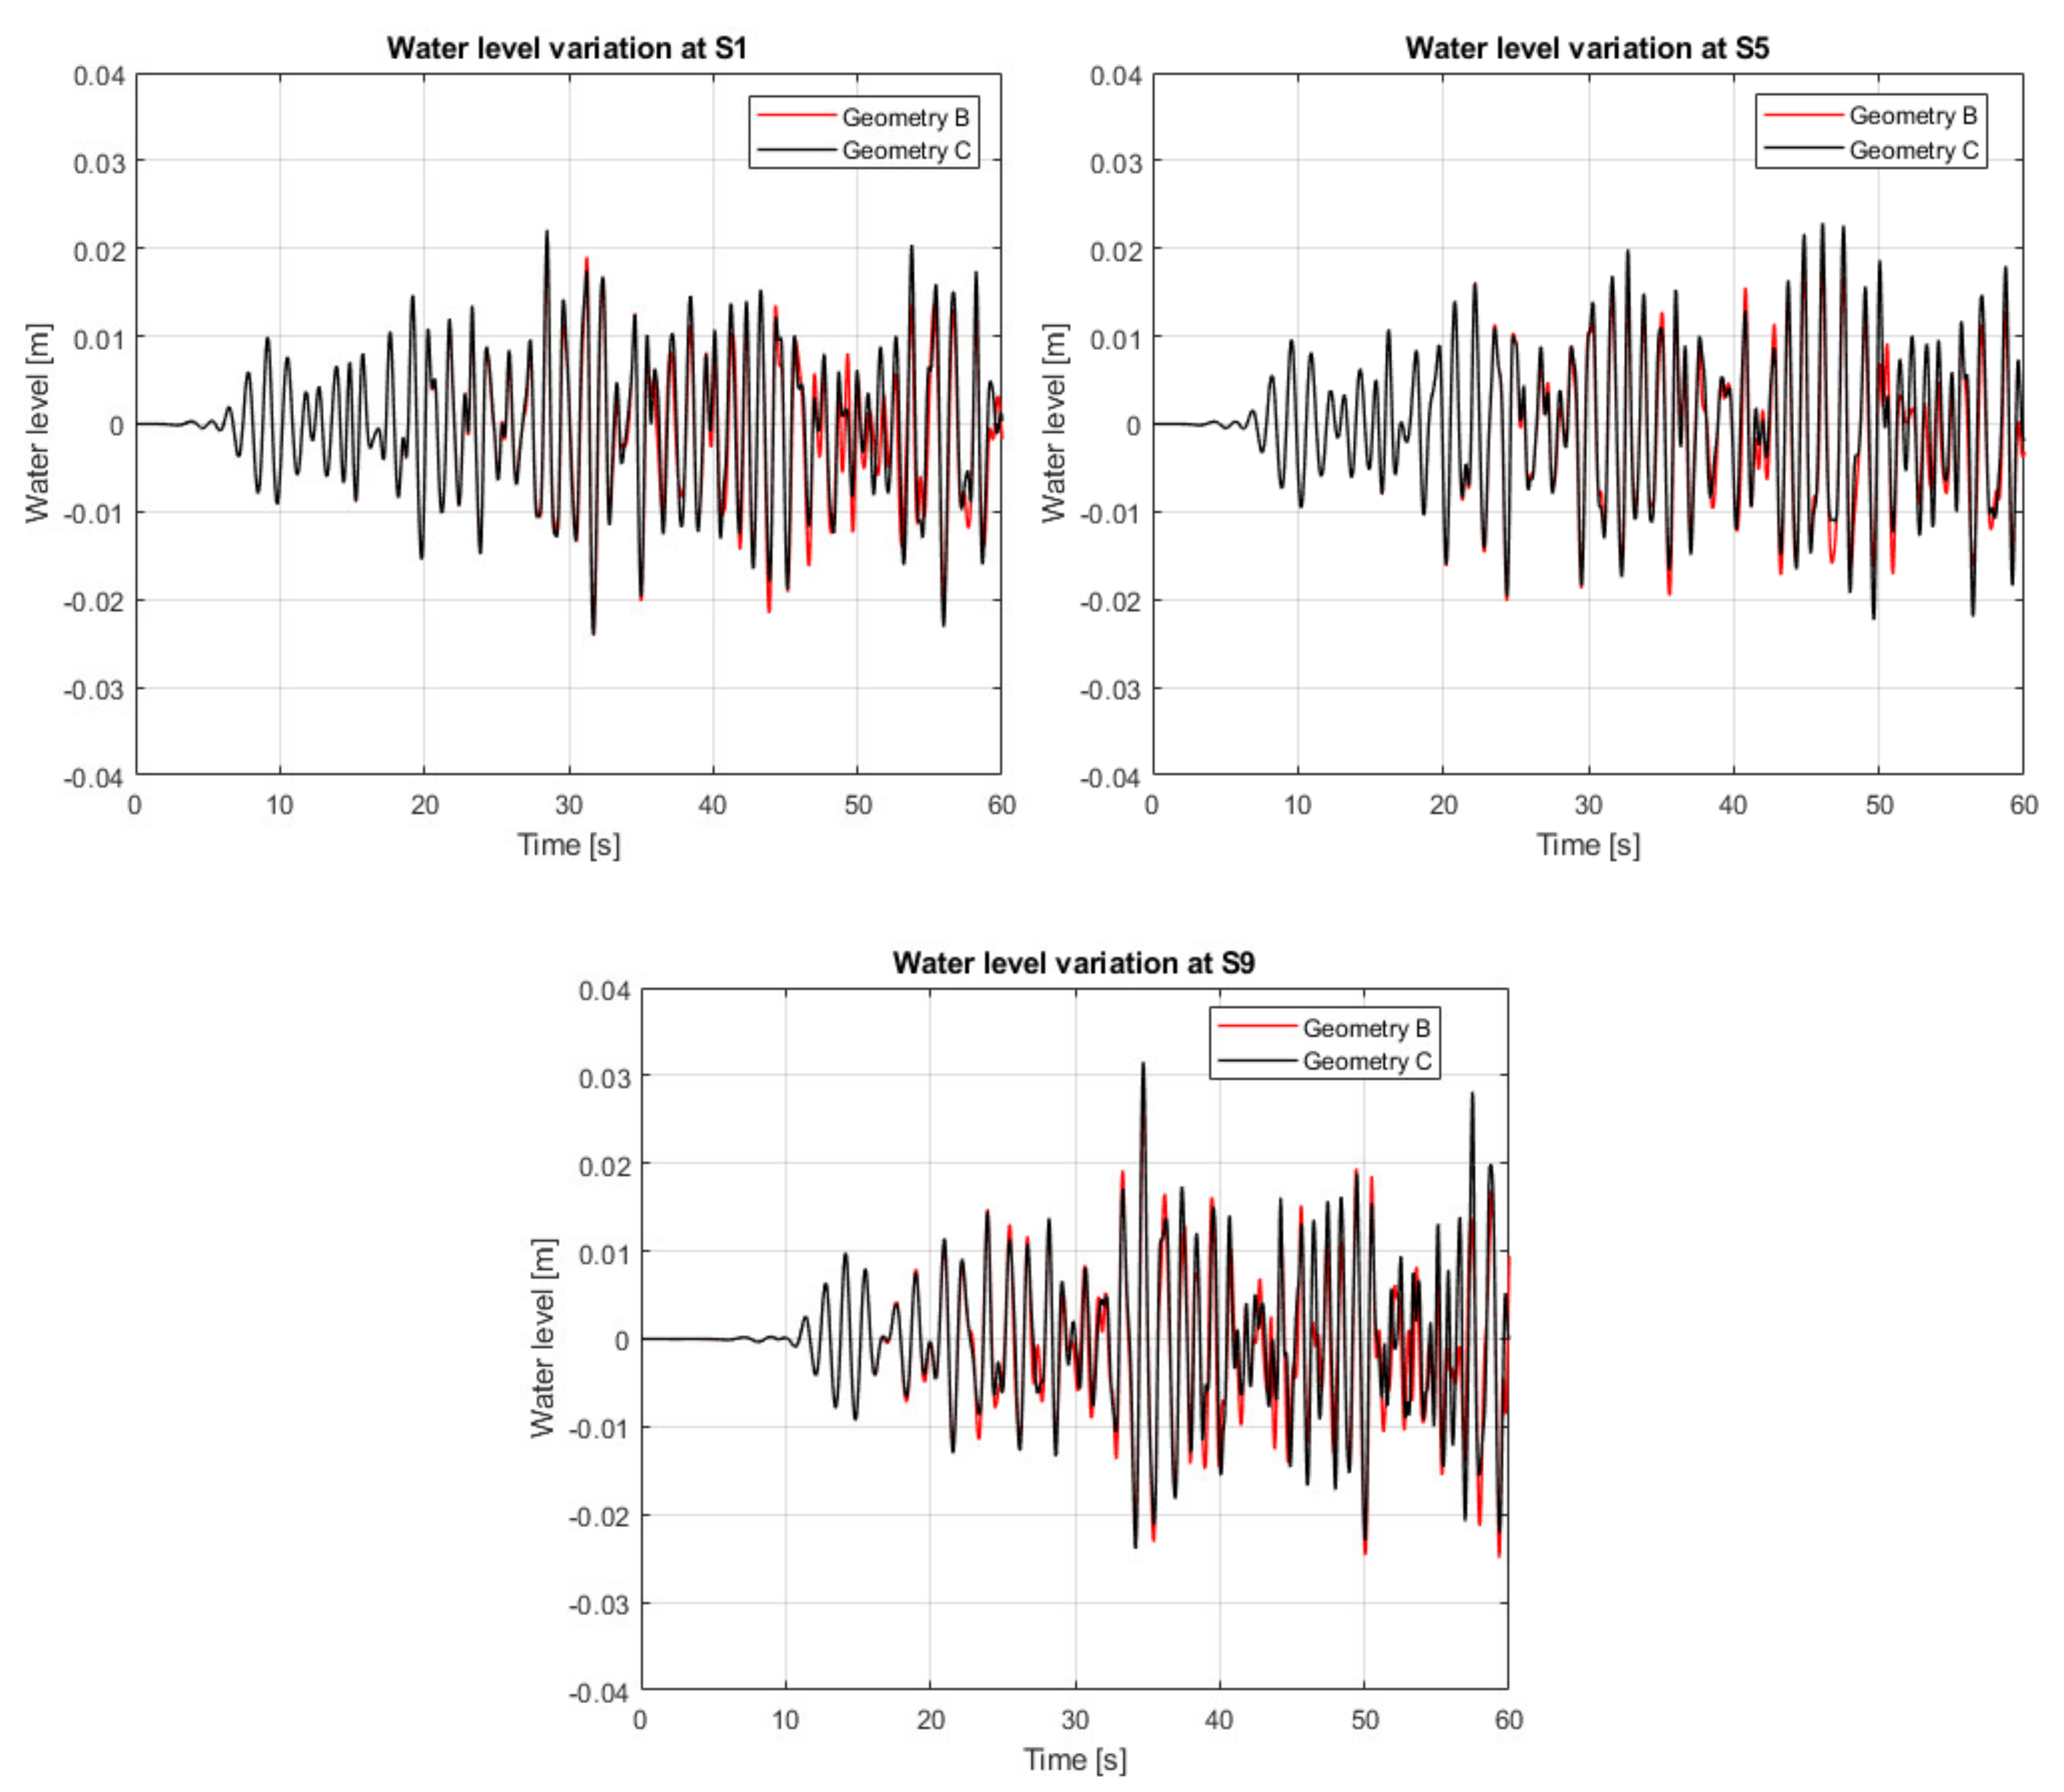
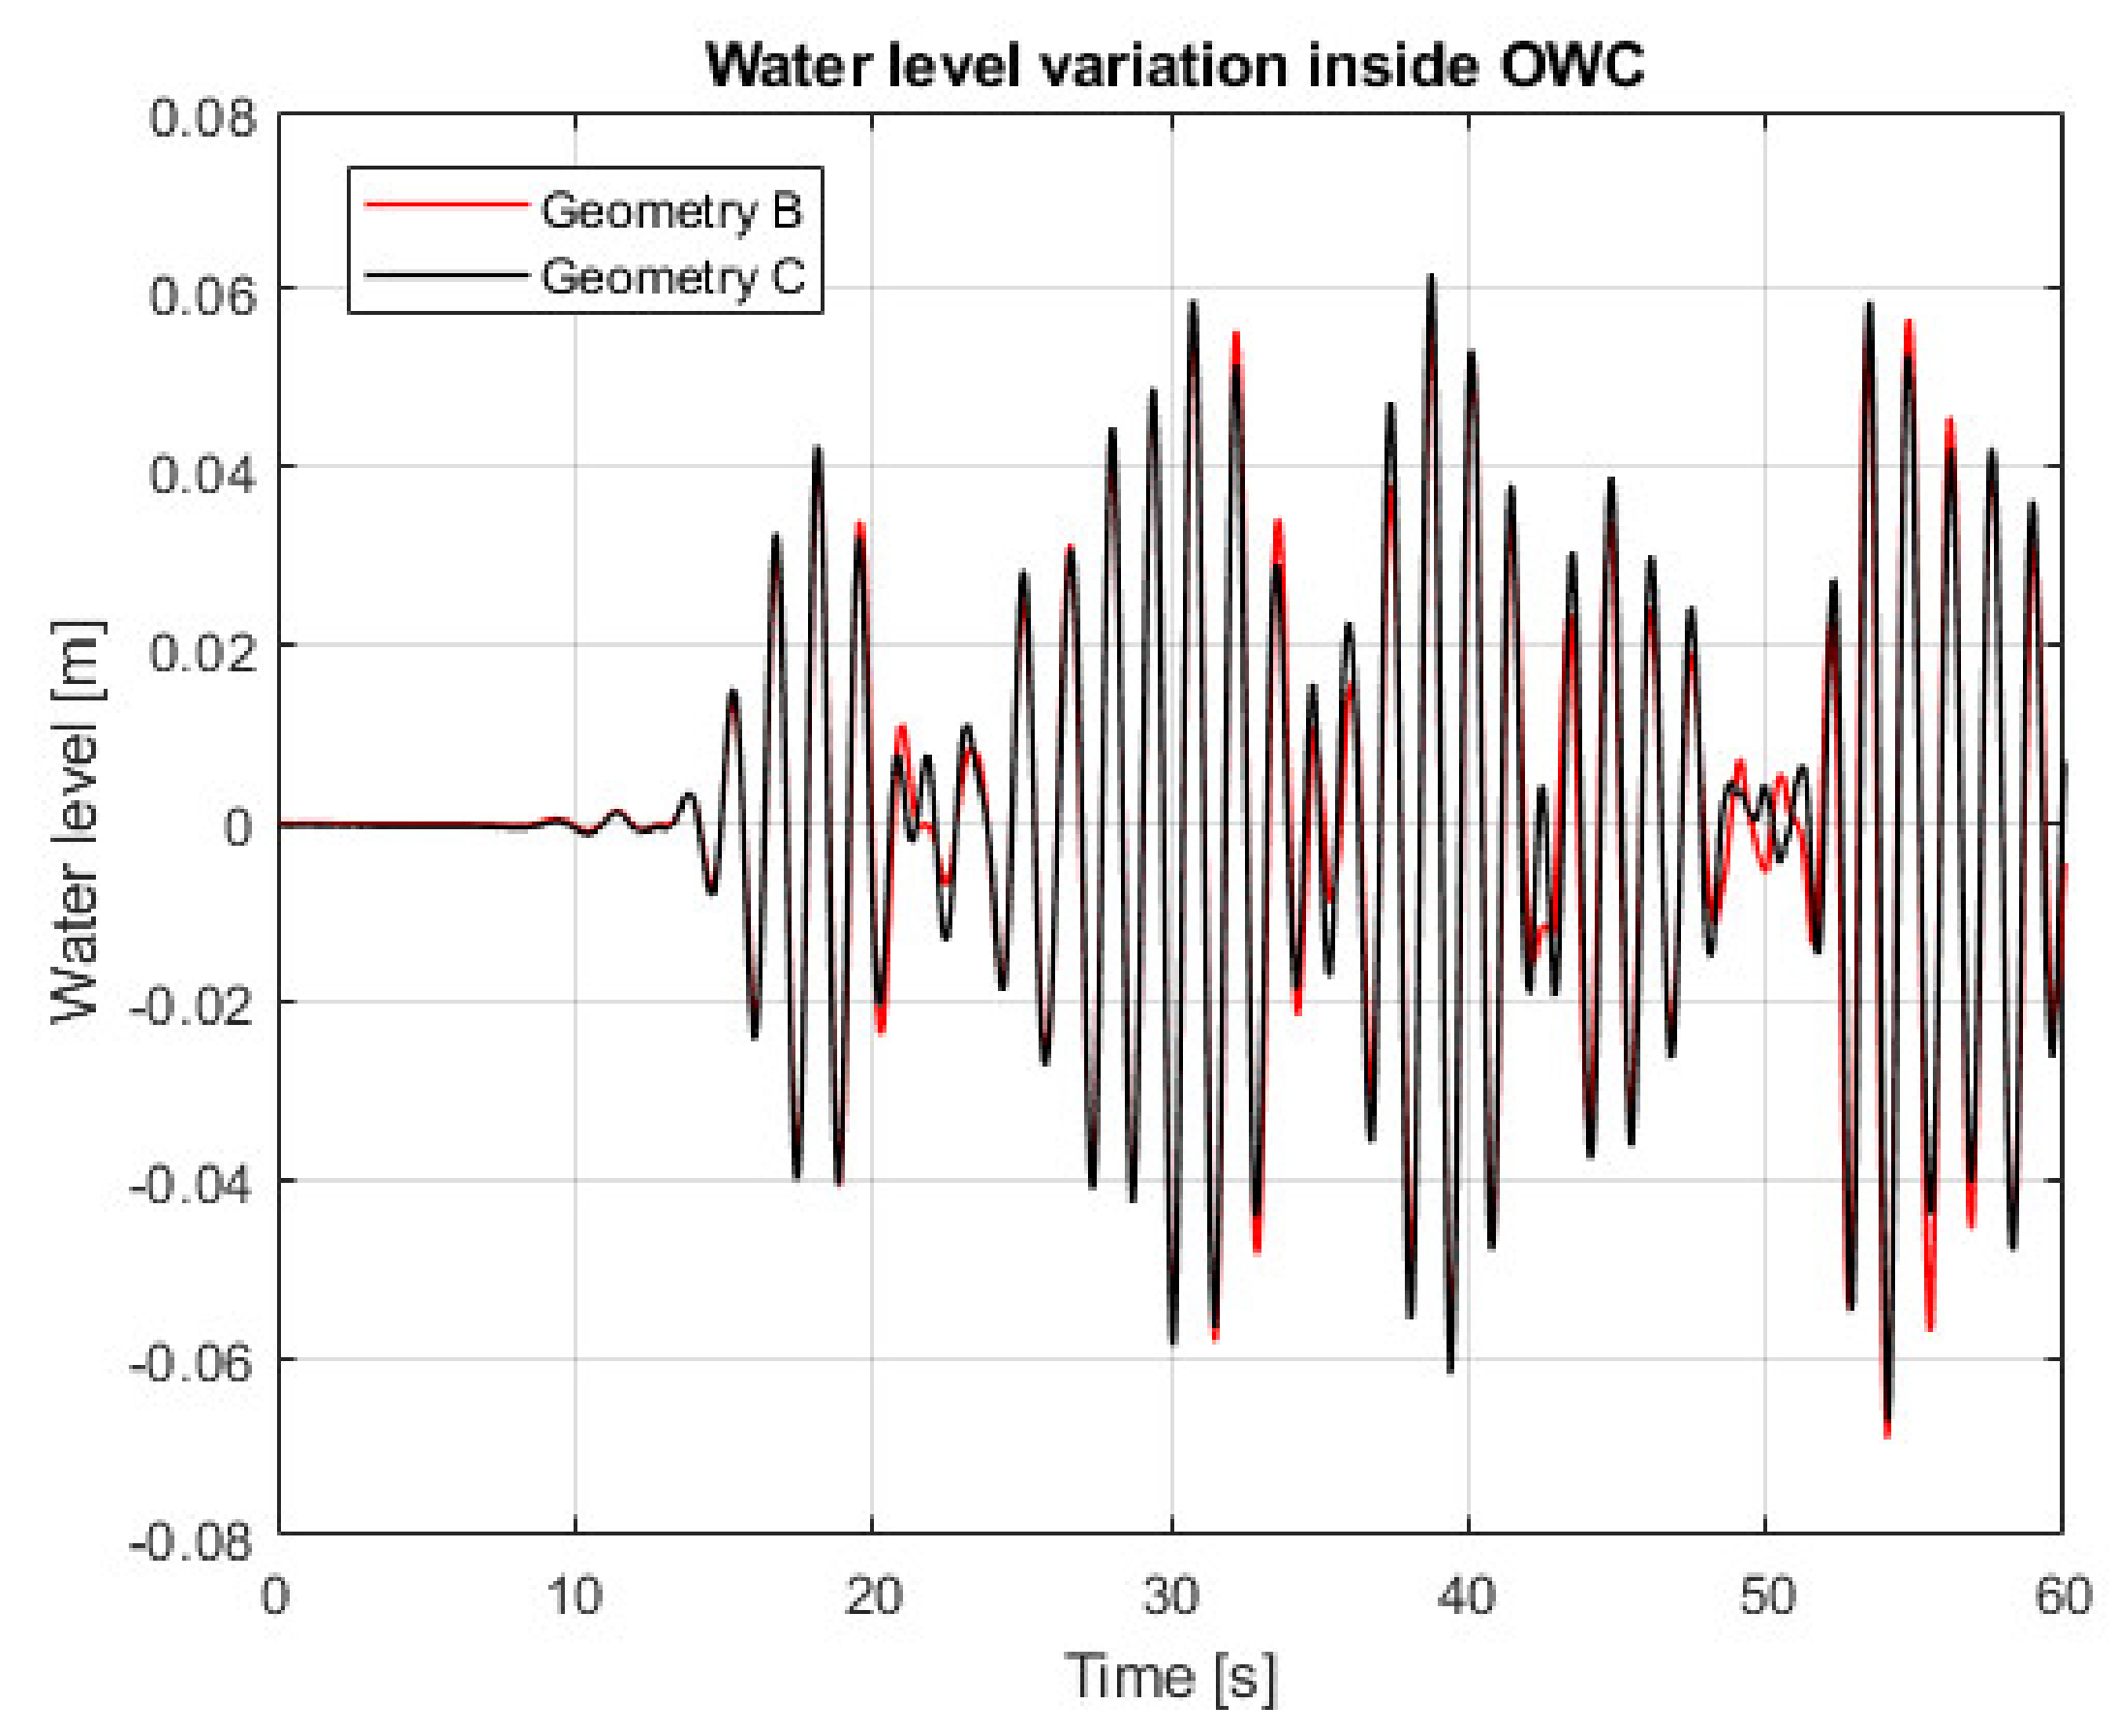
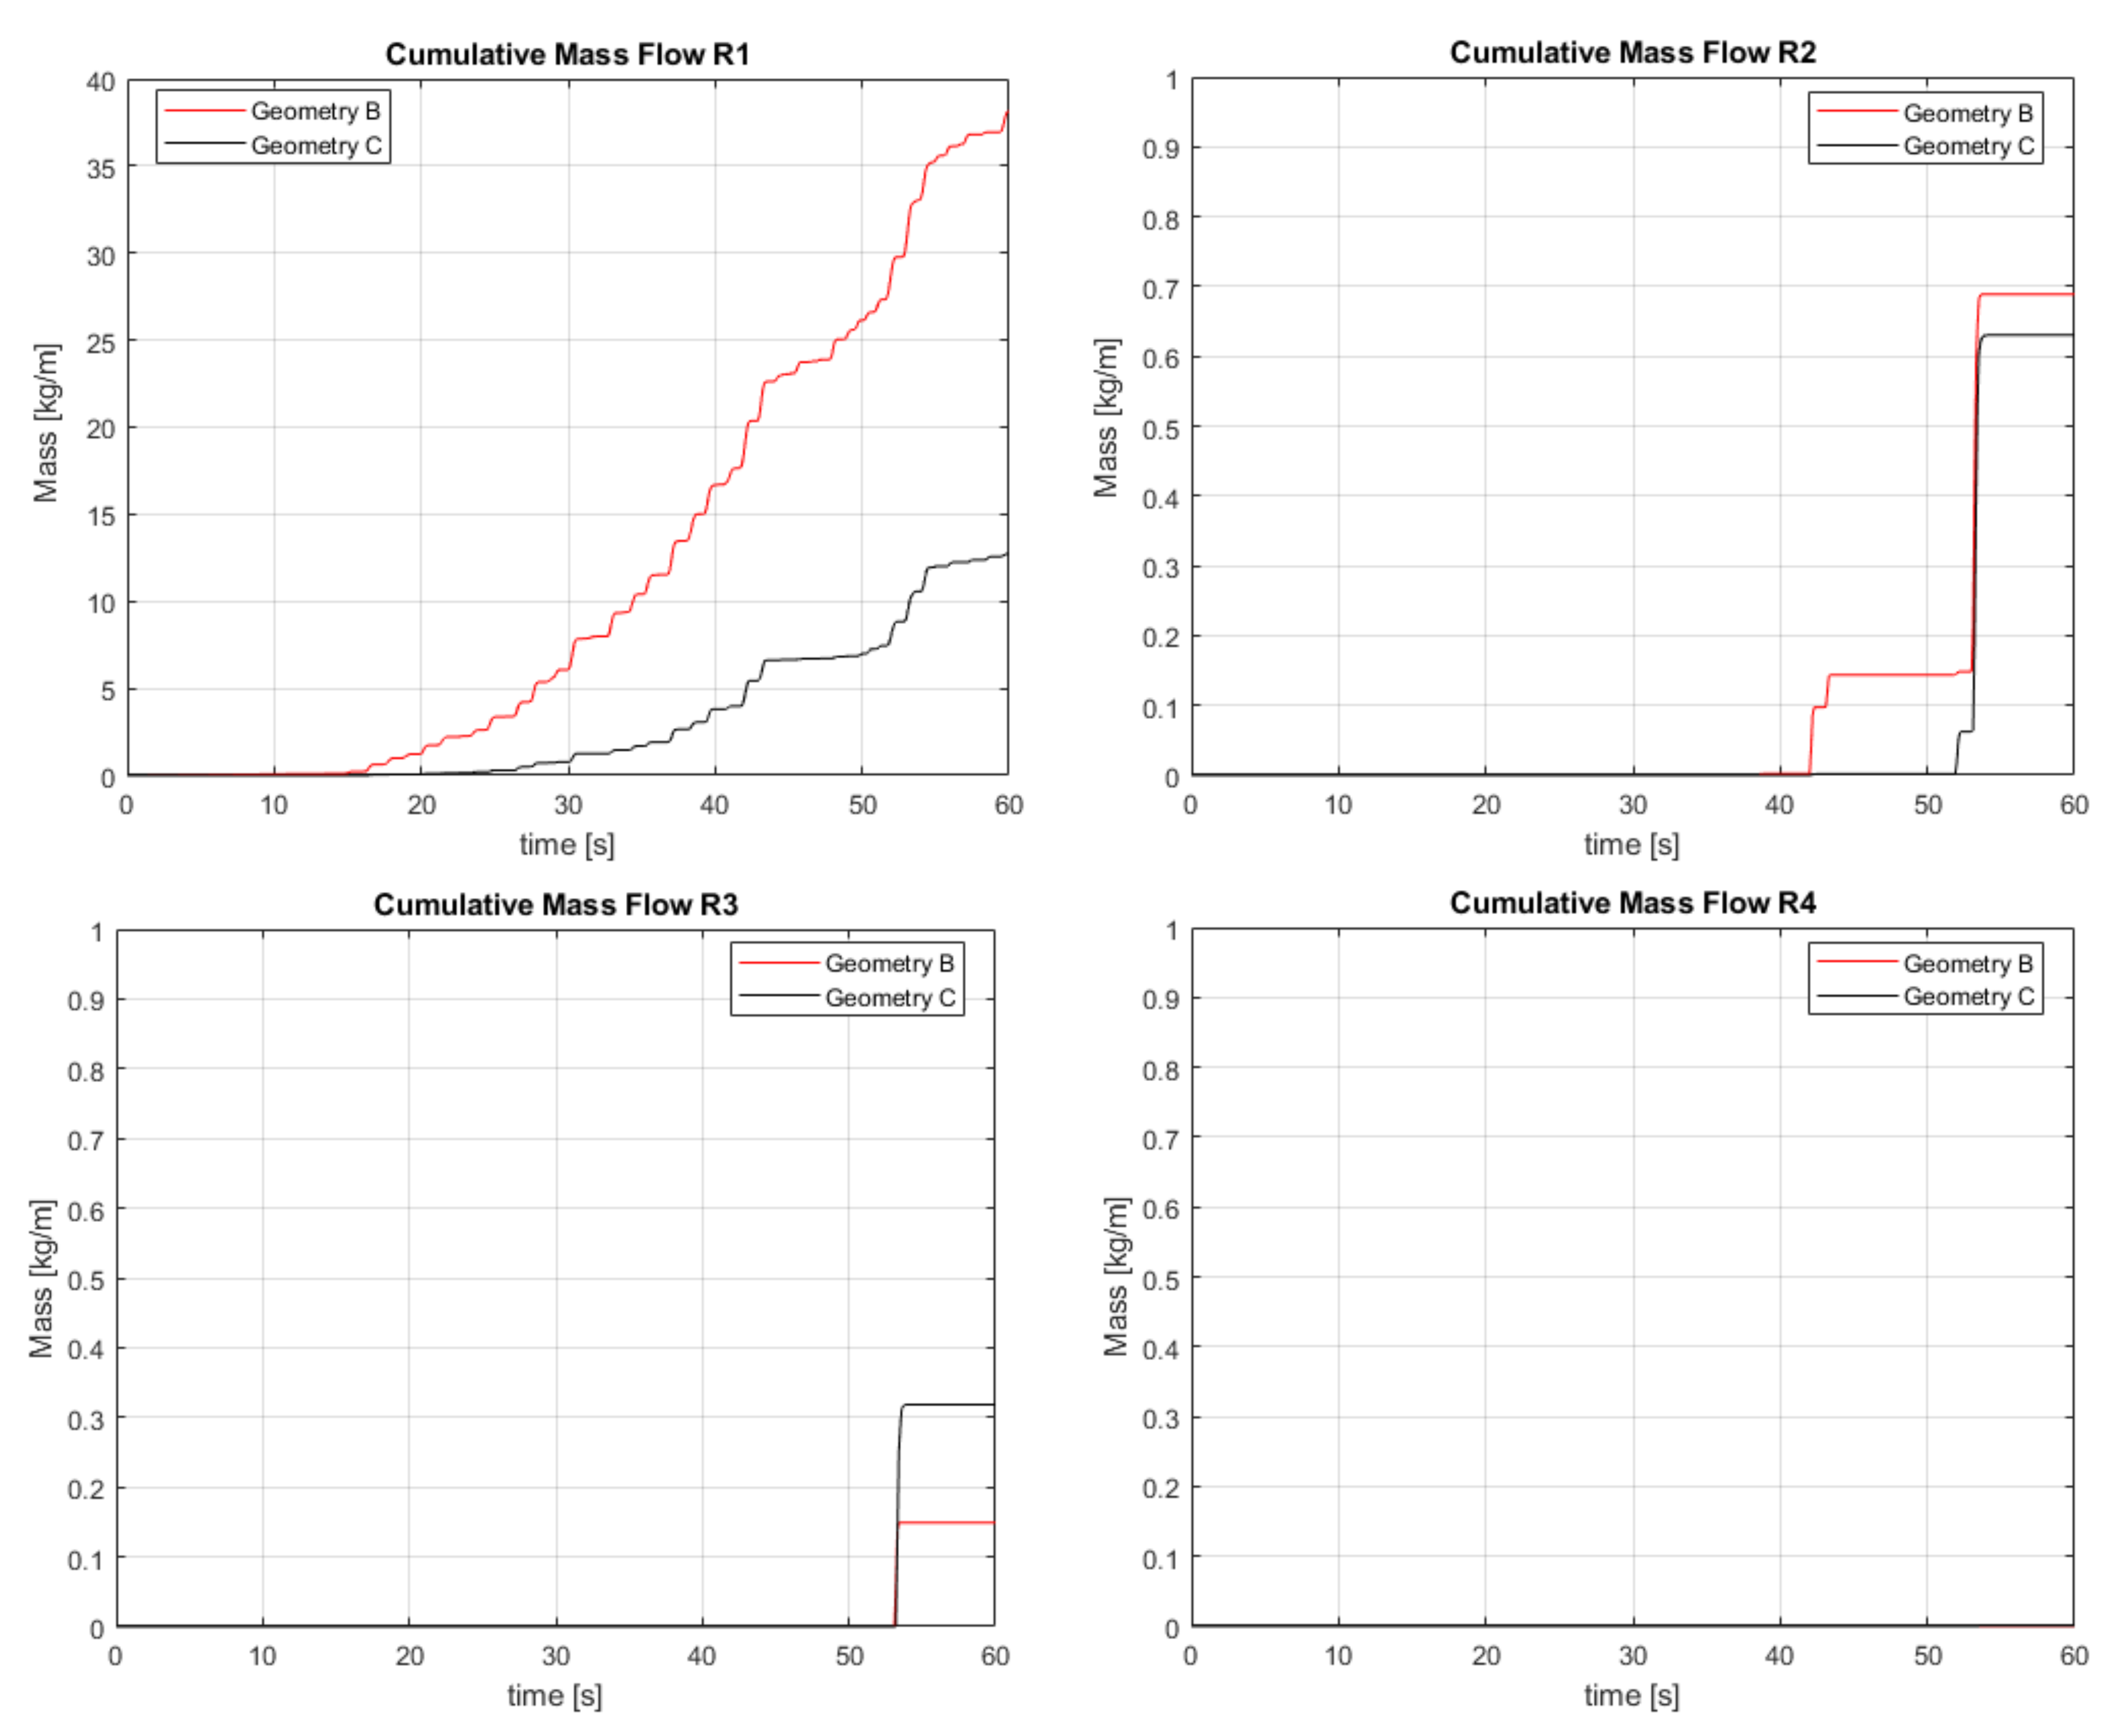
5.2.3. HWEC Geometry Optimisation

After the model validation, two alternative geometries (B and C) designed to be tested in the laboratory were also compared through numerical model simulations. From the initial testing, these two geometries seemed to be the most efficient among the three alternatives. The scope of the additional numerical simulations was to identify the most effective geometry in terms of wave overtopping in the multiple reservoirs and water oscillation inside the OWC chamber, along with providing an additional tool for geometry optimisation that is complementary to the physical model testing. In this section, the numerical results for the HWEC geometry optimisation are discussed. As noticeable in Figure 17, the two geometries are the same except for the shape of the OWC chamber inlet.
The characteristics of the numerical model domain, boundary conditions and numerical settings were the same as the ones adopted for the model validation and described in previous sections. Details of the mesh for the two geometries are presented in Figure 18. Note here that the same mesh discretisation near the HWEC and all over the domain was set for the two geometries.
The two configurations were tested considering the same incident irregular wave conditions, with Hs = 0.034 m, Tp = 1.27 s and offshore water depth, h = 0.488 m. These wave characteristics are the ones corresponding to the “Val_Test_03”.
In Figure 19 the free surface elevation at three locations (S1, S5 and S9) in the numerical wave flume is displayed for the two configurations, while Figure 20 shows the comparison of the water level oscillation inside the OWC.
Regarding the wave field in the wave flume, results indicates that the two different configurations have no significant effect on it and only some small differences of the free surface elevation can be observed. This behaviour was later verified in the physical model testing. In the experiments the difference in the reflection coefficient between the two geometries was small. Results on the water oscillation inside the OWC between the two geometries are also very similar, as shown in Figure 20, though slightly better for Geometry B.
Regarding the overtopping discharges into the different OTD reservoirs, translated into mass flow (kg/m), bigger differences between the two geometries are observed (Figure 21). In the two lowest reservoirs (R1 and R2), in which the discharge is significant, larger wave overtopping can be noted for Geometry B. This configuration is much more efficient than Geometry C, with wave overtopping larger in Geometry B than the one calculated for C. This is an expected response according to Cabral et al. [50] since the special ramp near the OWC entrance channel in Geometry B was designed for leading more overtopping into the reservoirs. For the upper two reservoirs (R3 and R4) the amount of overtopping is very small, so the difference between the two geometries is not well captured. According to these results, the performance of the Geometry B HWEC was better than Geometry C HWEC, mostly due to the larger computed wave overtopping into the OTD reservoirs. This preliminary finding obtained by the CFD modelling was also confirmed later by Cabral et al. [50] when testing the different geometries in laboratory. More specifically, for the same wave period tested, the hydraulic efficiency of Geometry B was greater compared to the one of Geometry C.

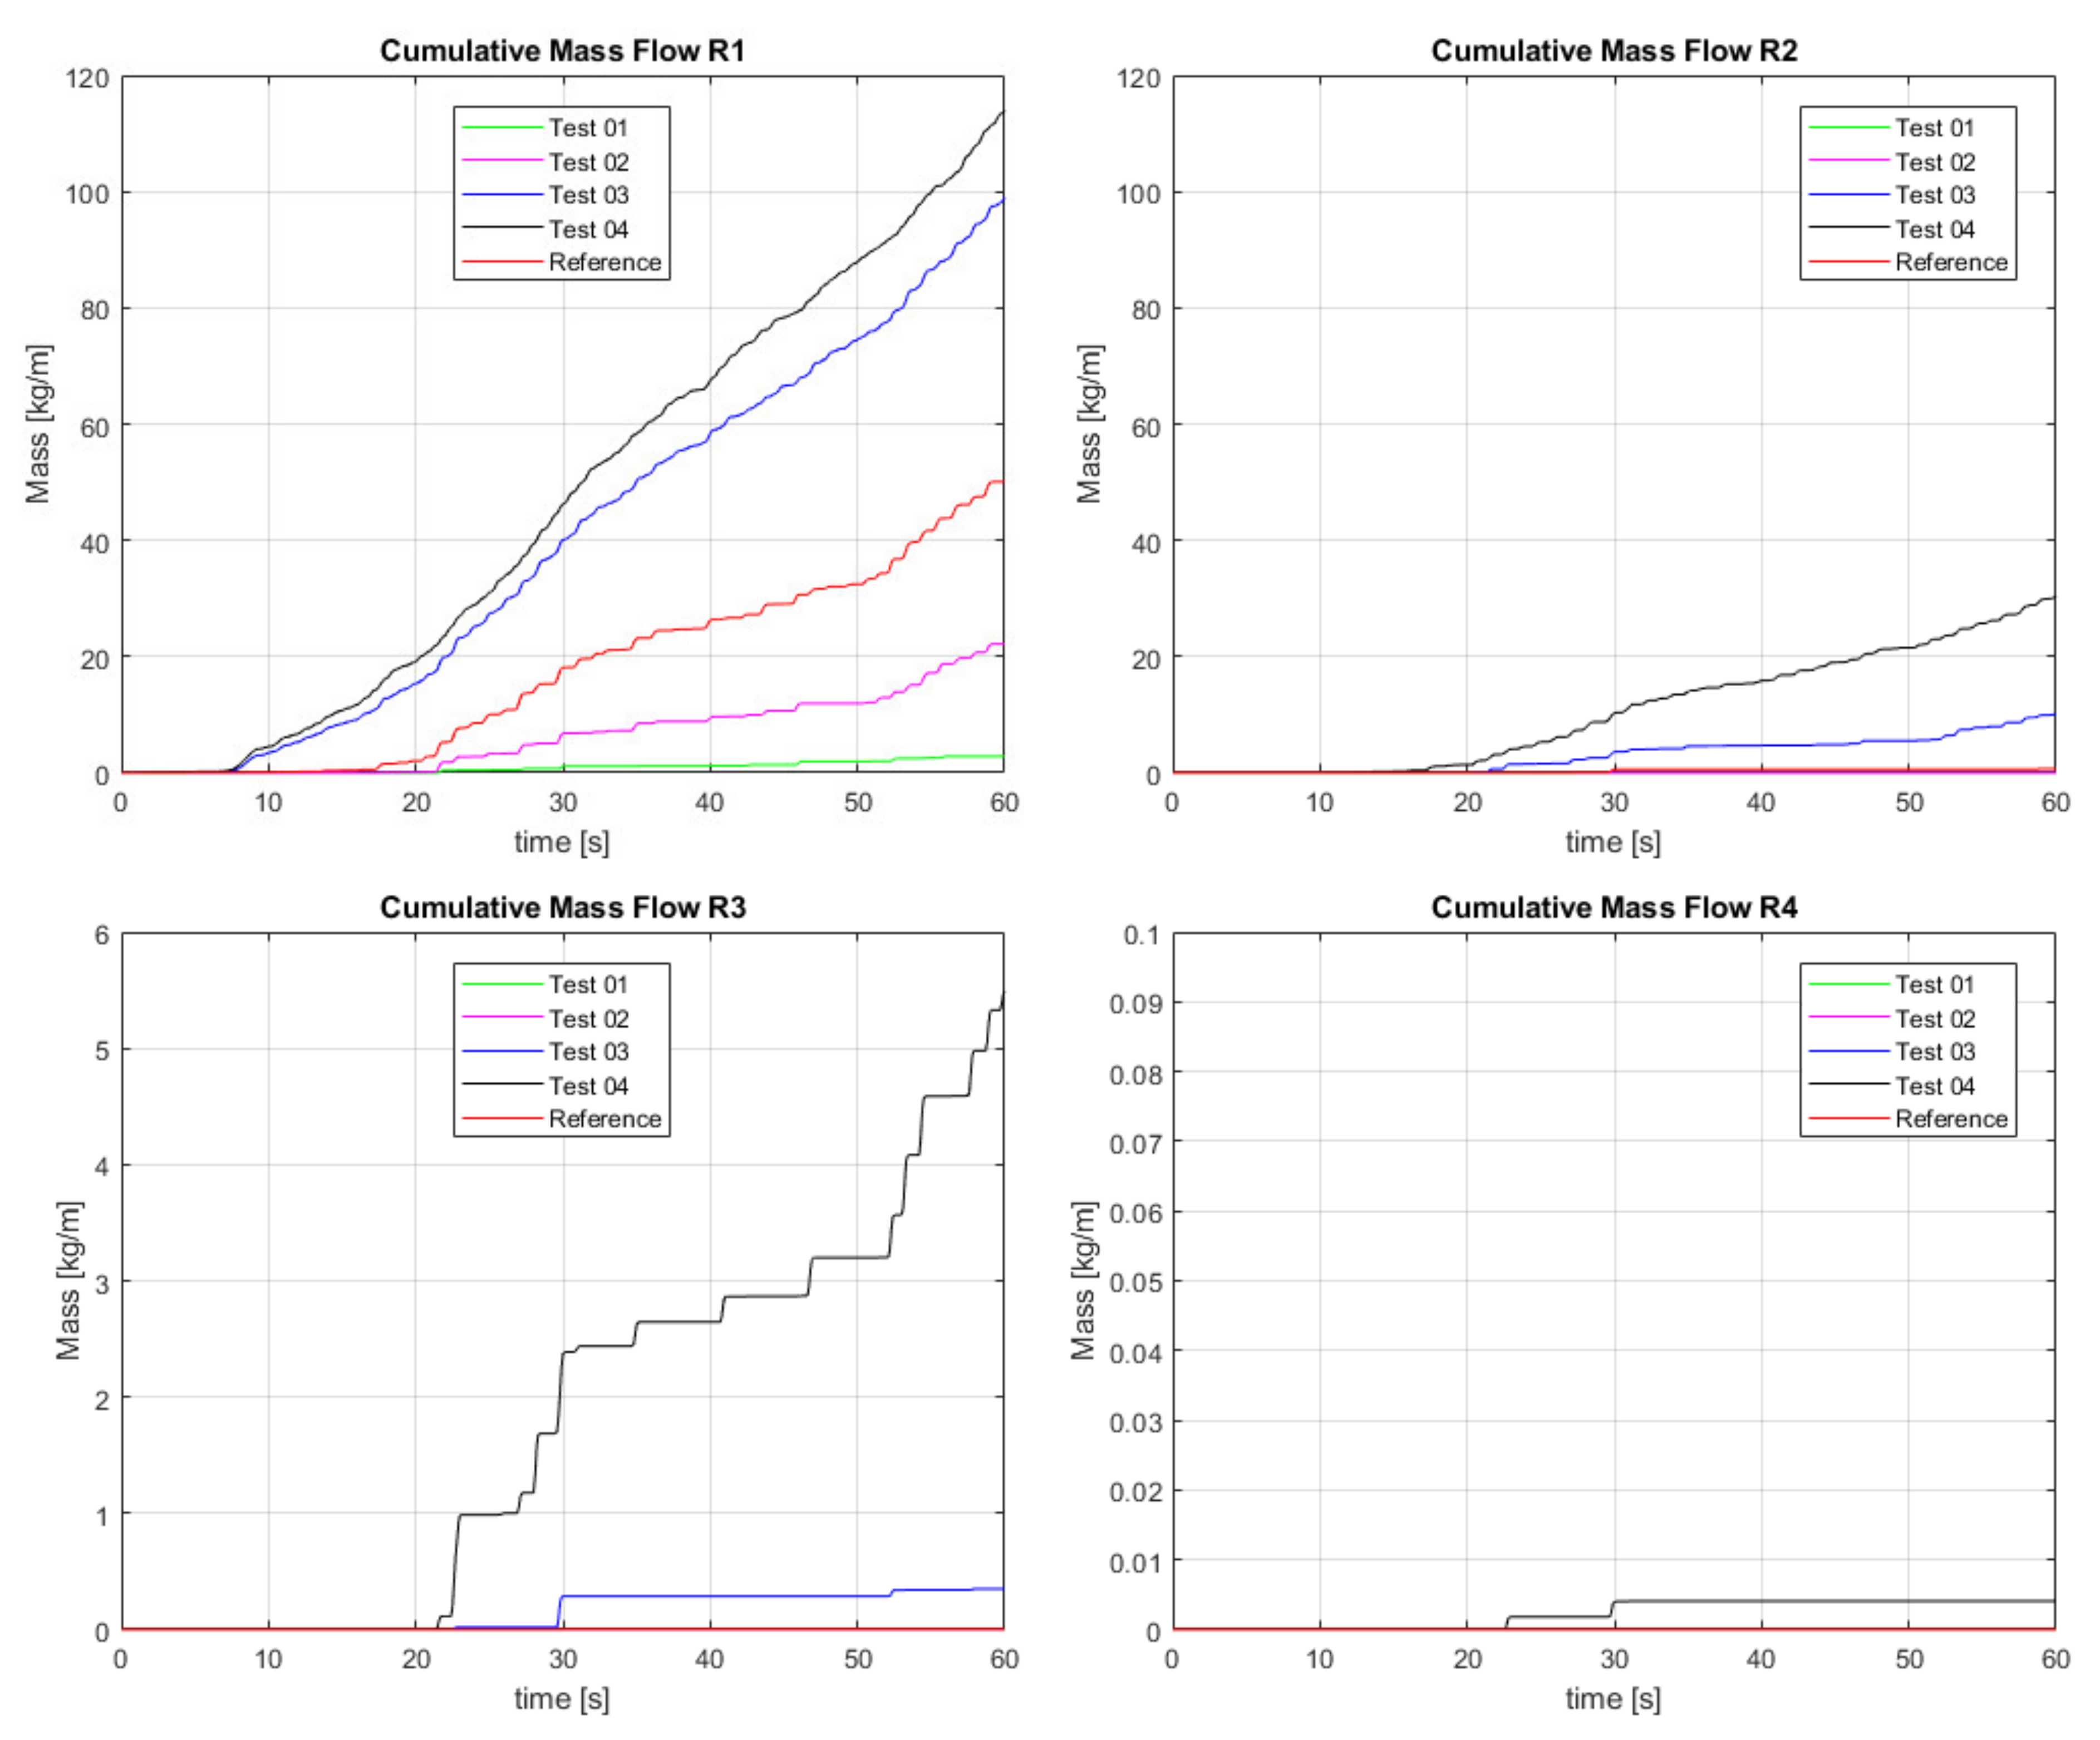
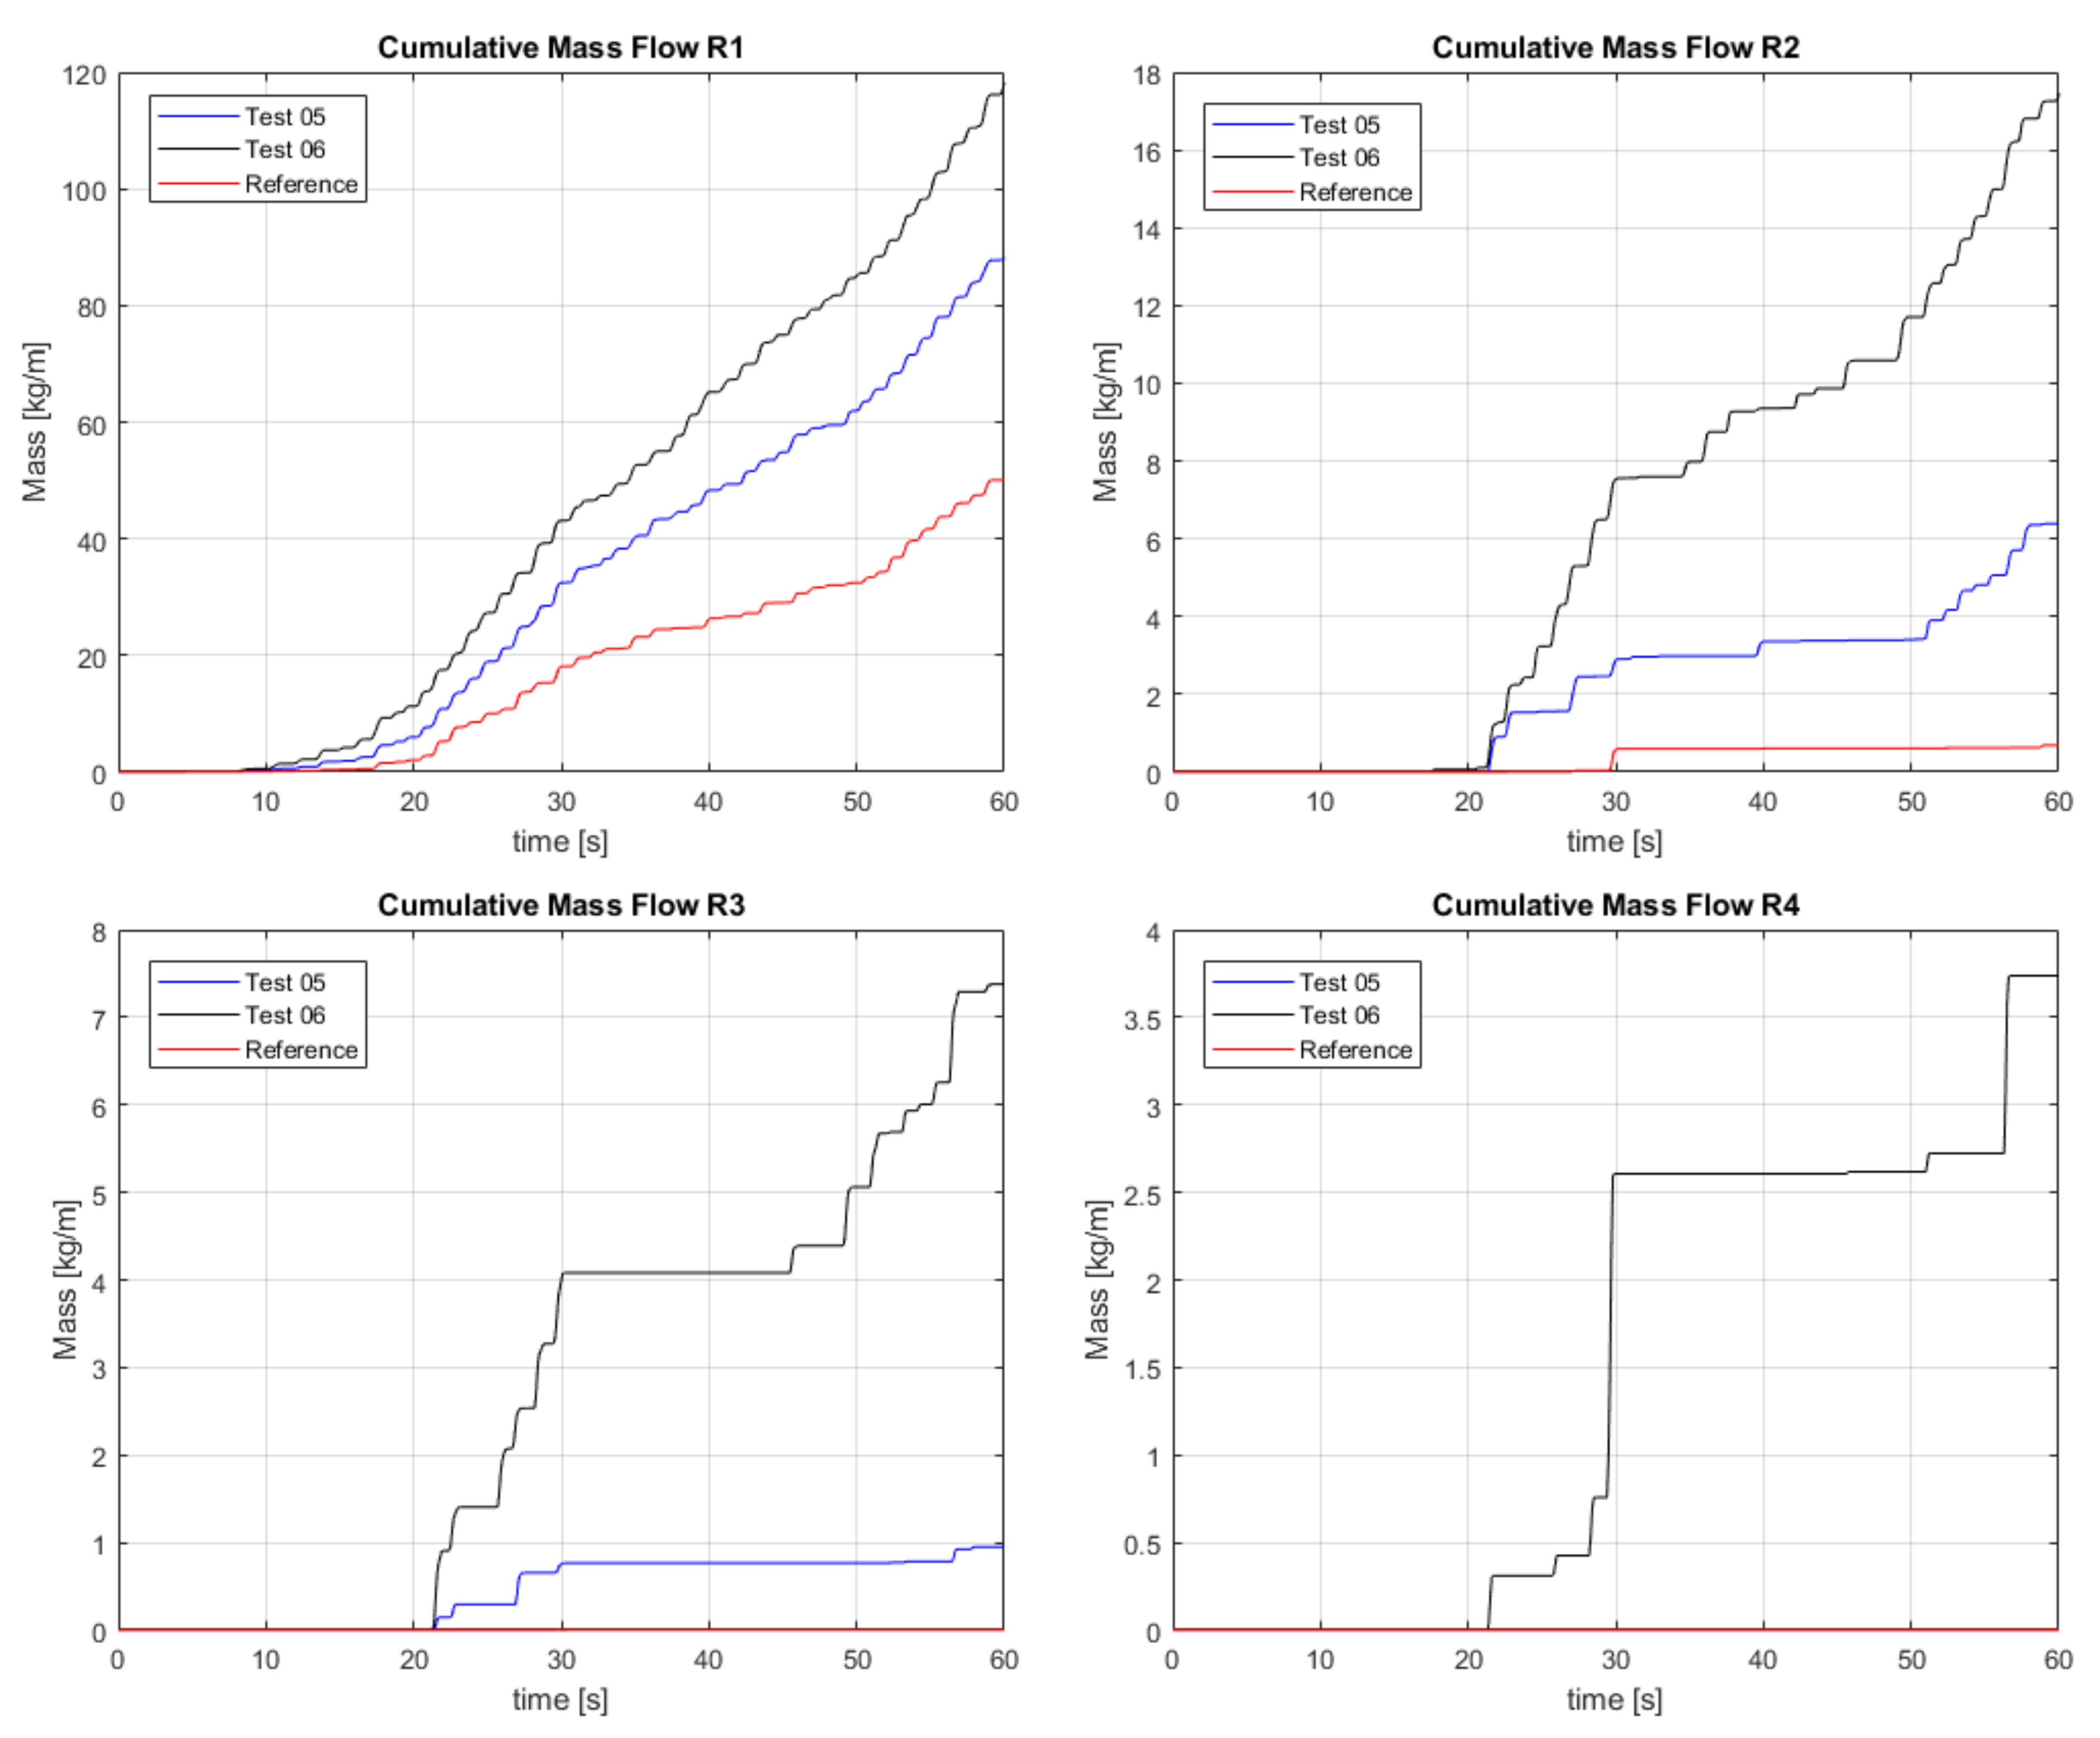
5.2.4. Hydraulic Performance

Once the results of the numerical model were validated against the measured data and the most effective geometry was identified, additional numerical simulations with the most effective geometry (Geometry B) were performed in order to extend the physical model test programme with wave characteristics and water level conditions not tested in laboratory. The additional simulations were performed assuming irregular waves on the Froude scale model of the prototype breakwater at the Port of Leixões constructed to a 1:50 geometrical scale. Table 2 summarises the significant wave height, Hs, peak period, Tp, and offshore water depth, h, in the additional numerical tests.
It is well known from the literature that tide can have a great (negative) impact on the energy production, in particular on the OTD device. Therefore, in order to evaluate the effect of the still water level on the performance of the HWEC, four additional different offshore water depths were tested in the numerical wave flume (Test_01 to Test_04 in Table 2). In addition, in order to investigate the influence of the significant wave height Hs on the wave overtopping discharges and water oscillation inside the OWC chamber, two additional cases were examined (Test_05 and Test_06 in Table 2). In these two cases, the still water level was set equal to the level tested in laboratory (h = 0.488 m), representing the MWL in prototype scale in front of the Port of Leixões. Note that all the additional numerical tests were carried out considering a constant peak wave period Tp = 1.27 s.
The effect of the offshore water depth was initially investigated considering the results of the overtopping discharges into the four reservoirs of the HWEC device. As expected, as the still water level increases, the cumulative overtopping discharge, translated in mass flow (kg/m), inside the reservoirs increases, as displayed in Figure 22. This is noticeable in the lowermost reservoir (R1), as the waves overtop the crest and reach the corresponding sink in all cases. In the second and third reservoirs (R2 and R3) overtopping occurs only in the cases where the still water level is above the mean water level (Test_03 and Test_04) and, especially in the third reservoir, the discharge is not significant. Almost no overtopping is observed in the uppermost sink.
The effect of Hs on the wave overtopping discharges in the reservoirs was also investigated with Test_05 and Test_06. This is clearly shown in Figure 23 for the lowest reservoir (R1), which is continuously overtopped for almost every incident wave, with larger water discharges calculated. In the second and the third reservoirs (R2 and R3) the trend is similar, but the discharges are smaller. Finally, in the uppermost reservoir (R4) overtopping occurs only in the case of the larger significant wave height (Test_06).
Regarding the effect of the offshore water depth on the water level oscillation inside the OWC, results show that an increase in the still water level leads to a decrease in the water oscillations inside the OWC (Figure 24—left panel). As can be noted, highest oscillations occur for Test_01 which is characterised by the smallest still water level. The same trend is observed in Figure 24—right panel which presents the effect of the still water level on the amplification coefficient. The amplification coefficient has been derived by dividing the free surface elevation with the significant wave height, Hs. It is obvious that as the still water level increases, the amplification coefficient is decreasing.
On the other hand, increasing Hs leads to an increase in the water oscillation inside the OWC chamber, as shown in Figure 25—left panel. Nevertheless, the influence of Hs on the amplification coefficient which is derived from the division of the free surface elevation with the corresponding Hs is opposite (Figure 25—right panel). As the wave height increases the amplification coefficient decreases, as expected.

6. Conclusions

Breakwater-integrated wave energy converters for harbour defence are being investigated in scale model tests, numerical models and full scale demonstrators for over 20 years now. Results to date show that, for most cases, the efficiency of the non-conventional breakwaters in terms of hydraulic performance is similar or even better compared to that of conventional structures. With respect to the structural response/stability of the non-conventional breakwaters, there is no evidence to date of fundamental negative impacts affecting the overall stability of the structure that are specific to the integration. Both these aspects—i.e., no detrimental effect to the hydraulic performance and structural response/stability, thereby not affecting the primary function of the breakwater that is providing sheltered conditions for port operations to develop—were corroborated by the first findings in the present research. The preliminary research findings further demonstrate that the integration is viable in both rubble mound and vertical breakwaters.
As far as electricity production go, the research suggests that the efficiency of land installed wave energy devices in converting wave power into electricity highly depends on the range of hydrodynamic conditions—i.e., waves and tidal levels—at the site and their variability. In the present research, hybridisation of suitable Wave Energy Converter (WEC) technologies for being integrated into harbour defence structures is hypothesised as an adequate approach to harness the available wave energy resource most efficiently over a wide range of metocean conditions. The underlying breakthrough idea is that hybridisation enables to exploit the strengths of each stand-alone technology and help overcome individual limitations and weaknesses. By comparing said suitable technologies through a multi-criteria analysis considering cost-effectiveness, constructability, WEC level of maturity, scalability/modularity, maintenance, reliability, etc. it was found that the preferred concepts for a hybridisation-based WEC technology for use in multi-purpose breakwaters are the Oscillating Water Column (OWC) and the Overtopping Device (OTD), which use two well understood power generating technologies, respectively, an air turbine and a water turbine.
The proof of concept of the innovative hybrid-WEC (HWEC) devised in the present research is based on a composite modelling approach combining physical and numerical modelling. The prototype breakwater and environmental conditions in the physical and numerical models are based upon on the rubble-mound cross-section proposed for the extension of the north breakwater of the Port of Leixões in Portugal. While the results of the physical model testing constructed to a scale of 1:50 are more extensively discussed in other papers (see e.g., [12,50,51]), this paper discusses the two-dimensional numerical modelling of the HWEC using the Computational Fluid Dynamics (CFD) software ANSYS Fluent.
The rubble-mound breakwater-integrated HWEC tested with ANSYS Fluent replicated the physical model tests performed by Cabral et al. [50]. Despite the non-conventional geometry of the HWEC device and complex wave-structure interactions, the numerical simulations showed that the ANSYS Fluent software is able to correctly reproduce the wave field in front of the breakwater, as well as the wave overtopping into the reservoirs and the water level oscillation on the OWC chamber, as measured in the laboratory. Once validated, the CFD model was used to test different geometrical configurations of the OWC entrance and identify the most effective geometry from a number of alternatives. The results obtained indicate that the OWC entrance plays a significant role in the overtopping discharges, since the tested alternatives imposed modifications in the front ramp of the OTD device. Impacts on the water oscillation inside the OWC chamber were also assessed relevant in the numerical modelling, similarly to what was concluded from the experimental testing. In fact, the optimization of the geometry of the HWEC with respect to one of the wave energy conversion principles was found to have relevant negative impacts on the other. Hence, the selected geometry for the HWEC is the one leading to the highest efficiencies and overall energy production. It should be stressed that the hydraulic/pneumatic and overall efficiencies reached 44% and 27%, respectively in the experimental testing, which shows the interest and the potential of this innovative hybrid-based technology.
Finally, additional numerical simulations with the most effective geometry were performed in order to extend the physical model testing programme to more water levels and wave conditions. These simulations confirmed the effect of the water level and wave conditions on both the overtopping discharges and water oscillations inside the OWC chamber. In the next phase of the breakwater-integrated HWEC development, three-dimensional numerical simulations will be carried out to better characterise and enhance the efficiency of the hybrid-based technology in converting wave power in electricity, including an estimation of the hydro- and aerodynamic coefficients for the design of the turbines. Moreover, a new experimental testing campaign will be performed to characterise wave loading on the structural elements of the HWEC, as well as to allow a higher resolution assessment of the impact of this technology on the rubble-mound breakwater. The new data and insights will be important to obtain an accurate estimation of the Levelised Cost of Energy (LCoE) of the HWEC technology.
The first findings in the present research further indicate that, for the same multi-purpose breakwater and compared to the stand-alone WEC devices, the hybridisation-based WEC technology is a credible approach to reduce the LCoE.

Author Contributions

CFD-model set-up and simulations were done by IMDC (T.I.K.; E.D.L.; L.d.N.). The conceptualisation and execution of the physical model testing programme was of the responsibility of FEUP (T.C.-C.; P.R.-S.; F.T.-P.). The post-processing of the composite modelling approach results was done by IMDC (T.I.K.; E.D.L.; L.d.N.). The funding acquisition was the responsibility of the senior researchers of the R&D project (L.d.N.; F.T.-P.; P.R.-S.). All authors have read and agreed to the published version of the manuscript.

Funding

This research was funded by the OCEANERA-NET Second Joint Call 2016 project SE@PORTS—Sustainable Energy at sea PORTS (proposal ID 325), with the reference HBC.2016.0323 under the frame of Agentschap Innoveren en Ondernemen (VLAIO), as well as by the OCEANERA-NET Second Joint Call 2019 project WEC4PORTS—a hybrid Wave Energy Converter for PORTS (proposal ID 5111), with the references HBC.2019.2443, under the frame of Agentschap Innoveren en Ondernemen (VLAIO), and OCEANERA/0004/2019, under the frame of FCT—Fundação para a Ciência e a Tecnologia.

Acknowledgments

The authors wish to acknowledge the remainder partners of the SE@Ports consortium, namely INEGI (project Coordinator), IH Cantabria, PLOCAN and Fórum Oceano. Furthermore, the authors are in debt to LNEC (Laboratório Nacional de Engenharia Civil), which lent the Antifer units used to materialise the armour layer of the reference breakwater model, to INEGI, who produced the HWEC physical model, and to the Port Authority of Douro, Leixões, and Viana do Castelo, for all the information provided to characterise the case study. João Henriques (from Instituto Superior Técnico) provided important contributions to the testing and control of the PTO system used in the OWC module.

Conflicts of Interest

The authors declare no conflict of interest. The funders had no role in the design of the study; in the collection, analyses or interpretation of data; in the writing of the manuscript, or in the decision to publish the results.

References

  1. Barstow, S.; Mørk, G.; Mollison, D.; Cruz, J. The wave energy resource. In Ocean Wave Energy; Springer: Berlin/Heidelberg, Germany, 2008; pp. 93–132. [Google Scholar]
  2. Greaves, D.; Iglesias, G. Wave and Tidal Energy; Wiley Online Library: Hoboken, NJ, USA, 2018; ISBN 9781119014447. Online ISBN 9781119014492. [Google Scholar] [CrossRef]
  3. Magagna, D.; Uihlein, A. 2014 JRC Ocean Energy Status Report; European Commission Joint Research Centre: Ispra, Italy, 2015. [Google Scholar]
  4. Torre-Enciso, Y.; Ortubia, I.; De Aguileta, L.L.; Marqués, J. Mutriku wave power plant: From the thinking out to the reality. In Proceedings of the 8th European Wave and Tidal Energy Conference, Uppsala, Sweden, 7–10 September 2009; Volume 710. [Google Scholar]
  5. Arena, F.; Romolo, A.; Malara, G.; Fiamma, V.; Laface, V. The first worldwide application at full-scale of the REWEC3 device in the Port of Civitavecchia: Initial energetic performances. In Progress in Renewable Energies Offshore, Proceedings of the 2nd International Conference on Renewable Energies Offshore (RENEW2016), Lisbon, Portugal, 24–26 October 2016; Taylor & Francis Group: London, UK, 2016; p. 303. [Google Scholar]
  6. Contestabile, P.; Crispino, G.; Di Lauro, E.; Ferrante, V.; Gisonni, C.; Vicinanza, D. Overtopping breakwater for wave Energy Conversion: Review of state of art, recent advancements and what lies ahead. Renew. Energy 2020, 147, 705–718. [Google Scholar] [CrossRef]
  7. Vicinanza, D.; Contestabile, P.; Nørgaard, J.Q.H.; Andersen, T.L. Innovative rubble mound breakwaters for overtopping wave energy conversion. Coast. Eng. 2014, 88, 154–170. [Google Scholar] [CrossRef]
  8. Mustapa, M.A.; Yaakob, O.B.; Ahmed, Y.M.; Rheem, C.K.; Koh, K.K.; Adnan, F.A. Wave energy device and breakwater integration: A review. Renew. Sustain. Energy Rev. 2017, 77, 43–58. [Google Scholar] [CrossRef]
  9. Falcão, A.F.; Henriques, J.C. Oscillating-water-column wave energy converters and air turbines: A review. Renew. Energy 2016, 85, 1391–1424. [Google Scholar] [CrossRef]
  10. Vicinanza, D.; Lauro, E.D.; Contestabile, P.; Gisonni, C.; Lara, J.L.; Losada, I.J. Review of innovative harbor breakwaters for wave-energy conversion. J. Waterw. Port Coast. Ocean Eng. 2019, 145, 03119001. [Google Scholar] [CrossRef]
  11. Das Neves, L.; Samadov, Z.; Di Lauro, E.; Delecluyse, K.; Haerens, P. The integration of a hybrid Wave Energy Converter in port breakwaters. In Proceedings of the 13th European Wave and Tidal Energy Conference, Naples, Italy, 1–6 September 2019. [Google Scholar]
  12. Rosa-Santos, P.; Taveira-Pinto, F.; Clemente, D.; Cabral, T.; Fiorentin, F.; Belga, F.; Morais, T. Experimental study of a hybrid wave energy converter integrated in a harbor breakwater. J. Mar. Sci. Eng. 2019, 7, 33. [Google Scholar] [CrossRef] [Green Version]
  13. Takahashi, S. A Study on Design of a Wave Power Extracting Caisson Breakwater; Wave Power Laboratory, Port and Harbour Research Institute: Negase, Japan, 1988. [Google Scholar]
  14. Goda, Y. Random Seas and Maritime Structures. In Advanced Series on Ocean Engineering; World Scientific Publishing Company: Singapore, 2000; p. 15. [Google Scholar]
  15. Müller, G.U.; Whittaker, T.J.T. An investigation of breaking wave pressures on inclined walls. Ocean Eng. 1993, 20, 349–358. [Google Scholar] [CrossRef]
  16. Muller, G.; Whittaker, T.J.T. Field Measurements of Breaking Wave Loads on a Shoreline Wave Power Station. Proc. Inst. Civ. Eng. Water Marit. Energy 1995, 112, 187–197. [Google Scholar] [CrossRef]
  17. Jayakumar, V.S. Wave Force on Oscillating Water Column Type Wave Energy Caisson: An Experiment Study. Ph.D. Thesis, Department of Ocean Engineering, Indian Institute of Technology, Madras, India, 1994. [Google Scholar]
  18. Neumann, F.; Sarmento, A.J.N.A. OWC-caisson economy and its dependency on breaking wave design loads. In The Eleventh International Offshore and Polar Engineering Conference; International Society of Offshore and Polar Engineers: Mountain View, CA, USA, 2001. [Google Scholar]
  19. Hull, P.; Müller, G. An investigation of breaker heights, shapes and pressures. Ocean Eng. 2002, 29, 59–79. [Google Scholar] [CrossRef]
  20. Thiruvenkatasamy, K.; Neelamani, S.; Sato, M. Nonbreaking wave forces on multiresonant oscillating water column wave power caisson breakwater. J. Waterw. Port Coast. Ocean Eng. 2005, 131, 77–84. [Google Scholar] [CrossRef]
  21. Patterson, C.; Dunsire, R.; Hillier, S. Development of wave energy breakwater at Siadar, Isle of Lewis. In Coasts, Marine Structures and Breakwaters: Adapting to Change, Proceedings of the 9th International Conference Organised by the Institution of Civil Engineers, Edinburgh, UK, 16–18 September 2009; Thomas Telford Ltd.: London, UK, 2010; pp. 1–738. [Google Scholar]
  22. Huang, Y.; Shi, H.; Liu, D.; Liu, Z. Study on the breakwater caisson as oscillating water column facility. J. Ocean Univ. China 2010, 9, 244–250. [Google Scholar] [CrossRef]
  23. Liu, Y.; Shi, H.; Liu, Z.; Ma, Z. Experiment study on a new designed OWC caisson breakwater. In Proceedings of the 2011 Asia-Pacific Power and Energy Engineering Conference, Wuhan, China, 25–28 March 2011; pp. 1–5. [Google Scholar]
  24. Kuo, Y.S.; Lin, C.S.; Chung, C.Y.; Wang, Y.K. Wave loading distribution of oscillating water column caisson breakwaters under non-breaking wave forces. J. Mar. Sci. Technol. 2014, 23, 78–87. [Google Scholar]
  25. Viviano, A.; Naty, S.; Foti, E.; Bruce, T.; Allsop, W.; Vicinanza, D. Large-scale experiments on the behaviour of a generalised Oscillating Water Column under random waves. Renew. Energy 2016, 99, 875–887. [Google Scholar] [CrossRef] [Green Version]
  26. Naty, S.; Viviano, A.; Foti, E. Wave energy exploitation system integrated in the coastal structure of a Mediterranean port. Sustainability 2016, 8, 1342. [Google Scholar] [CrossRef] [Green Version]
  27. Sainflou, G. Essai sur les digues maritimes verticales. Ann. Ponts Chaussées 1928, 98, 5–48. [Google Scholar]
  28. Ashlin, S.J.; Sundar, V.; Sannasiraj, S.A. Pressures and forces on an oscillating water column–type wave energy caisson breakwater. J. Waterw. Port Coast. Ocean Eng. 2017, 143, 04017020. [Google Scholar] [CrossRef]
  29. Pawitan, K.A.; Dimakopoulos, A.S.; Vicinanza, D.; Allsop, W.; Bruce, T. A loading model for an OWC caisson based upon large-scale measurements. Coast. Eng. 2019, 145, 1–20. [Google Scholar] [CrossRef] [Green Version]
  30. Allsop, W.; Bruce, T.; Alderson, J.; Ferrante, V.; Russo, V.; Vicinanza, D.; Kudella, M. Large scale test on a generalised oscillating water column wave energy converter. In Proceedings of the HYDRALAB IV Joint User Meeting, Lisbon, Portugal, 2–4 July 2014. [Google Scholar]
  31. Zanuttigh, B.; Margheritini, L.; Gambles, L.; Martinelli, L. Analysis of wave reflection from wave energy converters installed as breakwaters in harbour. In Proceedings of the European Wave and Tidal Energy Conference (EWTEC), Uppsala, Sweden, 7–10 September 2009. [Google Scholar]
  32. US Army Corps of Engineers. Coastal Engineering Manual. Engineer Manual 1110-2-1100; US Army Corps of Engineers: Washington, DC, USA, 2002.
  33. Simonetti, I.; Cappietti, L. Hydraulic performance of oscillating water column structures as anti-reflection devices to reduce harbour agitation. Coast. Eng. 2020. [Google Scholar] [CrossRef]
  34. Contestabile, P.; Ferrante, V.; Di Lauro, E.; Vicinanza, D. Full-scale prototype of an overtopping breakwater for wave energy conversion. Coast. Eng. Proc. 2017, 1, 12. [Google Scholar] [CrossRef] [Green Version]
  35. Margheritini, L.; Vicinanza, D.; Frigaard, P. SSG wave energy converter: Design, reliability and hydraulic performance of an innovative overtopping device. Renew. Energy 2009, 34, 1371–1380. [Google Scholar] [CrossRef]
  36. Margheritini, L.; Stratigaki, V.; Troch, P. Geometry optimization of an overtopping wave energy device implemented into the new breakwater of the Hanstholm port expansion. In The Twenty-Second International Offshore and Polar Engineering Conference; International Society of Offshore and Polar Engineers: Mountain View, CA, USA, 2012. [Google Scholar]
  37. Buccino, M.; Vicinanza, D.; Salerno, D.; Banfi, D.; Calabrese, M. Nature and magnitude of wave loadings at Seawave Slot-cone Generators. Ocean Eng. 2015, 95, 34–58. [Google Scholar] [CrossRef]
  38. Contestabile, P.; Iuppa, C.; Di Lauro, E.; Cavallaro, L.; Andersen, T.L.; Vicinanza, D. Wave loadings acting on innovative rubble-mound breakwater for overtopping wave energy conversion. Coast. Eng. 2017, 122, 60–74. [Google Scholar] [CrossRef]
  39. Buccino, M.; Dentale, F.; Salerno, D.; Contestabile, P.; Calabrese, M. The use of CFD in the analysis of wave loadings acting on Seawave slot-cone generators. Sustainability 2016, 8, 1255. [Google Scholar] [CrossRef] [Green Version]
  40. Di Lauro, E.; Lara, J.L.; Maza, M.; Losada, I.J.; Contestabile, P.; Vicinanza, D. Stability analysis of a non-conventional breakwater for wave energy conversion. Coast. Eng. 2019, 145, 36–52. [Google Scholar] [CrossRef]
  41. Di Lauro, E.; Maza, M.; Lara, J.L.; Losada, I.J.; Contestabile, P.; Vicinanza, D. Advantages of an innovative vertical breakwater with an overtopping wave energy converter. Coast. Eng. 2020, 159, 103713. [Google Scholar] [CrossRef]
  42. Palma, G.; Contestabile, P.; Zanuttigh, B.; Formentin, S.M.; Vicinanza, D. Integrated assessment of the hydraulic and structural performance of the OBREC device in the Gulf of Naples, Italy. Appl. Ocean Res. 2020, 101, 102217. [Google Scholar] [CrossRef]
  43. Iuppa, C.; Contestabile, P.; Cavallaro, L.; Foti, E.; Vicinanza, D. Hydraulic performance of an innovative breakwater for overtopping wave energy conversion. Sustainability 2016, 8, 1226. [Google Scholar] [CrossRef] [Green Version]
  44. EurOtop. Manual on Wave Overtopping of Sea Defences and Related Structures. An Overtopping Manual Largely Based on European Research, but for Worldwide Application; Van der Meer, J.W., Allsop, N.W.H., Bruce, T., De Rouck, J., Kortenhaus, A., Pullen, T., Schüttrumpf, H., Troch, P., Zanuttigh, B., Eds.; Available online: www.overtopping-manual.com (accessed on 15 February 2021).
  45. Iuppa, C.; Cavallaro, L.; Musumeci, R.E.; Vicinanza, D.; Foti, E. Empirical overtopping volume statistics at an OBREC. Coast. Eng. 2019, 152, 103524. [Google Scholar] [CrossRef]
  46. Cavallaro, L.; Iuppa, C.; Castiglione, F.; Musumeci, R.E.; Foti, E. A Simple Model to Assess the Performance of an Overtopping Wave Energy Converter Embedded in a Port Breakwater. J. Mar. Sci. Eng. 2020, 8, 858. [Google Scholar] [CrossRef]
  47. Cappietti, L.; Simonetti, I.; Penchev, V.; Penchev, P. Laboratory tests on an original wave energy converter combining oscillating water column and overtopping devices. In Proceedings of the 3rd International Conference on Renewable Energies Offshore (RENEW-2018), Lisbon, Portugal, 8–10 October 2018. [Google Scholar]
  48. Lara, J.; de Eulate, M.Á.; Di Paolo, B.; Rodríguez, B.; Guanche, R.; Álvarez, A.; Mendoza, A.; Iturrioz, A.; Blanco, D.; Di Lauro, E. Physical and Numerical Modeling of an Innovative Vertical Breakwater for Sustainable Power Generation in Ports: SE@ PORTS Project. Coast. Struct. 2019, 158–168. [Google Scholar] [CrossRef]
  49. Frostick, L.E.; McLelland, S.J.; Mercer, T.G. (Eds.) Users Guide to Physical Modelling and Experimentation: Experience of the HYDRALAB Network; CRC Press: Boca Raton, FL, USA, 2011. [Google Scholar]
  50. Cabral, T.; Clemente, D.; Rosa-Santos, P.; Taveira-Pinto, F.; Morais, T.; Belga, F.; Cestaro, H. Performance Assessment of a Hybrid Wave Energy Converter Integrated into a Harbor Breakwater. Energies 2020, 13, 236. [Google Scholar] [CrossRef] [Green Version]
  51. Cabral, T.; Clemente, D.; Rosa-Santos, P.; Taveira-Pinto, F.; Morais, T.; Cestaro, H. Evaluation of the Annual Electricity Production of a Hybrid Breakwater-Integrated Wave Energy Converter; Elsevier: Amsterdam, The Netherlands, 2020; Volume 213, p. 118845. [Google Scholar] [CrossRef]
  52. ANSYS. ANSYS Fluent Theory Guide; Release 15.0; ANSYS: Canonsburg, PA, USA, 2013; p. 780. [Google Scholar]
Figure 1. Scheme of the OWC integrated into a vertical caisson breakwater.
Jmse 09 00226 g001
Figure 2. Scheme of the OTD integrated into a vertical caisson breakwater.
Jmse 09 00226 g002
Figure 3. Scheme of the HWEC integrated into a rubble mound breakwater.
Jmse 09 00226 g003
Figure 4. Numerical model domain.
Jmse 09 00226 g004
Figure 5. Mesh details near the HWEC device.
Jmse 09 00226 g005
Figure 6. OTD Reservoirs.
Jmse 09 00226 g006
Figure 7. Wavemaker, top surface and air boundary of the computational domain.
Jmse 09 00226 g007
Figure 8. Sinks and Fan Boundaries.
Jmse 09 00226 g008
Figure 9. Physical model setup in the channel built inside the wave basin at FEUP [12].
Jmse 09 00226 g009
Figure 10. Comparison between measured and calculated water free surface elevation at two locations in the wave flume: wave gauge S4 (left panel) and S5 (right panel) for Val_Test_01.
Jmse 09 00226 g010
Figure 11. Comparison between measured and calculated water level inside the OWC chamber for Val_Test_01.
Jmse 09 00226 g011
Figure 12. Comparison between measured and calculated cumulative mass flow (kg/m) in the four reservoirs of the HWEC for Val_Test_02.
Jmse 09 00226 g012
Figure 13. Snapshot of free surface elevation at a time instant after 14 wave periods in the entire domain.
Jmse 09 00226 g013
Figure 14. Snapshot of free surface elevation at a time instant after 14 wave periods close to the HWEC device.
Jmse 09 00226 g014
Figure 15. Comparison between measured and calculated free surface elevation at two locations in the wave flume: wave gauges S1 (left panel) and S9 (right panel) for Val_Test_03.
Jmse 09 00226 g015
Figure 16. Comparison between measured and calculated water level inside the OWC chamber for Val_Test_03.
Jmse 09 00226 g016
Figure 17. Sketch of the two different geometries of the HWEC system analysed for the geometrical [50].
Jmse 09 00226 g017
Figure 18. Mesh details near the HWEC device for Geometry B (upper panel) and C (lower panel).
Jmse 09 00226 g018
Figure 19. Comparison of the free surface elevation between the two geometries at locations: S1 (top left panel), S5 (top right panel) and S9 (lower panel) in the numerical flume.
Jmse 09 00226 g019
Figure 20. Comparison of the water level oscillation inside the OWC chamber for the two geometries.
Jmse 09 00226 g020
Figure 21. Comparison of the cumulative mass flow (kg/m) in the four reservoirs between the two geometries.
Jmse 09 00226 g021
Figure 22. Comparison of the cumulative mass flow (kg/m) in the four reservoirs between the Reference test and Test_01 and Test_04. Note that the y axis is on a different scale at the four reservoirs for comparison purposes.
Jmse 09 00226 g022
Figure 23. Comparison of the cumulative mass flow (kg/m) in the four reservoirs between the Reference test and Tests_05 and Tests_06. Note that the y axis is on a different scale at the four reservoirs for comparison purposes.
Jmse 09 00226 g023
Figure 24. Comparison of the water level (left panel) and amplification coefficient (right panel) inside the OWC chamber for the Test_01 to Test_04 and Reference test.
Jmse 09 00226 g024
Figure 25. Comparison of the water level (left panel) and amplification coefficient (right panel) inside the OWC chamber for the Test_05 and Test_06 and Reference test.
Jmse 09 00226 g025
Table 1. RMSE (%) of the water level oscillation calculated with the numerical model when compared to the measured data.
TestWave Gauge S1Wave Gauge S4Wave Gauge S5Wave Gauge S6Wave Gauge S9Wave Gauge in OWC Chamber
Val_Test_014.94.82.15.25.38.1
Val_Test_025.65.25.45.86.110.3
Val_Test_035.95.45.76.87.312.7
Table 2. Main characteristics of the additional numerical model tests.
Model ScalePrototype Scale
Testh (m)Hs (m)Tp (s)h (m)Hs (m)Tp (s)
Reference test0.4880.0341.2724.401.709
Test_010.4610.0341.2723.051.709
Test_020.4750.0341.2723.751.709
Test_030.5040.0341.2725.201.709
Test_040.5200.0341.2726.001.709
Test_050.4880.0551.2724.402.759
Test_060.4880.0751.2724.403.759
Publisher’s Note: MDPI stays neutral with regard to jurisdictional claims in published maps and institutional affiliations.

