
Mooring Analysis of a Floating OWC Wave Energy Converter

1
National Centre for Maritime Engineering and Hydrodynamics, Australian Maritime College, University of Tasmania, Launceston, TAS 7248, Australia
2
Blue Economy Cooperative Research Centre-Co., Launceston, TAS 7248, Australia
*
Author to whom correspondence should be addressed.
J. Mar. Sci. Eng. 2021, 9(2), 228; https://0-doi-org.brum.beds.ac.uk/10.3390/jmse9020228
Submission received: 22 January 2021
/
Revised: 11 February 2021
/
Accepted: 13 February 2021
/
Published: 20 February 2021
(This article belongs to the Special Issue Mooring Systems of Floating Offshore Structures for Emerging Industries)
Abstract
:This investigation focuses on the modelling of a floating oscillating water column (FOWC) wave energy converter with a numerical code (ANSYS AQWA) based on potential flow theory. Free-floating motions predicted by the numerical model were validated against experimental data extrapolated from a 1:36 scale model device in regular and irregular sea states. Upon validation, an assessment of the device’s motions when dynamically coupled with a four-line catenary mooring arrangement was conducted at different incident wave angles and sea states ranging from operational to survivable conditions, including the simulation of the failure of a single mooring line. The lack of viscosity in the numerical modelling led to overpredicted motions in the vicinity of the resonant frequencies; however, the addition of an external linear damping coefficient was shown to be an acceptable method of mitigating these discrepancies. The incident wave angle was found to have a limited influence on the magnitudes of heave, pitch, and surge motions. Furthermore, the obtained results indicated that the mooring restoring force is controlled by the forward mooring lines under the tested conditions.
1. Introduction
Global interest in the renewable energy industry has steadily increased in recent years, as the fossil fuel industry continues to take criticism with regard to the ongoing environmental impact. With oceans covering 71% of the earth’s surface, there is a large potential for ocean renewable energy (ORE) to become a viable alternative method of energy production. The main sources of ORE are wave, tidal, and non-tidal ocean currents and offshore wind. Wave energy is the most feasible in the Australian market due to the proximity to population hubs with existing electrical infrastructure and the significant available natural resources. An estimate of the wave energy potential for Australia’s southern coastline is 1300 TWh/year, which is roughly five times the nation’s energy requirements [1]. There are currently over 1000 wave energy conversion (WEC) devices with patents worldwide [2], with the majority falling into one of four main device categories: oscillating water columns (OWCs), overtopping devices, pressure differential devices, and wave activated buoys [3]. OWC devices have been suggested to have the highest ratio in terms of efficiency per characteristic width [4] and will be the focus of this investigation. The devices are typically situated along a shoreline, fixed to the seabed, or floating in deeper waters. The body of an OWC comprises a partially submerged, hollow structure and a submerged opening allowing water to ingress into the internal, air-filled chamber. The subsequent rise and fall of the internal free surface create an oscillating airflow within the chamber, which can be used to drive an integrated turbine generator.
Numerical modelling has a key role in the continual development of wave energy devices, providing developers with a means to investigate a broad spectrum of device configurations before approaching investors to fund experimental campaigns. Investigations utilising computational fluid dynamics (CFD) offer the most accurate description of fluid flow and wave–body interactions, yet they also require substantial computational resources. An alternative method, involving substantially less computational load, is the approach based on potential flow theory. Also referred to as boundary element methods (BEMs) or the panel method, this approach computes the velocity potential and fluid pressure on the submerged surface of the body, with separate solutions for the diffraction and radiation problems [5]. Several studies have used this method to evaluate the hydrodynamic performance of OWC devices, through commercial and open-source codes such as ANSYS AQWA, WAMIT, and NEMOH. These include cylindrical type [6], backward bent ducted buoy type [7], and spar type [8].
Numerical codes based on the potential flow theory are also frequently used to evaluate the performance of point-absorber-type WECs [9,10,11], and discrepancies in motions are often noted between the numerical and experimental results for motion. This issue is attributed to the absence of viscous effects in such numerical models [12,13], in which the assumption of zero viscosity in the fluid can lead to over-estimation of the motions for bodies when the pressure and skin friction drag from viscous effects is significant. Typically, the region surrounding the resonant frequency is most influenced by the viscous effects [14]. Accurate modelling of the motions about the natural periods is important, and several investigations have sought to mitigate the effects of viscous damping by tuning the numerical models [9,10,15,16]. A common approach taken in potential flow investigations is to incorporate an external, frequency-independent damping force that is linearly proportional to the structure’s displacement or rotational velocity; some examples include the simulation of side-by-side vessel motions [15] and multiple point absorber WECs integrated into a floating platform [16].
Under excitation from an incident wave field, the free surface within a moonpool can oscillate at a resonant frequency, leading to internal elevations well more than the incident wave height [17]. Resonance can occur in various modes, including piston and sloshing types, both of which have been seen to have some influence on the heave and pitch motions of structures with moonpools [18]. A comparison of numerical and experimental results indicates that potential flow solvers over-estimate the magnitude of the internal free-surface oscillations, as the damping is controlled by flow separation at the sharp corners of the moonpool inlet [19,20]. Most commercial potential flow codes allow for the inclusion of a thin-surface object within the moonpool, known as a lid, with a controllable damping coefficient to mitigate the oscillations of the free surface within the moonpool. This method has been adopted with promising results in self-reacting point absorber WECs [11].
Floating WECs have the additional complexity of station-keeping requirements in variable sea states. While the direction of incoming waves can be predicted with relative accuracy for shoreline projects, where the seabed and coastline topography direct the propagation of the wave trains towards the shore, an offshore wave climate is typically more varied in terms of direction and extreme events. As such, devices must be designed to efficiently generate power from the expected operational environmental conditions yet withstand the significantly higher wave energy levels that accompany extreme weather events [2]. This presents a complex engineering problem, involving a balance between the survivability of the mooring configuration and the effect it has on the performance of the device. Consequently, the design of the mooring system should be integrated with the wave power system design and not as a postscript to the design process [21].
Moorings for wave energy devices can be classified under three types: passive, active, or reactive. Passive and active systems are designed with the sole requirement of station keeping, with some potential influence on device motions due to additional stiffness in the system. Reactive systems are designed for situations in which the device’s power take-off method relies on the relative motion of the body and fixed ground; hence, the moorings provide a reactive restoring force to facilitate power generation [22].
The main scope of this study was to investigate the numerical modelling of a floating oscillating water column (FOWC) wave energy converter with the commercial potential flow solver ANSYS AQWA. Free-floating motions predicted by the numerical model were validated against experimental data extrapolated from a 1:36 scale model device in regular and irregular sea states. Upon validation, an assessment of the device’s motions when dynamically coupled with a four-line catenary mooring arrangement was performed and evaluated at different incident wave angles and sea states ranging from operational to survivable conditions, including the simulation of the failure of a single mooring line. It should be noted that the effect of motion and mooring configurations on the power production efficiency of the device was not within the scope of this investigation. As such, the catenary mooring arrangement within this paper was considered passive. The materials of this paper are set out as follows: Section 2 describes the FOWC model and the experimental setup. Furthermore, the numerical modelling setup, the treatment of viscous damping, and the effect of moonpool damping are thoroughly discussed in Section 2. Section 3 discusses the obtained results of free decay tests in different degrees of freedom, motions, and mooring analyses. Finally, Section 4 concludes the main findings of this study and recommends some points for future work.
2. Materials and Methods
2.1. Experimental Campaign
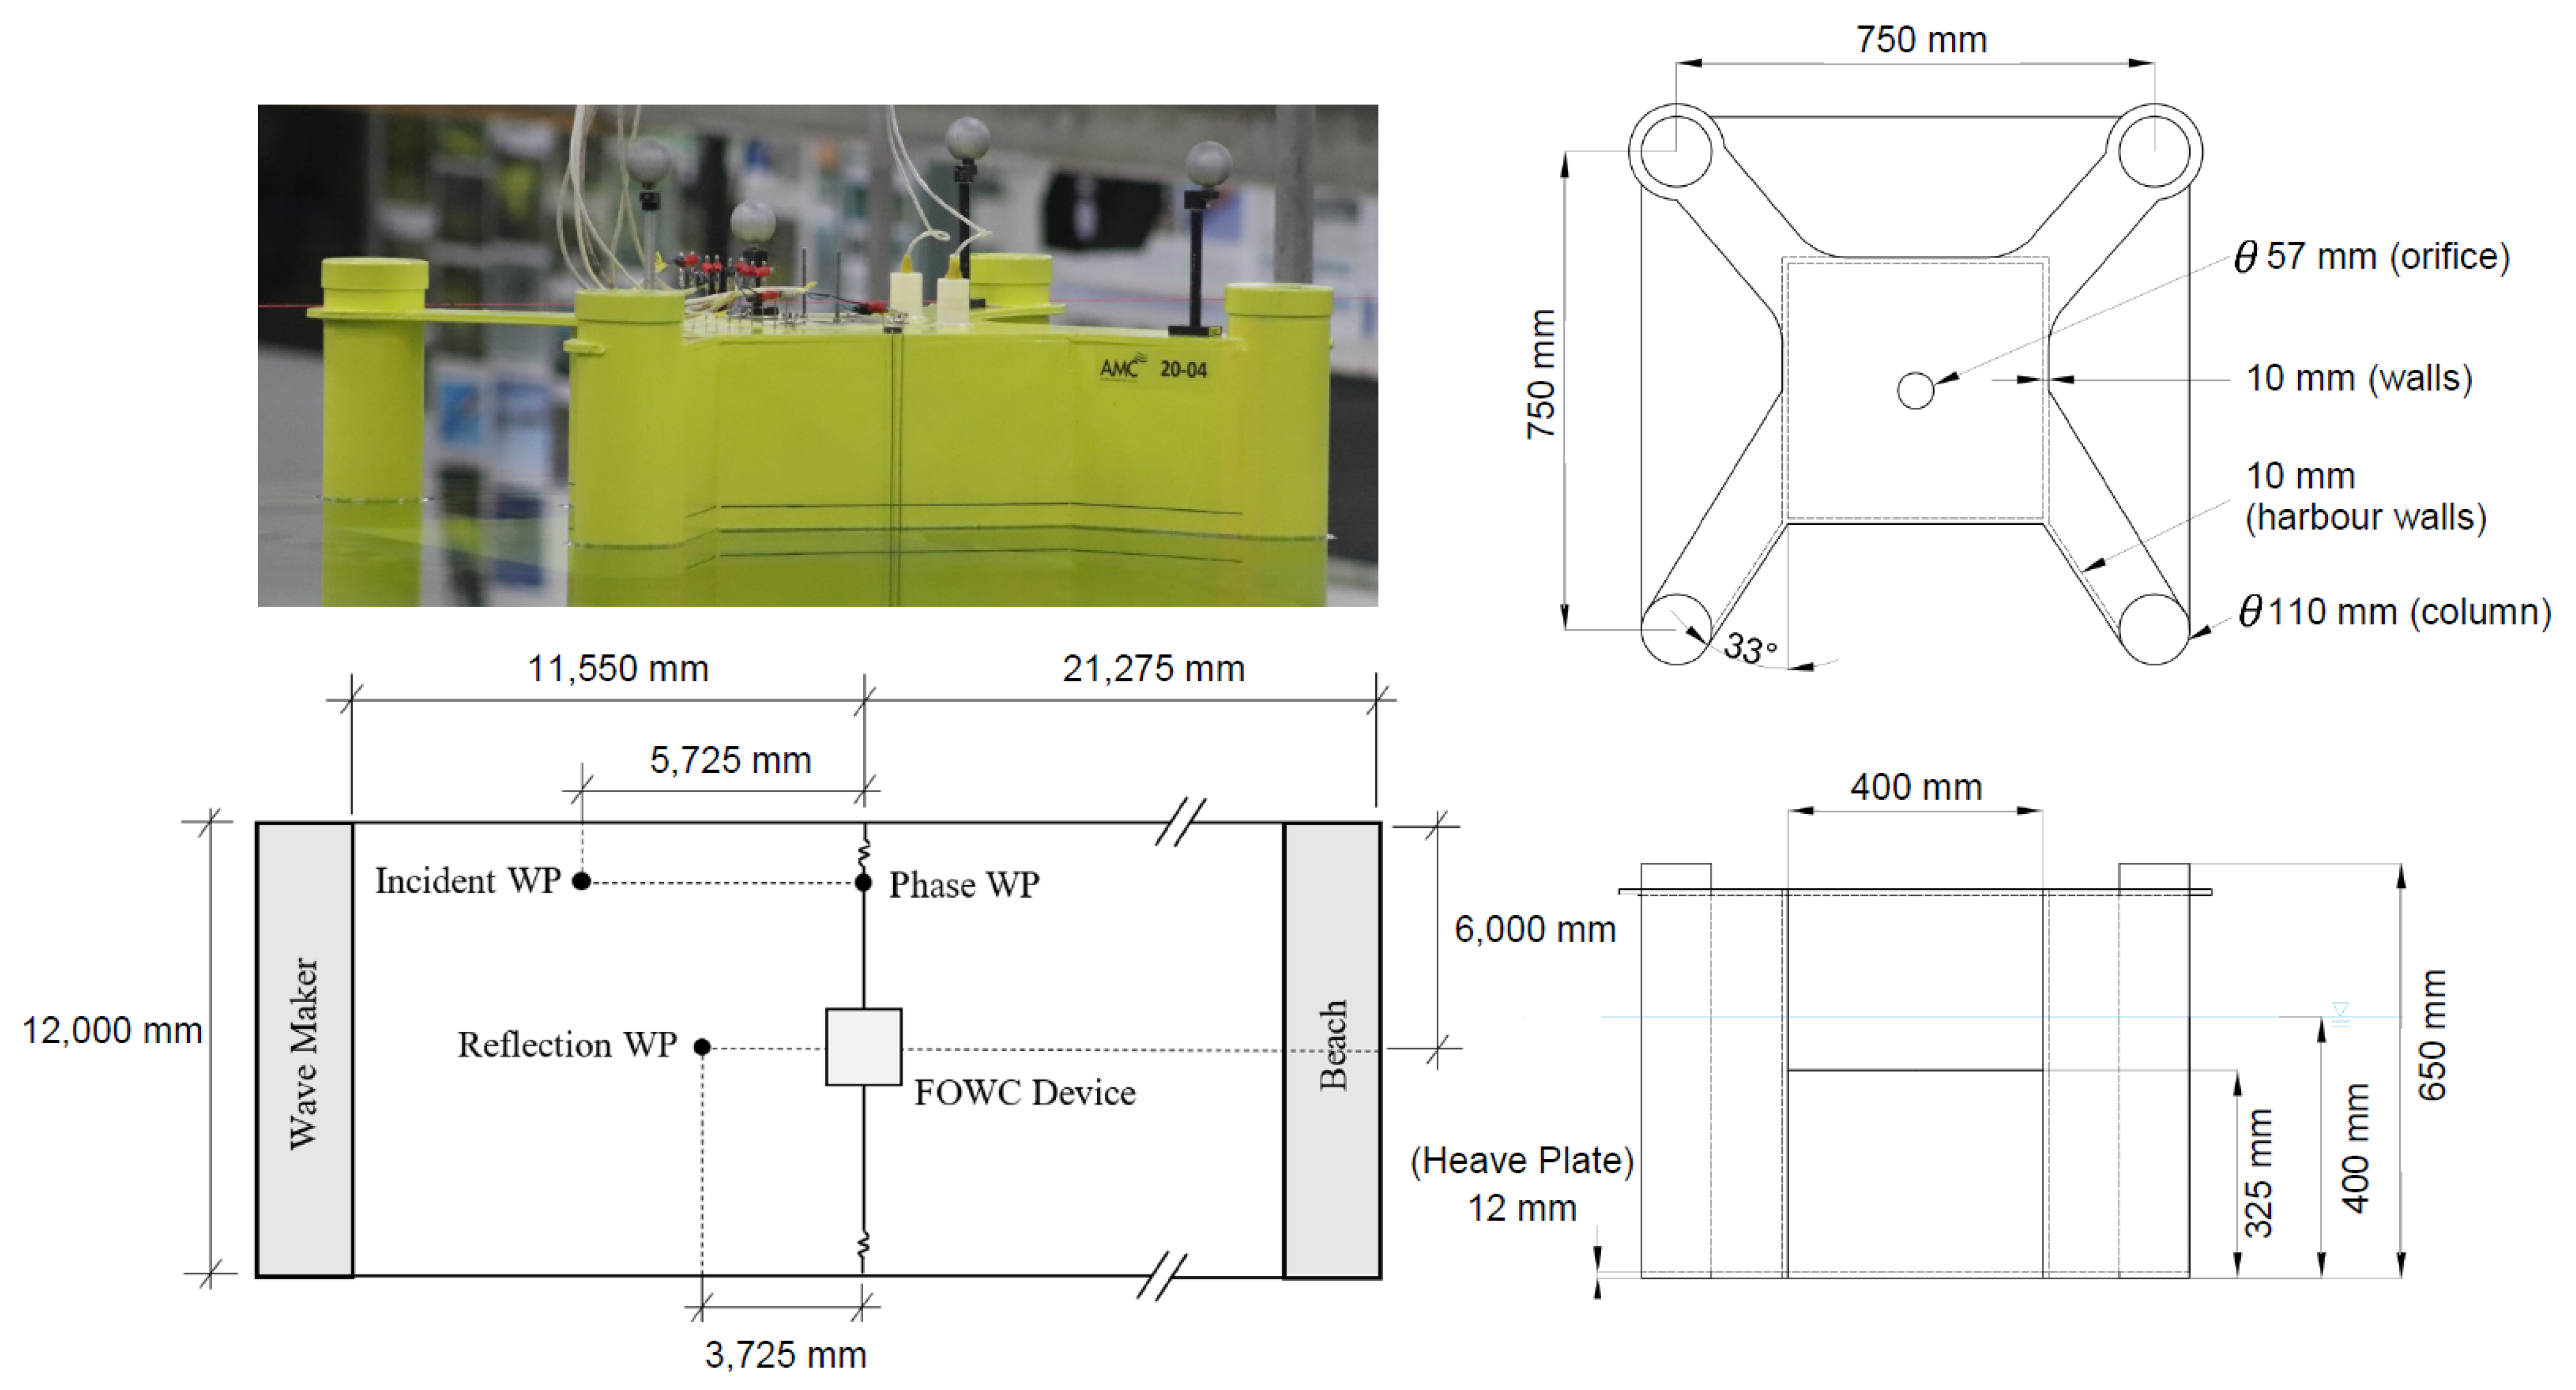
Experimental testing of a 1:36 scale FOWC was conducted in the Australian Maritime College’s Model Test Basin (AMC MTB). The basin is 35 m long and 12 m wide and capable of accommodating water depths of up to 1 m. A 6 m wave-damping beach is located at the aft end of the tank. The device was situated 11.55 m away from the 16-paddle piston-type wavemaker, and a 2-line soft horizontal mooring setup was installed to provide a restoring force in the surge direction. The model was constructed of marine plywood and polyvinyl chloride (PVC) pipe, with a waterproofing epoxy layer. Additional ballast was managed via an assortment of small lead weights secured within the base of the PVC columns. Three wave probes were positioned within the basin, and additional six wave probes were attached to the FOWC model: five within the chamber and one on the front face. Additional instruments included a load cell incorporated into each mooring line and two air pressure sensors located within the device’s chamber. Wave probes and load cells were sampled at 1000 Hz and filtered with a 10 Hz anti-aliasing filter, and motions were sampled at 200 Hz with the Qualisys Motion Capture System. Figure 1 illustrates the setup within the basin and the main particulars of the device geometry.
The device was subjected to testing under both regular and irregular waves, with motions in all degrees of freedom recorded with the pre-installed Qualisys system. A series of heave, pitch, and surge rigid-body free decay tests were conducted to generate three repeated time histories. The heave decay test was conducted by applying a controlled weight above the centre of gravity (COG), the pitch decay test was conducted by carefully rotating the device about the COG by hand, whilst the surge decay test was performed by displacing the device with strings that were tied to the fairleads, which were located on the side of the OWC chamber and in line with the vertical centre of gravity (VCG) and longitudinal centre of gravity (LCG). Furthermore, free decay tests of the water surface within the moonpool were performed by creating a seal around the device’s orifice and raising the internal water level to an initial starting position with a vacuum unit. The operational wave periods in this study ranged between 4.8 and 18 s at full scale (0.8–3.0 s at model scale). However, due to the long heave and pitch natural periods (obtained from the free decay tests), the regular wave experimental conditions were extended to 30 s (5.0 s at model scale) to quantify the structure’s motions around resonance, even though the likelihood of this relatively long period is extremely low for full-scale waves. The main particulars of the device and the AMC MTB setup are listed in Table 1.
2.2. Numerical Simulation Setup
2.2.1. Geometry and Numerical Domain
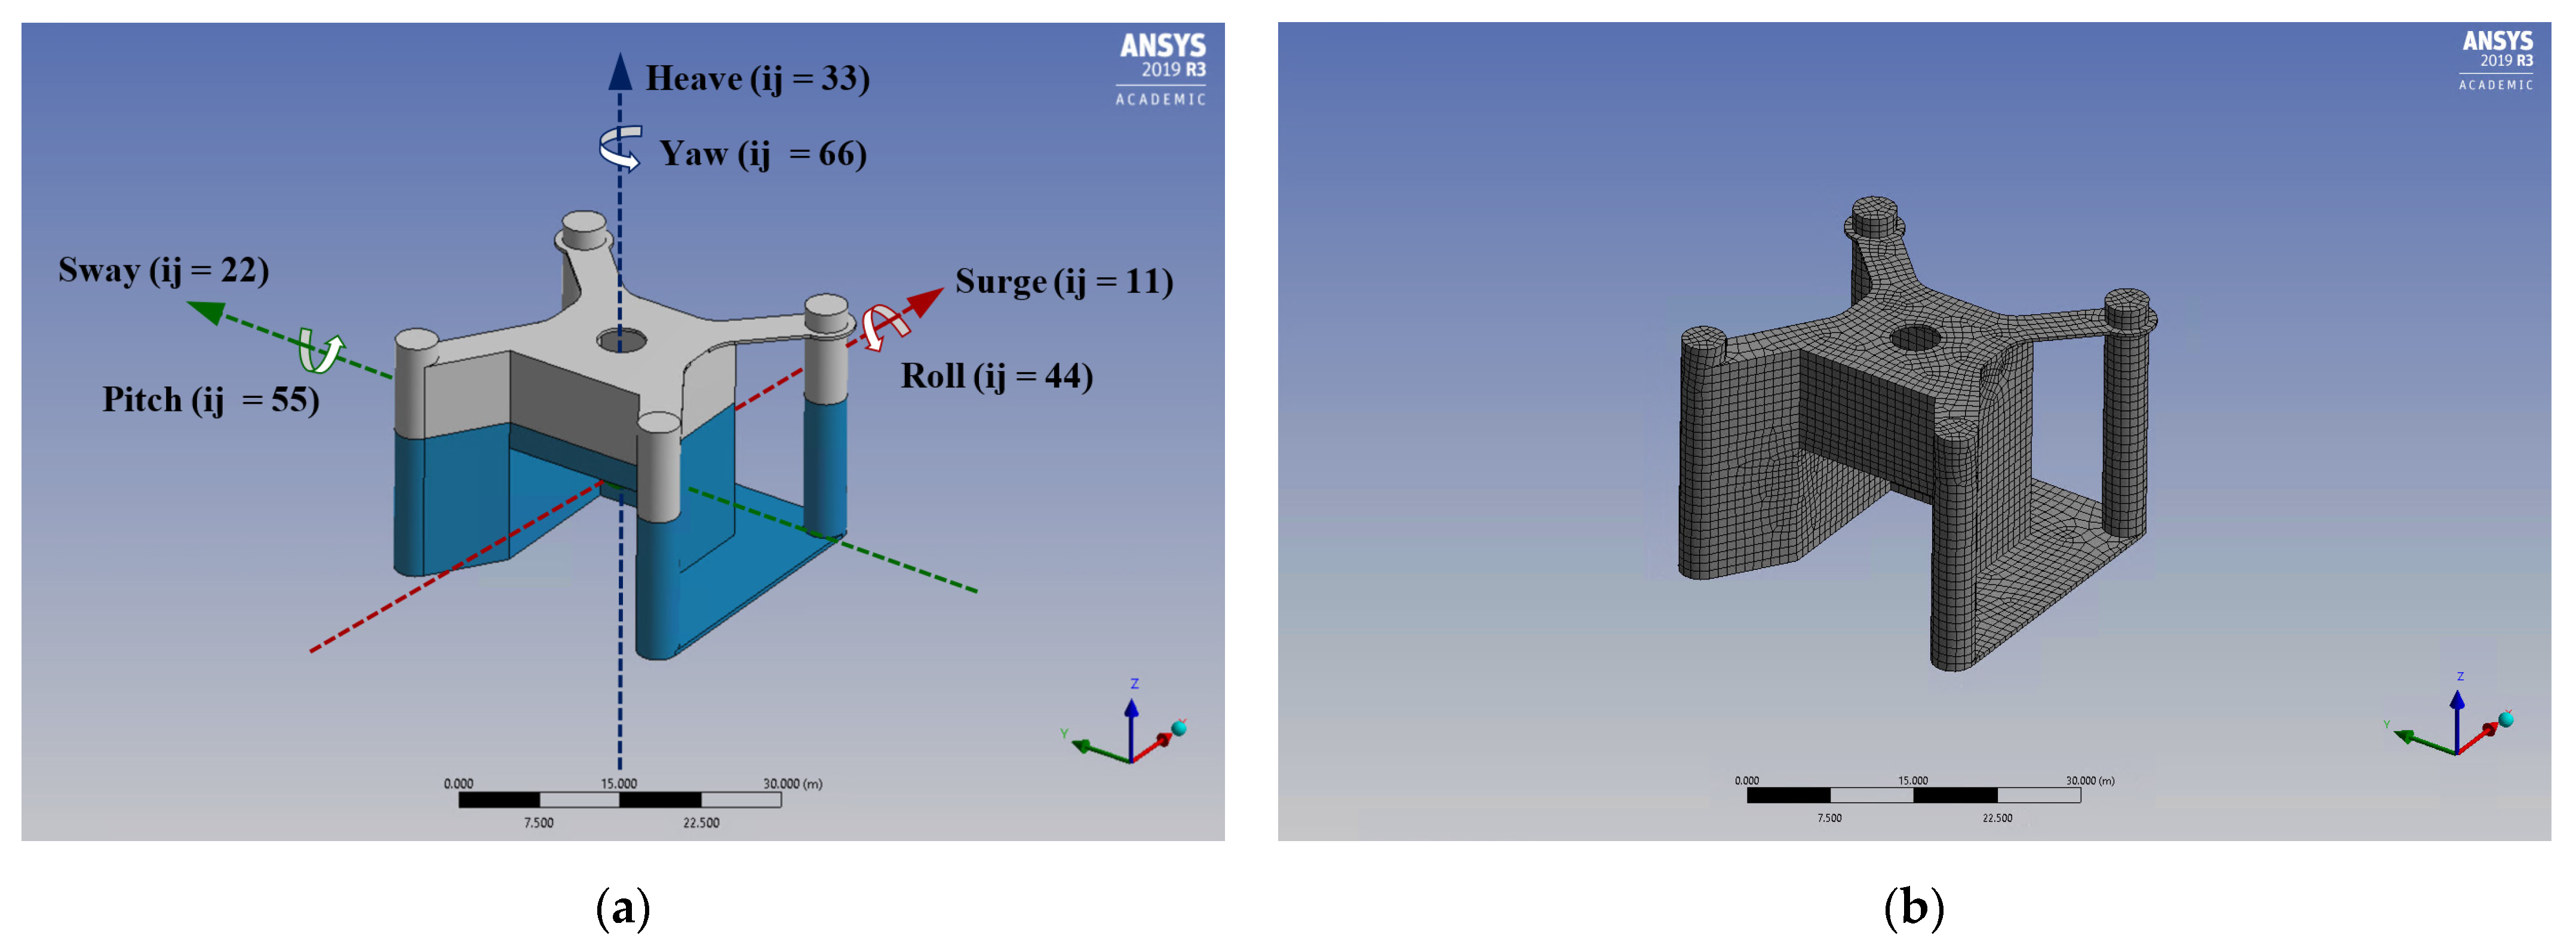
The model geometry was recreated at the design full scale in Autodesk Inventor and imported into ANSYS Design Modeller as an IGS file. A thin/surface operation was performed to represent the solid body as a zero-thickness surface. The structure was also segmented at the waterline to allow for meshing of diffracting and non-diffracting elements. The device’s mass displacement/inertial properties were specified within the solver as a point mass acting at the centre of gravity. A convergence study was performed in accordance with the recommendations of ANSYS AQWA [23] such that the maximum size of mesh elements was chosen to be ≤λ/4, in which λ is the smallest wavelength associated with the shortest wave period tested (Tmin = 4.8 s, λmin ≈ 36 m at full scale). A similar convergence study was conducted and documented in [24] for the hydrodynamic diffraction analysis of a tension leg platform wind turbine (TLPWT). Finally, the FOWC model was meshed with a maximum element size of 1.5 m, equating to a total of 9047 elements, 5144 of which were diffracting. Rigid body decay tests and regular wave interactions were considered during the convergence study validations, which confirmed that the 1.5 m size is sufficient for the element size of the panel mesh. The resulting element size and simulation parameters were transferred for use with the FOWC model during mooring analysis. Figure 2 depicts the definition of the axis, degrees of freedom, and meshed body of the FOWC.
For the validation of the model against the experimental data, the soft mooring lines were replicated in the numerical model as linear cables of zero mass, with pre-tension applied by specifying an unstretched length. An initial estimate of the pre-tension was obtained by taking the mean value of the experimental load cell data when the model was at rest.
2.2.2. Additional Viscous Damping
As previously noted, the zero-viscosity assumption within potential flow theory was inappropriate for the FOWC in this investigation. As such, an additional damping force was required to be implemented into the simulation setup in order to mitigate the over-estimation of motions at the natural frequency. Viscous-induced damping is generally non-linear and frequency dependent [25]; however, the solver only accommodates the specification of one external damping component per degree of freedom, treated as frequency independent. Consequently, the external damping component was determined for the device’s natural frequency and was considered proportional to the velocity of the structure. A non-dimensional damping coefficient can be extracted from experimental free decay tests and is representative of the ratio between the actual damping and the critical damping, at the natural frequency, shown in Equation (1) [25].
where bij represents the damping matrix, Mij the mass matrix, Maij the additional mass matrix, TNij the undamped natural period of the structure, and ζ the non-dimensional damping coefficient. Equation (2) represents the exponential curve that can be drawn through the succeeding peaks of a damped oscillation, from which the damping coefficient can be extracted [26]. This damping coefficient is representative of the entire system damping; hence, the radiation damping coefficient should be subtracted to isolate the viscous damping coefficient.
where xo represents the initial peak amplitude and the undamped natural frequency derived from the damped angular frequency () in Equation (3) [26].
This method was validated with two separate experimental data sets of structures with uncoupled motions, including a cylinder constrained to heave motions and a typical semi-submersible production platform. However, there is limited literature addressing the accuracy of the method in instances of coupled motion.
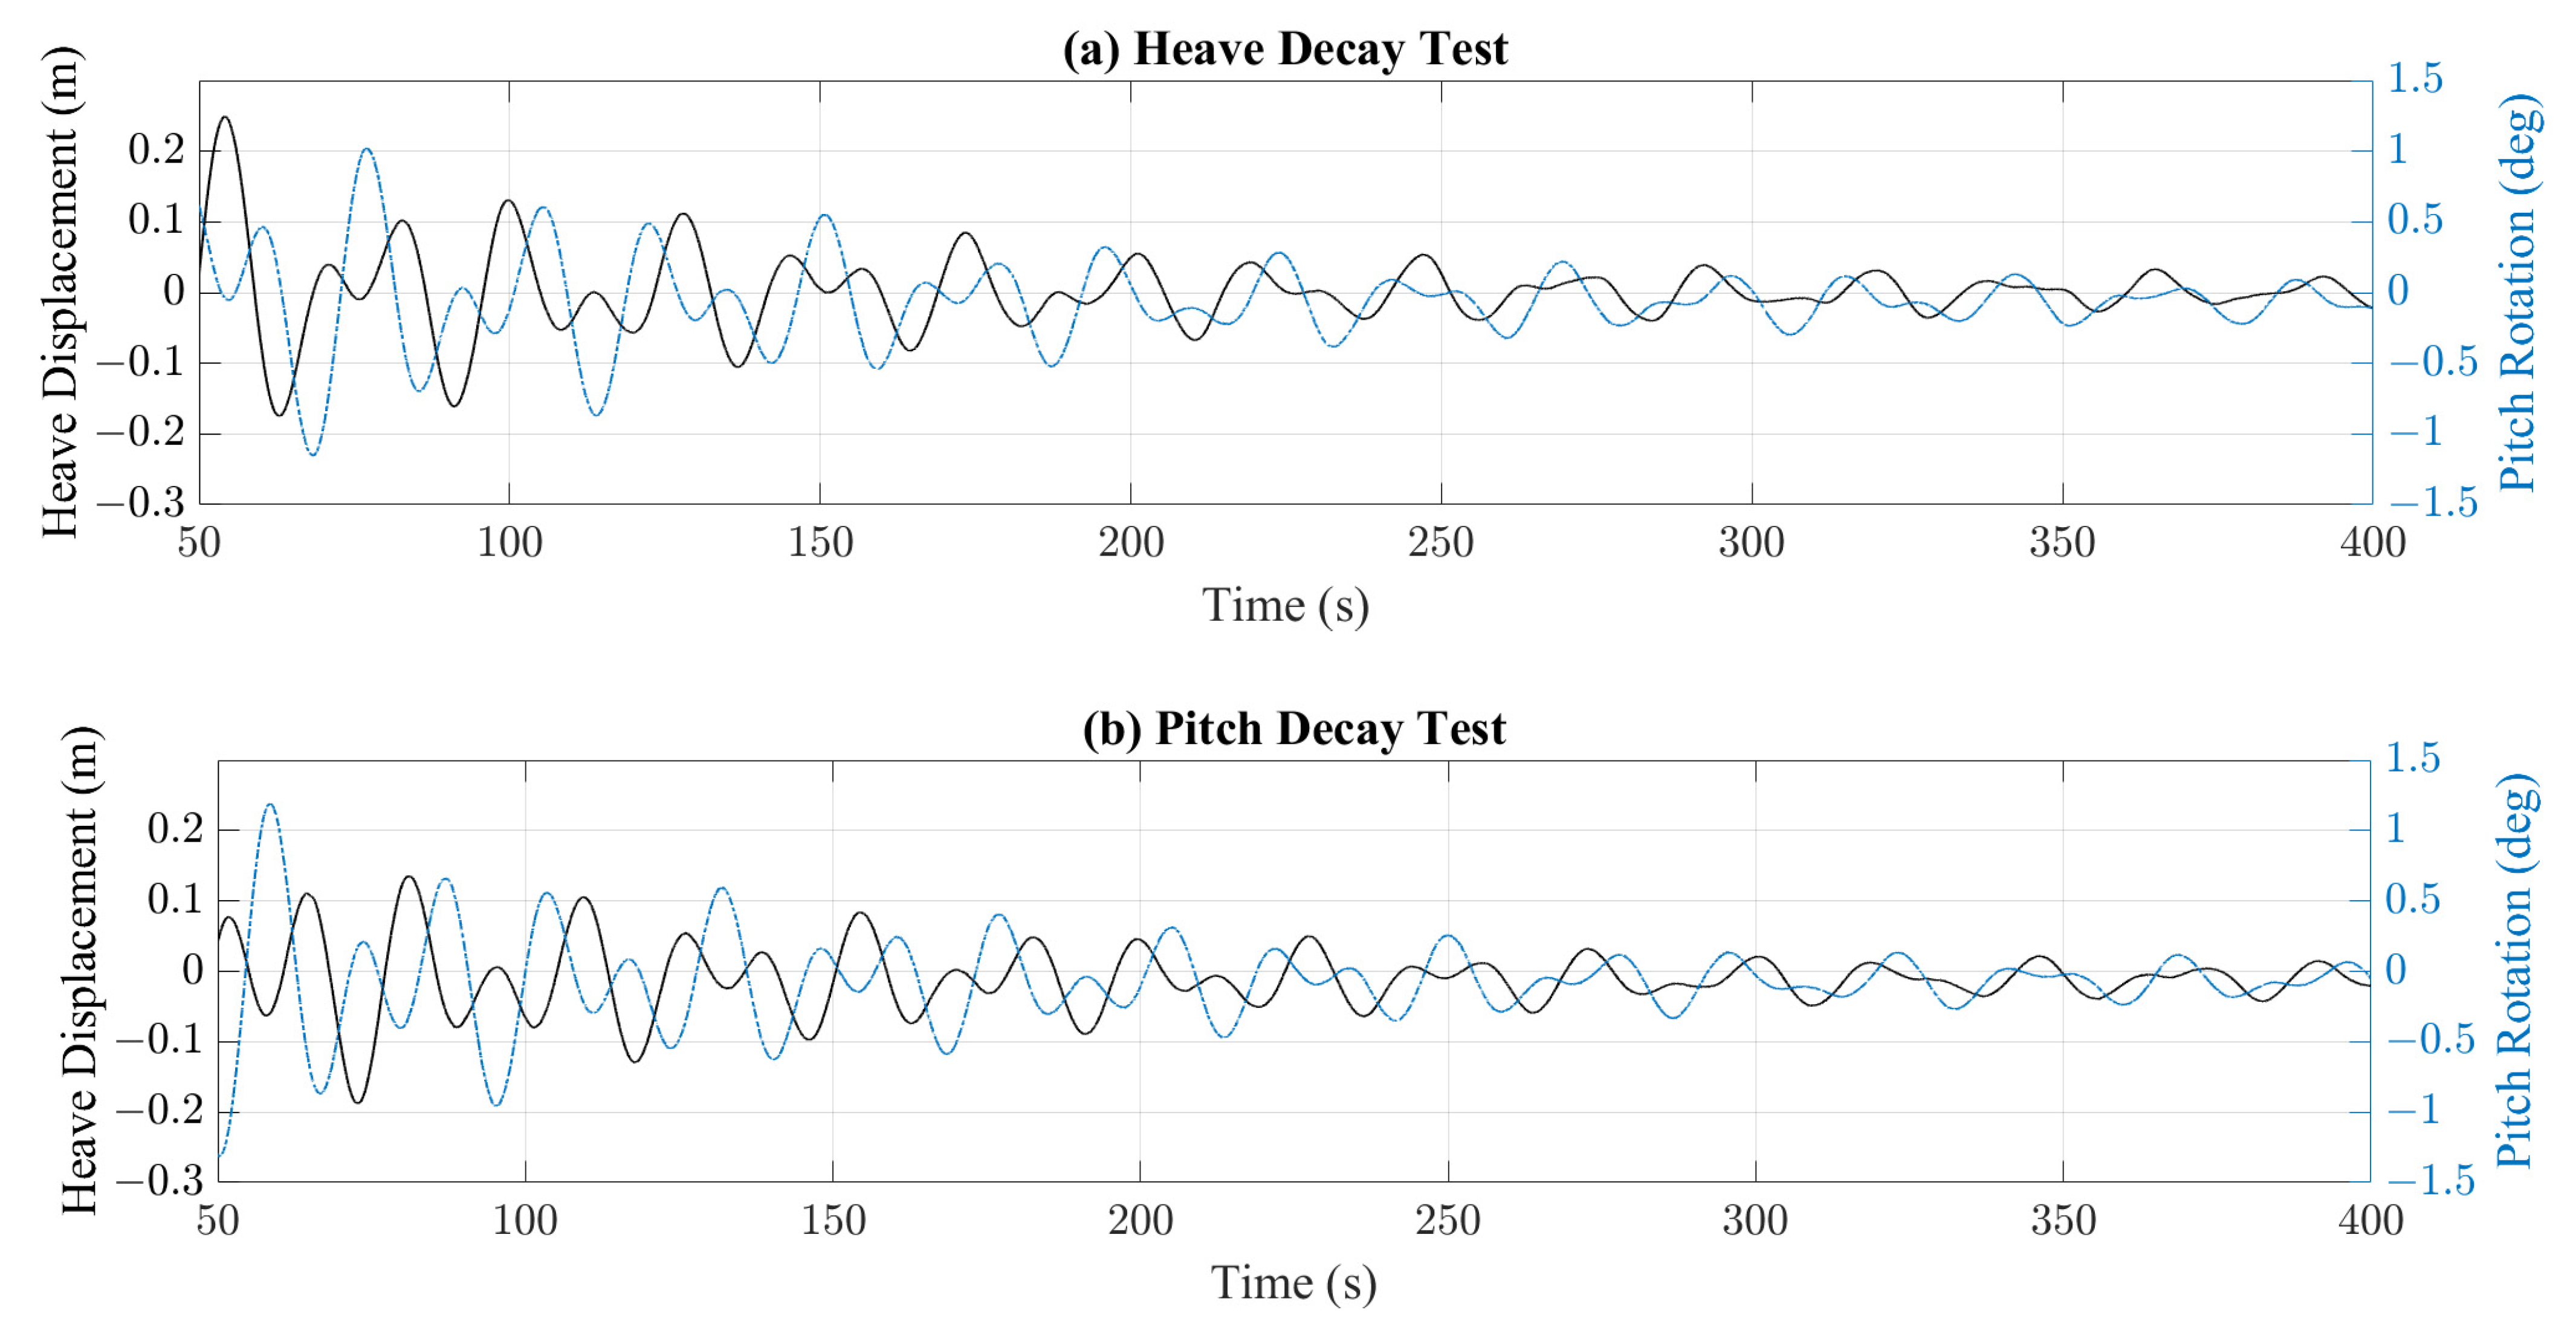
As an example, Figure 3a,b show the time history of free decay tests extracted from the physical model testing for heave and pitch motions, respectively. For each figure, the components of both heave and pitch motions are plotted alongside each other. It can be observed that the FOWC model has a similar behaviour in both degrees of freedom which suggests strong evidence of coupling between these degrees of freedom. The source of such coupling could be attributed to the geometric parameters of the model and/or to the asymmetrical heave plate located at the base of the model.
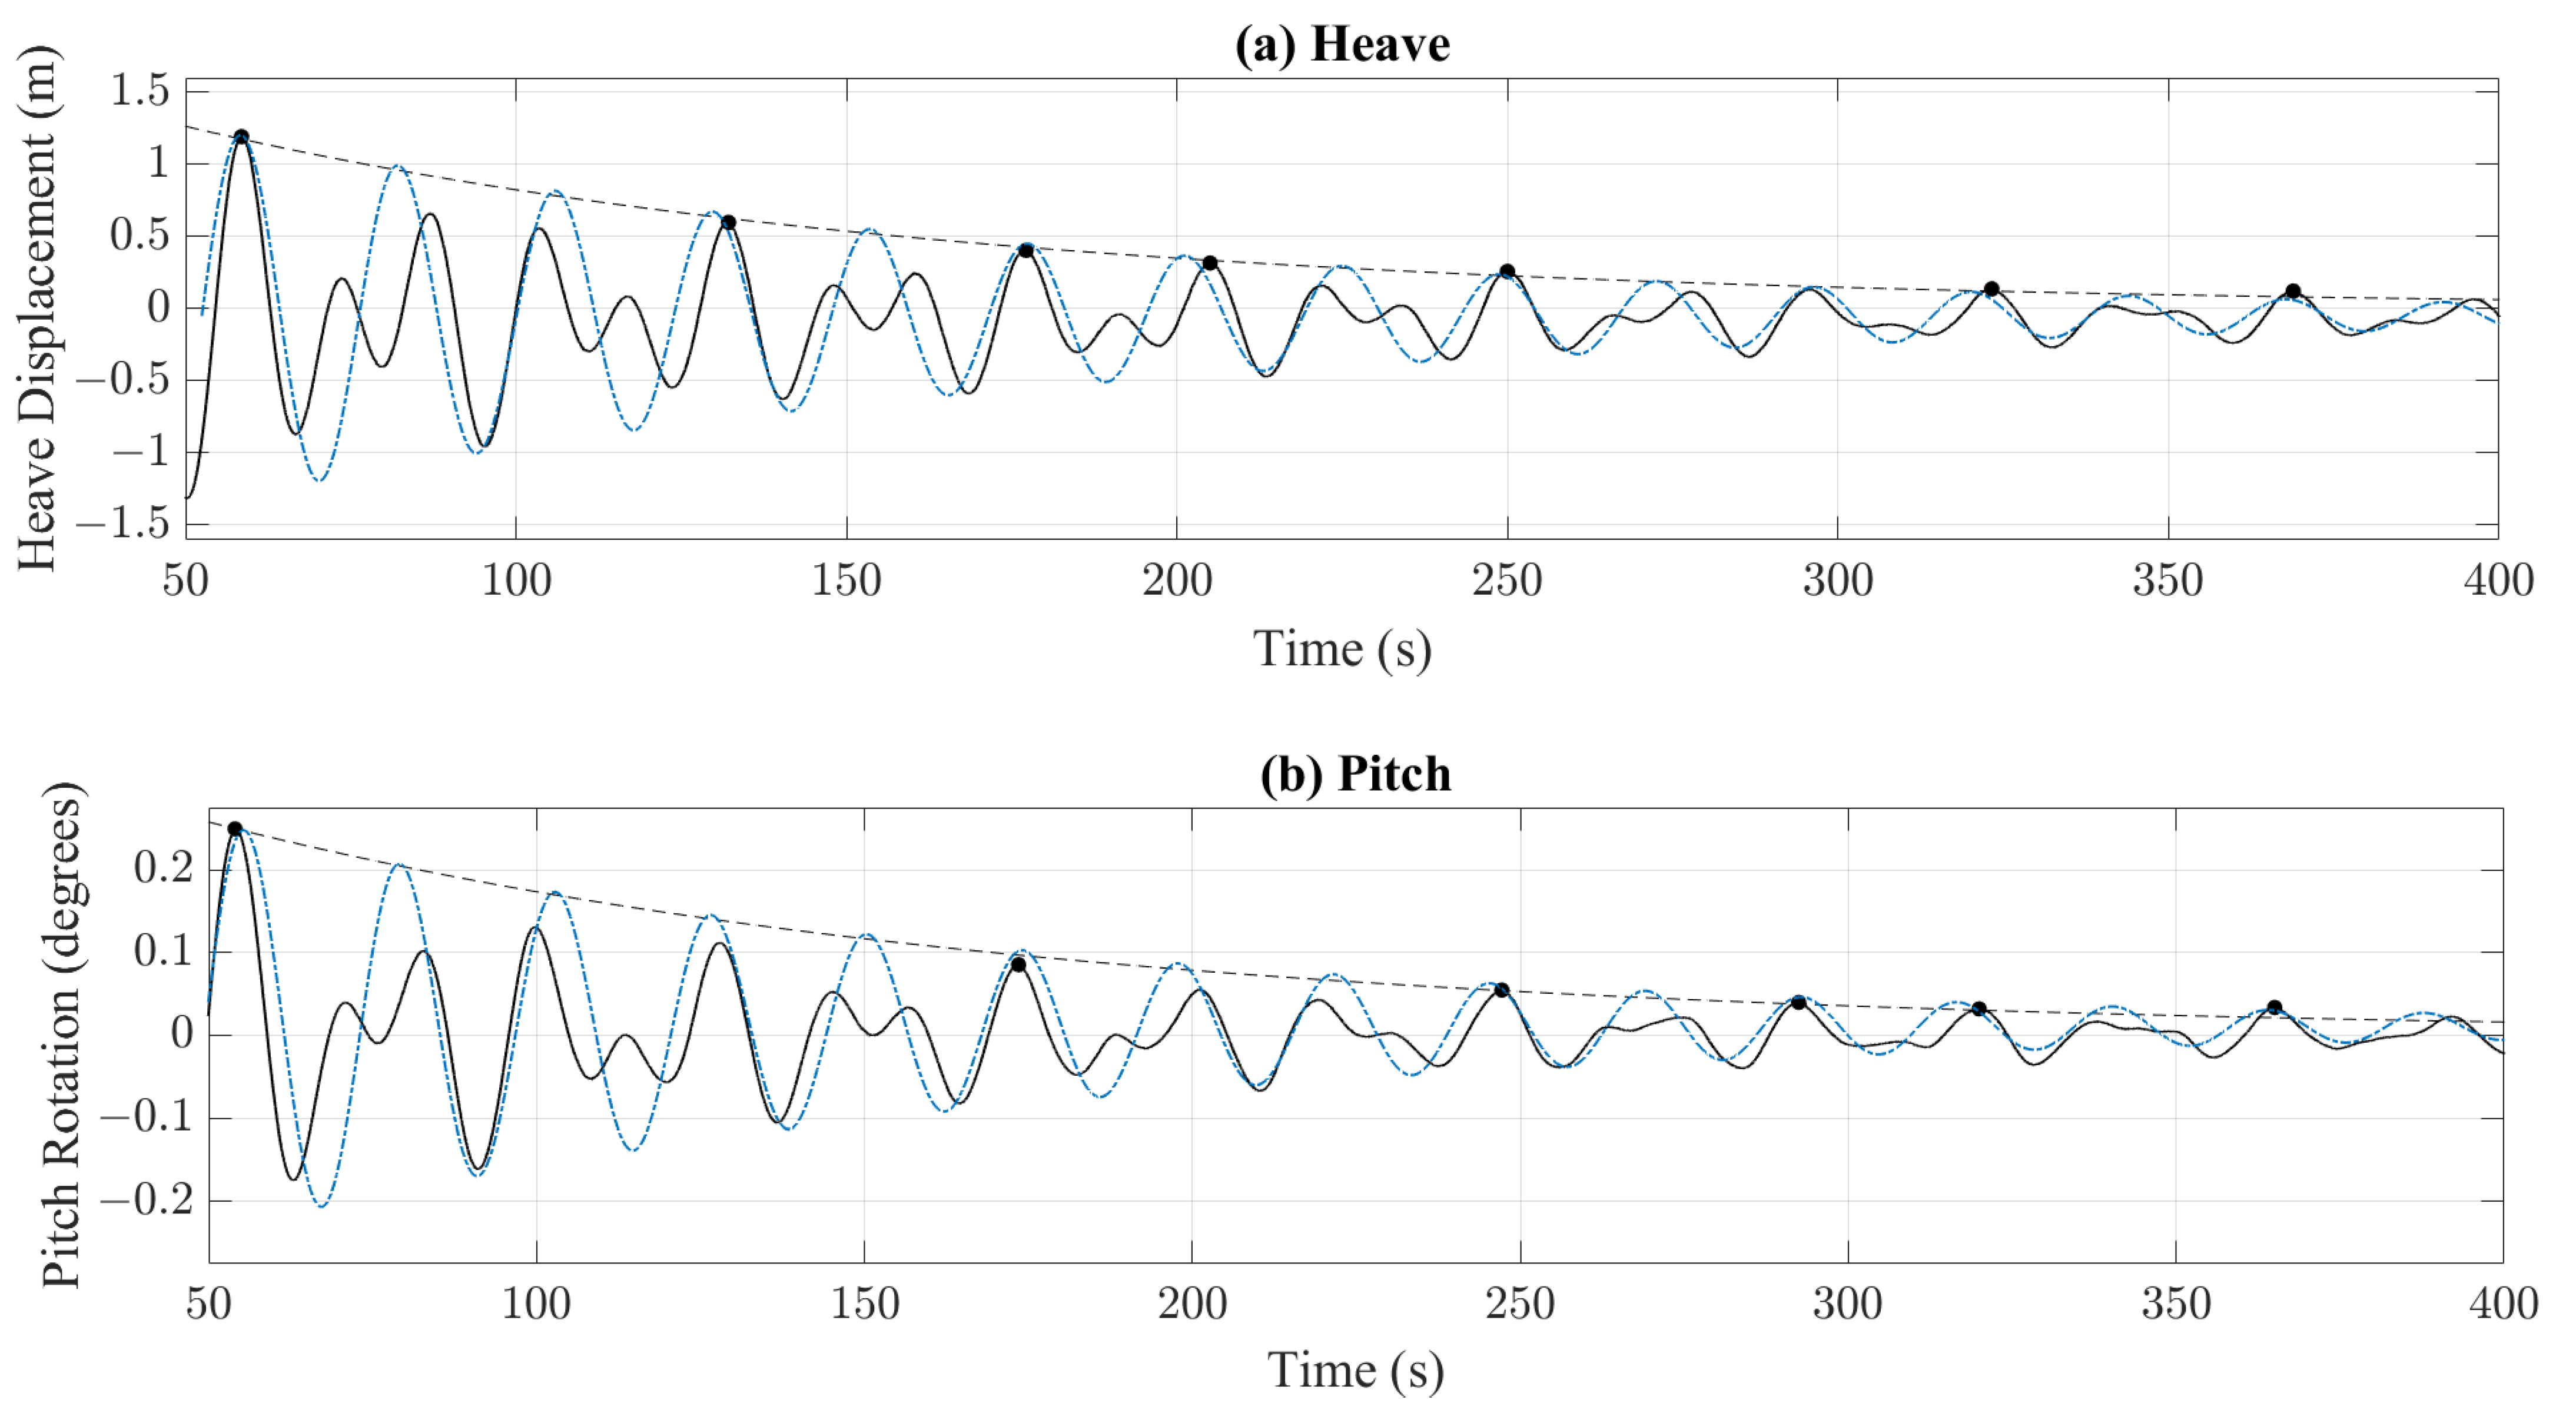
For this investigation, an exponential curve was fitted to the dominant peaks in the respective decay tests with Equation (2), from which the non-dimensional damping coefficient (ζ) was estimated. Figure 4 shows the approach taken to fit an exponential line to key peaks selected within each decay test. In addition, we included a reconstructed oscillation, which illustrates the assumed uncoupled decay. The estimated value of ζ was used in Equation (1) to calculate the additional force/moment term (bij) to be applied as an external viscous correction for the numerical model.
The added mass component of the damping force/moment calculation was determined by rearranging the equation for the natural period of the system, seen in Equation (4) [26], after determining TN from a fast Fourier transform of the experimental decay tests. In this instance, Kij represents the hydrostatic stiffness matrix.
2.2.3. Moonpool Damping Lid
To mitigate the unrealistic excitation of the moonpool free surface, an external lid of horizontal diffracting elements was added within the numerical simulations. This was achieved by modelling a surface body within the chamber, at the design waterline, and specifying the structure as abstract geometry of the external lid type. To avoid meshing errors, the surface body was modelled with a 0.1 m gap between the surface edges and the chamber walls. This does not alter the effect of the lid, as it is not required to follow the structure geometry closely [23]. The input damping factor was determined in a similar manner to that described in Section 2.2.2, using data obtained with the chamber wave probes during the moonpool decay tests. Table 2 summarises the values input into the numerical simulations. It should be noted that the lid damping factor is a scalar number, which represents how effective the lid is to be, ranging between 0 and 1; 0 will result in no effect, while 1 will prevent any vertical water surface velocity under the lid.
3. Results and Discussion
3.1. Numerical Model Validations
Free-floating motions predicted by the numerical model were first validated against experimental data extrapolated from the 1:36 scale model device in regular and irregular sea states. Although the experimental response amplitude operators (RAOs) were derived from results in which the device was moored with the horizontal soft mooring system, the influence of such moorings on the heave and pitch motions was found to be negligible. Numerically, the RAOs were computed through the hydrodynamic diffraction solver in the frequency domain in which the OWC device was modelled as a free-floating body in heave and pitch whilst restrained in surge.
To obtain the experimental RAOs, 10 consecutive peaks of a steady-state response were used to determine average values from regular wave runs, as recommended by the International Towing Tank Conference [27]. It should be noted that such a requirement was unachievable at longer periods (≥18 s at full scale) due to the reflected waves in the physical tank. Previous experiments conducted as part of the testing facility and equipment calibration suggested a reflection coefficient of ≥20% for T ≥ 3 s (≥18 s at full scale). As a result, a reduced number of peaks was taken to obtain the experimental RAOs for T ≥ 18 s. Figure 5 shows the RAOs for both heave and pitch motions. As expected, the addition of external viscous damping into the numerical model reduced the motion amplitudes around the two peaks (T ≈ 14.4 s and 23 s), while having little effect on the other regions. There is a good correlation in the heave motions from 5 to 20 s, with slight discrepancies around the first peak of the RAO, indicating the external viscous correction may be slightly understated. The pitch RAO also shows consistency with the experimental results, for wave periods less than 10 s, after which inconsistencies develop. The numerical RAO tends to zero around the 10.5 s mark; however, this is a trend consistent with numerical RAOs derived for semi-submersible platforms using potential flow solvers [28,29,30]. For wave periods exceeding 10 s, the numerical RAO underpredicted the pitch response, except for the first peak. Nevertheless, in comparison to the experimental results, the numerical model does not seem to be able to capture the characteristics of the RAO such that there is still some degree of over-estimation, more significant in the peak correlating to the longer period, which can be attributed to the effect of reflected waves. Such a discrepancy is unlikely to be associated with viscosity addition or moonpool damping, as the numerical RAO remained relatively consistent in these areas over the three simulation cases.
Surprisingly, the influence of the external lid was found to be negligible for both RAOs, with only a very slight difference in magnitude seen at the second peak in the pitch RAO (Figure 5b). Further investigation into the inclusion of the external lid and associated damping factors is recommended to determine the sensitivity and influence of these parameters.
A fast Fourier transform of the heave and pitch responses during the free decay tests revealed two prominent peaks at similar frequencies to those contained within the RAOs. The natural period for both motions is assumed to be the longer of the two peaks due to the increased magnitude evident in both the spectral density and RAO results. This assumption was carried through to the determination of the external viscous force/moments, as outlined in Section 2.2.2. The natural periods, damping coefficients, and corresponding external damping forces/moments for heave and pitch are outlined in Table 3.
A comparison of the results from the numerical decay tests against the experimental data is provided in Figure 6 for heave and pitch motions. It should be noted that all peak values of experimental data obtained from repeated runs were found to demonstrate good repeatability with a small coefficient of variation (CV), i.e., standard deviation/mean value, of ≤5%. This is consistent with the findings of the recent experiments conducted by the authors, as documented in [31,32]. With the addition of the external viscous correction and moonpool lid, the numerical decay test results showed a close correlation with the experimental data, particularly after the results settled into a more sinusoidal form. The results from the numerical heave decay test indicated a slight over-estimation of the heave and pitch motions; however, the heave and pitch motions recorded during the pitch decay test were very similar. These results indicated that the numerical model could predict the heave and pitch natural periods of the FOWC within a relative error <4.5% and that the method of implementing a linear viscous correction in these degrees of freedom is acceptable.
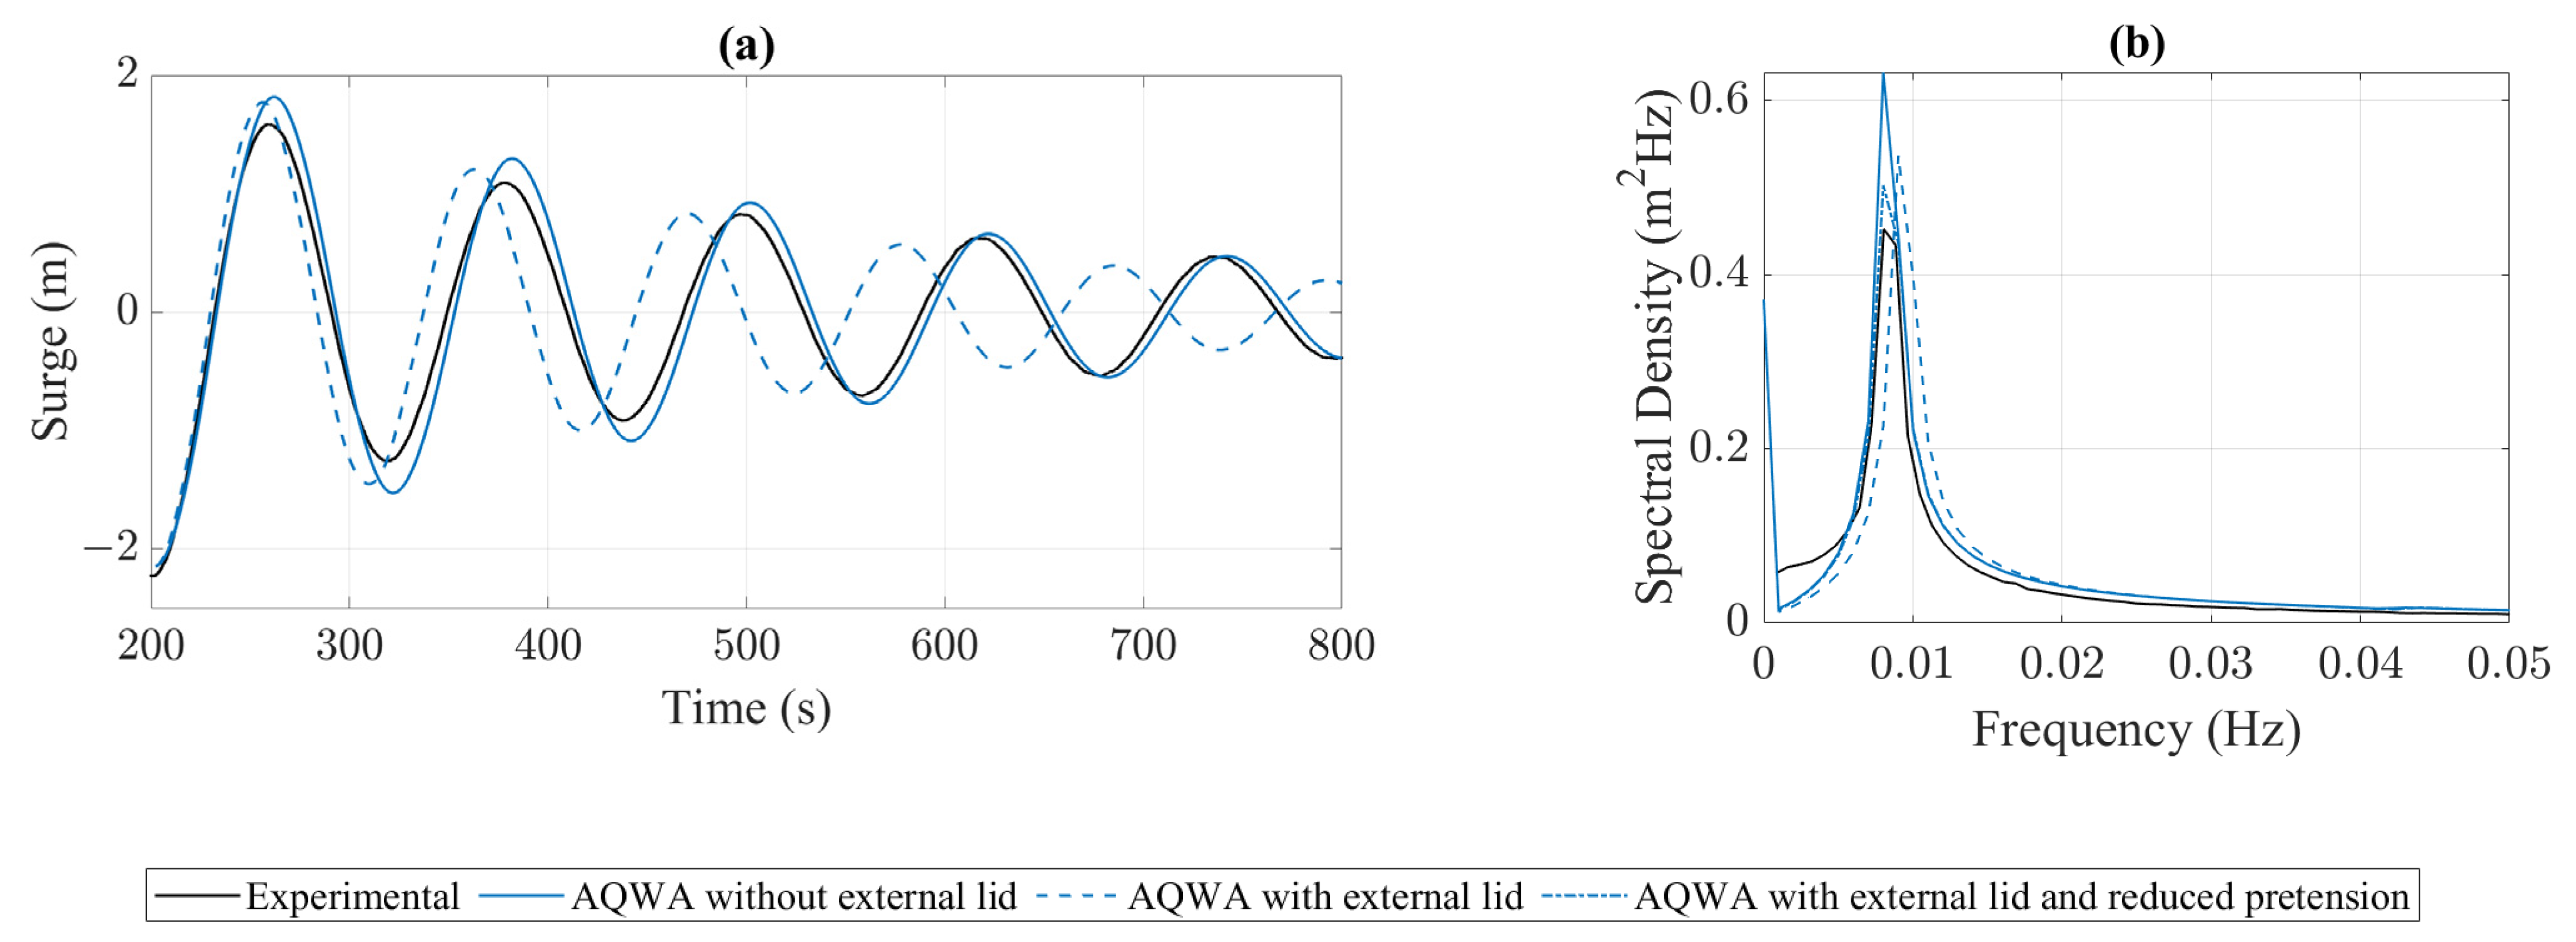
The moonpool damping coefficient significantly affected the surge natural period during the decay test, as seen in Figure 7. The experimental surge damping coefficient (~7%) and pre-tension estimates were insufficient in providing the required damping and restoring forces, respectively. As a result, the surge viscous damping factor was increased to 9% to reduce the error in the surge amplitude, and the mooring pre-tension was reduced to align the natural period within 0.5% following the addition of the external lid. The final input values, which produced a relative error of <1% for the resulting numerical natural period in surge in comparison with the measured one, are listed in Table 4.
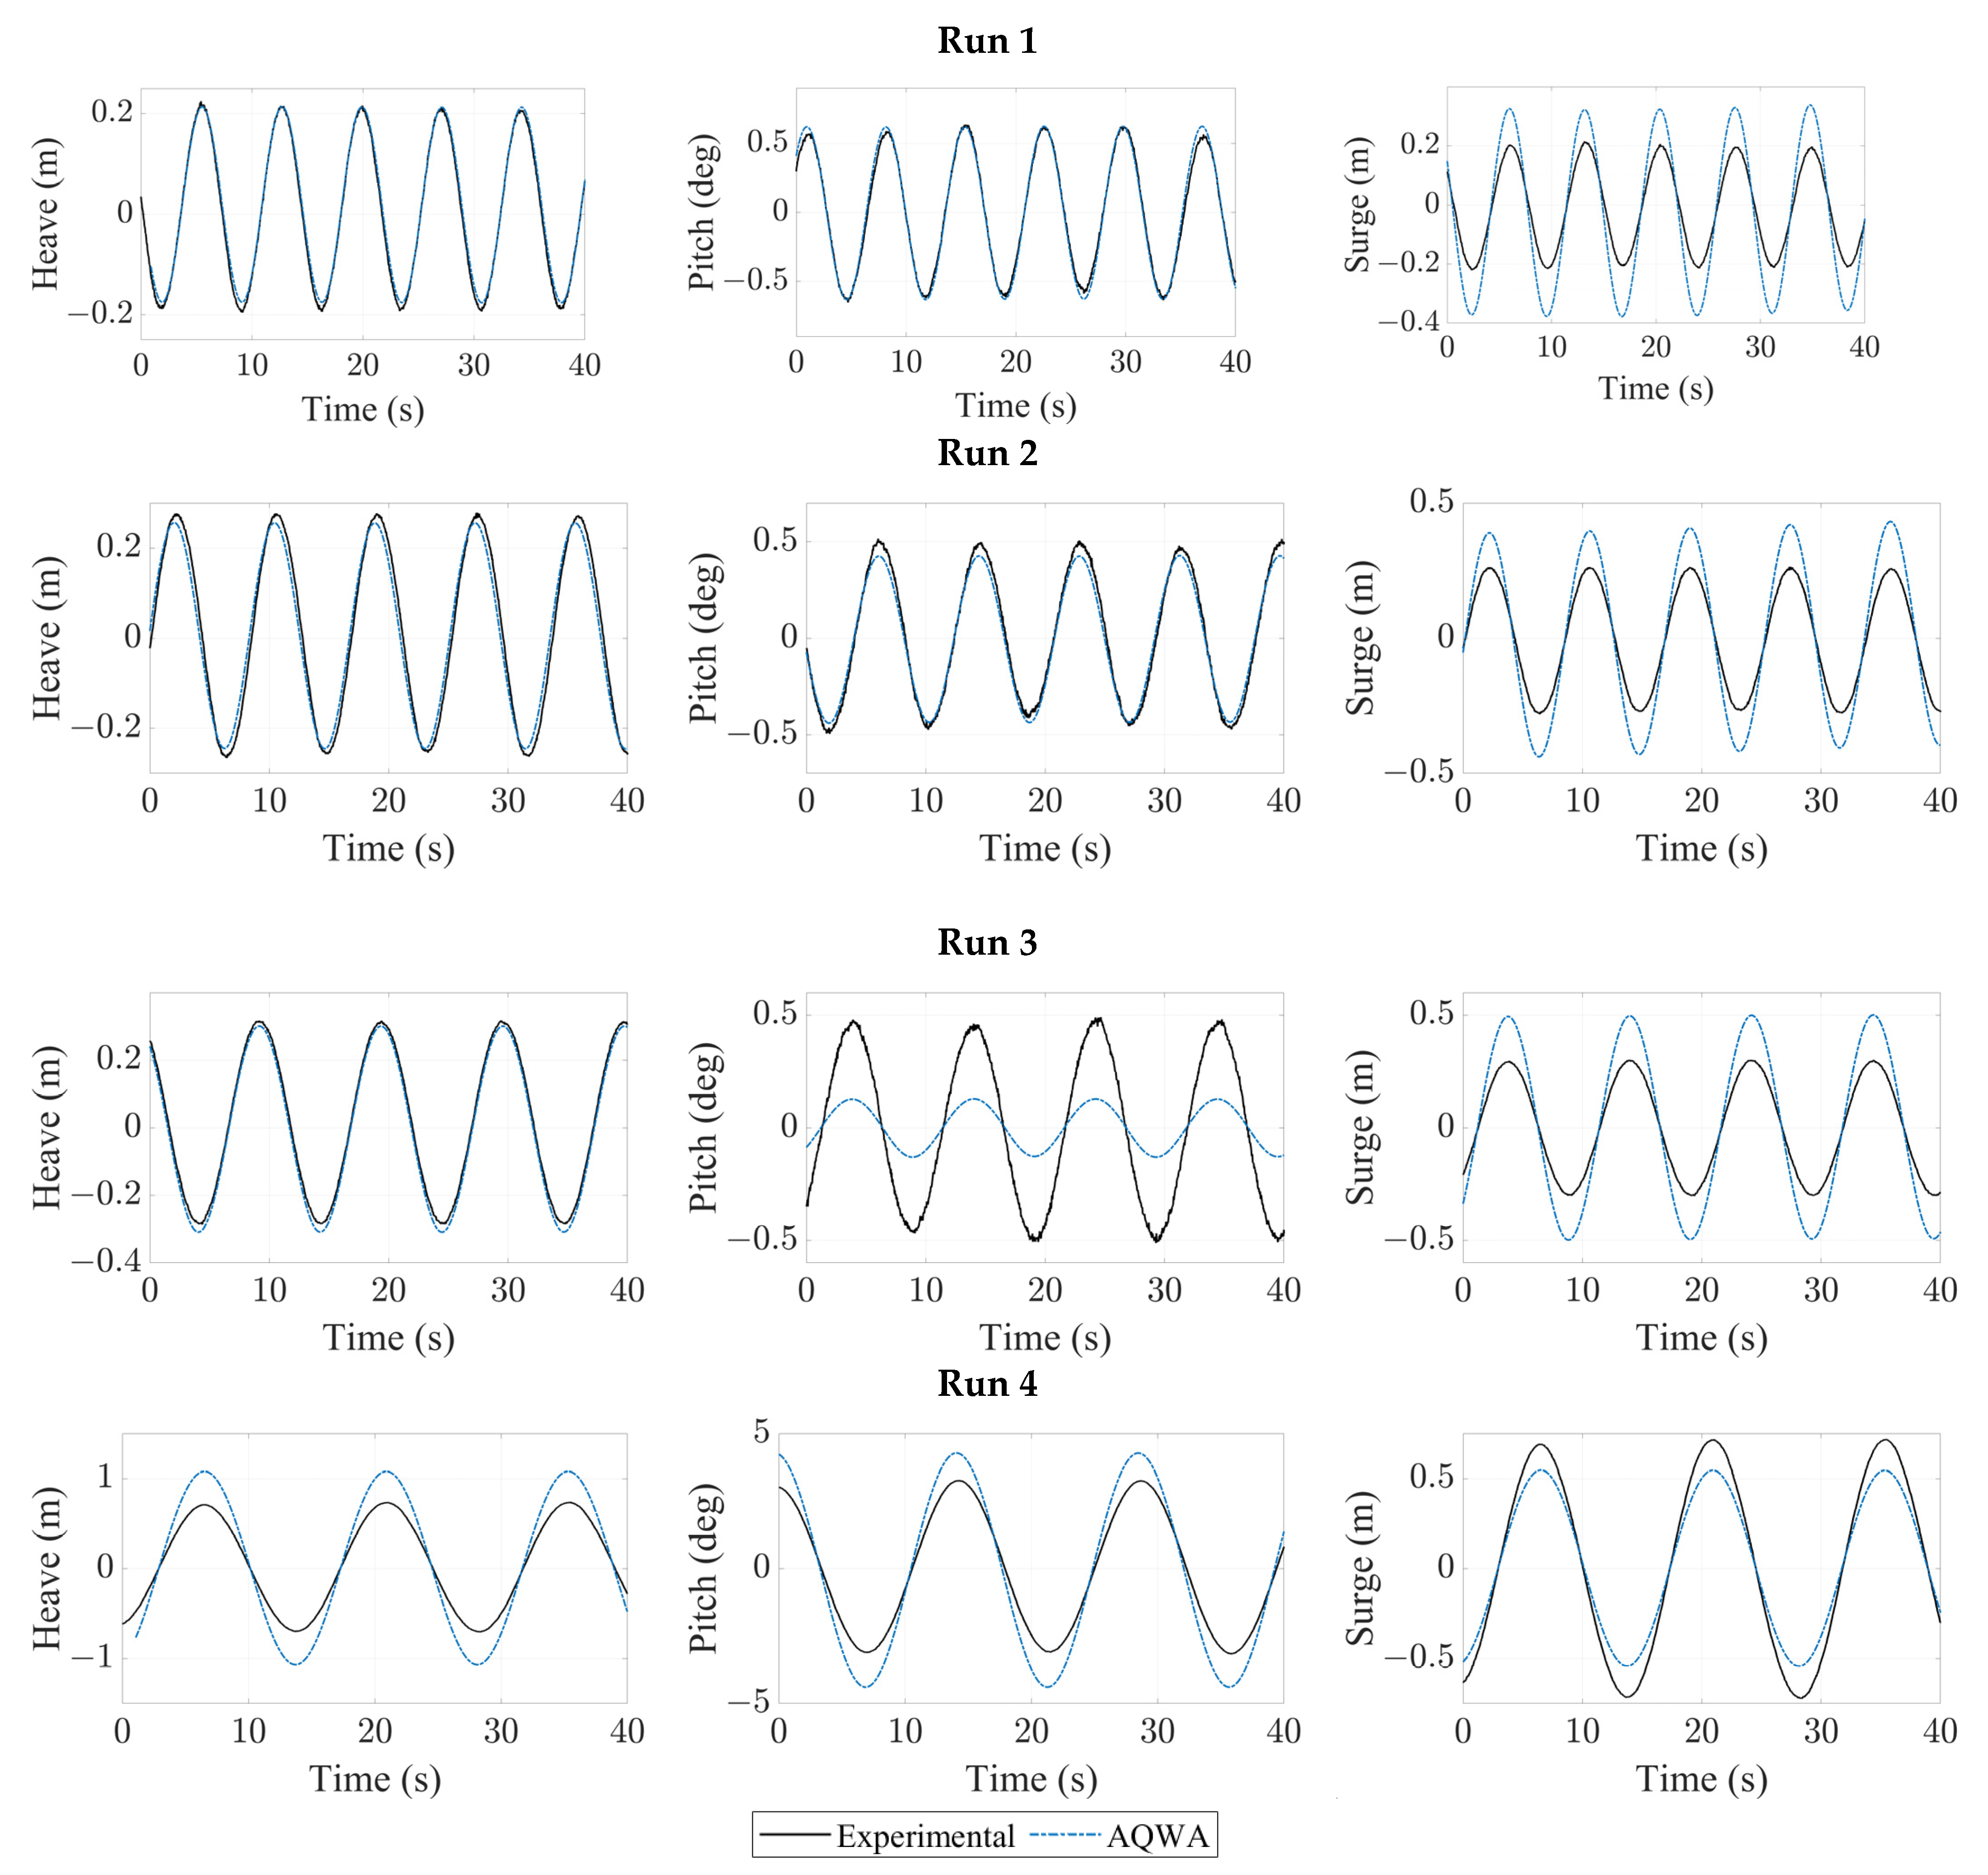
The numerical model was subjected to four regular wave cases, all with a wave height of 1.404 m, and periods ranging from 7.2 to 14.4 s. Table 5 presents a comparison of numerical heave, pitch, and surge motions against the experimental results. As expected, the heave and pitch motion magnitudes were overpredicted in the final case (T = 14.4 s), with approximately a 52% and 48% increase, respectively. Such a discrepancy is expected to occur due to the wave period coinciding with one of the dominant peaks observed in the RAOs (Figure 5). An increase in the viscous damping coefficient would likely lead to better agreement in this wave case. For all other cases shown in Figure 8, the heave motion showed very close agreement with the experiment. Similarly, the pitch motion showed very close agreement with the experiment for the wave periods of 7.2 s and 8.4 s. The moonpool natural period is estimated at approximately 7.8 s, and these results indicate that the inclusion of the moonpool does not negatively affect the accuracy of the heave and pitch motion predictions. The largest discrepancy in the results was noted in the pitch motions for the 10.2 s wave case, with the numerical model under-estimating the magnitude by approximately 73%. This wave period directly aligns with the near-zero point in the pitch RAO which is suggested to be the main cause for the discrepancy.
In all cases, the magnitude of surge motions showed some inconsistency. An error in the external viscous force is a potential explanation for the overprediction of the surge motions at the shorter frequencies; however, further investigation would be required to evaluate whether the viscous damping is an influencing factor for the motions at wave periods this far removed from the surge natural period.
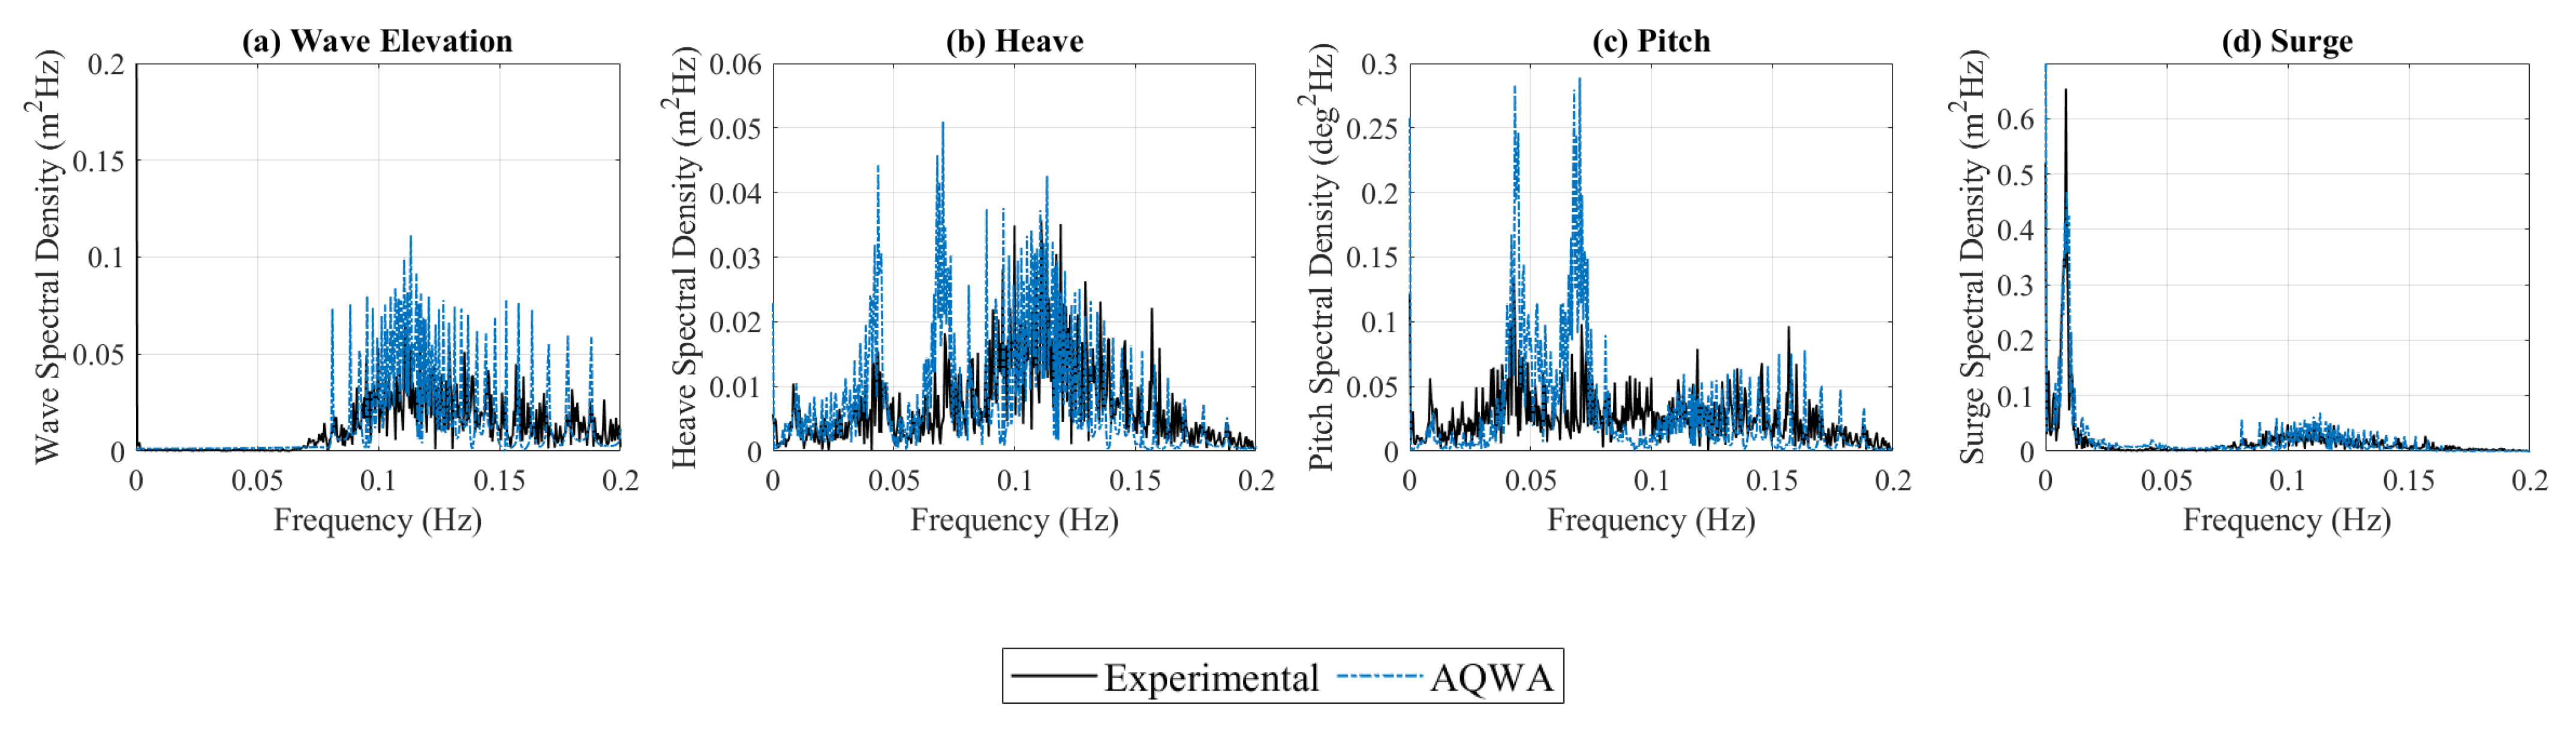
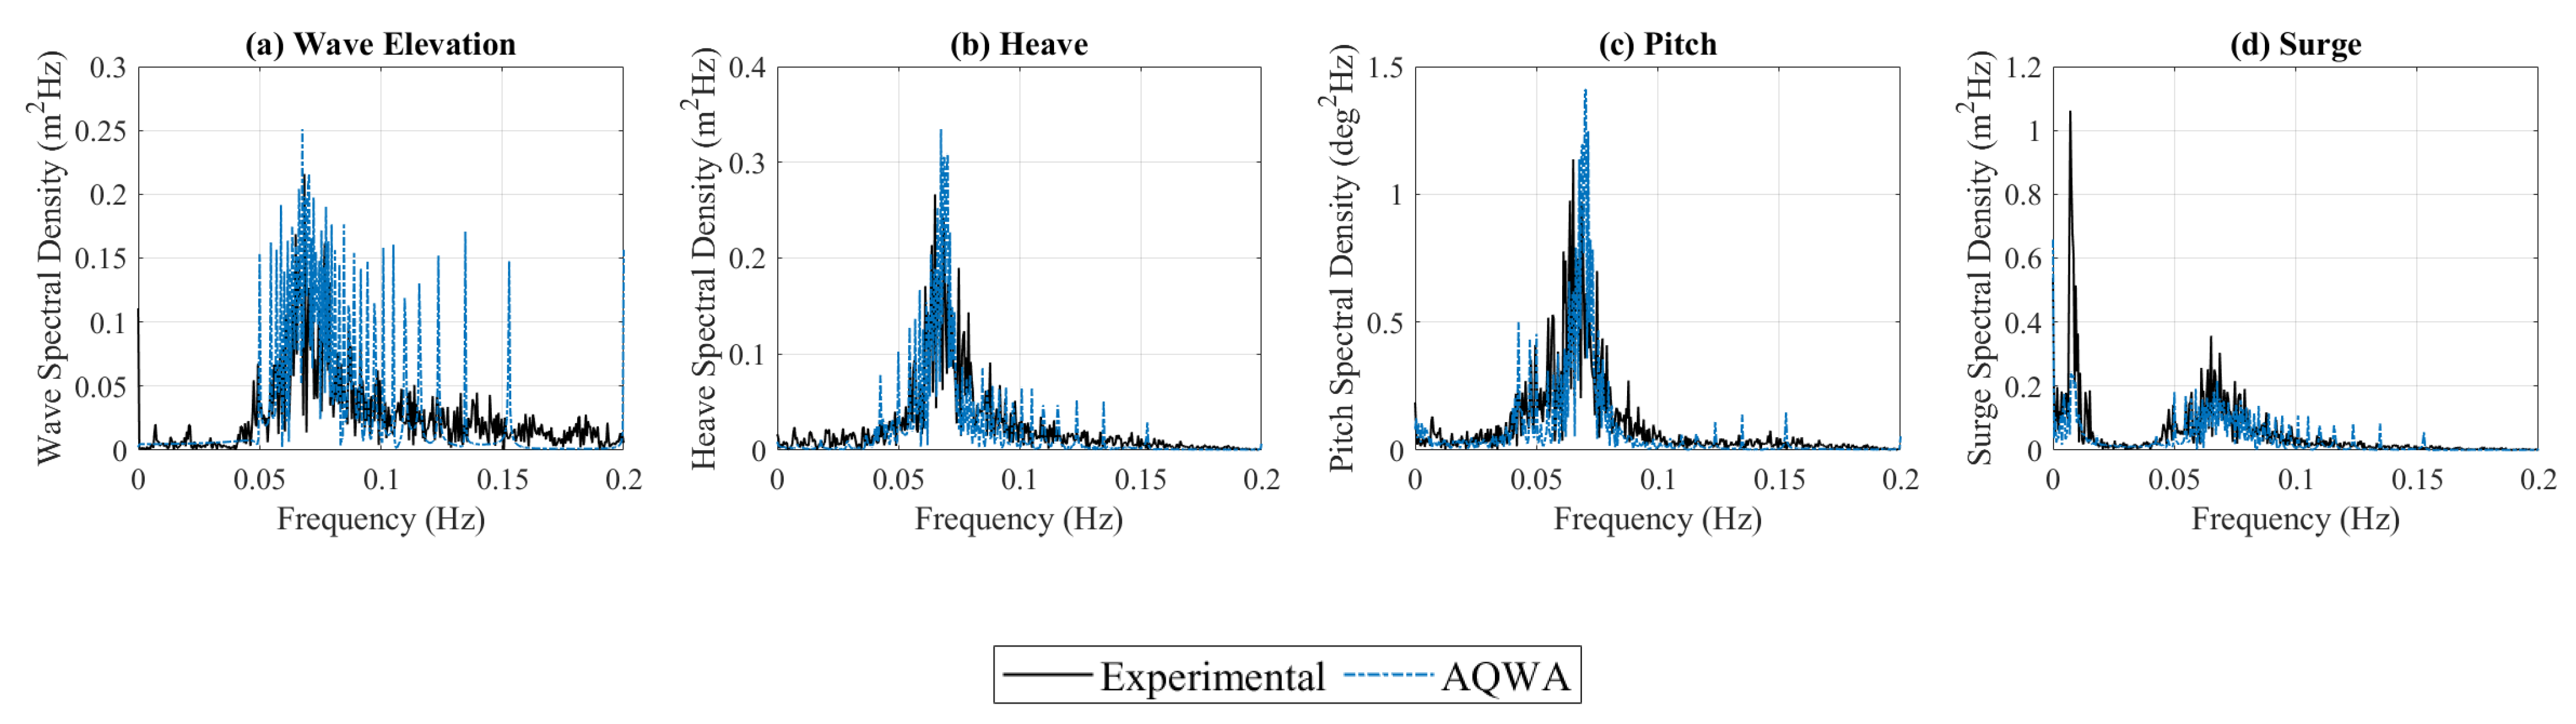
Two irregular wave cases were considered for the validation of the numerical model: an operational sea state of Hs = 1.584 m and Tp = 9.012 s and an elevated sea state of Hs = 3.384 m and Tp = 14.598 s. These parameters were used to generate respective Joint North Sea Wave Project (JONSWAP) spectrums in the numerical simulations, with a factor of 3.3 for the non-dimensional peak shape parameter (γ). A time history of 36 min was simulated to perform analysis in both time and frequency domains. Table 6 presents a comparison between experimental and numerical results for irregular wave conditions for wave spectral parameters and significant motion amplitudes. In the operational sea state (see Figure 9), the motions were predicted relatively well for frequencies matching those within the irregular wave train; however, there was a significant response in heave and pitch motions at frequencies outside the wave field. Although the response was also apparent in the experimental results, it was numerically overpredicted. As the peaks of these responses directly aligned with the natural frequency peaks evident in the spectral analysis of the decay tests, the overprediction is likely related to the understated viscous correction. For the elevated condition (see Figure 10), relative agreement in the heave, pitch, and surge motions was obtained with overpredictions in the heave and pitch motions and underprediction of the surge displacement. It should be noted that the considerable differences in the free surface elevation will lead to error propagation when comparing the motion of the device.
3.2. Mooring Analysis
Following the experimental validation of the FOWC motions, the soft mooring line configuration was replaced with a four-line catenary spread to investigate the motions of the device under a more realistic station-keeping arrangement. The mass of the device was reduced to compensate for the weight of the suspended mooring lines, and the water depth was increased to 100 m, but all other parameters remained unchanged. An R3 chain grade of studless configuration was chosen as the mooring line material due to its prevalence in the offshore industry [33]. Chain specifications regarding physical properties and load characteristics were taken as the standard values offered by the commercial vendor Ramnas [34]. Mooring design is an iterative process and must be optimised to find an economical solution capable of meeting all the operational requirements, which is often a time-consuming process when considering all the design factors, including fabrication, installation, maintenance, station-keeping performance, fatigue evaluation, and decommissioning [35]. The scope of this investigation was limited to the hydrodynamic performance of the device under a single mooring to influence future optimisation of the moorings. Specifically, the intent was to identify key areas of concern and operating boundaries in the FOWC.
The anchor radius, line length, and chain diameter were determined through a basic static analysis of the system, with the requirement that the anchors should experience zero uplift at the design far offset of the device [36]. Mooring design often uses a maximum offset as a starting point in the process, typically controlled by an allowable displacement or line angle in riser/umbilical components. Further development of the FOWC device is required to determine an appropriate offset; hence, this investigation assumed a nominal design maximum offset of 15% water depth. As this study focused on the effect of the mooring lines and not the design of a site-specific arrangement, the environmental design conditions were assumed as the drift force experienced under a significant wave height of 6 m (Hmax = 11.16 m) and a peak period of 12 s. The drift force was calculated through numerical analysis using the near-field solution, as the solver cannot facilitate the far-field solution when incorporating an external lid [23]. The characteristics of the mooring spread are listed in Table 7. The moorings were incorporated into the numerical model as non-linear catenary cables, and the simulations were run with a dynamic analysis method, considering the hydrodynamic drag effect of the cables. The drag coefficients were adopted as those specified in DNV-OS-E301 [37].
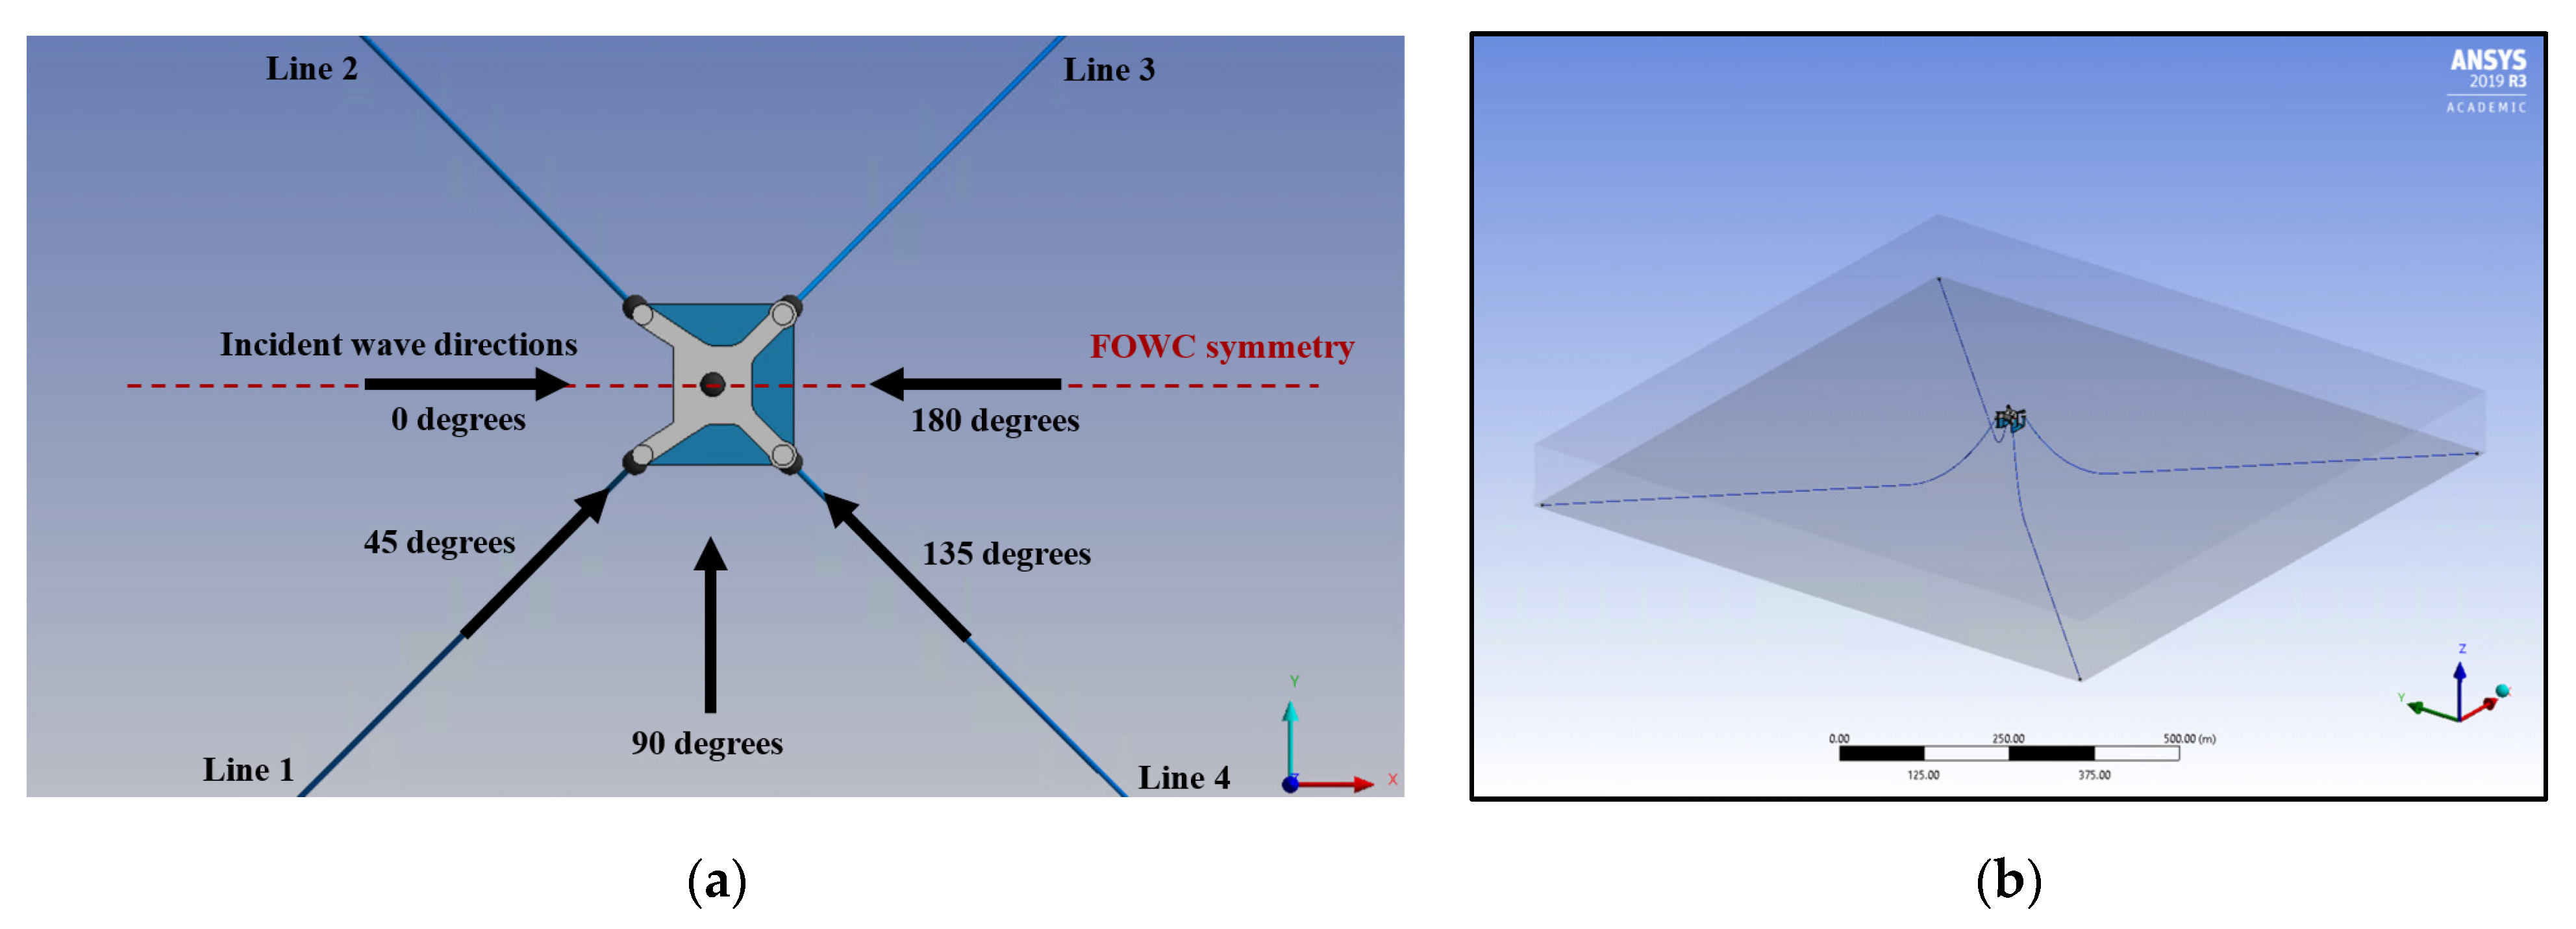
Structures in offshore environments are susceptible to variable wave directions, and this must be taken into consideration during the design procedure of both the structure and the mooring configuration. Five general sea-state conditions were investigated, selected from the sea-state codes provided by the World Meteorological Organisation (WMO). The conditions were analysed with irregular waves, applying the same JONSWAP method as used in the experimental validation. The duration of the time-domain simulations was 3 h [33], at a time step of 0.1 s. The device’s symmetry across the x axis was utilised in the selection of the five incident wave angles, at 45° intervals. Table 8 and Figure 11 provide more details on the mooring configuration, incident wave angles, and analysed sea states. Although the FOWC will likely operate in reasonably shallow waters and thus be somewhat sheltered in certain directions from swells developed over long fetch distances, this investigation assumed the wave climate was uninterrupted in all directions.
3.2.1. Effect of Wave Height and Incident Wave Direction
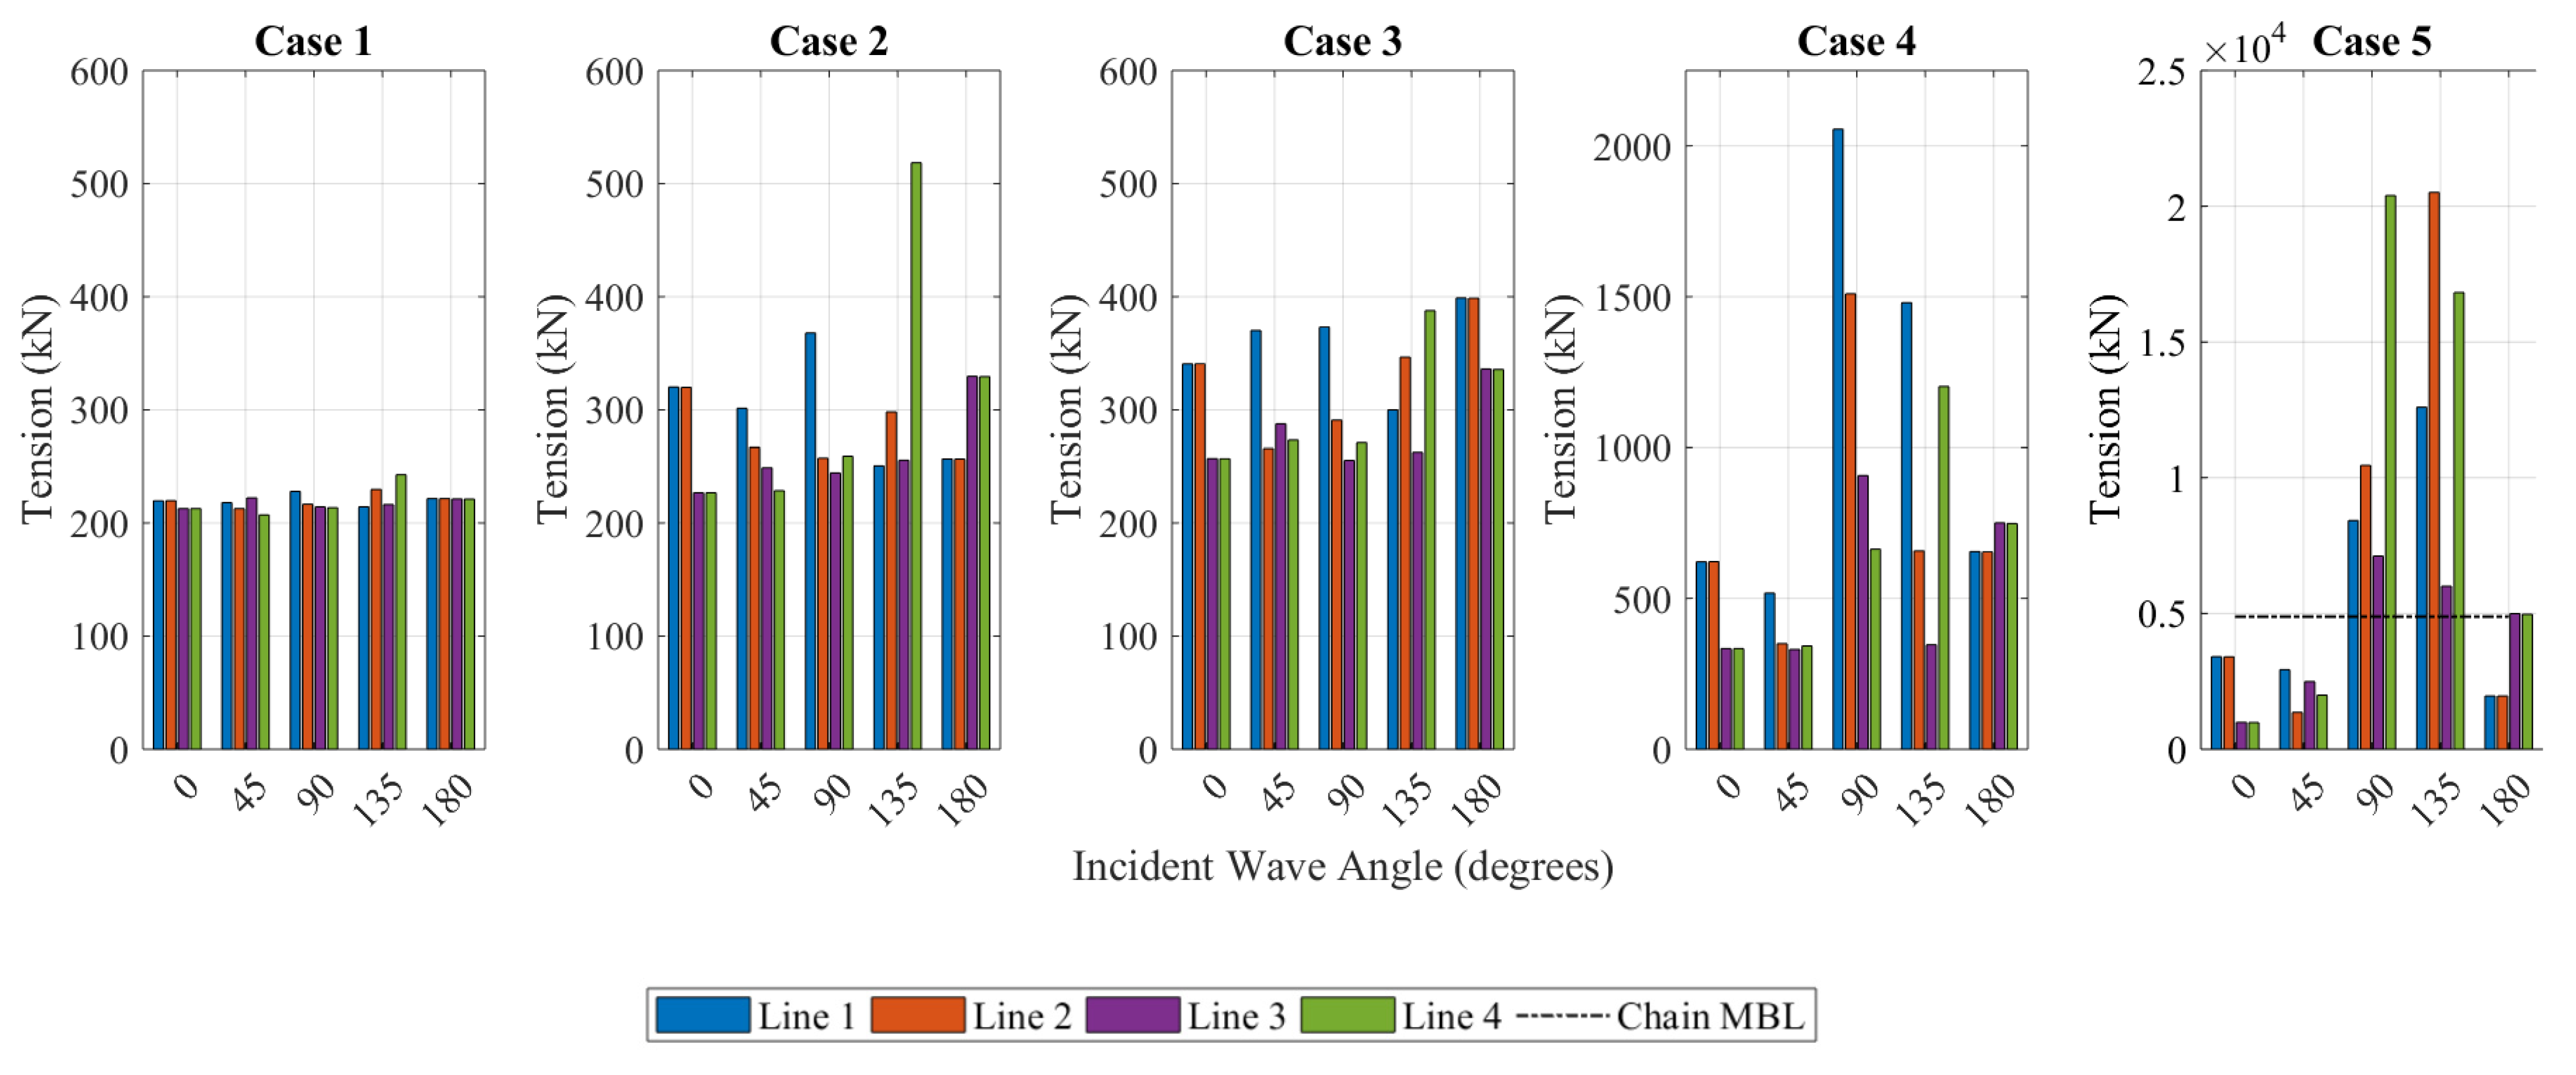
Table 9 and Figure 12 show the single maximum tension experienced in the catenary mooring spread during the 3 h storm duration. The minimum breaking load of the chain, as specified by the manufacturer, is 4884 kN. The results suggest that integrity in all lines will be maintained over the analysed wave directions in Cases 1–4. In Case 4, with an environmental direction of 90°, the maximum tensions in the lines were significantly higher than the other incident directions, almost exceeding the safe working load of the chain (minimum breaking load/safety factor (MBL/SF)). This is likely a combination of the additional wave drag force due to the front walls of the device and the corresponding yaw rotations due to the asymmetry of these walls across the y axis.
For angles 90°, 135°, and 180°, the minimum breaking load was exceeded in Case 5, indicating the current mooring configuration is insufficient for a survivable sea state of Hs = 9 m and Tp = 12 s. Further analysis of the data indicated that all three failures occurred within the first hour of the storm, at wave heights of 13.5 m, 14.6 m, and 11.3 m, respectively. For this reason, data corresponding to Case 5, and the stated angles, were excluded from the following discussions as the motions and tensions after this failure point cannot be assumed accurate.
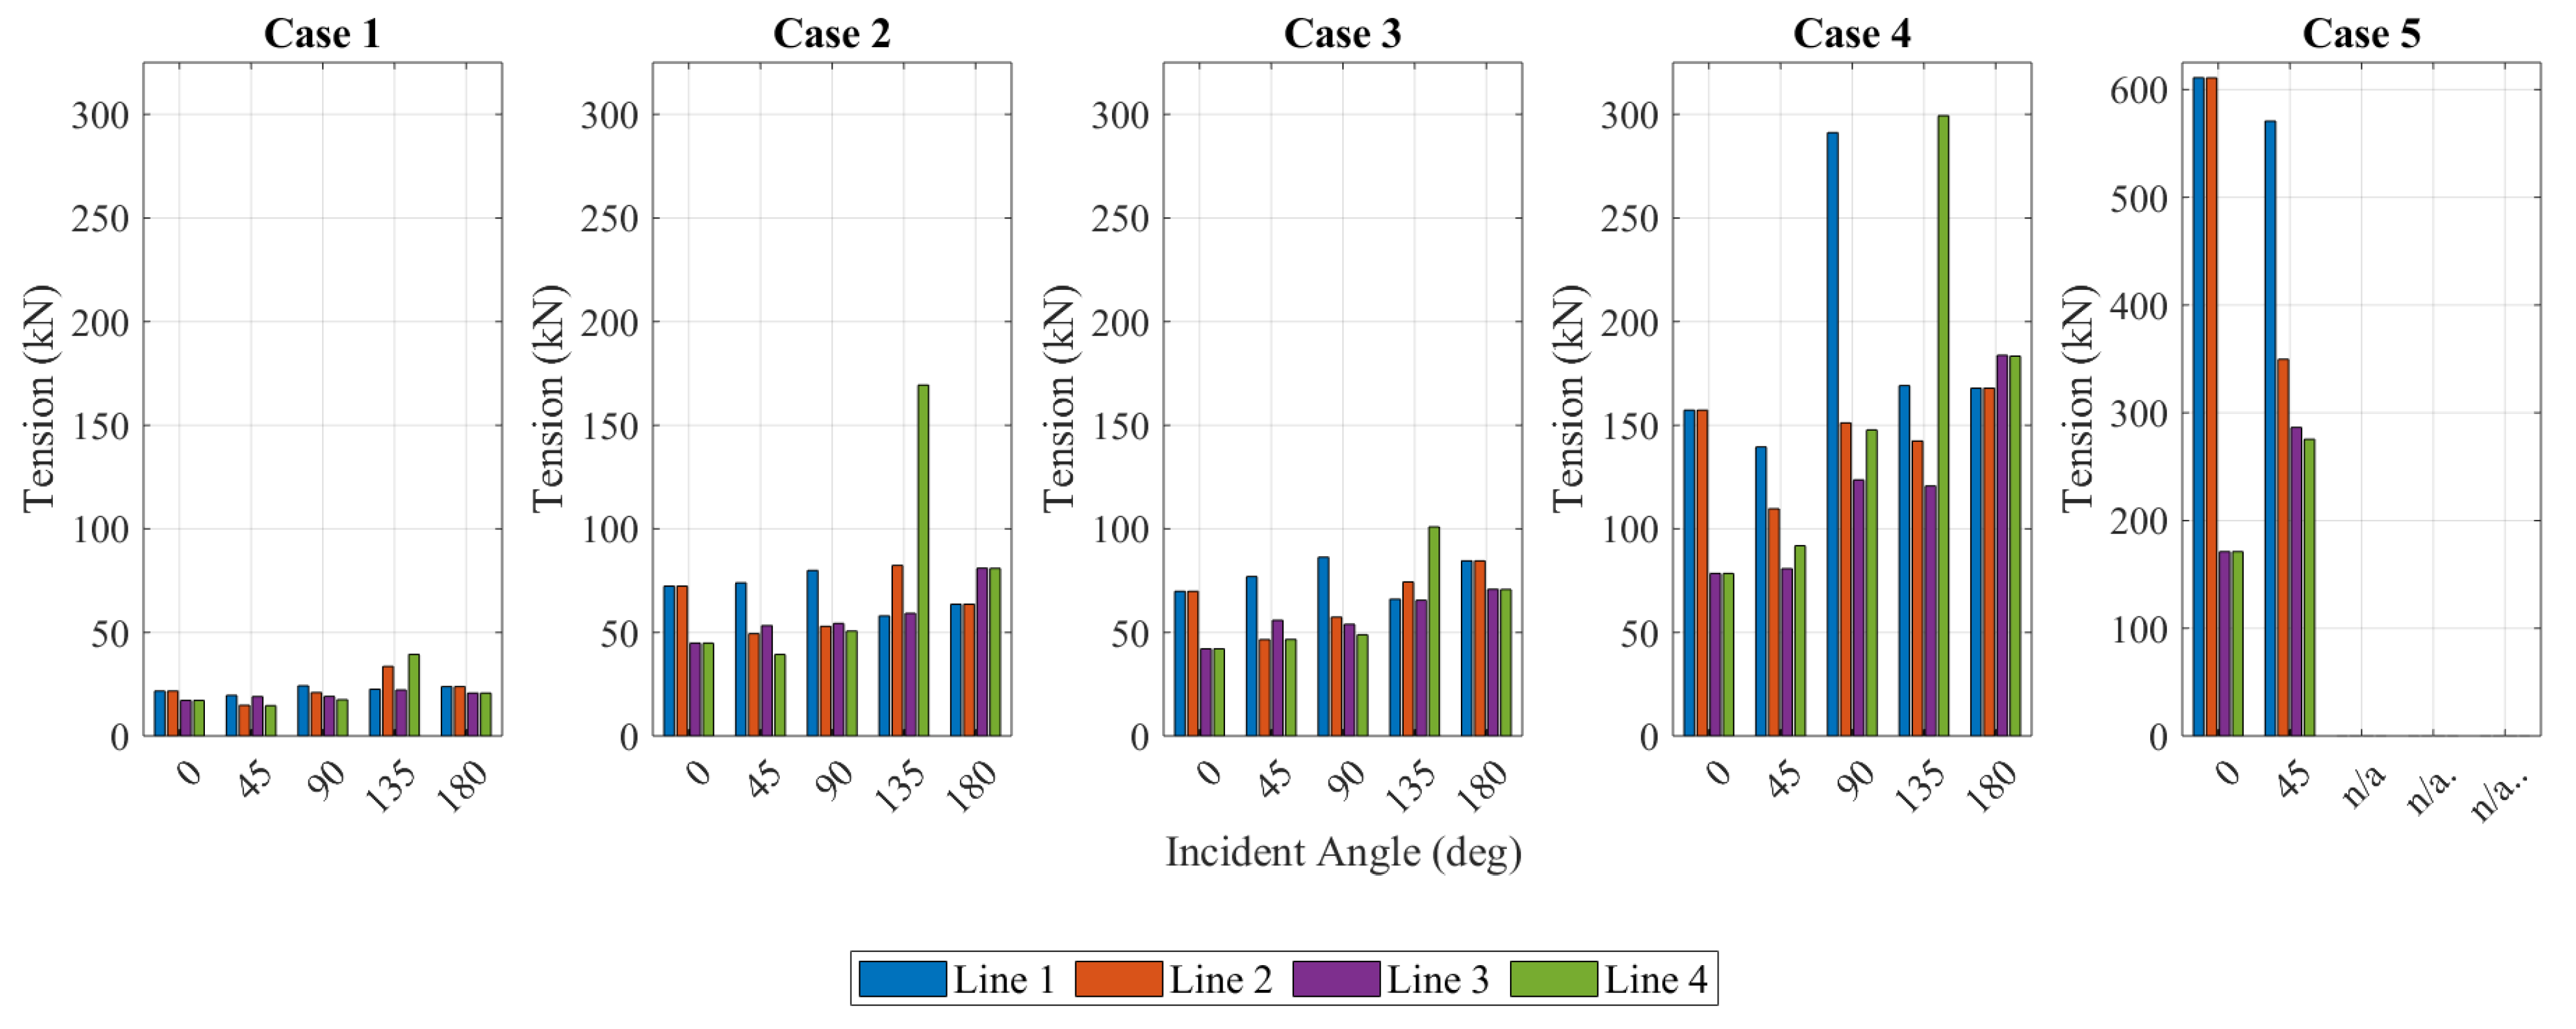
The mean tensions experienced in the lines during the storm periods, displayed in Figure 13, present an idea of the critical mooring line/s for each wave direction. The results were as expected, with the load being distributed symmetrically across the x axis for head seas of 0° and 180° incident angles and with the lines attached to the forward columns experiencing higher tensions, forward being relative to the incoming wave direction. This is reflective of the catenary shape of the lines under these conditions, with a longer suspended length, and thus more suspended chain weight, present in the forward lines as the device offsets with the incoming waves. In beam seas (90° incident angle), Line 1 controlled the largest portion of tension. This was previously noted because of the asymmetry in the front walls of the device. For the angled wave trains (45° and 135°), the highest mean tensions were experienced in the lines perpendicular to the incident wave angle and forward relative to the incoming wave train. This is again reflective of the increase in tension due to the increase in suspended length. In all cases, excluding the disregarded Case 5, the highest mean tensions were experienced in Line 4 during an incident wave angle of 135°. As this investigation assumes the device is subject to sea states from all incident wave angles, this line was considered the critical component, noting that the symmetry of the device means that Line 3 would be equally critical under wave angles of 225°.
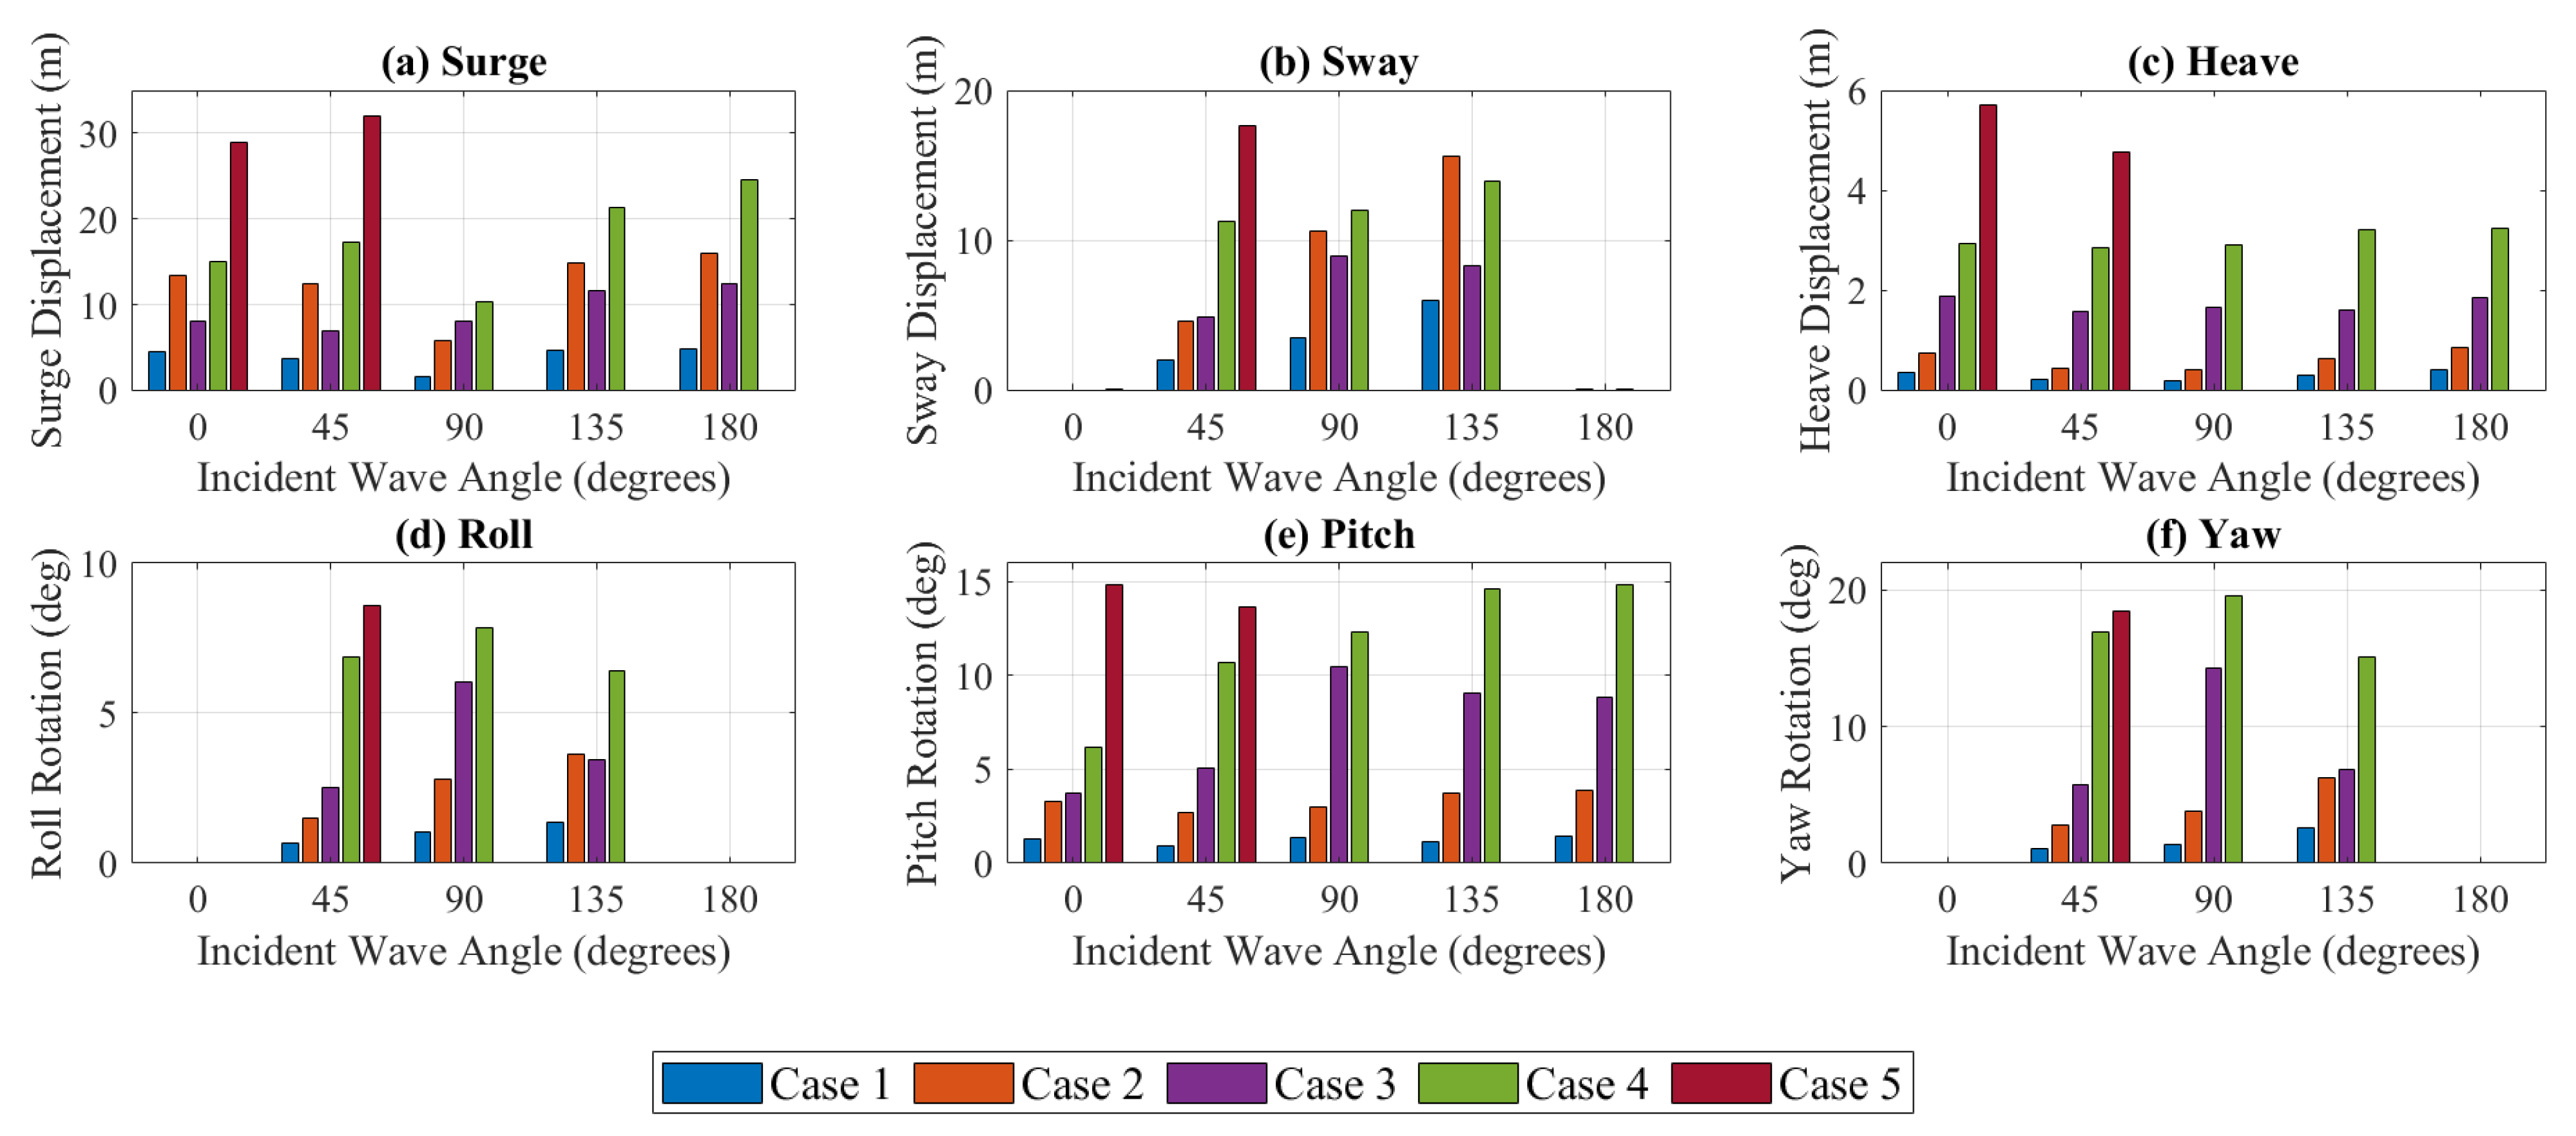
In terms of significant motions, the heave displacements and pitch rotations remained relatively consistent over all the incident wave directions, as seen in Figure 14. Surge displacement was also consistent for all angles, excluding 90°, where the surge motion was resulting only from the reaction force of the wave impact on the asymmetrical front walls of the device. As expected, sway, roll, and yaw motions were negligible for the head sea conditions (0° and 180°), where the symmetry of the device along the x axis caused balanced reaction forces under the incoming waves. One unexpected result was the higher relative horizontal displacements in Case 2 (Hs = 2.5 m, Tp = 8 s) compared to those of Case 3 (Hs = 4 m, Tp = 12 s), particularly evident in the sway motions at a 135° wave angle. This suggests that the peak wave period of the irregular sea state has a controlling influence on the horizontal restoring forces of the mooring system, and this should be considered in conjunction with the wave heights during catenary mooring optimisations. This is specifically crucial in the design of devices in proximity. Although the static method followed in the mooring design assumed a maximum offset of 15% water depth at an Hs of 6 m, the significant horizontal motions were observed to exceed this limit for some cases.
3.2.2. Effect of Mooring Line Failure
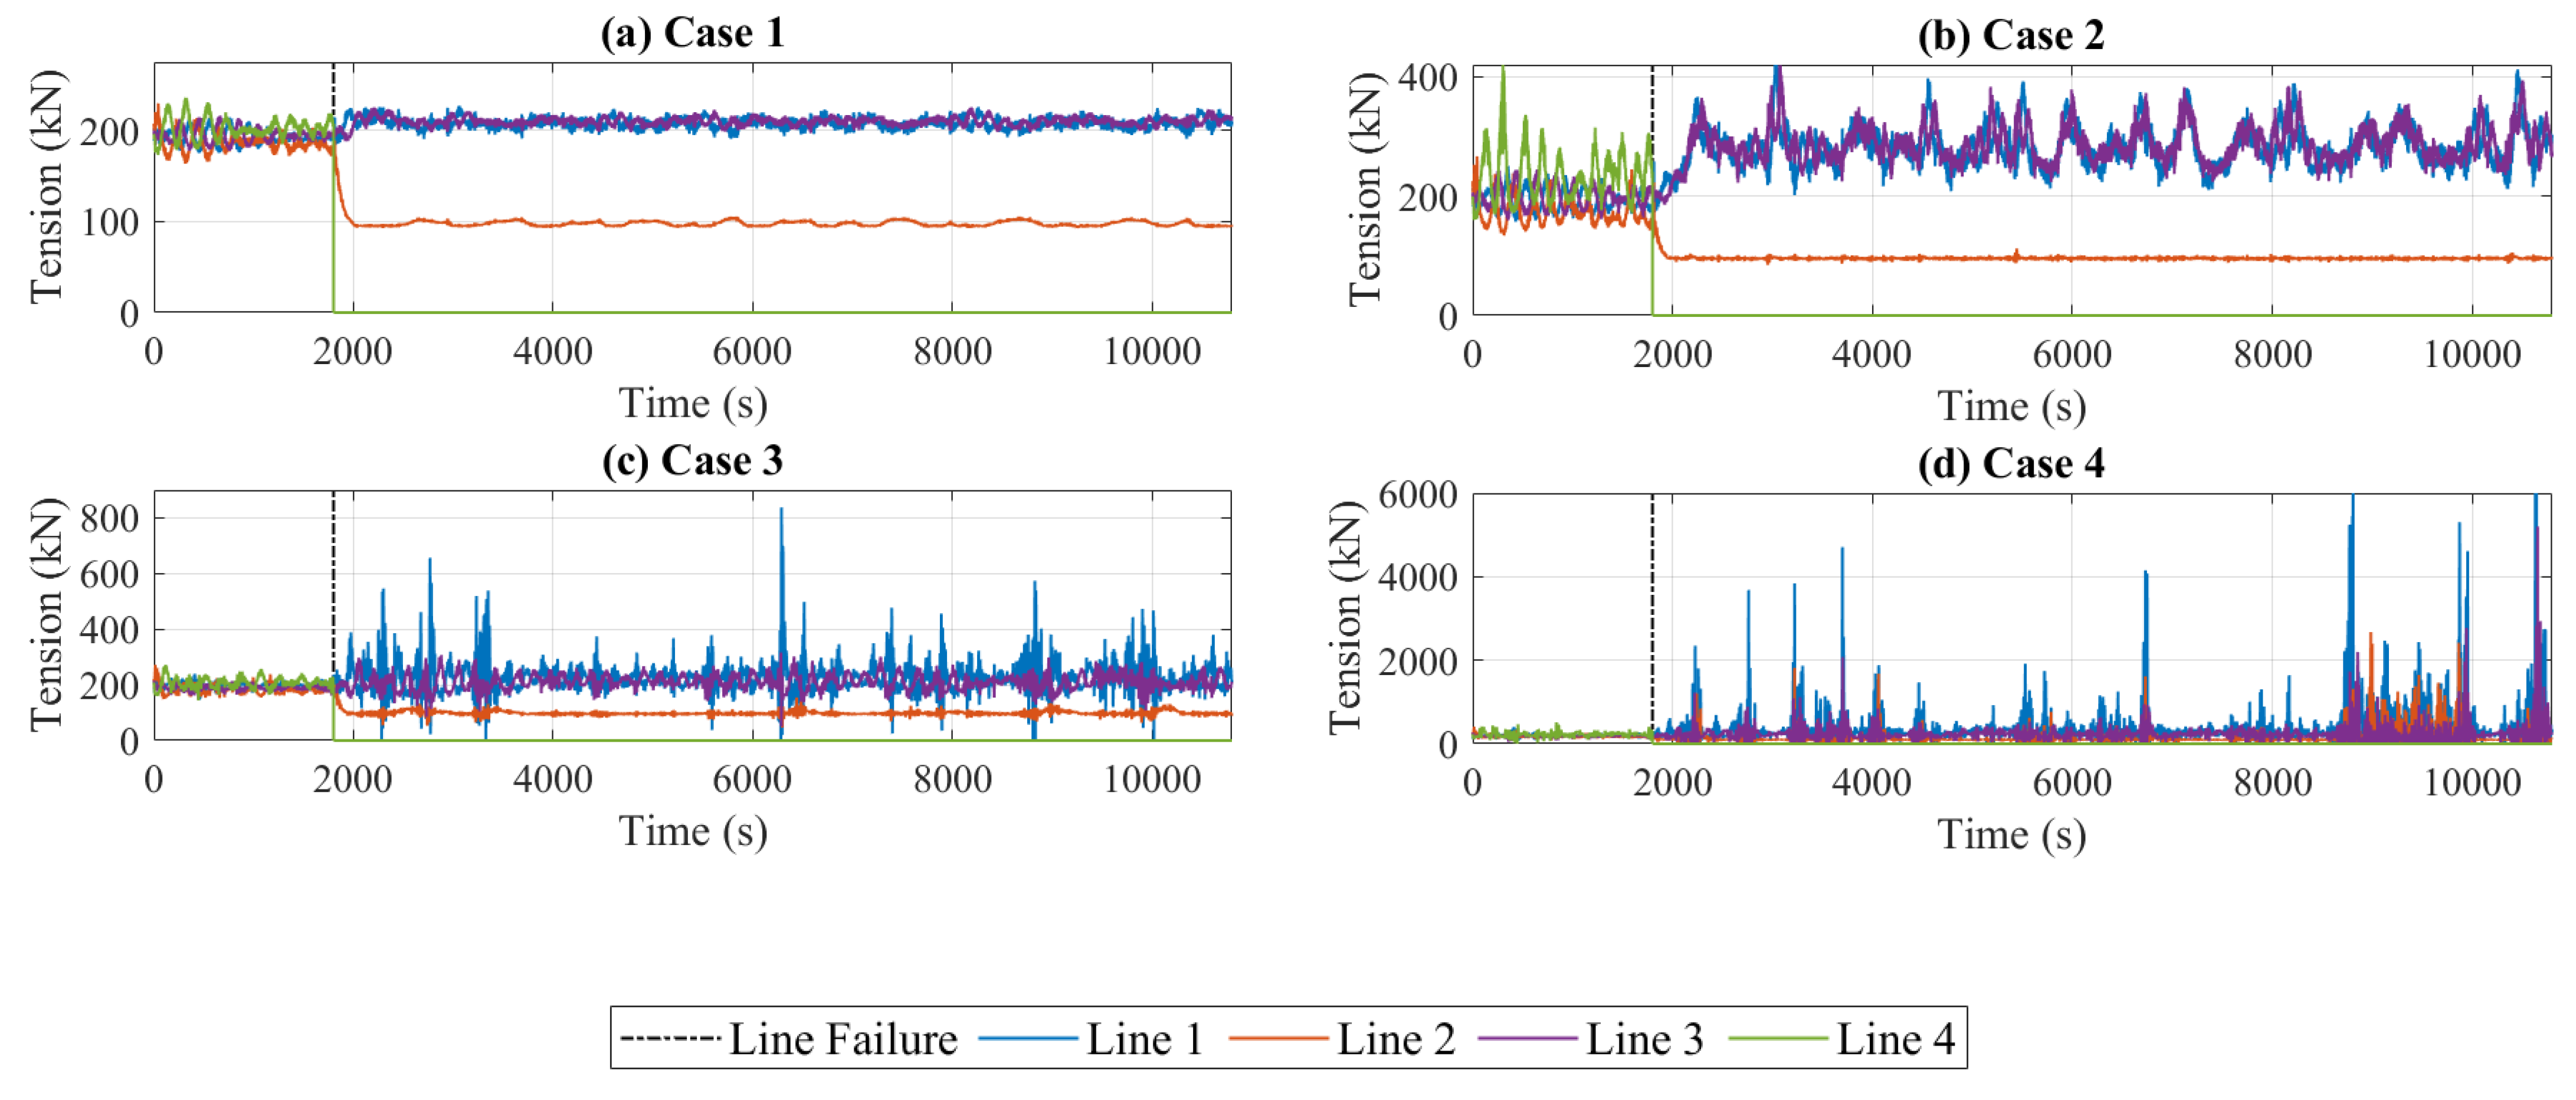
The wave incident angle of 135° was selected as the critical condition to assess the device’s recovering and on-going performance following the failure of a mooring line. At this incident angle, the greatest tension was observed in Line 4, and it was assumed that this line would be the most susceptible to failure. Simulations were run for Cases 1–4, with a failure of Line 4 occurring at the fairlead location at 1/6th of the storm duration. Case 5 was disregarded from this study, as the previously discussed results indicated the mooring configuration to be insufficient in the intact condition. As seen in Figure 15, in all cases, the loss of the restoring force from Line 4 increased the tension magnitude in both Line 1 and Line 3, with Line 1 of a slightly larger value, due to the asymmetry of the device. This ratio was found to increase for the two larger wave heights, with significant spikes in load on Line 1. For Case 4, the tension in Line 1 exceeded the minimum breaking load of the chain and further failures should be expected.
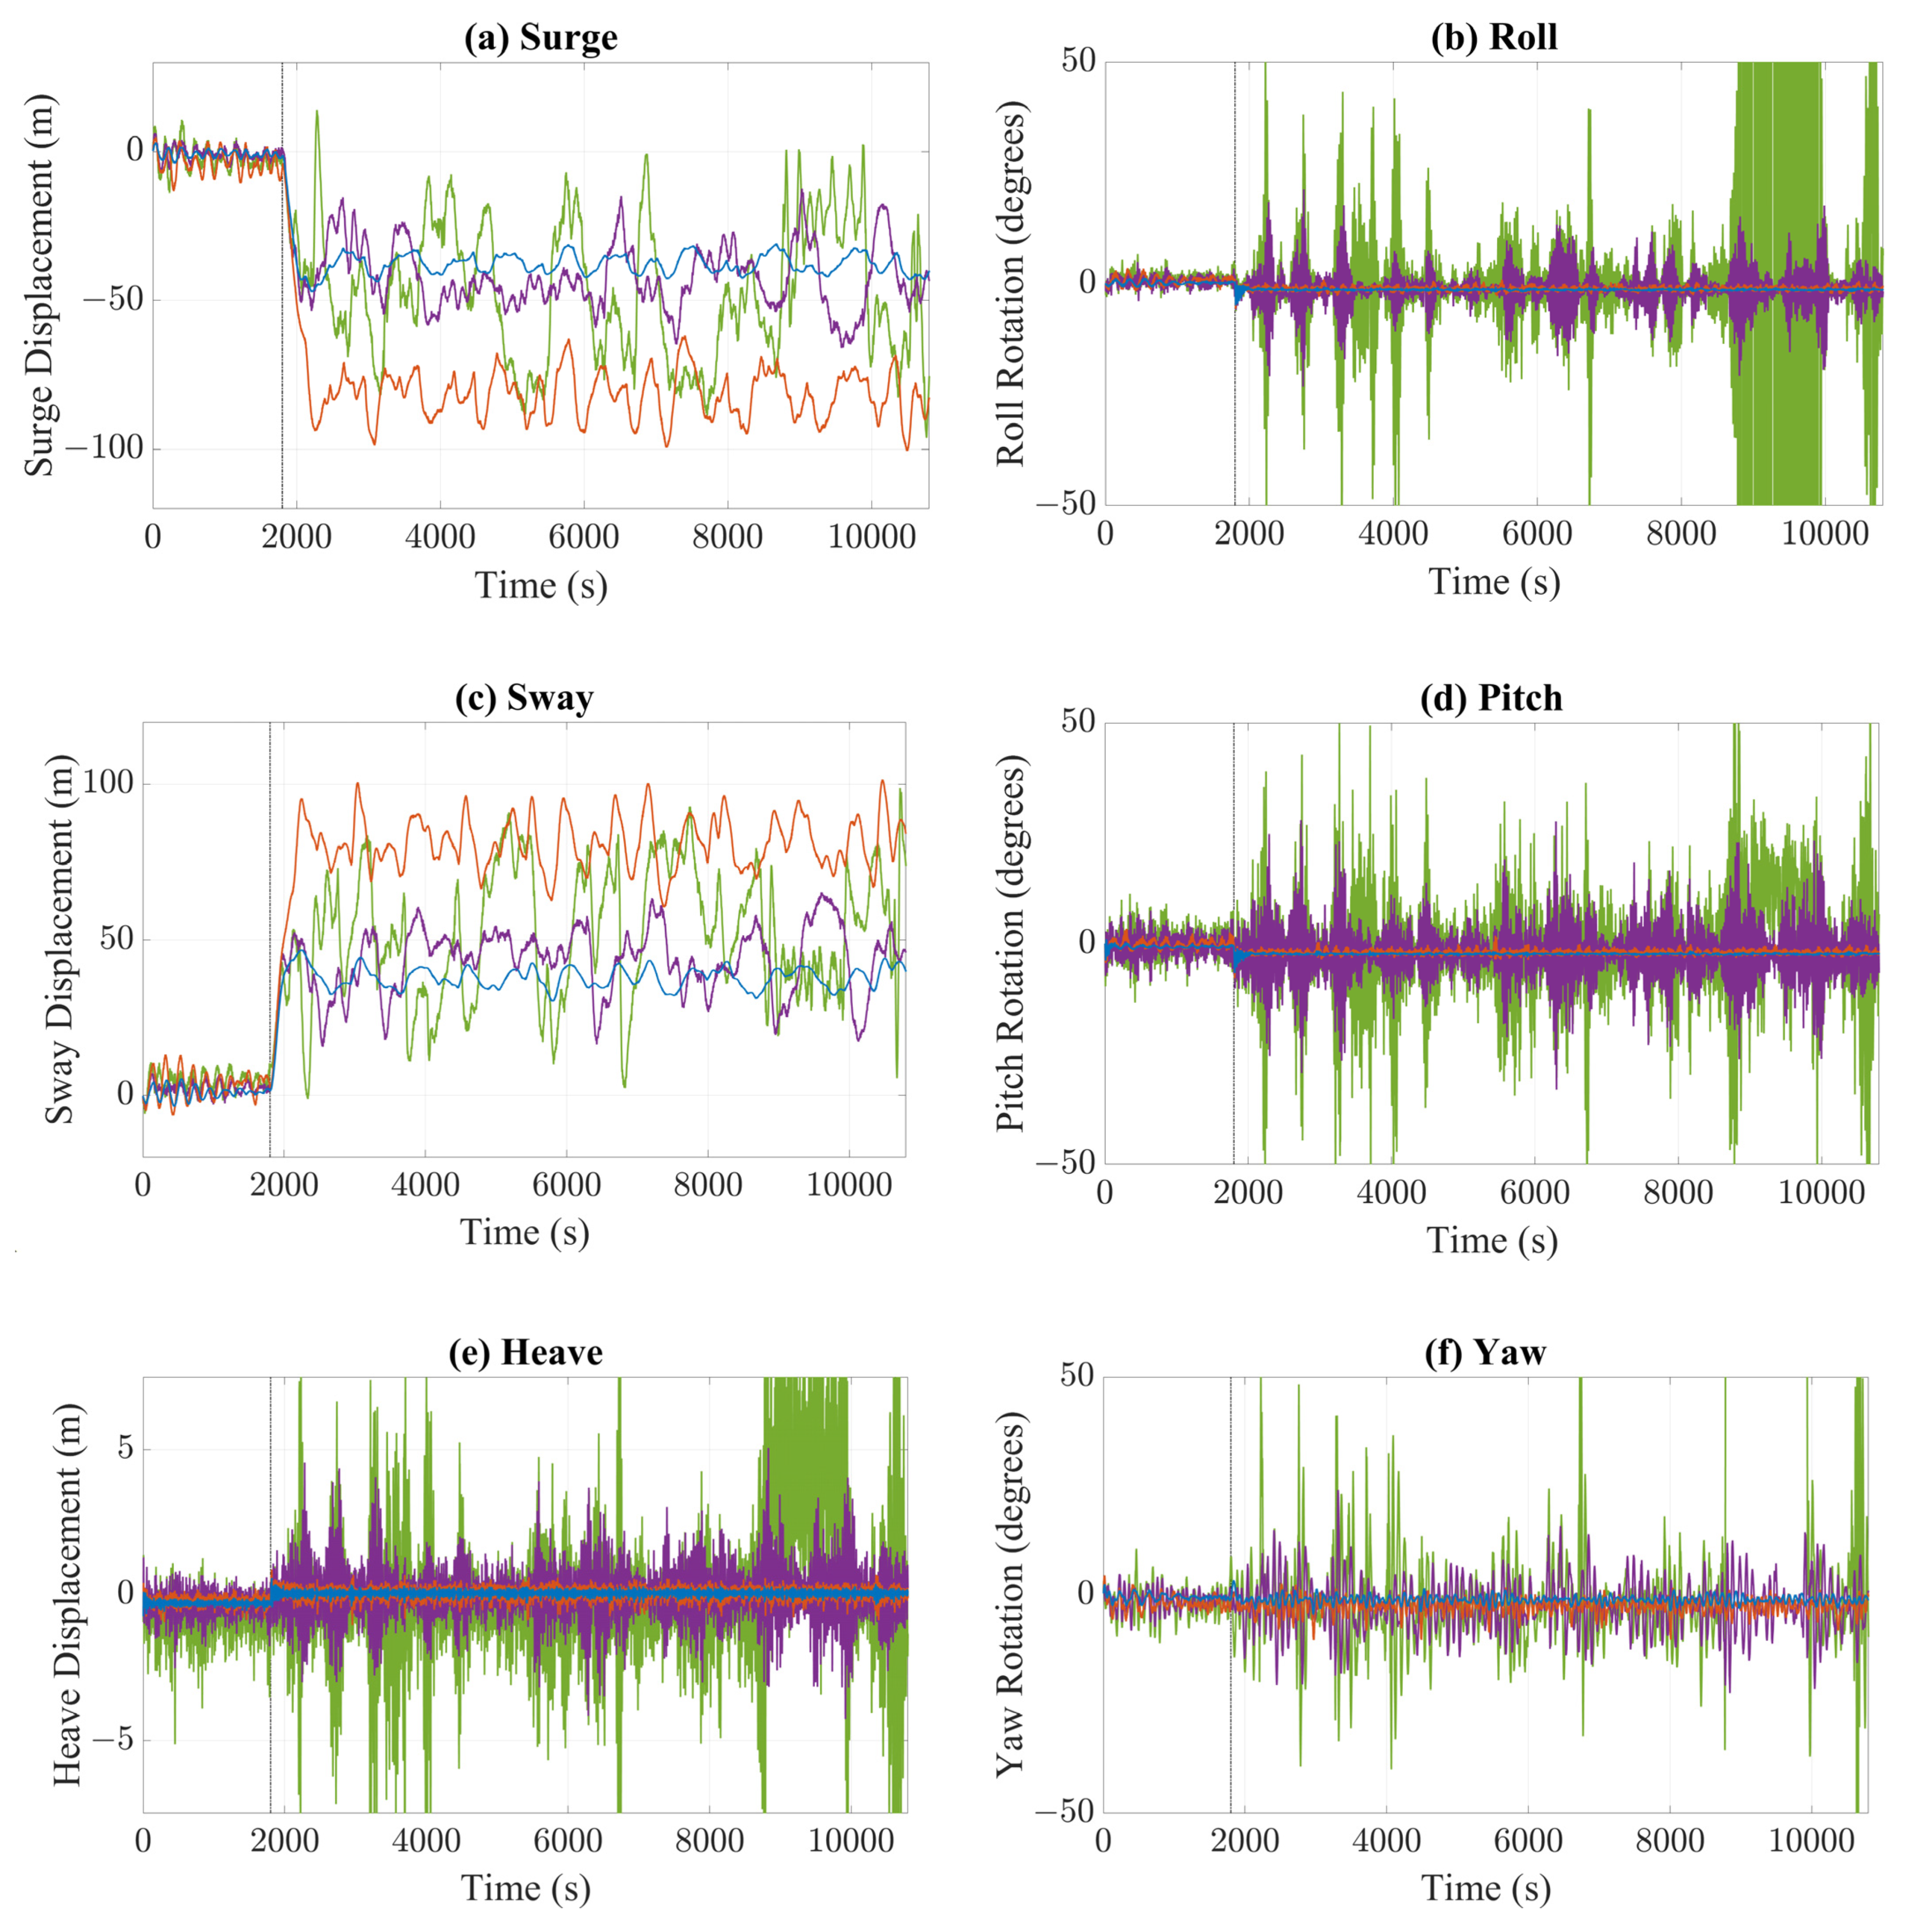
As seen in Figure 16, following the failure of Line 4, the device underwent a horizontal offset in line with the incident wave angle, until the tensions in the remaining lines provided enough restoring force to maintain an equilibrium position. A reduction in the tension of Line 2 was observed post-failure of Line 4, with minimal fluctuations following the return to equilibrium. This indicates that the tension in this line is predominantly resulting from the weight of the suspended line, which is likely close to vertical through the water column. At a water depth of 100 m, the submerged weight of the chain equates to a tension of 98.5 kN, which supports this conclusion. The transient period to a new equilibrium position was most evident in the horizontal displacements. While the magnitude of the low-frequency oscillations increased with wave height, the greatest equilibrium offset was experienced in Case 2. This response corroborates with the previous suggestion that the horizontal restoring force is dependent on the wave frequency. For Cases 1 and 2, a minimal increase in the significant heave and yaw motions was observed, at less than 0.15 m and 0.75°, respectively. Likewise, there was a minimal alteration in the roll and pitch rotations, with the failure of the mooring resulting in a slight decrease in the significant response (~1.6°), potentially due to an adjustment of the equilibrium angle. However, substantial increases in these motions were evident in Cases 3 and 4, with the structure capsizing about the x axis in Case 4.
4. Conclusions and Recommendations
In this investigation, a floating oscillating water column (FOWC) wave energy converter was modelled using a numerical code based on potential flow theory, i.e., ANSYS AQWA. The numerical modelling of the hydrodynamic performance of the device was compared against experimental data from a test campaign conducted in the wave basin with a 1:36 scale model. Further studies investigated the hydrodynamic performance under varied irregular sea states and incident wave angles, with station-keeping requirements being met by a four-line spread catenary mooring configuration. The key findings and recommendations from the validation study and mooring analyses are:
- The lack of viscosity led to overpredictions of the heave and pitch motions around the resonant frequencies. With the addition of an external viscous damping factor, derived experimentally, the solver was able to replicate the free decay tests with considerable accuracy in both magnitude and the period of oscillation.
- The validation of the device motions in regular sea states and RAOs showed a close correlation for shorter wave periods. For longer wave periods, the accuracy of the experimental results was found to be likely affected by reflected waves in the testing facility. In irregular sea states, good agreeance was observed for the motions corresponding to the wave frequencies. In all cases, the numerical results slightly overpredicted the response around the resonant frequencies, suggesting that the additional viscous damping could be increased.
- In the catenary mooring study, wave direction was observed to have a minimal effect on heave and pitch motions and a more prominent effect on sway, roll, and yaw motions. The surge motion was consistent across all directions, excluding beam seas (90°), which showed less response.
- For all cases tested, the highest tensions were experienced in the mooring line/s on the forward side of the device, relative to the incoming waves. For devices located in areas with a predominant swell direction, mooring design should consider a heavier chain on the forward lines and a lighter chain on the rear, as a cost reduction strategy. Future design iterations should also consider an increased number of incident wave angles, in conjunction with coupled loading from wind and current forces.
- The mooring line tensions were observed to exceed the minimum breaking limit for a sea state of Hs = 9 m and Tp = 12 s. Following the simulated loss of Line 4 under a 135° incident wave, the device showed good recovery for operational to moderate sea states but experienced a catastrophic loss of positive stability in Hs = 6 m and Tp = 12 s. This indicates that a heavier mooring line or alternative configuration must be considered if the expected wave conditions are within this scale.
- Larger horizontal motions were evident in the moderate sea state when compared to the rough sea state, despite the increase in significant wave height. It is suggested that this is the consequence of the shorter wave period in the moderate sea state. To determine the validity of this assumption, a moderate sea state with a longer period should be analysed and compared with the original results.
Author Contributions
Conceptualization and methodology, N.A. and E.G.; Experimental investigation and analysis, E.G., and A.P.; Software and validation, A.P.; Writing—original draft preparation, A.P.; Writing—review and editing, A.P., E.G., N.A., and C.C.; Supervision, N.A., E.G., C.C., and I.P.; funding acquisition, N.A., E.G. All authors have read and agreed to the published version of the manuscript.
Funding
The financial support from the National Centre for Maritime Engineering and Hydrodynamics, Australian Maritime College, University of Tasmania, Australia, and the Institute of Marine Engineering, Science and Technology is acknowledged.
Institutional Review Board Statement
Not applicable.
Informed Consent Statement
Not applicable.
Data Availability Statement
Not applicable.
Acknowledgments
The authors gratefully acknowledge the technical support during experiments from Nick Johnson, Kye Curwen, and Liam Honeychurch, Australian Maritime College (AMC), University of Tasmania, Australia.
Conflicts of Interest
The authors declare no conflict of interest. The funders had no role in the design of the study; in the collection, analyses, or interpretation of data; in the writing of the manuscript, or in the decision to publish the results.
References
- Commonwealth Scientific and Industrial Research Organisation. Ocean Renewable Energy: An Analysis of Ocean Energy in Australia. Available online: https://publications.csiro.au/rpr/download?pid=csiro:EP113441&dsid=DS2 (accessed on 12 April 2020).
- Drew, B.; Plummer, A.; Sahinkaya, M. A review of wave energy converter technology. Proc. Inst. Mech. Eng. Part A J. Power Energy 2009, 223, 887–902. [Google Scholar] [CrossRef] [Green Version]
- Mueller, M.; Wallace, R. Enabling science and technology for marine renewable energy. Energy Policy 2008, 36, 4376–4382. [Google Scholar] [CrossRef]
- Aderinto, T.; Li, H. Review on Power Performance and Efficiency of Wave Energy Converters. Energies 2019, 12, 4329. [Google Scholar] [CrossRef] [Green Version]
- Pecher, A.; Kofoed, J. Handbook of Ocean Wave Energy; Ocean Engineering & Oceanography; Springer: Berlin/Heidelberg, Germany, 2017. [Google Scholar]
- Bosma, B.; Brekken, T.; Lomonaco, P.; McKee, A.; Paasch, B.; Batten, B. Physical Model Testing and System Identification of a Cylindrical OWC Device. In Proceedings of the 12th European Wave and Tidal Energy Conference, Cork, Ireland, 27 August–1 September 2017; Available online: https://www.researchgate.net/publication/319406355_Physical_Model_Testing_and_System_Identification_of_a_Cylindrical_OWC_Device (accessed on 30 September 2020).
- Bailey, H.; Robertson, B.; Buckham, B. Wave-to-wire simulation of a floating oscillating water column wave energy converter. Ocean Eng. 2016, 125, 248–260. [Google Scholar] [CrossRef]
- Gomes, R.; Henriques, J.; Gato, L.; Falcão, A. Wave power extraction of a heaving floating oscillating water column in a wave channel. Renew. Energy 2016, 99, 1262–1275. [Google Scholar] [CrossRef]
- Ma, Y.; Ai, S.; Yang, L.; Zhang, A.; Liu, S.; Zhou, B. Hydrodynamic Performance of a Pitching Float Wave Energy Converter. Energies 2020, 13, 1801. [Google Scholar] [CrossRef] [Green Version]
- Bhinder, M.; Murphy, J. Evaluation of the Viscous Drag for a Domed Cylindrical Moored Wave Energy Converter. J. Mar. Sci. Eng. 2019, 7, 120. [Google Scholar] [CrossRef] [Green Version]
- Beatty, S.; Hall, M.; Buckham, B.; Wild, P.; Bocking, B. Experimental and numerical comparisons of self-reacting point absorber wave energy converters in regular waves. Ocean Eng. 2015, 104, 370–386. [Google Scholar] [CrossRef]
- Yang, S.-H.; Ringsberg, J.W.; Johnson, E.; Hu, Z.; Bergdahl, L.; Duan, F. Experimental and numerical investigation of a taut-moored wave energy converter: A validation of simulated buoy motions. Proc. Inst. Mech. Eng. Part M J. Eng. Marit. Environ. 2018, 232, 97–115. [Google Scholar] [CrossRef]
- Zheng, S.; Zhu, G.; Simmonds, D.; Greaves, D.; Iglesias, G. Wave power extraction from a tubular structure integrated oscillating water column. Renew. Energy 2020, 150, 342–355. [Google Scholar] [CrossRef]
- Malta, E.; Gonc¸alves, R.; Matsumoto, F.; Pereira, F.; Fujarra, A.; Nishimoto, K. Damping Coefficient Analyses for Floating Offshore Structures. In Proceedings of the 29th International Conference on Ocean, Offshore and Arctic Engineering, Shanghai, China, 6–11 June 2010; Volume 1. [Google Scholar]
- Dinoi, P. Analysis of Wave Resonant Effects in-between Offshore Vessels Arranged Side-By-Side. Ph.D. Thesis, Universidad Politécnica de Madrid (UPM), Madrid, Spain, 2016. Available online: http://oa.upm.es/43593/1/PASQUALE_DINOI.pdf (accessed on 29 March 2020).
- Lee, H.; Poguluri, S.K.; Bae, Y.H. Performance Analysis of Multiple Wave Energy Converters Placed on a Floating Platform in the Frequency Domain. Energies 2018, 11, 406. [Google Scholar] [CrossRef] [Green Version]
- Ravinthrakumar, S.; Kristiansen, T.; Molin, B.; Ommani, B. Coupled vessel and moonpool responses in regular and ir-regular waves. Appl. Ocean Res. 2020, 96, 102010. [Google Scholar] [CrossRef]
- Xu, X.; Zhang, X.; Chu, B.; Huang, H. On natural frequencies of three-dimensional moonpool of vessels in the fixed and free-floating conditions. Ocean Eng. 2020, 195, 106656. [Google Scholar] [CrossRef]
- Ravinthrakumar, S.; Kristiansen, T.; Molin, B.; Ommani, B. A two-dimensional numerical and experimental study of pis-ton and sloshing resonance in moonpools with recess. J. Fluid Mech. 2019, 877, 142–166. [Google Scholar] [CrossRef]
- Heo, J.-K.; Park, J.-C.; Koo, W.-C.; Kim, M.-H. Influences of Vorticity to Vertical Motion of Two-Dimensional Moonpool under Forced Heave Motion. Math. Probl. Eng. 2014, 2014, 1–13. [Google Scholar] [CrossRef]
- Fitzgerald, J.; Bergdahl, L. Including moorings in the assessment of a generic offshore wave energy converter: A frequency domain approach. Mar. Struct. 2008, 21, 23–46. [Google Scholar] [CrossRef]
- Harris, R.; Johanning, L.; Wolfram, J. Mooring systems for wave energy converters: A review of design issues and choices. Proc. Inst. Mech. Eng. Part B J. Eng. Manuf. 2006, 220, 159–168. Available online: https://www.researchgate.net/publication/283549804_Mooring_systems_for_wave_energy_converters_A_review_of_design_issues_and_choices (accessed on 25 March 2020).
- ANSYS. AQWA Reference Manual, 14.5 ed.; SAS IP: Canonsburg, PA, USA, 2012; pp. 54–55. [Google Scholar]
- Khanam, S.; Abdussamie, N.; Ojeda, R. Numerical prediction of wave excitation forces on a fixed tension leg platform concept for offshore wind turbines. In Proceedings of the Australasian Coasts and Ports 2019 Conference, Hobart, Australia, 10–13 September 2019. [Google Scholar]
- Journee, J.; Massie, W. Offshore Hydromechanics, 1st ed.; Delft University of Technology: Delft, The Netherlands, 2001; pp. 222–224. Available online: https://ocw.tudelft.nl/wp-content/uploads/OffshoreHydromechanics_Journee_Massie.pdf (accessed on 17 June 2020).
- Chakrabarti, S. Offshore Structure Modelling; World Scientific Publishing Co.: London, UK, 1994; pp. 447–449. [Google Scholar]
- International Towing Tank Conference. Single Significant Amplitude and Confidence Intervals for Stochastic Processes. 2020. Available online: https://www.ittc.info/media/7999/75-02-01-08.pdf (accessed on 4 October 2020).
- Emami, A.; Gharabaghi, A. Pitch Motion Response of an Equipped Semi-Submersible Platform with Tuned Sloshing Dampers. Int. J. Offsh. Polar Eng. 2020, 3, 47–54. Available online: http://ijcoe.org/article-1-133-en.pdf (accessed on 25 October 2020).
- Gao, S.; Tao, L.-B.; Kou, Y.-F.; Lu, C.; Sun, J.-L. Numerical and Experimental Study on Hydrodynamic Performance of A Novel Semi-Submersible Concept. China Ocean Eng. 2018, 32, 144–156. [Google Scholar] [CrossRef]
- Huijs, F.; De Bruijn, R.; Savenije, F. Concept Design Verification of a Semi-submersible Floating Wind Turbine Using Coupled Simulations. Energy Procedia 2014, 53, 2–12. [Google Scholar] [CrossRef] [Green Version]
- Singh, U.; Abdussamie, N.; Hore, J. Hydrodynamic performance of a floating offshore OWC wave energy converter: An experimental study. Renew. Sustain. Energy Rev. 2020, 117, 109501. [Google Scholar] [CrossRef]
- Murfet, T.; Abdussamie, N. Loads and Response of a Tension Leg Platform Wind Turbine with Non-Rotating Blades: An Experimental Study. J. Mar. Sci. Eng. 2019, 7, 56. [Google Scholar] [CrossRef] [Green Version]
- American Petroleum Institute. Design and Analysis of Station-Keeping Systems for Floating Structures (API-RP-2SK), 3rd ed.; American Petroleum Institute: Washington, DC, USA, 2005. [Google Scholar]
- Ramnas Bruk. Ramnas Bruk Product Catalogue [Brochure]. 2012. Available online: https://ramnas.com/wp-content/uploads/2012/11/Ramnas-Technical-Broschure.pdf (accessed on 16 September 2020).
- Thomsen, J.B.; Ferri, F.; Kofoed, J.P.; Black, K. Cost Optimization of Mooring Solutions for Large Floating Wave Energy Converters. Energies 2018, 11, 159. [Google Scholar] [CrossRef] [Green Version]
- Faltinsen, O. Sea Loads on Ships and Offshore Structures; Cambridge University Press: Cambridge, UK, 1990; pp. 257–281. [Google Scholar]
- DNVGL Position Mooring (DNVGL-OS-E301). 2018. Available online: http://rules.dnvgl.com/docs/pdf/dnvgl/os/2018-07/dnvgl-os-e301.pdf (accessed on 16 September 2020).
Figure 1.
Australian Maritime College’s Model Test Basin (AMC MTB) experimental setup (left), with the main dimensions of the floating oscillating water column (FOWC) model shown on the right side.
Figure 1.
Australian Maritime College’s Model Test Basin (AMC MTB) experimental setup (left), with the main dimensions of the floating oscillating water column (FOWC) model shown on the right side.

Figure 2.
(a) FOWC axis and degree of freedom definition, blue depicting the submerged volume. (b) panel mesh on the FOWC device.
Figure 2.
(a) FOWC axis and degree of freedom definition, blue depicting the submerged volume. (b) panel mesh on the FOWC device.

Figure 3.
Time series of experimental free decay tests: (a) heave-free decay test and (b) pitch-free decay test.
Figure 3.
Time series of experimental free decay tests: (a) heave-free decay test and (b) pitch-free decay test.

Figure 4.
Interrogation of experimental free decay tests: (a) heave component during heave-free decay test and (b) pitch component during pitch-free decay test.
Figure 4.
Interrogation of experimental free decay tests: (a) heave component during heave-free decay test and (b) pitch component during pitch-free decay test.

Figure 5.
(a) Heave response amplitude operator (RAO) and (b) pitch response amplitude operator (RAO).
Figure 5.
(a) Heave response amplitude operator (RAO) and (b) pitch response amplitude operator (RAO).

Figure 6.
(a) Heave displacement during heave decay test, (b) pitch rotation during heave decay test, (c) pitch rotation during pitch decay test, (d) heave displacement during pitch decay test, (e) heave spectral response, and (f) pitch spectral response.
Figure 6.
(a) Heave displacement during heave decay test, (b) pitch rotation during heave decay test, (c) pitch rotation during pitch decay test, (d) heave displacement during pitch decay test, (e) heave spectral response, and (f) pitch spectral response.

Figure 7.
(a) Time series of surge displacement of free decay tests and (b) the corresponding spectral density plot.
Figure 7.
(a) Time series of surge displacement of free decay tests and (b) the corresponding spectral density plot.

Figure 8.
Experimental and numerical results for regular waves (H = 1.404 m for all cases; T = 7.2–14.4 s).
Figure 8.
Experimental and numerical results for regular waves (H = 1.404 m for all cases; T = 7.2–14.4 s).

Figure 9.
Experimental and numerical results for an operational, irregular sea state (Hs = 1.584 m, Tp = 9.012 s): (a) wave spectral density, (b) heave spectral density, (c) pitch spectral density, and (d) surge spectral density.
Figure 9.
Experimental and numerical results for an operational, irregular sea state (Hs = 1.584 m, Tp = 9.012 s): (a) wave spectral density, (b) heave spectral density, (c) pitch spectral density, and (d) surge spectral density.

Figure 10.
Experimental and numerical results for an elevated, irregular sea state (Hs = 3.384 m, Tp = 14.598 s): (a) wave spectral density, (b) heave spectral density, (c) pitch spectral density, and (d) surge spectral density.
Figure 10.
Experimental and numerical results for an elevated, irregular sea state (Hs = 3.384 m, Tp = 14.598 s): (a) wave spectral density, (b) heave spectral density, (c) pitch spectral density, and (d) surge spectral density.

Figure 11.
(a) Plan view of the FOWC with mooring arrangement and incident wave directions, (b) three-dimensional representation of the mooring arrangement.
Figure 11.
(a) Plan view of the FOWC with mooring arrangement and incident wave directions, (b) three-dimensional representation of the mooring arrangement.

Figure 12.
Numerical results of maximum tensions in the mooring lines for Test Cases 1–5.

Figure 13.
Mean tensions (kN) in mooring lines for Cases 1–5 over a 3 h storm duration and under varied incident wave directions and sea states.
Figure 13.
Mean tensions (kN) in mooring lines for Cases 1–5 over a 3 h storm duration and under varied incident wave directions and sea states.

Figure 14.
Significant values of the moored FOWC device motions in (a) surge, (b) sway, (c) heave, (d) roll, (e) pitch, and (f) yaw for all test cases (data withheld for Case 5 at incident waves angles of 90°, 135°, and 180°).
Figure 14.
Significant values of the moored FOWC device motions in (a) surge, (b) sway, (c) heave, (d) roll, (e) pitch, and (f) yaw for all test cases (data withheld for Case 5 at incident waves angles of 90°, 135°, and 180°).

Figure 15.
Mooring line tensions pre- and post-failure of Line 4 at 1800 s for (a) Case 1, (b) Case 2, (c) Case 3, and (d) Case 4.
Figure 15.
Mooring line tensions pre- and post-failure of Line 4 at 1800 s for (a) Case 1, (b) Case 2, (c) Case 3, and (d) Case 4.

Figure 16.
Motions of the moored FOWC device in (a) surge, (b) roll, (c) sway, (d) pitch, (e) heave, and (f) yaw following the simulated failure of Line 4 at 1800 s.
Figure 16.
Motions of the moored FOWC device in (a) surge, (b) roll, (c) sway, (d) pitch, (e) heave, and (f) yaw following the simulated failure of Line 4 at 1800 s.


Table 1.
Main particulars of the experimental model and test setup.
| Description | Model Scale (1:36) | Designed Full Scale | Units | |
|---|---|---|---|---|
| FOWC structure | Mass displacement | 27.0695 | 1.263 × 10⁶ | Kg |
| LCG (from heave plate aft edge) | 0.420 | 15.12 | M | |
| VCG (from keel) | 0.246 | 8.856 | M | |
| Draft | 0.400 | 14.4 | M | |
| Mass Moments of Inertia (Ixx, Iyy, Izz) | 3.719, 3.683, 4.881 | 0.225 × 10⁹, 0.223 × 10⁹, 0.295 × 10⁹ | kg·m2 | |
| Soft moorings | Spring stiffness | 647.8 | 839632 | N/m |
| Pre-tension | 29.43 | 1.37 × 10⁶ | N | |
| AMC MTB | Water depth | 0.893 | 32.15 | m |
| Regular wave conditions | Wave height | 0.039 | 1.404 | m |
| Wave periods | 0.8–5 | 4.8–30 | s | |
| Irregular wave conditions | Significant wave heights | 0.044, 0.094 | 1.584, 3.384 | m |
| Peak periods | 1.502, 2.433 | 9.012, 14.598 | s | |
Table 2.
Input parameters for the external lid.
| Description | Value | Units |
|---|---|---|
| Lid damping factor | 0.0655 | - |
| Gap for external lid | 14.4 | m |
Table 3.
Heave and pitch natural period and damping particulars.
| Degree of Freedom | TN (s) | ζ (%) | External Viscous Force/Moment | |
|---|---|---|---|---|
| Experimental | Numerical | |||
| Heave | 23.742 | 22.71 | 2.99 | 164,240.03 N/m/s |
| Pitch | 23.477 | 22.71 | 3.19 | 7,911,707.55 N·m/rad/s |
Table 4.
Surge natural period, damping particulars, and mooring pre-tension.
| TN (s) | ζ (%) | External Viscous Force (N/m/s) | Mooring Pre-Tension (N) | |
|---|---|---|---|---|
| Experimental | Numerical | |||
| 124.29 | 124.7 | 9.0 | 60153.9 | 2.51 × 10⁶ |
Table 5.
Comparison between experimental and numerical results for heave, pitch, and surge response in regular waves for H = 1.404 m.
Table 5.
Comparison between experimental and numerical results for heave, pitch, and surge response in regular waves for H = 1.404 m.
| Condition | Heave (m) | Pitch (Degrees) | Surge (m) | |||
|---|---|---|---|---|---|---|
| Experimental | AQWA | Experimental | AQWA | Experimental | AQWA | |
| Run 1 (T = 7.2 s) | 0.214 | 0.213 | 0.601 | 0.623 | 0.204 | 0.328 |
| Run 2 (T = 8.4 s) | 0.278 | 0.256 | 0.500 | 0.428 | 0.257 | 0.408 |
| Run 3 (T = 10.2 s) | 0.283 | 0.308 | 0.482 | 0.128 | 0.296 | 0.494 |
| Run 4 (T = 14.4 s) | 0.704 | 1.073 | 2.930 | 4.333 | 0.708 | 0.539 |
Table 6.
Comparison between experimental and numerical results for irregular wave conditions.
| Condition | Hs (m) | Tp (s) | Heave (m) | Pitch (Degrees) | Surge (m) | |
|---|---|---|---|---|---|---|
| Operational | Experiment | 1.584 | 9.012 | 0.54 | 1.848 | 3.204 |
| AQWA | 1.602 | 8.814 | 0.73 | 3.139 | 3.197 | |
| Elevated | Experiment | 3.384 | 14.598 | 2.700 | 11.311 | 6.768 |
| AQWA | 3.349 | 14.79 | 3.056 | 11.953 | 3.29 |
Table 7.
FOWC catenary mooring characteristics.
| Description | Value | Units | Description | Value | Units |
|---|---|---|---|---|---|
| Chain grade | R3 studless | - | Added mass coefficient | 1 | - |
| Chain diameter | 76 | mm | Number of mooring lines | 4 | - |
| Mass/unit length in air | 126 | kg/m | Fairlead locations (x,y,z) | +/– 15.1, +/– 15.1, 0.0 | m |
| Submerged mass/unit length | 100.5 | kg/m | Anchor locations (x,y,z) | +/– 491, +/– 491, –100 | m |
| Minimum breaking load (MBL) | 4.8843 × 10⁶ | N | No. of cable elements | 100 | - |
| Stiffness (EA) | 6.3 × 10⁸ | N | Line length | 715 | m |
| Transverse drag coefficient | 2.4 | - | Safety factor (SF) | 2.0 | - |
| Longitudinal drag coefficient | 1.15 | - |
Table 8.
Sea-state conditions for the FOWC mooring study.
| Case No. | Description | Input Parameters | Spectral Analysis | Wave Directions (Degrees) | |||
|---|---|---|---|---|---|---|---|
| Hs (m) | Tp (s) | Hs (m) | Tp (s) | Hmax (m) | |||
| 1 | Operational | 1.25 | 8.00 | 1.25 | 8.19 | 2.38 | 0, 45, 90, 135, 180 |
| 2 | Moderate | 2.50 | 8.00 | 2.50 | 8.19 | 4.75 | |
| 3 | Rough | 4.00 | 12.00 | 4.00 | 12.47 | 7.55 | |
| 4 | Very rough | 6.00 | 12.00 | 6.01 | 12.47 | 11.2 | |
| 5 | Survivable | 9.00 | 12.00 | 9.02 | 12.47 | 16.74 | |
Table 9.
Maximum tension (kN) in the mooring lines over a 3 h storm duration and under varied incident wave directions and sea states.
Table 9.
Maximum tension (kN) in the mooring lines over a 3 h storm duration and under varied incident wave directions and sea states.
| Wave Direction (Degrees) | Case 1 | Case 2 | Case 3 | Case 4 | Case 5 |
|---|---|---|---|---|---|
| Max. Tension/Line No. | Max. Tension/Line No. | Max. Tension/Line No. | Max. Tension/Line No. | Max. Tension/Line No. | |
| 0 | 219.7/Line 2 | 320.1/Line 1 | 340.76/Line 2 | 621.6/Line 2 | 3411/Line 1 |
| 45 | 222.1/Line 3 | 301.4/Line 1 | 370.2/Line 1 | 517.7/Line 1 | 2933/Line 1 |
| 90 | 227.9/Line 1 | 367.9/Line 1 | 373.2/Line 1 | 2056/Line 1 | 10,450/Line 2 |
| 135 | 242.7/Line 4 | 518.5/Line 4 | 387.7/Line 4 | 1480/Line 1 | 20,511/Line 2 |
| 180 | 221.7/Line 1 | 329.7/Line 3 | 398.8/Line 1 | 750.5/Line 3 | 4995/Line 3 |
Publisher’s Note: MDPI stays neutral with regard to jurisdictional claims in published maps and institutional affiliations. |
© 2021 by the authors. Licensee MDPI, Basel, Switzerland. This article is an open access article distributed under the terms and conditions of the Creative Commons Attribution (CC BY) license (http://creativecommons.org/licenses/by/4.0/).
Share and Cite
MDPI and ACS Style
Pols, A.; Gubesch, E.; Abdussamie, N.; Penesis, I.; Chin, C. Mooring Analysis of a Floating OWC Wave Energy Converter. J. Mar. Sci. Eng. 2021, 9, 228. https://0-doi-org.brum.beds.ac.uk/10.3390/jmse9020228
AMA Style
Pols A, Gubesch E, Abdussamie N, Penesis I, Chin C. Mooring Analysis of a Floating OWC Wave Energy Converter. Journal of Marine Science and Engineering. 2021; 9(2):228. https://0-doi-org.brum.beds.ac.uk/10.3390/jmse9020228
Chicago/Turabian StylePols, Alana, Eric Gubesch, Nagi Abdussamie, Irene Penesis, and Christopher Chin. 2021. "Mooring Analysis of a Floating OWC Wave Energy Converter" Journal of Marine Science and Engineering 9, no. 2: 228. https://0-doi-org.brum.beds.ac.uk/10.3390/jmse9020228
Note that from the first issue of 2016, this journal uses article numbers instead of page numbers. See further details here.