Article

A Comprehensive Estuarine Hydrodynamics-Salinity Study: Impact of Morphologic Changes on Ria de Aveiro (Atlantic Coast of Portugal)

by
João Miguel Dias
1,*,
Francisco Pereira
2,
Ana Picado
1,
Carina Lurdes Lopes
1,
João Pedro Pinheiro
1,
Sérgio Miguel Lopes
3,4 and
Paulo Gabriel Pinho
4,5
1
Centre for Environmental and Marine Studies, Physics Department, University of Aveiro, 3810-193 Aveiro, Portugal
2
Physics Department, University of Aveiro, 3810-193 Aveiro, Portugal
3
ADAI/LAETA, Association for the Development of Industrial Aerodynamics, Rua Pedro Hispano, 12, PT-3030-289 Coimbra, Portugal
4
CITAB—Centre for the Research and Technology of Agro-Environmental and Biological Sciences, University of Trás-os-Montes e Alto Douro, 5000-801 Vila Real, Portugal
5
Center for Studies in Education, Technologies and Health (CI&DETS), Polytechnic Institute of Viseu, Campus Politécnico, 3504-510 Viseu, Portugal
*
Author to whom correspondence should be addressed.
J. Mar. Sci. Eng. 2021, 9(2), 234; https://0-doi-org.brum.beds.ac.uk/10.3390/jmse9020234
Submission received: 7 January 2021 / Revised: 13 February 2021 / Accepted: 15 February 2021 / Published: 22 February 2021
(This article belongs to the Special Issue Feature Reviews in Marine Science and Engineering)

Abstract

:
Shallow coastal lagoons driven by tidal processes are extremely dynamic environments prone to continuous natural and anthropogenic pressures. The hydrodynamics of these systems deeply depends on the effect of local morphology on the tidal propagation, so their permanent evolution constantly changes tidal dependent processes. For this reason, the present work aims to review the main characteristics of Ria de Aveiro hydrodynamics, a shallow lagoon located at the Atlantic Coast of Portugal, evaluating its evolution over the last 30 years (between 1987 and 2020) and investigating the main morphological changes in its origin. For this purpose, a comparative analysis is performed to determine the main process, including the observed hydrodynamic changes: Deepening of the inlet channel or of the main lagoon channels. To achieve these goals, the authors explored a remarkable database including bathymetric, tide gauge, and salinity data from 1987 until the present. This analysis is completed by the exploitation of a hydrodynamical model (Delft3D), validated against field data. Several simulations were performed to analyse changes in tidal propagation along the lagoon channels (considering the main semi-diurnal constituent M2), tidal asymmetry, tidal currents, tidal prism, and salinity patterns. The results show that the general deepening of the lagoon observed between 1987 and 2020 led to important changes in the lagoon hydrodynamics, namely the increase/decrease of the M2 constituent amplitude/phase, as well as the increase of tidal currents and salt intrusion within the entire lagoon, with the changes being amplified towards the head of the main channels. Although the inlet deepening partially contributed to the modifications found, the results revealed that the deepening of the main lagoon channels had the most significant contribution to the changes observed during the last 30 years.

1. Introduction

Coastal lagoons are shallow inland water bodies, separated from the ocean by a sand barrier, that connect, at least intermittently, to the ocean by one or more restricted inlets [1]. The main driving forces of circulation, which determine the distribution of water properties within a coastal lagoon, are the tidal propagation, through one or more restricted inlets, and the river flow at the head of the estuary [2]. In addition, many other forcing agents such as precipitation, evaporation balance, wind stress, and surface heat balance can influence the circulation and the distribution of physical properties of water. [1]. However, these exchanges can be modified by natural or man-induced geomorphological changes [3].
By these reasons, changes in estuarine dynamics due to geomorphological modifications have been studied by several authors through numerical modelling. The authors of [4,5] used an exploratory semi-analytical model/3D numerical model (Delft3D), respectively, to study the effect of Ems Estuary (Germany) channel deepening on suspended particulate matter (SPM)/suspended sediment concentration (SSC). The results showed that the deepening of the main channels increased the salinity-driven estuarine circulation and consequently changed SPM and SSC dynamics, increasing transport up-estuary. A previous study [6] using tide gauge data and simulations performed with a shallow-water hydrodynamic finite element model (SHYFEM), verified that Venice lagoon’s (Italy) general deepening resulted in an increase of tidal amplitude and a shift from flood to ebb-dominance, and the construction of mobile barriers in the inlets resulted in reduced exchanges between the ocean and the lagoon. Similar results were found in response to the inlet deepening for Óbidos lagoon (Portugal), using the ELCIRC shallow water model [7]. Another study [8] applied a numerical model to the Hudson River Estuary (USA) and surrounding regions to study the impact of channel dredging, with the results showing a tidal amplitude increase and an amplification of coastal storm effects landward. Furthermore, the authors of [9] applied a hydrodynamical model based on the hydrostatic model MARS3D to study the effect of the Seine Estuary’s (France) gradual deepening and narrowing, and found that those changes led to a tidal amplification, a decrease in tidal duration asymmetry, and a migration of the salinity front up-estuary.
As described in the works previously referred, tidal propagation in estuaries depends strongly on their geomorphologic configuration [10]. At the same time, changes in tidal propagation influence the sediment balance in coastal lagoons, and therefore modify their potential to export sediment and consequently their morphology [11]. Anthropogenic activities, such as artificialization and regulation of inlets, the construction of port areas and terminals, the dredging operations, and the construction of tanks for aquaculture are some common examples of geomorphological changes occurring in several coastal lagoons around the world and that may lead to changes in their dynamics [12]. One of the strong examples given by [12] was Ria de Aveiro (Figure 1), where numerous engineering activities and regular dredging highly changed its tidal characteristics in recent years. Therefore, this work aims to assess the evolution of the Ria de Aveiro hydrodynamics over the last 30 years (between 1987 and 2020), determining whether it is induced by the inlet or the main lagoon channels deepening, taking advantage of an extensive database and numerical modelling simulations.
The first works about the characterization of Ria de Aveiro hydrodynamics were published 20 years ago [13,14,15] and were based on the analysis of in-situ data and modelling results, based on field data mostly collected in 1987/1988. These revealed that the dynamics of this coastal system is ruled by tidal propagation, where M2 is the main harmonic constituent. Moreover, these works show that the tide is strongly deformed along its propagation throughout the lagoon main channels (amplitude attenuation and phase delay), and, for the first-time, present maps of the local hydrodynamics properties. Since then, large modifications have occurred in the lagoon morphology, and therefore in local hydrodynamics, justifying the elaboration of several works reporting the influence of geomorphological changes in Ria de Aveiro tidal dynamics. For example, [16] found an average increase of 0.245 m in M2 amplitude and an average decrease of 17.4° in its phase between 1987 and 2004, and explained such changes with the deepening of the inlet channel, which is in agreement with [10]. Another study [11] observed that an increase of flooded area due to the salt pans walls collapse would lead to an increase of the tidal prism and an enhancement of ebb dominance of the central lagoon. A further study [3] verified that the general deepening of the lagoon between 1987/1988 and 2012 led to an increase in the lagoon flooded area and tidal prism, and [17] described an increase/decrease of tidal currents/tidal asymmetry.
Although some changes in the Ria de Aveiro tidal propagation are documented, their causes are not fully understood nor quantified. It is known that the lagoon deepening triggered hydrodynamic changes, however, it is unknown what the contribution was of two different processes of great interest for the local community and authorities: The deepening of the inlet channel (motivated by regular dredging to facilitate access to Aveiro Port) compared with the deepening of the main channels (motivated by the dredging carried out in the late 1990s to facilitate local navigation). Moreover, a study evaluating the tidal propagation changes along with the saline intrusion is of utmost importance in coastal systems. In this context, this work aims to review and investigate the Ria de Aveiro tidal propagation, and consequent changes in tidal asymmetry, tidal currents, and saline intrusion observed in the context of the morphological evolution of the lagoon that occurred in the last 30 years (from 1987 until 2020). An extensive database will be explored to assess changes in the bathymetry, sea surface elevation, and salinity throughout the lagoon, complemented by hydrodynamic modelling, to fully characterize the local properties as well as to understand the main causes of those changes. So, this paper focuses on the analysis of the data recorded between 1987 and 2020, to quantify morphologic modifications as well as changes in the most important tidal harmonic constituent (M2), tidal asymmetry, and salinity patterns. Moreover, the hydrodynamic model Delft3D (FLOW module), previously calibrated, was validated and applied to this system, and four different implementations were made. The first two implementations consider the 1987 and 2020 bathymetric configurations and the last two consider only the deepening of the inlet or of the main channels, aiming to further characterize Ria de Aveiro hydrodynamics and investigate which process induces the observed changes.

2. Study Area

The Ria de Aveiro is a mesotidal shallow water coastal lagoon located on the North-western Portuguese coast (Figure 1). This lagoon is approximately 45 km long and 8.5 km wide [13]. It is characterized by its large mudflats and salt marshes, narrow channels, and for being connected to the sea by an artificially fixed inlet. This is the only connection between the lagoon and the sea, and the deepest area of the lagoon, so changes in its configuration have a strong impact on the exchanges with the sea, as well as in lagoon tidal properties [16]. The lagoon also comprises four main channels (S.Jacinto, Espinheiro, Ílhavo, and Mira), and receives freshwater mainly from five rivers (Vouga, Antuã, Cáster, Boco, and Ribeira dos Moínhos) located at the head of each channel (Figure 1) as well as from residual surficial runoff.
Human action is the major factor controlling the lagoon morphology during the last decades [12,16]. Due to the instability of the inlet since the formation of the lagoon (dating from the 10th century), in 1802, works began to open an artificial inlet in the place where it is presently, having been completed in 1808, through the construction of a channel in the sandbank and a breakwater with the eastwest direction, on the south bank of the channel. These works resulted in profound changes in the lagoon hydrodynamics, which changed from fluvial to tidal dominance. Since then, interventions have been carried out frequently in this area, with the construction of another breakwater with east–west direction on the north bank of the channel, and posterior modifications and extensions of the breakwaters accompanied by works to regularize, consolidate, and protect the inlet banks. These interventions have also been complemented by several dredging operations of the lagoon mouth and adjacent areas, especially in the last decades, to assure the traffic of larger draft vessels to Aveiro Port. As a result, changes were identified in the dynamics of the tide in the lagoon, which made it more vulnerable to flood risks and to the effects of ocean forcing, namely sea level fluctuations [18].
The dredging operation carried out within the scope of the silting project of the Ria de Aveiro that concluded in 1998 should also be highlighted for its impact on the morphology of the lagoon. These aimed to improve the hydrodynamic conditions of the S.Jacinto and Mira channels, to optimize their use for small recreational boats and artisanal fishing. This dredging action was considered a necessary resource to preserve the Ria de Aveiro and its exploitation, considering the verified silting processes.
The lagoon hydrodynamics is predominantly controlled by a semidiurnal tide, with a mean amplitude of 2 m in the inlet, which increases to 3.2 m in spring tide and decreases to 0.6 m in neap tide [15]. The tide propagates from the mouth and its effect is felt throughout the entire system. The tide in the lagoon presents the characteristics of a damped progressive wave: The amplitude decreases from the mouth to the channels heads as the phase increases [15]. The mean freshwater in Ria de Aveiro during a tide cycle is 1.8 × 10⁶ m3 [19], which is considerably lower than the total tidal prism volume for neap and spring tide conditions, which is estimated to be 65.8 × 10⁶ m3 and 139.7 × 10⁶ m3 [3], respectively. Accordingly, the Ria de Aveiro is considered vertically homogeneous for most of the year, except occasionally during periods of intense rainfall that induce an increase in rivers discharge, which may lead to restricted vertical stratification in the upper part of the channels where the rivers flow [15,19,20].

3. Data and Methods

In this section, the dataset available to perform this study is described, the methods used to characterize Ria de Aveiro hydrodynamics and assess observed changes that occurred between 1987 and 2020 in local morphology, tidal, and salinity properties, the Deft3D model implementation and validation procedures, as well as the scenarios defined to model and understand the processes that drive tidal and salinity changes.

3.1. Data

This work analyses an extensive topo-bathymetric dataset recorded over a long period of time in Ria de Aveiro, used to identify the main morphologic changes that occurred between 1987 and 2020, and to elaborate the numerical configurations that serve as basis for the model exploitation:
  • 1987/88 by the Hydrographic Institute of the Portuguese Navy (HIPN) for the overall lagoon;
  • 2011 by the Polis Litoral da Ria de Aveiro (PLRA) for the lagoon main channels;
  • 2011 by the Directorate-General for Territory (DGT) for the intertidal areas;
  • 2020 by the University of Aveiro (UA) for the inlet channel [21];
  • 2020 by the Aveiro Port Administration (APA) at a restricted area of the Mira channel.
This work uses water level data recorded at 19 tide gauge stations between 1987 and 2020 in four different surveys performed during this period (Table 1). The most extensive 1987/88 and 2002/03 surveys were performed by HIPV and UA, respectively. The most recent data (2012/2017 and 2019/20) is part of two monitoring programs carried out by APA and PLRA, respectively. The records of 1987/88 and 2002/03 refer to hourly sea levels over 30 to 90 days, except for Barra station that presents a continuous annual record. The 2012/17 data have a 20-min periodicity, while 2019/2020 data were recorded every 5 min. Additionally, APA delivered the water level records for Barra station (lagoon mouth) during the entire period under analysis.
This work further analysed salinity records in seven stations (Table 2). The 1997 data results from campaigns carried out by UA, while the 2012/17 data are part of the monitoring program performed by APA. The 1997 data were recorded every 2 min in June during a tidal cycle (approximately 12.5 h), except for Barra station that presents records between 3 and 22 of June. The most recent salinity data were recorded at the middle of the water column every 20 min between April 2012 and March 2017, except for Costa Nova and Barra that present records between February 2013 and August 2014 and between January 2013 and December 2013, respectively. It should be noted that previous works analysed in situ salinity profiles throughout the lagoon and verified that the salinity values do not vary across the water column in most conditions [13,19,22,23]. Therefore, the salinity measured in the middle of the water column can be considered as representative of the average salinity along the vertical. Both tide gauge and salinity data were organized for analysis purposes in five domains, corresponding to the lagoon entrance and four main lagoon channels (S.Jacinto, Mira, Ílhavo, and Espinheiro).

3.2. Assessing Observed Morphologic, Tidal and Salinity Changes Between 1987 and 2020

The modifications in the lagoon morphology were assessed computing the differences between the 2020 and 1987 bathymetries and analysed with focus on the evolution of the inlet channel and of the lagoon main channels.
The water level and salinity data previously described were used to quantify tidal and salinity changes within the lagoon between 1987 and 2020. In detail, tidal harmonics were determined from water level time series by using the T_TIDE package [24] and alterations in the amplitude and phase of the most important semidiurnal (M2) constituent were assessed and analysed.
In addition, the tidal asymmetry was analysed for both periods by assessing the amplitude ratio ( A r ) and relative phase ( ϕ ) following [25]:
A r = A M 4 A M 2 ,
ϕ = 2 θ M 2 θ M 4 ,
where A M 2 , A M 4 , θ M 2 , and θ M 4 are the amplitudes and phases of M2 and M4 constituents. A r is a measure of the tidal distortion (as larger is A r the more distorted is the tide) whereas ϕ measures the tidal dominance ( 0 ° < ϕ < 180 ° indicates flood dominance and 180 ° < ϕ < 360 ° indicates ebb dominance).
Salinity data were analysed only for four stations (Barra, Vagueira, Varela, and Vista Alegre) since these are the only stations presenting data available in both periods under study (June of 1997 and 2012/2017). Mean and maximum salinity values were determined for the 1997 campaign, while for the most recent data (2012/2017) the mean and maximum values in June of each year were determined. The average values for the period 2012/2017 were also determined and compared with those obtained for 1997.

3.3. Model Implementation

In this section, the multidimensional hydrodynamic model Delft3D was implemented and explored to reproduce the tidal dynamics and the salinity intrusion in Ria de Aveiro. The Delft3D-FLOW module, used in this work, solves the non-steady shallow water equations in two or three dimensions and calculates unsteady flow phenomena that result from tidal and meteorological forcing on a curvilinear, boundary fitted grid [26]. The FLOW module can perform hydrodynamic simulations and calculate salt and heat transport. In this work, the Delft3D-FLOW module was set up with a curvilinear orthogonal grid that was improved based on a previous grid developed by [27]. The final grid build in the frame of this study was refined in central regions of the lagoon to better represent the tidal flat and marginal areas, and therefore the flooding of the low-lying areas, and has 193 × 458 cells, resulting in a solution computed in 18,330 elements. Because of the shallowness of the lagoon and the low daily freshwater input when compared with the total tidal prism, the vertical gradients in the lagoon can be neglected when compared to the longitudinal gradients [19]. Therefore, a single vertical layer was considered in the scope of this work.
In this study, two different sets of topo-bathymetric data were used to construct numerical bathymetries for 1987 and 2020. Firstly, the data from the general survey performed by HIPV in 1987/88 were used and interpolated to the numerical grid. Secondly, the 1987 bathymetry was updated with the latest data, to obtain the numerical bathymetry that best represents 2020, collected in 2011 by PLRA in the main channels of the lagoon, and in 2020 by APA and UA [21] in the lagoon inlet and port area.
The open ocean boundary of the model was forced with the mean sea-levels and harmonic constants (amplitude and phase of 19 tidal constituents) concordant to each simulation date, resulting from the harmonic analysis performed to water level observations in Barra tide gauge, and with a temporal resolution of 6 min. A correction factor was considered taking into account the distance between the boundary and the tide gauge and following the best procedures adopted by [2,27]. The salinity and water temperature data imposed at this boundary were obtained from the Atlantic Iberian Biscay Irish Ocean product from the Marine Copernicus database [28]. In the open air-sea boundary of the model, wind and heat flux data obtained from the European Center for Medium-range Weather Forecast ERA Interim database [29] were imposed. For the five main lagoon tributaries (Figure 1), inflow, water temperature, and salinity climatologies derived from the watershed model Soil and Water Integrated Model (SWIM) [30] were imposed as open landward boundary conditions, except for the Vouga River, where observed flow data provided by PLRA were imposed. The bottom roughness is estimated with a dynamic coefficient of friction, following the procedure implemented by [31], which is determined at each model time step. Finally, to guarantee the stability of the model simulations, a time step of 0.5 min was considered.

3.4. Model Validation

To assess whether the bathymetric configurations developed for 1987 (past) and 2020 (present) constitute a good representation of the local depth for the respective periods and, therefore, lead to accurate numerical modelling results for each case, several simulations were performed with both bathymetries, and results compared with available data. The water level validation was performed for both past and present periods, while salinity validation was only performed for the most recent period due to the lack of data for 1987/88. Regarding the validation of water level, for the past bathymetry, data collected at 19 stations between 1987 and 1988 were used, whereas for the present bathymetry the data were collected at 13 stations for the years 2013, 2016, and 2019. The 2013 and 2016 data were considered since no major dredging operations have been carried out along the main channels since 2013 and, therefore, the current morphology of the lagoon must be very similar to that of 2013 and 2016. For salinity validation, data were available at seven stations for the period 2013 and 2014.
A set of simulations with a duration of 35 days (with 5 days being spin-up) was performed for the water level validation for both periods, considering the concurrent tidal constituents to force the past and the present configurations. For the salinity validation, the simulations have a duration of 120 days with 90 days of spin-up. The model accuracy was quantified computing the root mean square error (RMSE) and the predictive Skill [32] for both water level and salinity, for all stations and periods referred, through:
R M S E = 1 N i = 1 N M i O i 2 ,
S k i l l = 1 i = 1 N M i O i 2 i = 1 N M i O ¯ + O i O ¯ 2   ,
where N is the number of observations available for analysis, Oi are the observations, Mi are the model results for a variable, and O ¯ the average value of observations. Additionally, the RMSE was compared with the local mean tidal range and local salinity range (LR) through NRMSE (normalized root mean square error):
N R M S E = R M S E L R .

3.5. Modelling and Assessing Tidal and Salinity Changes Between 1987 and 2020

After the model validation, four simulations were performed to characterize Ria de Aveiro hydrodynamics and quantify the tidal and salinity changes induced by the morphological modifications (Table 3), considering the effects of deepening the inlet or the main channels, to investigate which induces the observed changes. The first two simulations correspond to the bathymetric configurations of 1987 and 2020 (Table 3) and will allow to characterize Ria de Aveiro hydrodynamics and identify the tidal and salinity changes that occurred from 1987 to 2020. To understand whether these modifications were due to the lagoon inlet or main channels deepening, two additional simulations were performed: The first one considers the 1987 bathymetry for most of the lagoon updated with the 2020 inlet (Scenario 1), and the second one considers the 2020 bathymetry for most of the lagoon with the 1987 inlet (Scenario 2) (Table 3). In summary, Scenario 1 considers the deepening of the inlet, while Scenario 2 considers the main channels deepening. All simulations have a duration of one year with additional 90 days of spin-up.
The model setup was equal for both simulations, only differing in the bathymetry used. For each configuration described in Table 3, the tidal constituents were computed using the T_TIDE program [24] and the amplitude and phase of the M2 were mapped. Additionally, the tidal asymmetry was evaluated through the Ar and φ, and the tidal currents through the annual average of the root mean square velocity (VRMS), given by
V R M S = 1 N i = 0 N V 2 1 / 2 ,
where V = u 2 + v 2 is the velocity modulus.
The tidal prism (defined here as the volume of water flowing through a cross-section during the flood of the tide) was computed for all model configurations for minimum neap tide and maximum spring tide at cross-sections located at the inlet and at the mouth of the four main channels (Figure 1). Besides assessing changes in the tidal prism for the different bathymetric configurations, changes in water distribution through the main channels of the lagoon were analysed. Finally, the mean annual salinity was also computed and analysed for all configurations.

4. Results

4.1. Morphologic Changes Between 1987 and 2020

The modifications in the lagoon morphology are assessed through the analysis of the difference between the 2020 and 1987 bathymetries, represented in Figure 2. This figure shows that the depth increased in most of the lagoon channels, with the highest differences observed in the entrance (about 10 m), but also with important changes along the main channels of the lagoon (around 5 to 8 m). The deepening of the inlet channel can be explained by the extension of the northern breakwater in 1987 along with the dredging operations carried out at this region [3], in order to facilitate the vessels traffic to Aveiro Port. Moreover, the tidal asymmetry of the lagoon, determined for the first time by [13], shows an ebb dominance pattern at the lower lagoon and a flood dominance at the upper lagoon, with expected trends of erosion and accretion, respectively, which also contribute to the natural inlet deepening. However, it should be emphasised that the deepening of the inlet region resulted mostly from dredging activities, as proved by previous works dedicated to study the inlet morphodynamics [33,34]. These authors demonstrated that the natural erosion induced by tidal currents and waves does not explain the bathymetric changes observed, suggesting therefore that dredging operations are the main cause of the inlet deepening. In addition, the deterioration and collapse of the lagoon salt pans along the last decades increased the flooded area, therefore increasing the tidal prism and ebb currents, and reinforcing the tendency of the system to export sediments to the sea, increasing the erosion especially in the inlet [11]. The deepening of the main lagoon channels can be mainly explained by dredging operations concluded in 1998 and planned to improve local navigability conditions [35]. The areas where depth decreased (around 1 m) are mainly located at the head of the main lagoon channels and resulted mainly from the general accretion trend found for these areas [13].

4.2. Assessing Observed Tidal and Salinity Changes Between 1987 and 2017

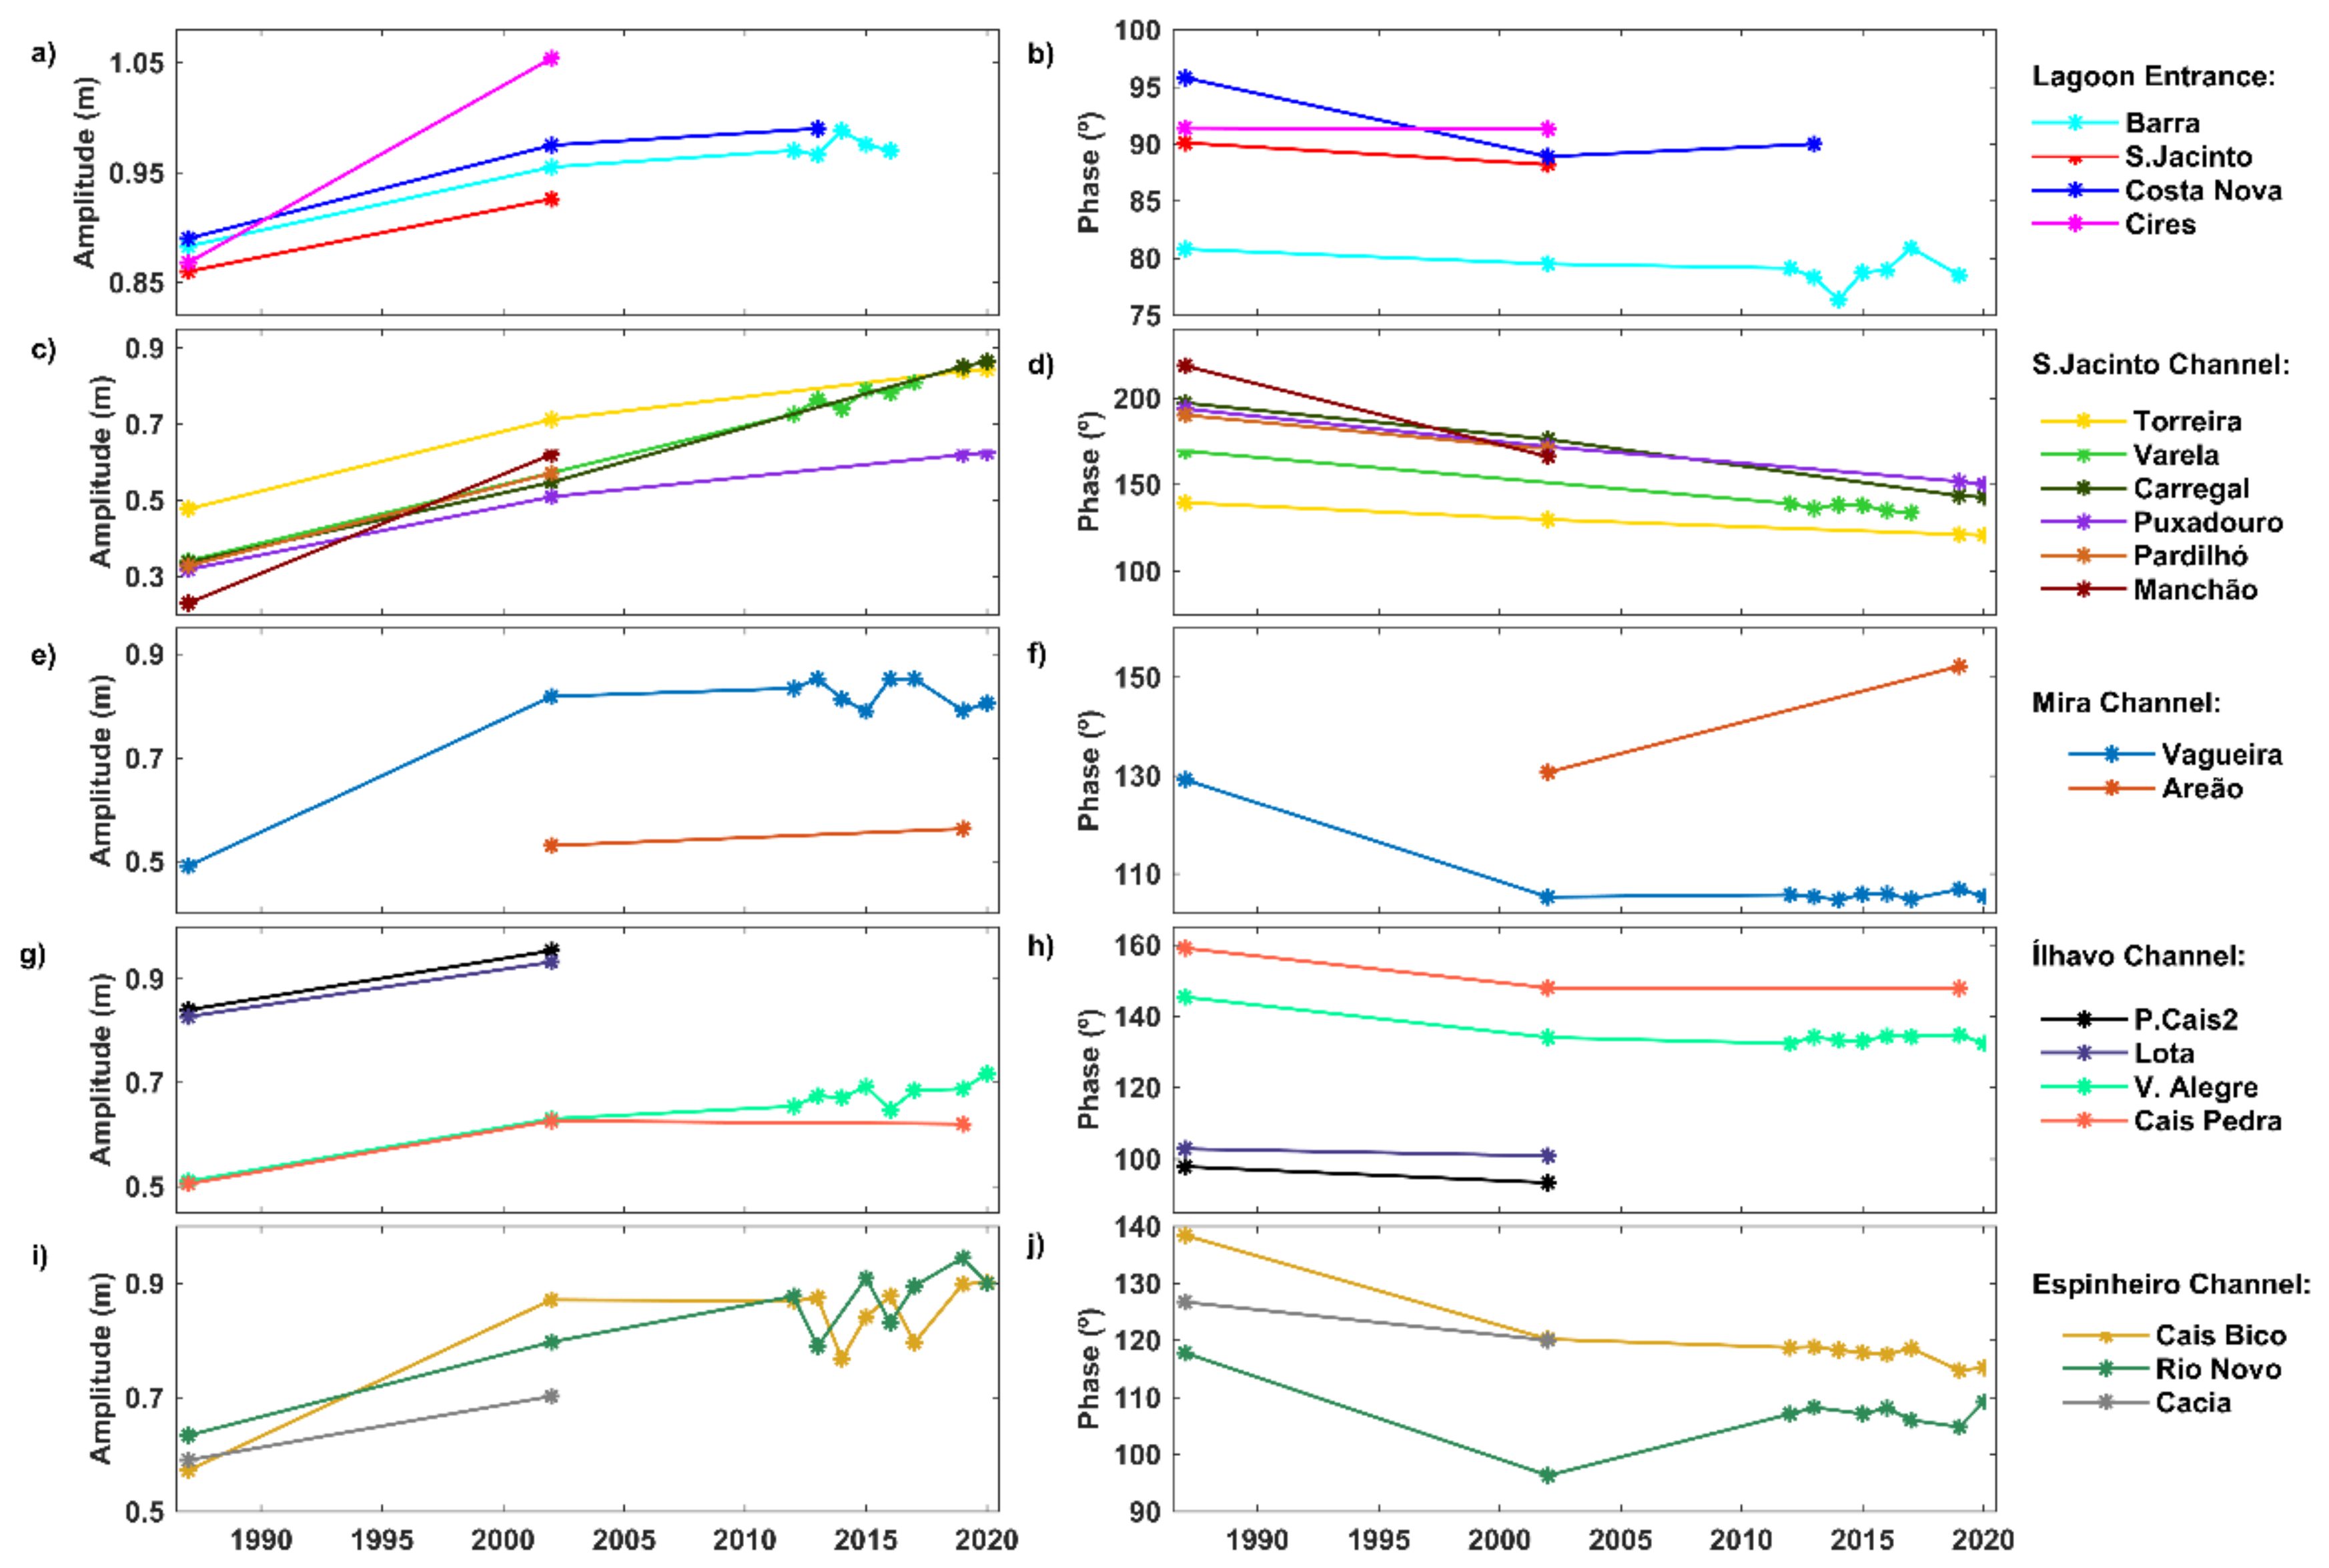
Figure 3 shows the evolution of amplitude and phase of M2 constituent in monitoring sites between 1987 and 2020. To facilitate the understanding of the changes in the tidal propagation along each of the main channels of the lagoon, the analysis of the results obtained will be individualized for each domain previously defined. Regarding the Lagoon Entrance (Barra, Costa Nova, and S.Jacinto), the amplitude of the M2 constituent increased by 9 cm in the period under analysis (Figure 3a). It should be noted that the highest amplification (8 cm) occurred between 1987 and 2002. The phase changed slightly in the same stations (Figure 3b). The major modification between these stations was found in Costa Nova, where a decrease of 5° (10 min) was detected between 1987 and 2002. Results for the stations located in the S.Jacinto Channel (Figure 3c,d) reveal that the M2 amplitude increased by 30 cm, 35 cm, 46 cm, and 53 cm in Puxadouro, Torreira, Varela, and Carregal, respectively. Moreover, the phase decreased by 20° (~40 min), 30° (~60 min), 40° (~80 min), and 55° (~100 min) in Torreira, Varela, Puxadouro, and Carregal, respectively. In Mira Channel, the M2 amplitude (Figure 3e) increased by 30 cm in Vagueira and 50 cm in Areão. Furthermore, the M2 phase (Figure 3f) decreased 25° (50 min) in Vagueira and remained unchanged in Areão. Again, it is noteworthy that changes in M2 constituent occurred between 1987 and 2002. In the Ílhavo Channel (Figure 3g,h), the M2 amplitude increased 11 cm in all stations between 1987 and 2002 and after 2002 it slightly increased (~2 cm) in Vista Alegre and remained unchanged in Cais da Pedra. In addition, the phase decreased by 11° (22 min) between 1987 and 2002 in the two stations located further upstream (Vista Alegre and Cais da Pedra). In the Espinheiro Channel, Figure 3 shows that the amplitude of the M2 increased by 20 cm and 25 cm in Cais do Bico and Rio Novo, respectively. These stations further experienced a reduction in the M2 phase (Figure 3j). In detail, reductions of 12° (~25 min) and 25° (~50 min) were found for Rio Novo and Cais do Bico, respectively.
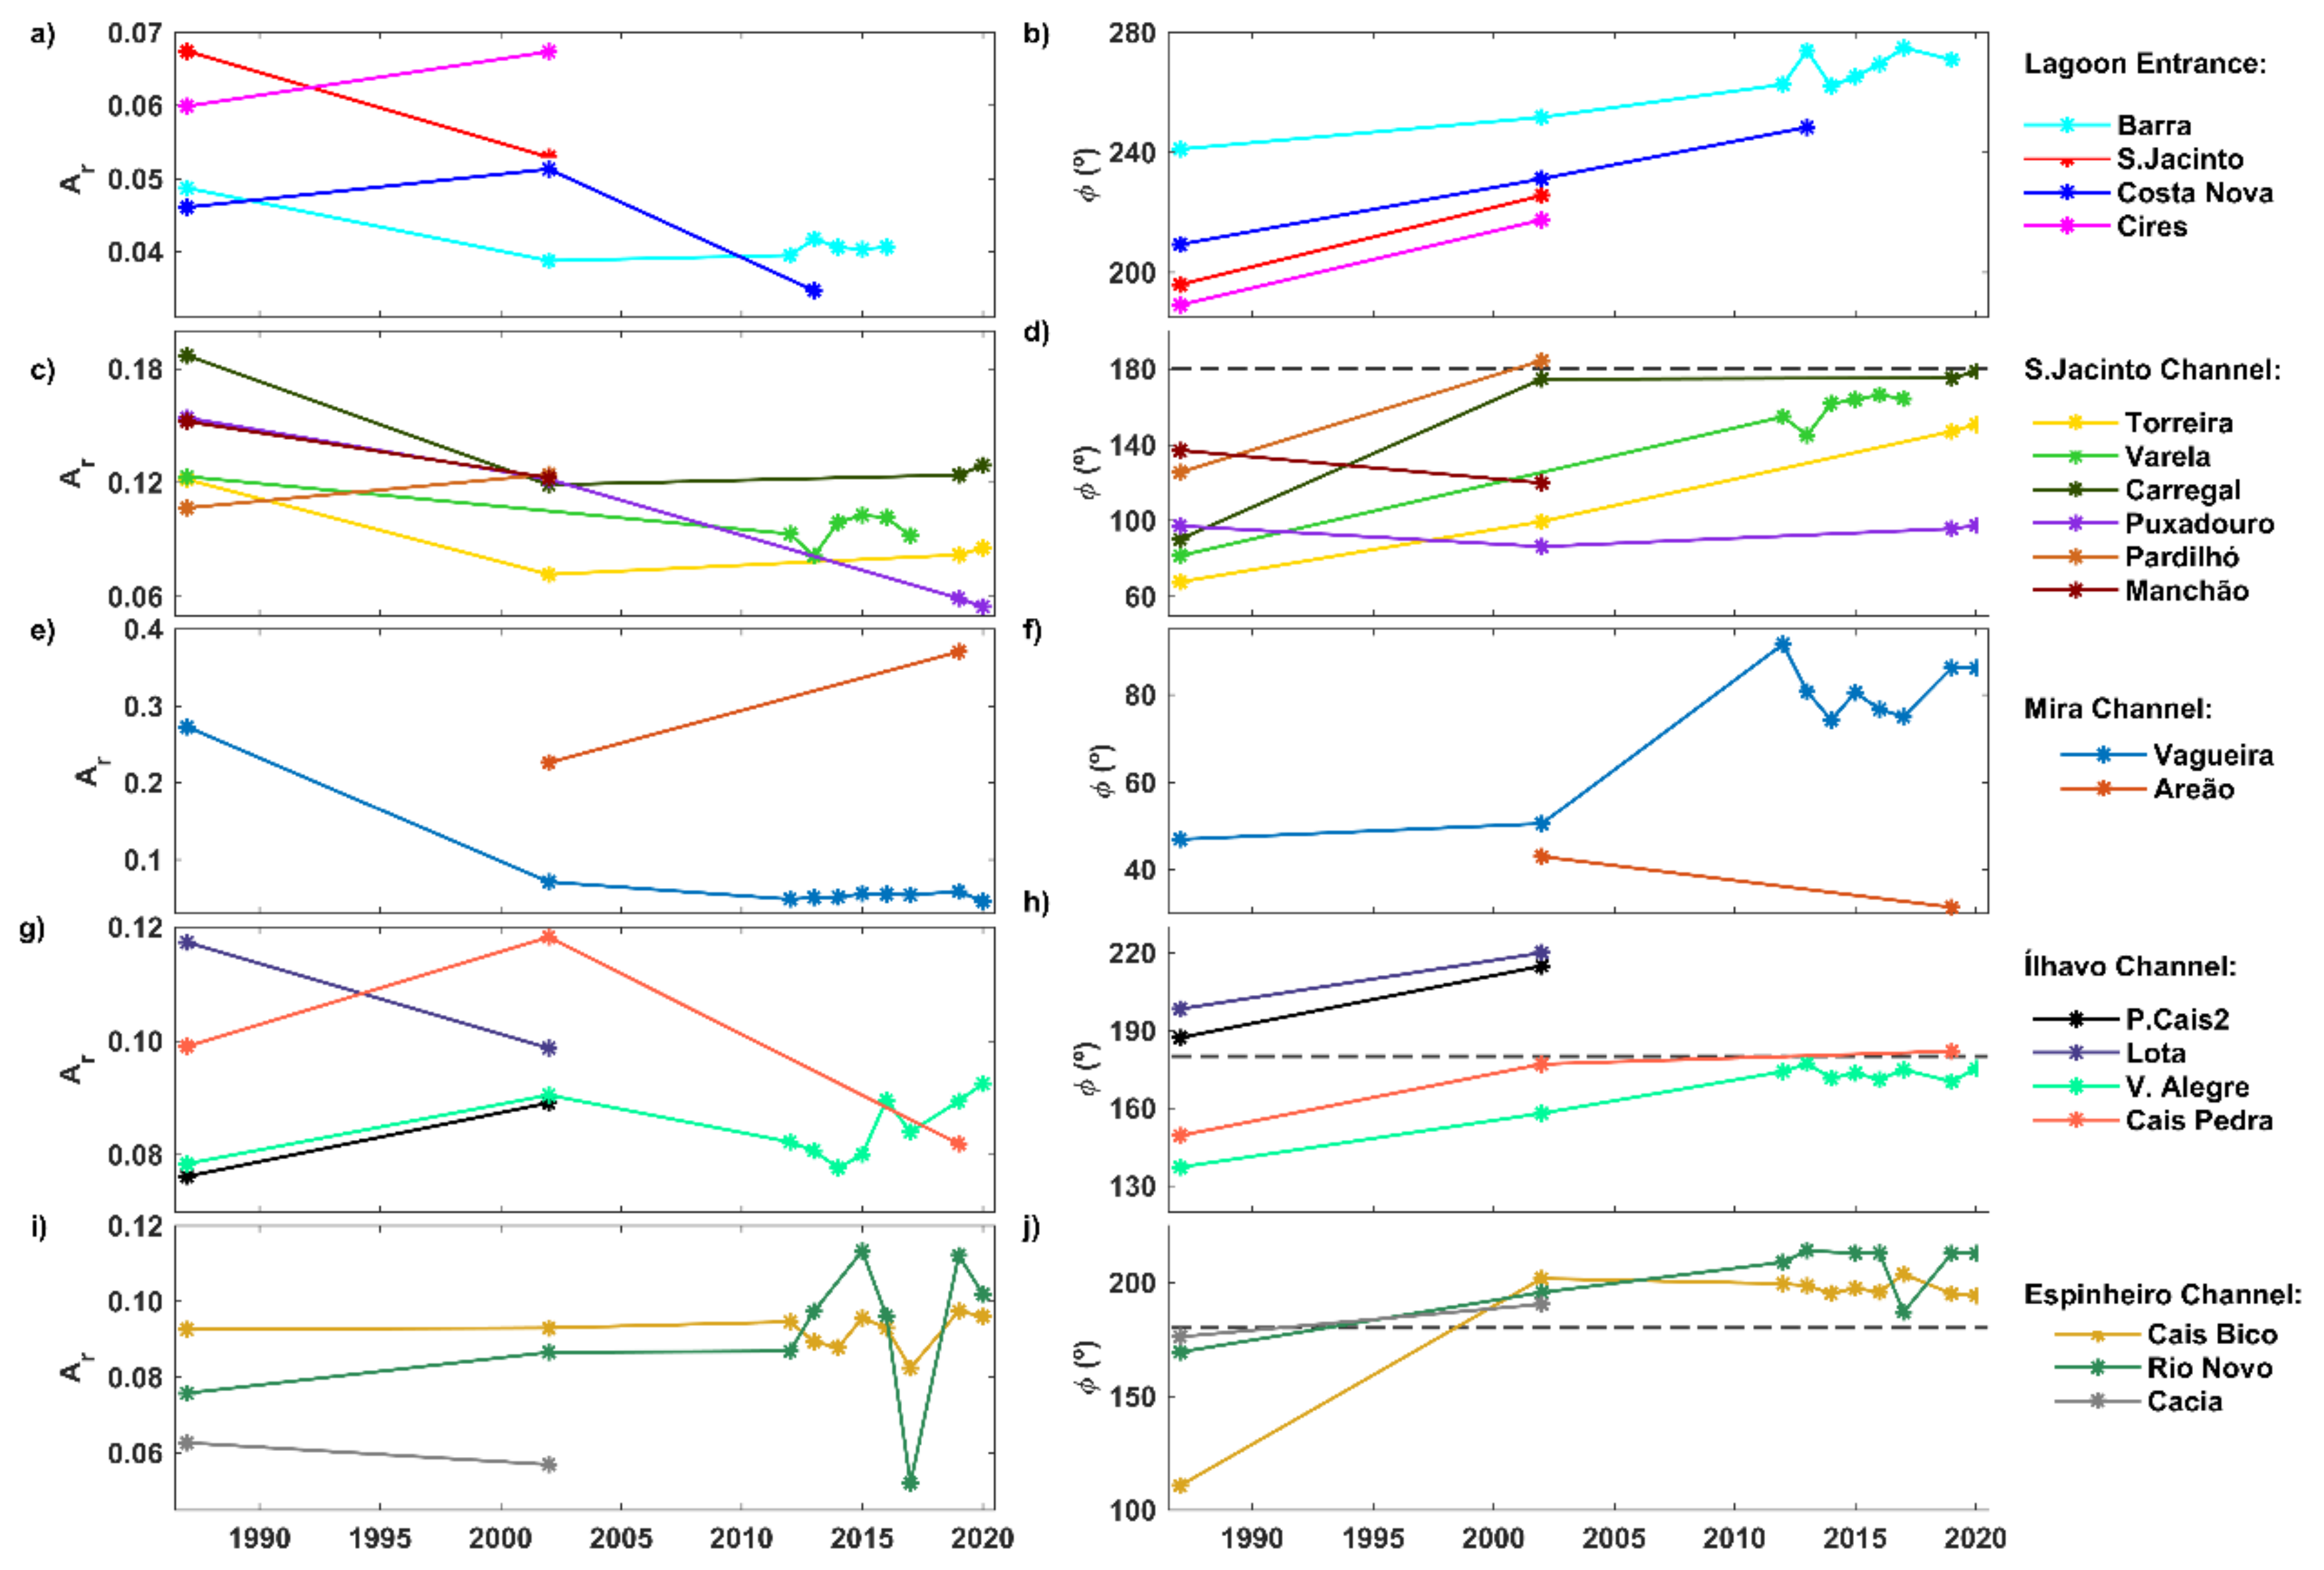
Figure 4 depicts the tidal asymmetry evolution, namely amplitude ratio and relative phase, throughout the lagoon channels between 1987 and 2020. The results evidence that the stations located in the entrance channel and at the beginning of the main channels present values of amplitude ratio (0.03–0.08) lower than those observed in the upstream stations (0.1–0.4), indicating that the tide is more distorted in the channels extremities than in the lagoon central area. Regarding the relative phase, it is verified that the upstream stations are flood dominated (35–180°), while the ones located in the central regions are ebb dominated (180–280°). In the stations located at the lagoon entrance, slight changes in the amplitude ratio and an increase in the relative phase of 40° were observed, denoting an intensification of the ebb dominance. In the S.Jacinto channel, the amplitude ratio decreased between 0.04 in Torreira and Varela and 0.06 in Manchão, Pardilhó, Carregal, and Puxadouro within the period analysed. This region is flood dominated, however as the relative phase increased since 1987, the flood dominance decreased. Regarding the Mira channel, it is notorious for intensification/weakening of the tidal distortion and flood dominance at the end/middle of the channel (Areão/Vagueira). The Ílhavo and Espinheiro channels experienced slight changes (lower than 0.02) in tidal distortion, but important changes in the relative phase. It is noteworthy that the Cais do Bico, Rio Novo, and Cacia stations changed from flood to ebb dominance between 1987 and 2002.
Table 4 presents the mean and maximum salinity values for the campaigns carried out in 1997 and the average of mean and maximum salinity values in June for the period 2012/2017. Results reveal that the mean values increased in all stations between 1997 and 2012/2017. The Vista Alegre and Varela stations experienced the highest increases (12.00 and 4.60, respectively) while Barra and Vagueira the lowest ones (1.33 and 1.10, respectively). The maximum salinity values also increased in all stations (6.82, 5.67 and 3.70 for Vista Alegre, Varela, and Vagueira, respectively), except in Barra where a slight decrease (0.43) was observed.

4.3. Model Validation

Model results and observed water level and salinity were compared in this section for past and present conditions, to quantify the model accuracy in both periods and therefore validate the numerical model configurations developed. Model performance was assessed considering the RMSE and Skill values (Table 5 and Table 6).
Generally, the best fit between model results and observed water level time series was obtained for the stations located close to the lagoon’s mouth, namely in Barra station, with RMSE below 10 cm and Skill values higher than 0.99, for both past and present bathymetries. Results also show that the model performance decreases with the distance from the inlet, with the weakest fit observed for the stations located at the channel’s heads (Cais da Pedra, Areão, and Carregal stations), with RMSE values between 16–26 cm. The model accuracy was found to be higher for the present configuration, with RMSE ranging between 5 and 25% of the local tidal amplitude for 1987 and between 2 and 17% for 2020.
Regarding salinity, the errors obtained are generally higher than those obtained for the water level time series, as usual when modelling salt transport. The best fit was again observed at Barra and Varela stations, with RMSE representing less than 10% of the local mean salinity, and the highest deviations were observed at Vagueira and Rio Novo stations, with values exceeding 40% of the local salinity range.

4.4. Assessing the Effect of the Lagoon Morphology on Tidal and Salinity Patterns

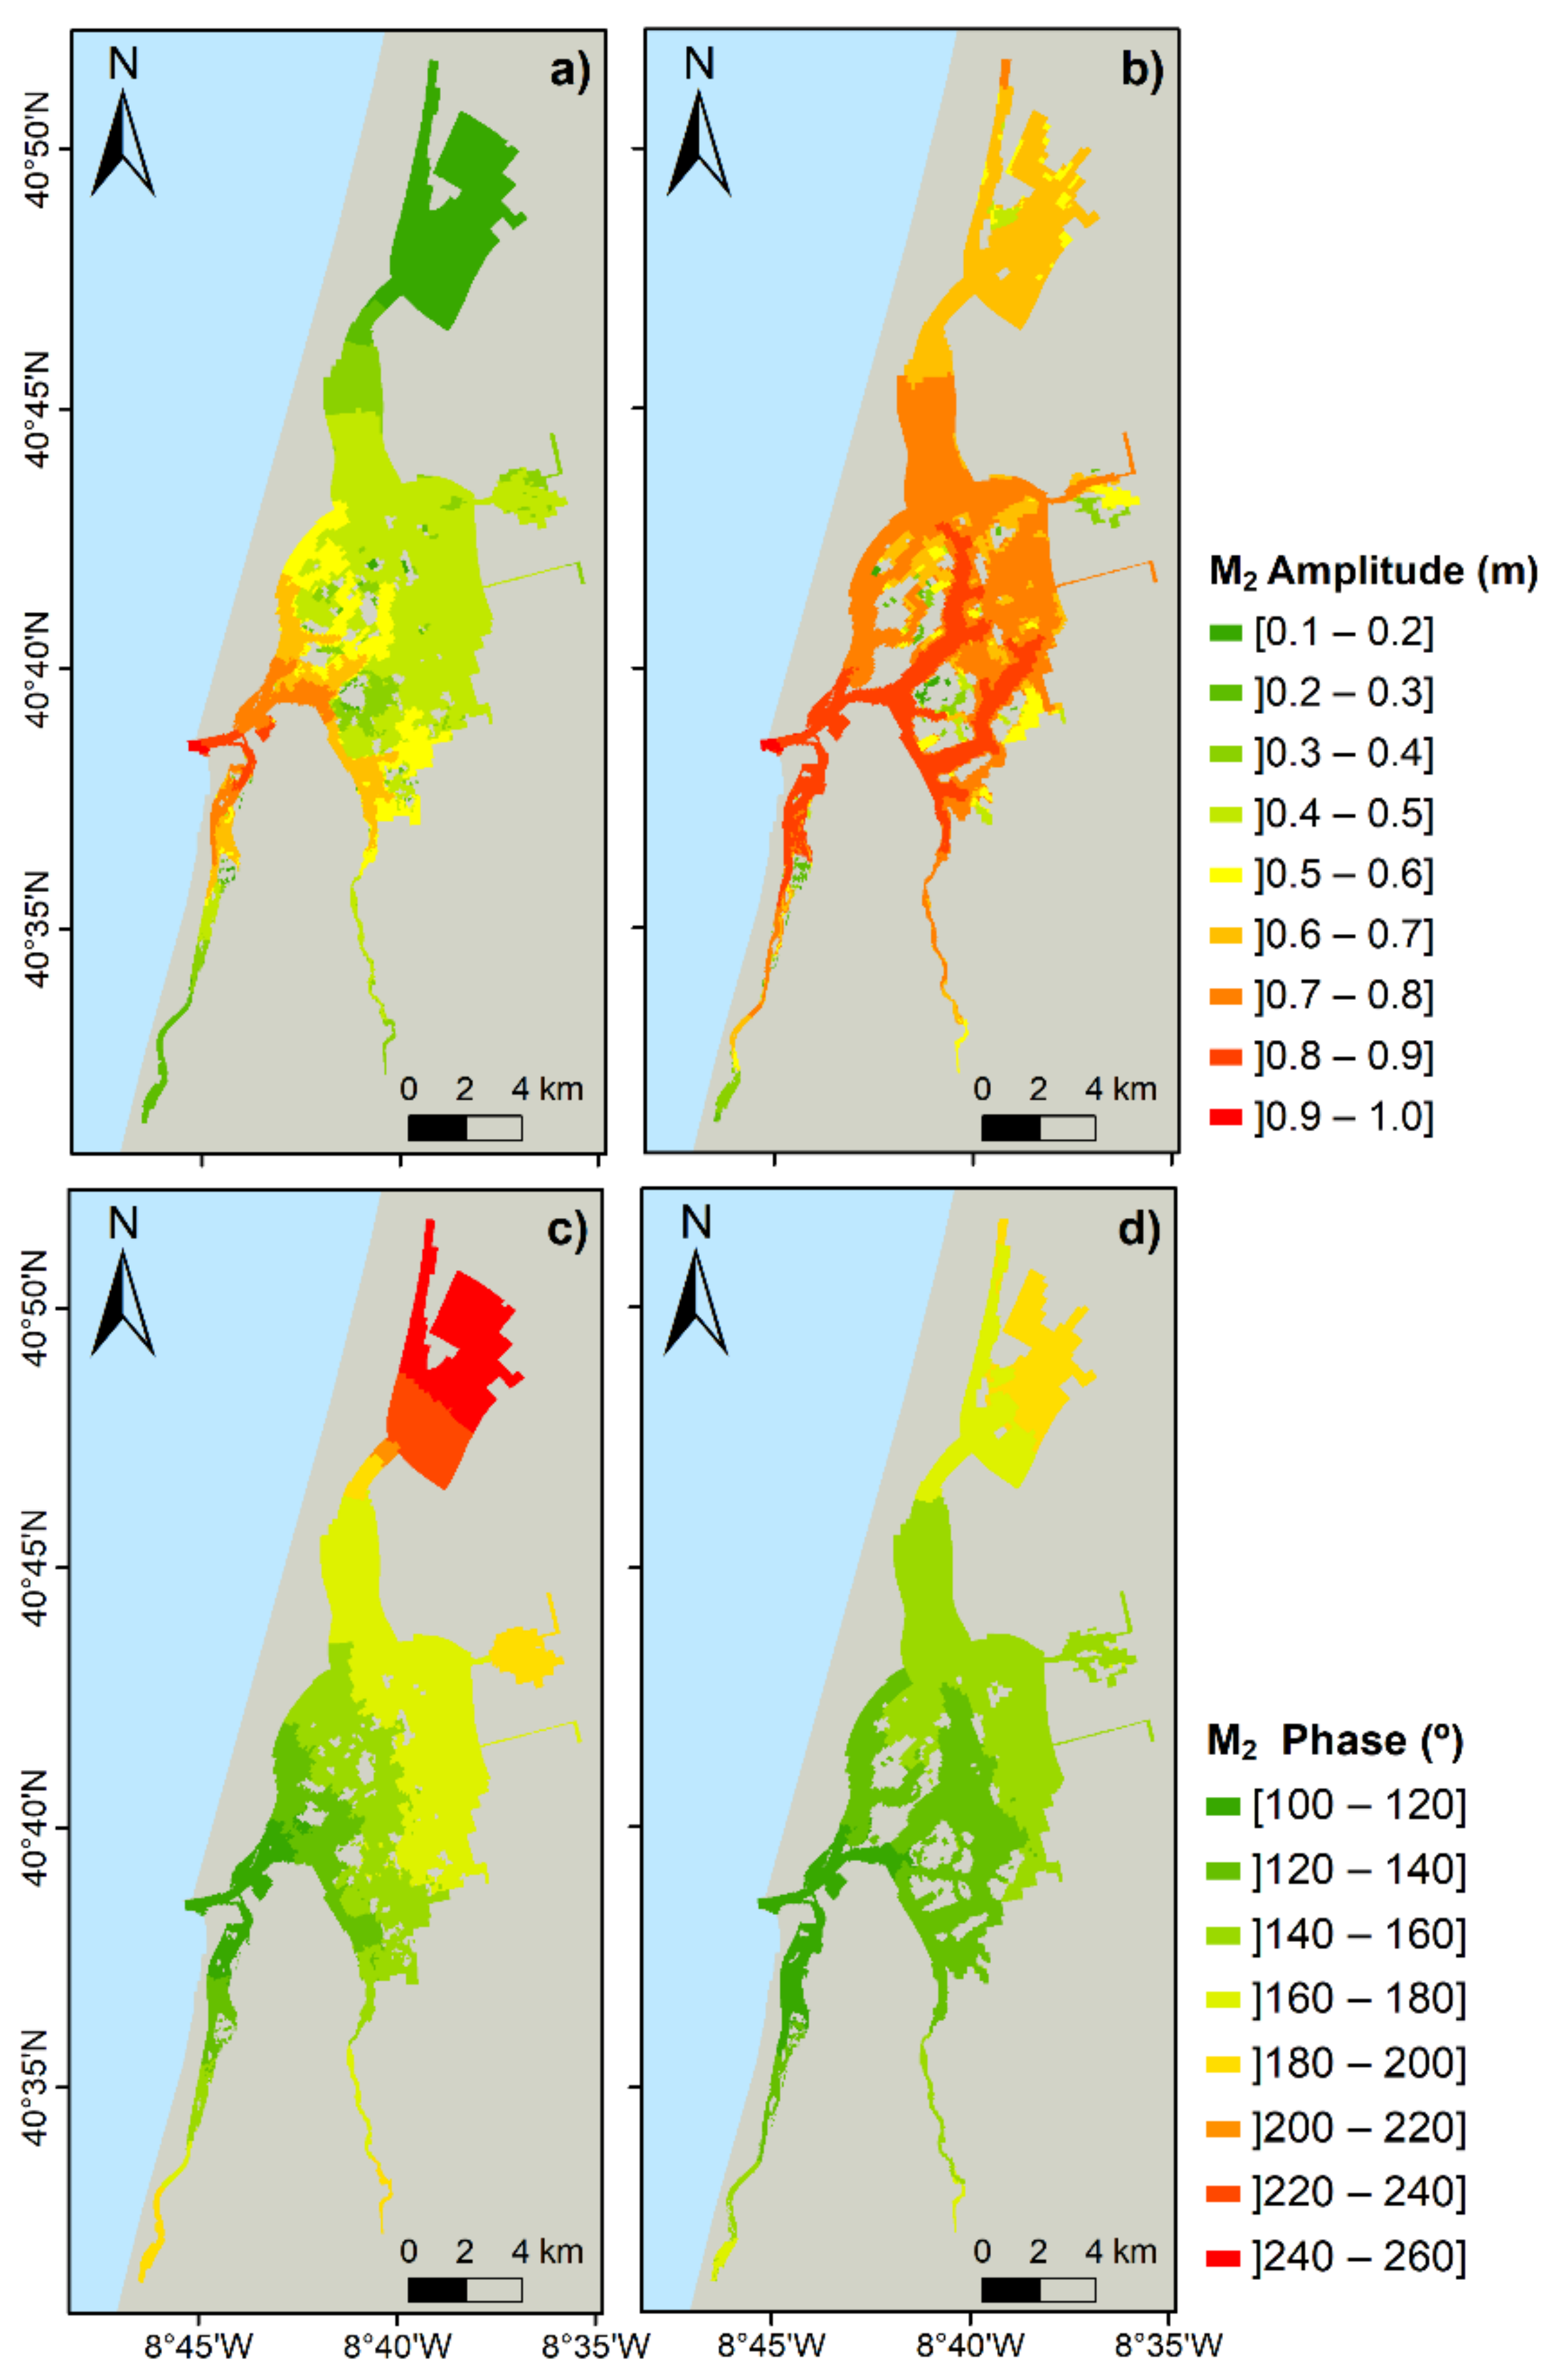
Figure 5 shows the amplitude and phase of the main tidal constituent M2 for 1987 and 2020 configurations. For both simulations, a decrease is observed in M2 amplitude from the inlet to the channel’s heads along with an increase in the phase. For example, for the 1987 bathymetry, a difference of nearly 0.75 m is observed between the lagoon’s mouth (~0.90 m) and the heads of S.Jacinto channel (~0.15 m). For Espinheiro, Ílhavo and Mira channels head the attenuation of the tidal amplitude is less pronounced, approximately 0.45, 0.50, and 0.65 m, respectively. Regarding the 2020 bathymetry, the damping of the tidal amplitude is nearly 0.30, 0.15, 0.50, and 0.60 m between the lagoon’s mouth and S.Jacinto, Espinheiro, Ílhavo, and Mira channels heads, respectively.
Concerning the phase of the M2 constituent, it ranges from 95° at the lagoon mouth for both bathymetries to 240° (170°) at the end of S.Jacinto (Espinheiro) channel for the 1987 bathymetry and to 180° (140°) for 2020 bathymetry. For the Mira and Ílhavo channels head, the phase is approximately 95° and 65° for past and present bathymetries, respectively. The M2 constituent patterns are consistent with previous results [13,14], demonstrating that the tidal wave in Ria de Aveiro has the characteristics of a damped progressive wave: During the propagation the amplitude decreases, and the phase lag increases.
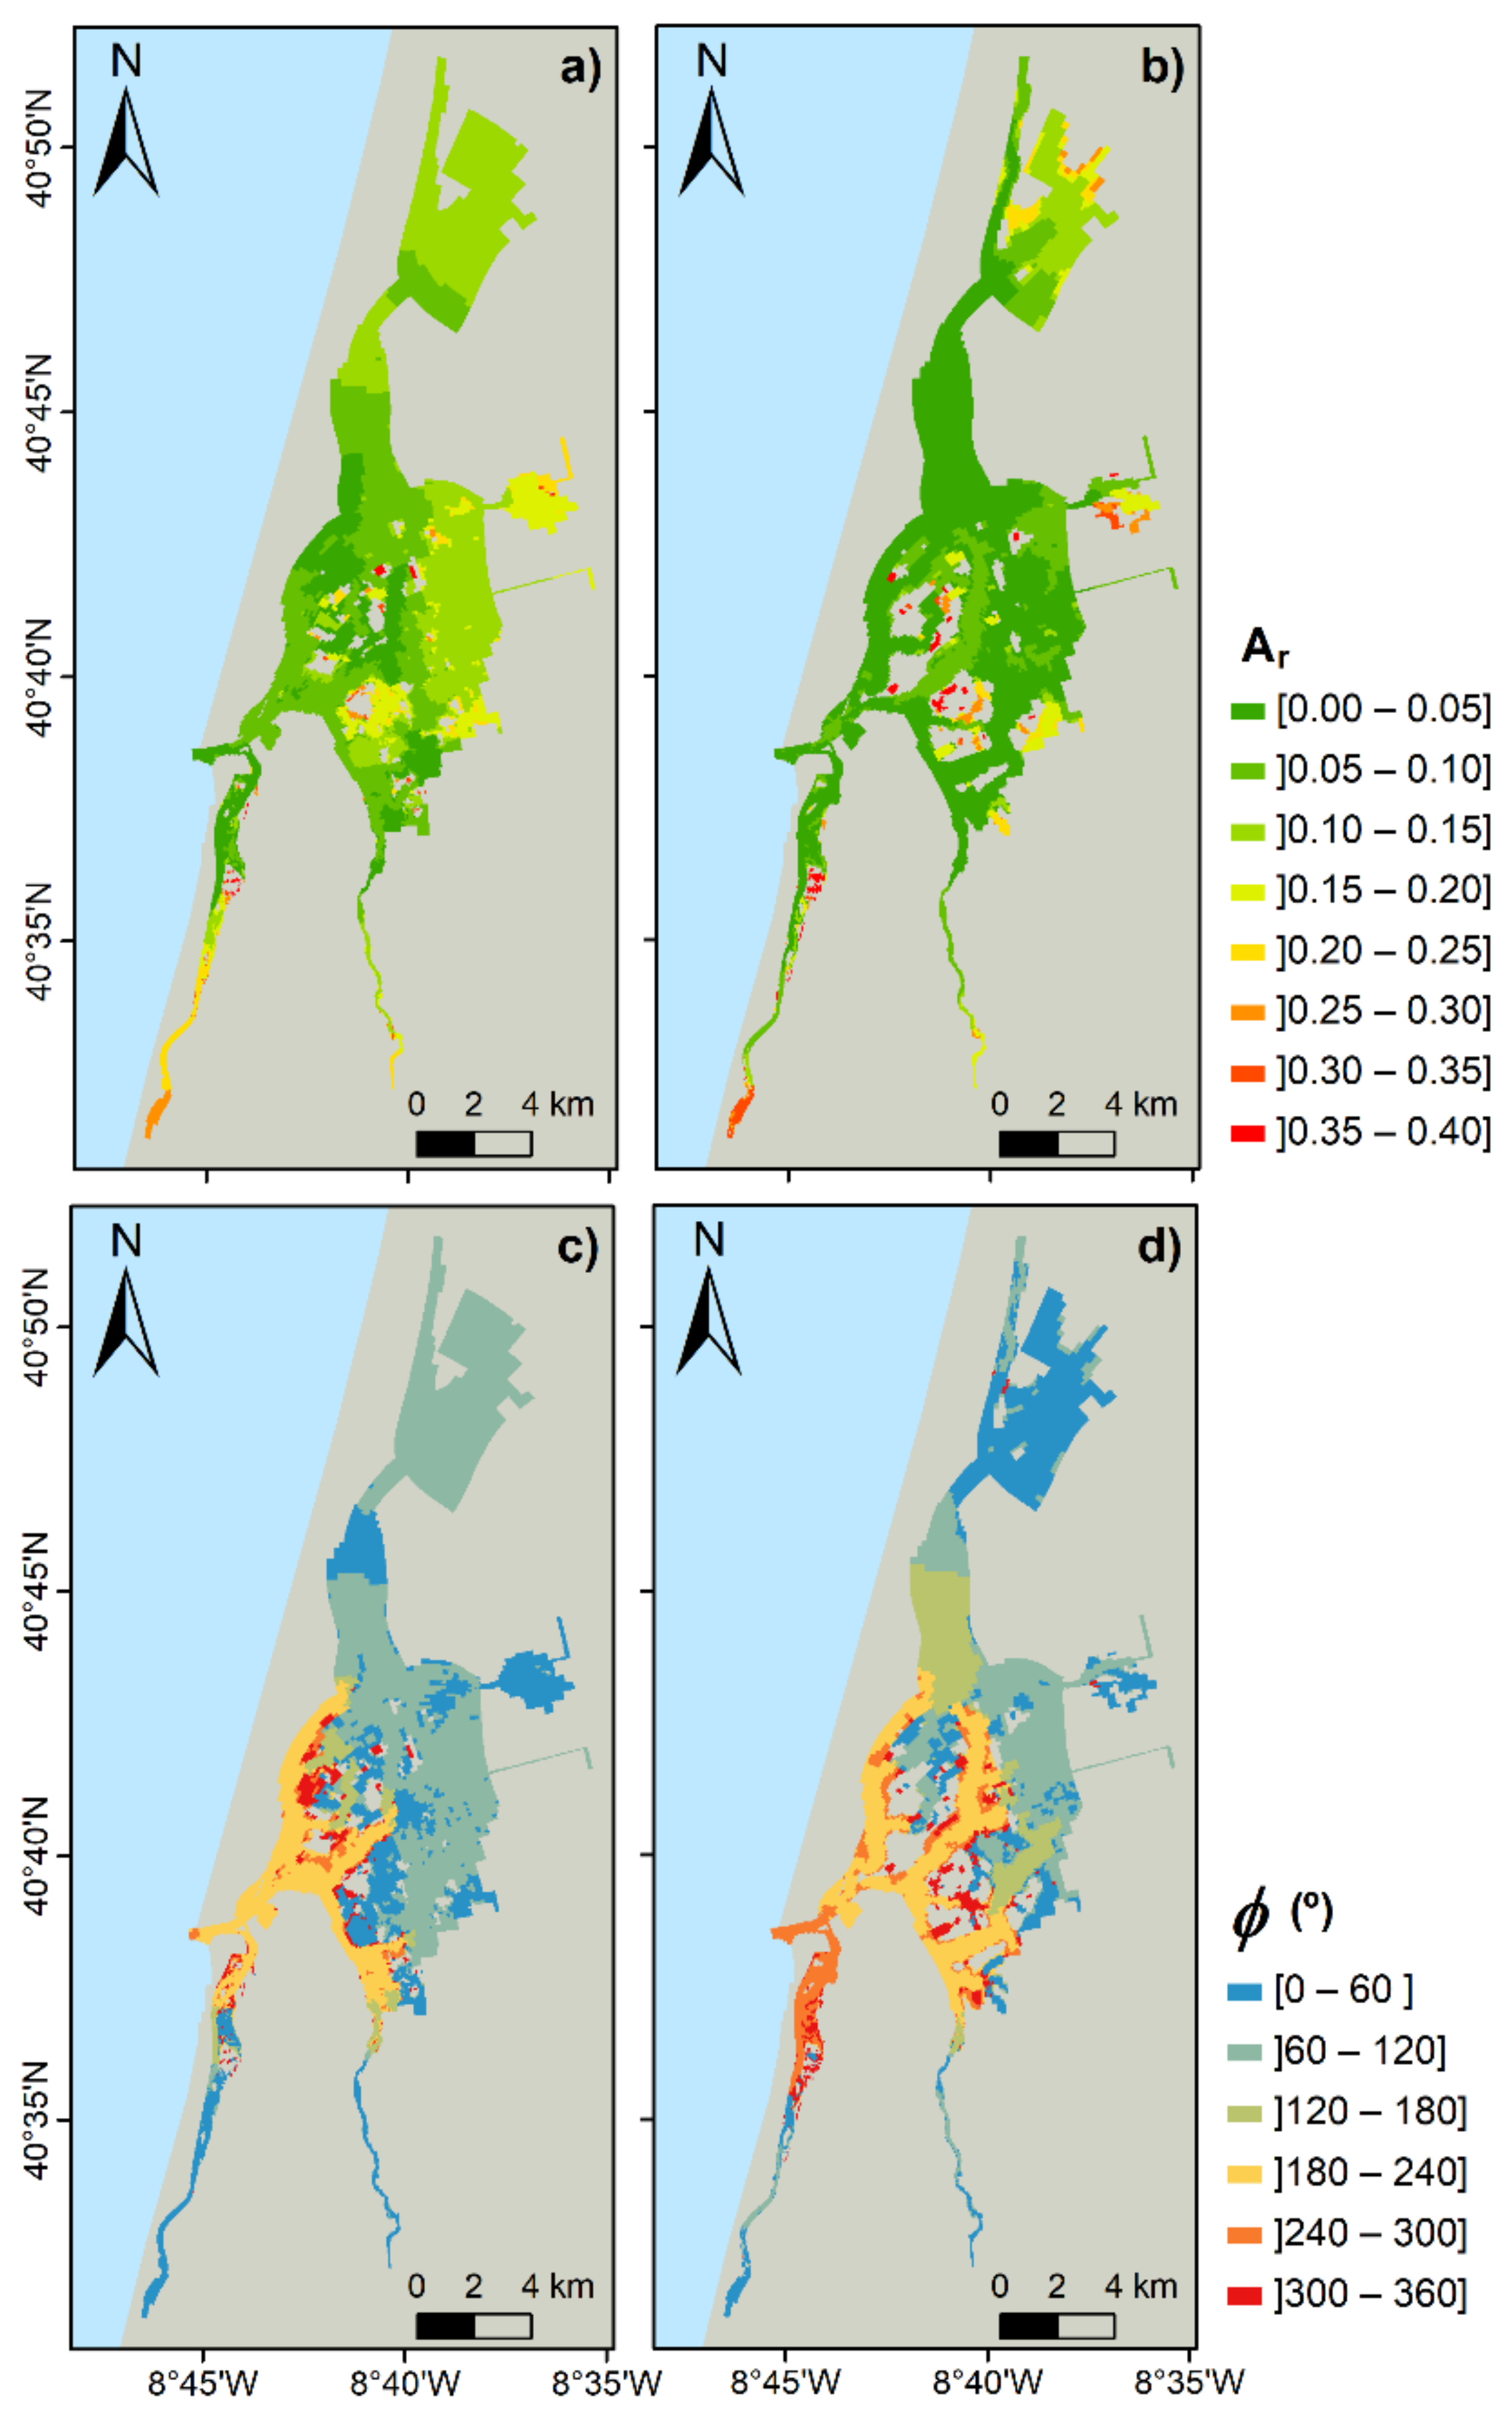
The tidal asymmetry (amplitude ratio and relative phase) was computed for all the lagoon and is mapped in Figure 6, for 1987 and 2020 bathymetries. Results indicate that the magnitude of the tidal distortion increases from the mouth (between 0 and 0.1) towards the channels heads for both configurations, reaching values higher than 0.3 in the Mira channel head (Figure 6a,b). The results of relative phase evidence that the lagoon is ebb dominated from the inlet until the middle of the main channels and flood dominated upstream for both configurations (Figure 6c,d). It is noteworthy that the ebb dominated region extends slightly upstream for 2020 bathymetry.
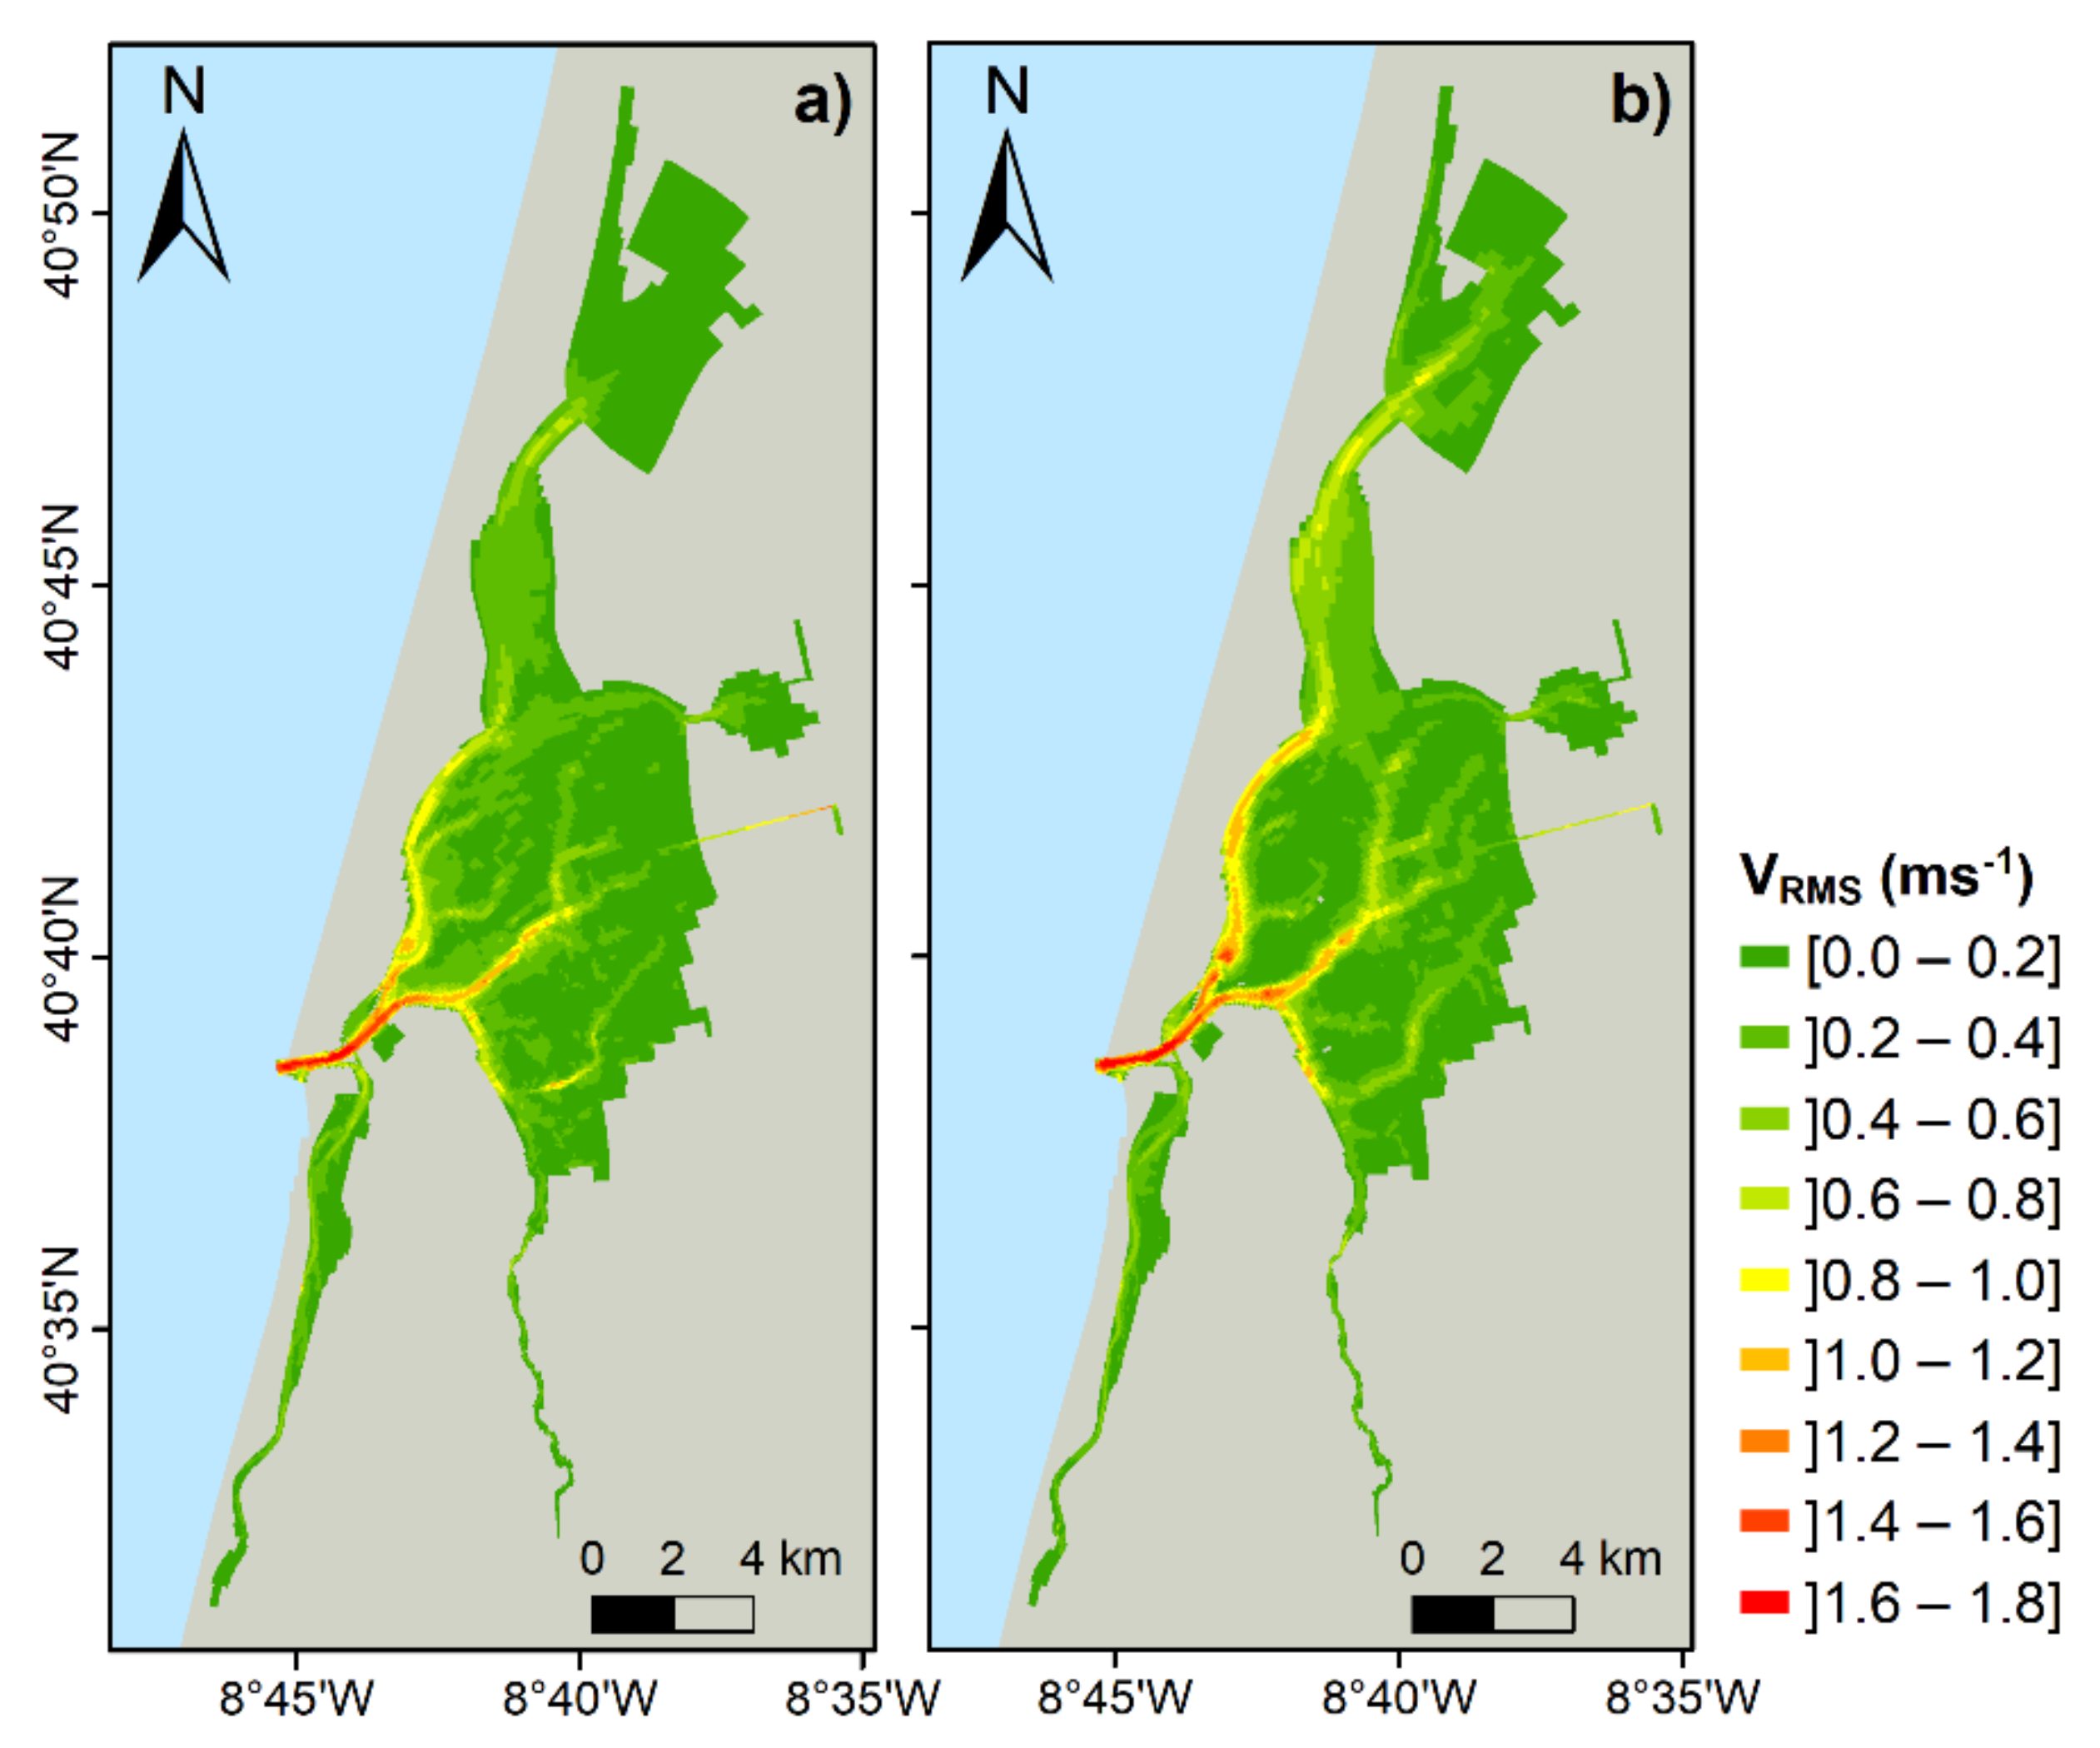
The tidal current velocity (Figure 7), quantified through the VRMS, is stronger in the inlet channel with values between 1.4 and 1.6 m s−1 for both configurations, while for the S.Jacinto and Espinheiro channels the VRMS ranges from 0.8 to 1.2 m s−1. For the rest of the lagoon, the current velocity is lower than 0.8 m s−1.
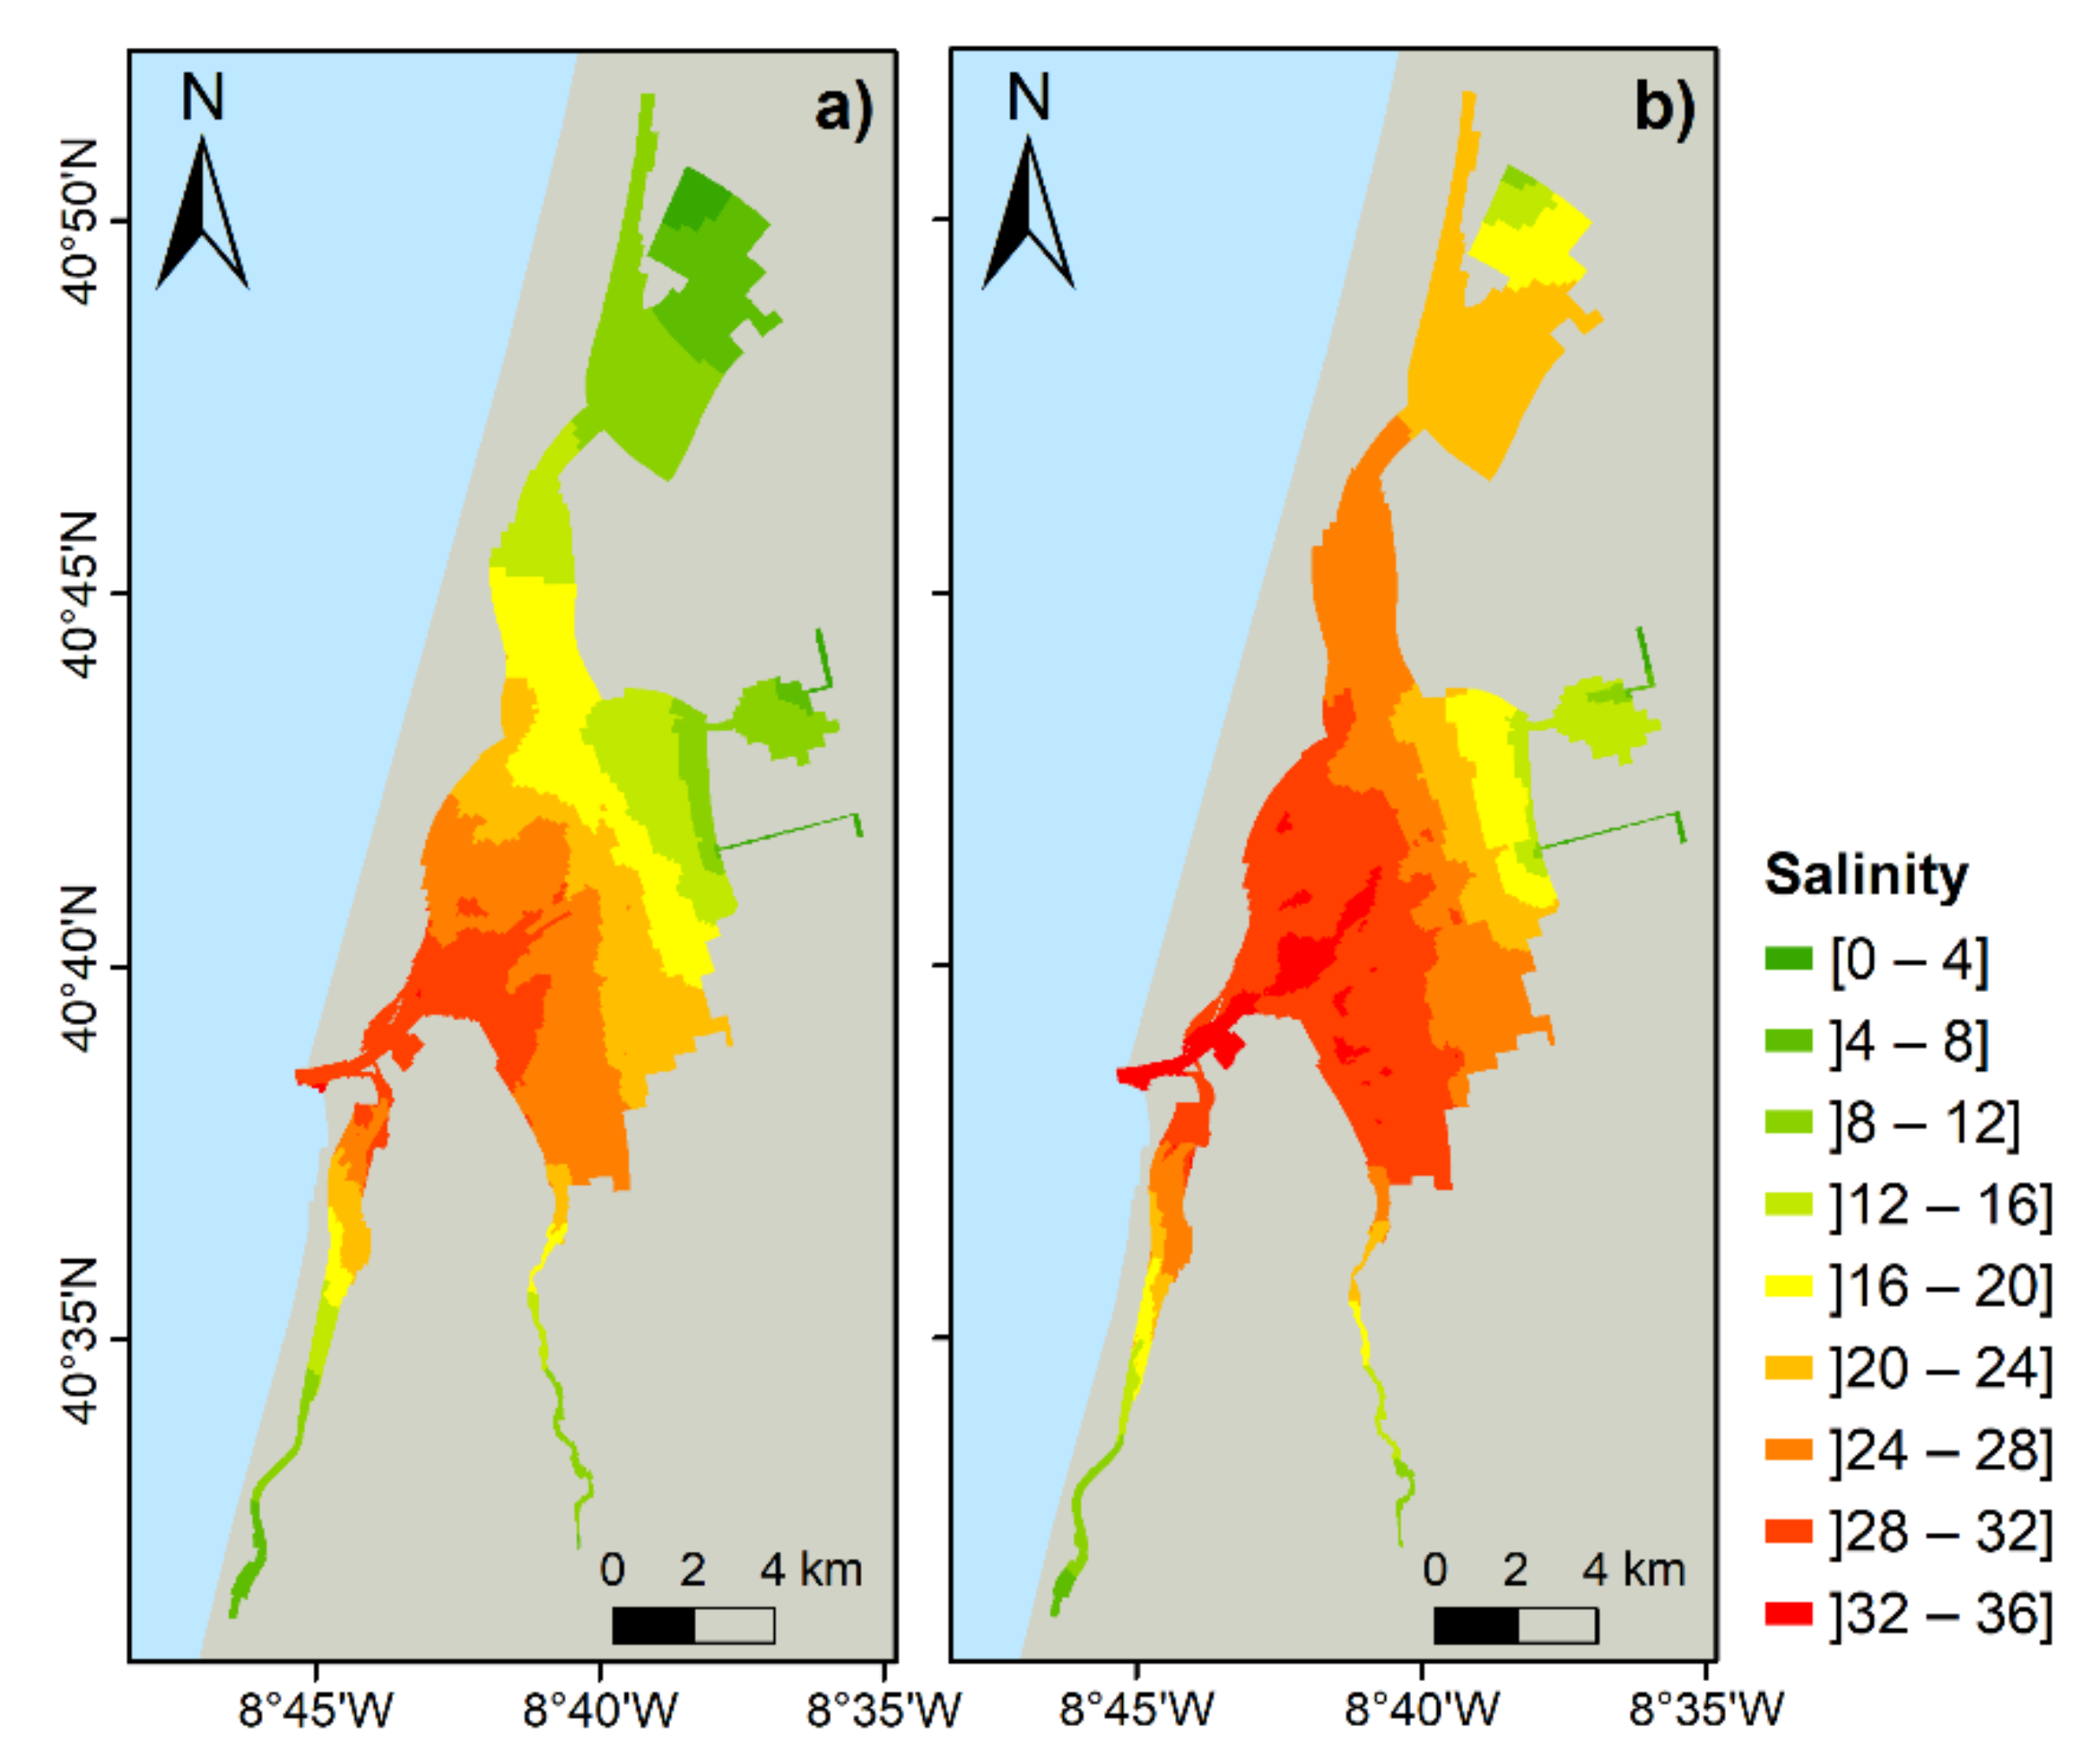
The mean salinity values for 1987 and 2020 bathymetries were also computed and are shown in Figure 8. A typical estuarine pattern can be observed characterized by a longitudinal salinity gradient, with the highest salinity values observed closer to the ocean boundary (nearly 35) and decreasing with the distance from the inlet, as the fluvial input increases (with values between 6 and 8, and 8 and 15, at the end of the channels, for the past and present bathymetries, respectively.).
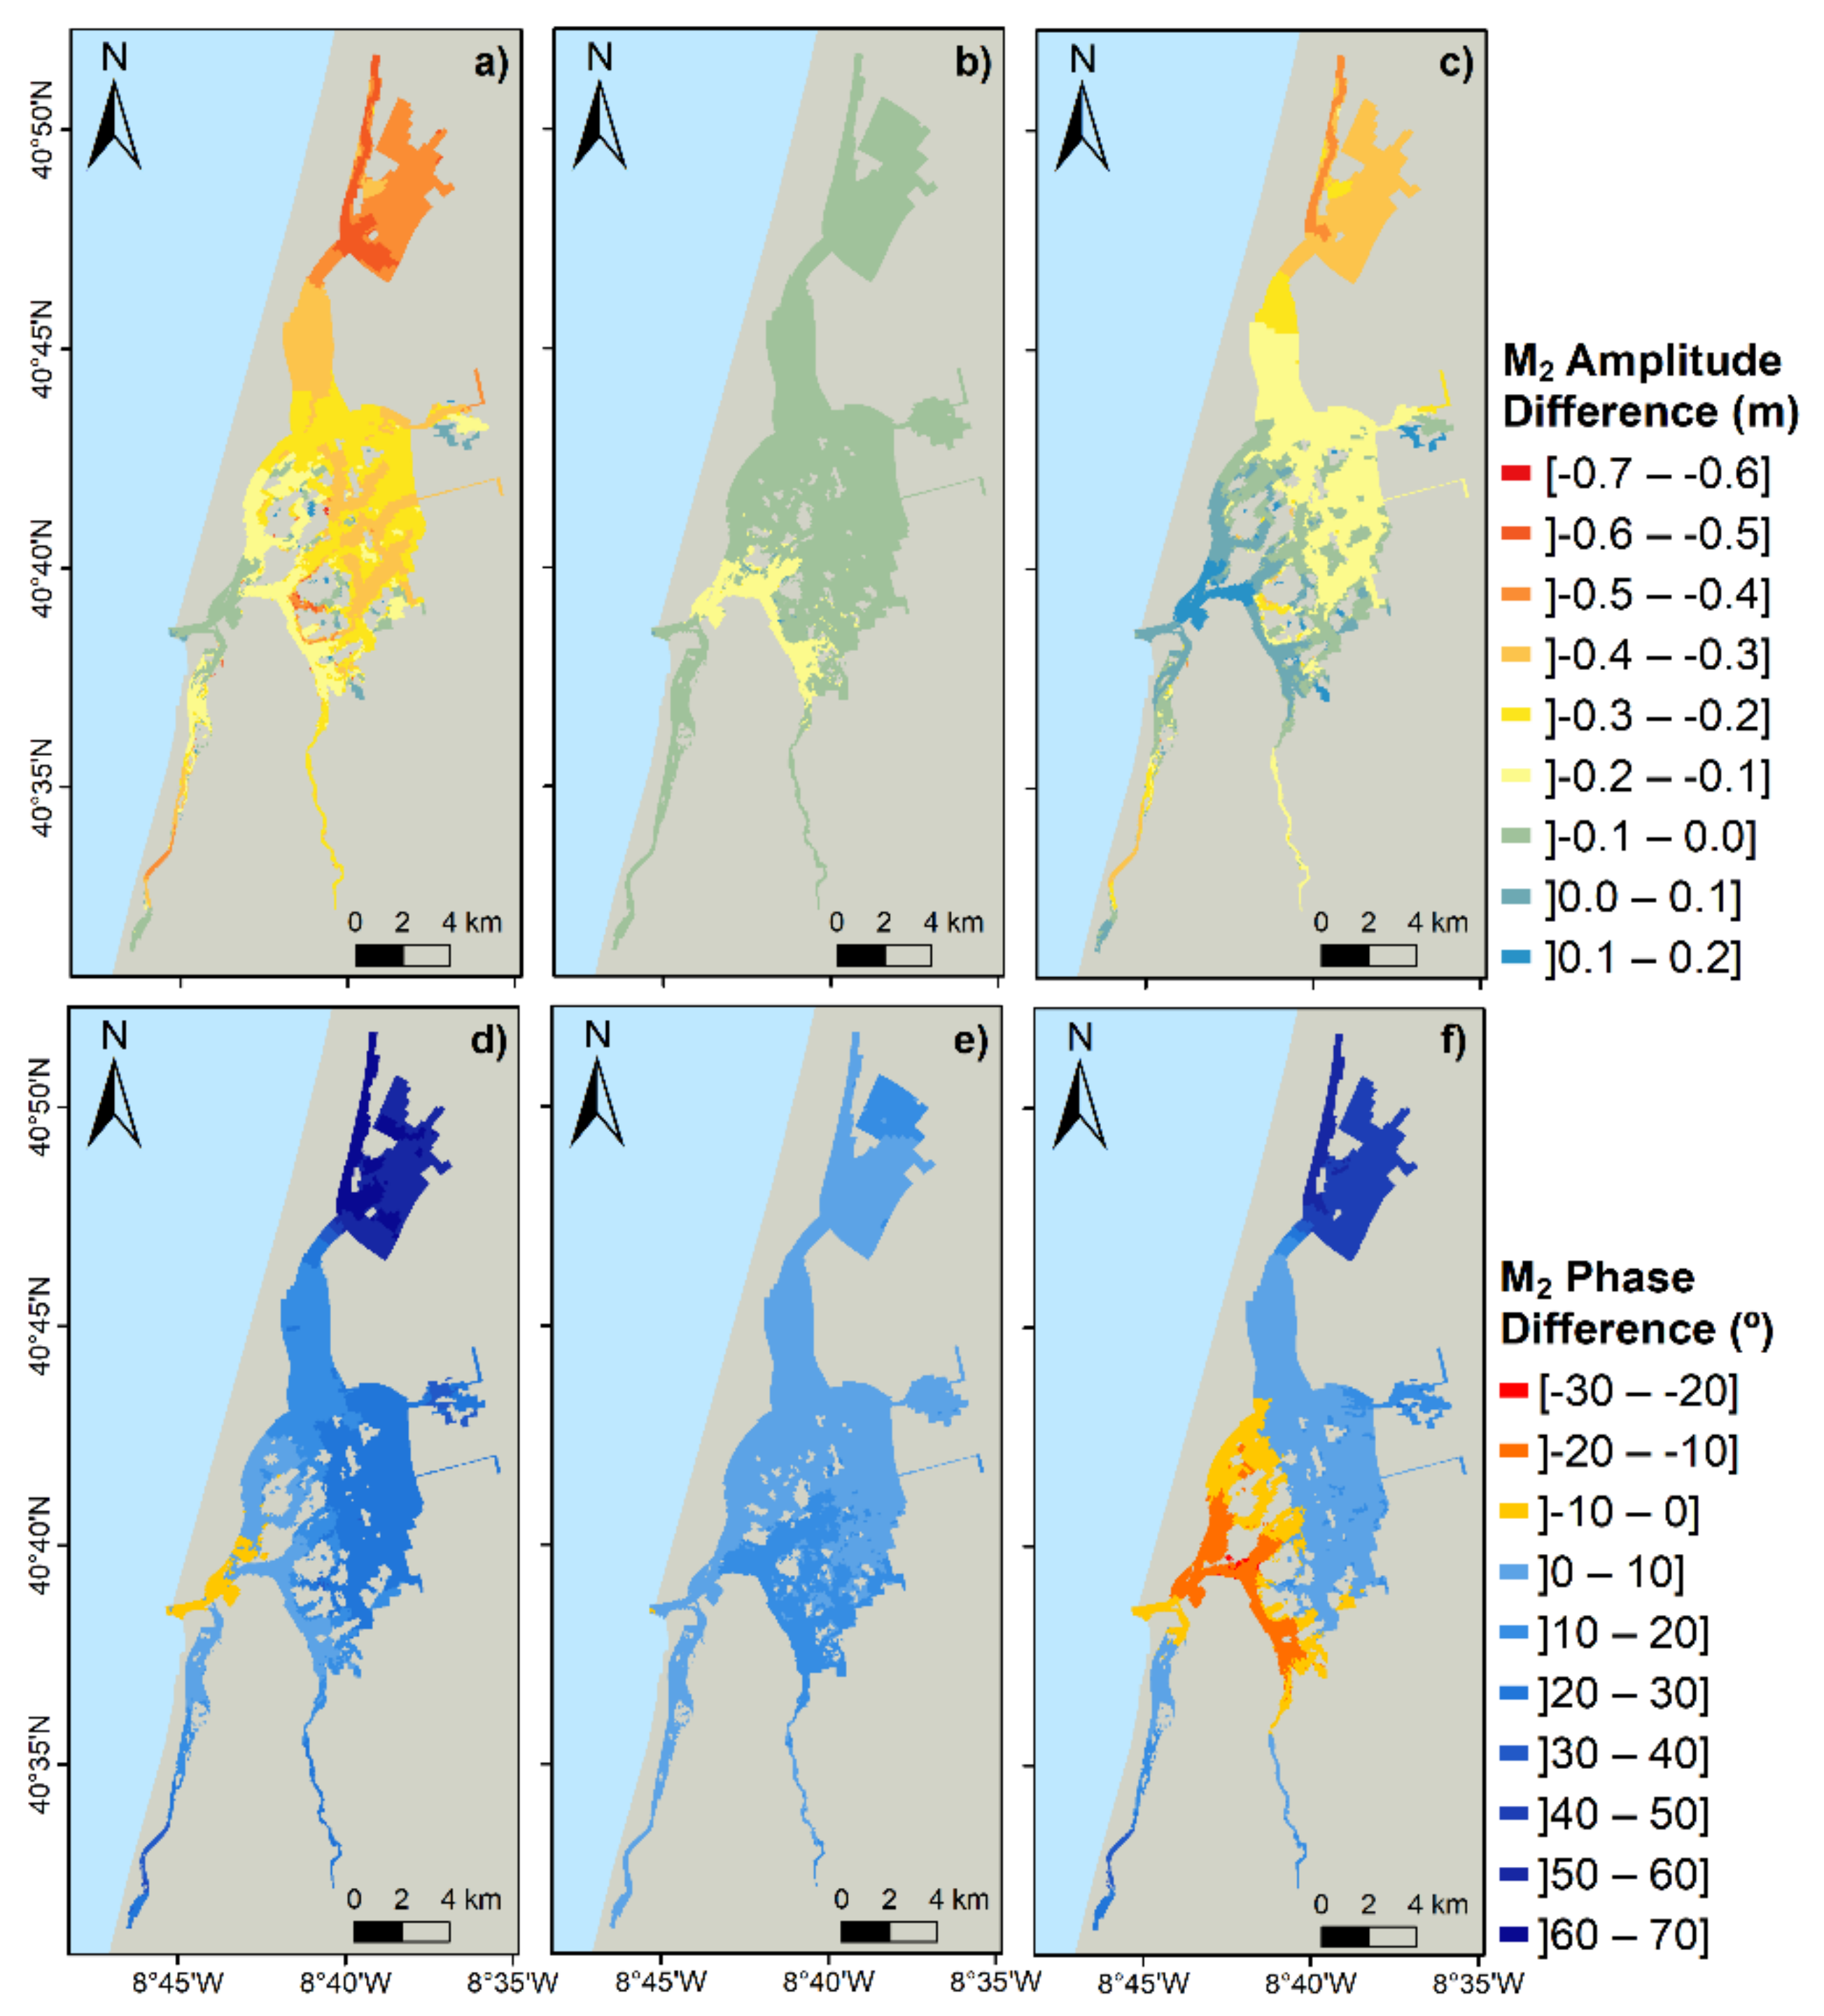
To assess the changes that occurred between 1987 and 2020, the differences between model results obtained for both periods were computed for M2 amplitude and phase, VRMS, tidal asymmetry, tidal prism, and salinity (Figure 9, Figure 10, Figure 11, Figure 12 and Figure 13). Additionally, and to understand whether the changes that occurred over the years are due to the inlet or main lagoon channels deepening, the differences between 1987 and scenarios 1 (considering the deepening of the inlet), and 2 (considering the deepening of the main channels) are also represented (Figure 9, Figure 10, Figure 11 and Figure 12).
The results show that the tidal amplitude increased in response to the morphologic changes that occurred between 1987 and 2020, with the highest differences observed at the end of the channels, reaching 0.60 m in the S.Jacinto head (Figure 9). At the end of Espinheiro, Ílhavo and Mira channels the amplitude increases between 0.30 and 0.45 m. Otherwise, the phase delay decreased, with the highest differences observed at the channel heads. Once again, the main changes are observed in S.Jacinto channel end, with a phase lead higher than 60°, which means that for the present the M2 tidal constituent takes nearly 2 h less to propagate from the lagoon mouth to the head of S.Jacinto channel than in 1987. For Espinheiro, Ílhavo, and Mira channels the phase lead is approximately 40° (80 min). These patterns determined by numerical modelling fully agree with observations represented in Figure 3, showing the good model performance for both configurations developed.
Regarding the differences between the 1987 configuration and the two synthesized scenarios (Scenario 1 and Scenario 2), two different patterns are observed. On one hand, Scenario 1, which reflects the deepening of the inlet, induces an increase of M2 amplitude and a decrease in the phase delay close to the inlet, while differences are almost negligible at the higher lagoon. The differences at the inlet are not higher than 0.15 m and 20° (~40 min), respectively. On the other hand, results for Scenario 2, which reflects the deepening of the main channels, reveal an increase of tidal amplitude and a decrease in phase delay from the inlet to the channel’s head. Changes are almost negligible at the inlet, but are significant towards the end of the channels, showing a pattern similar to that resulting from the differences between the 1987 and 2020 configurations. Namely at S.Jacinto channel, an increase between 0.30 and 0.45 m in M2 amplitude and a decrease between 40° (~80 min) and 60° (~120 min) in the phase can be observed, in a way consistent with observations.
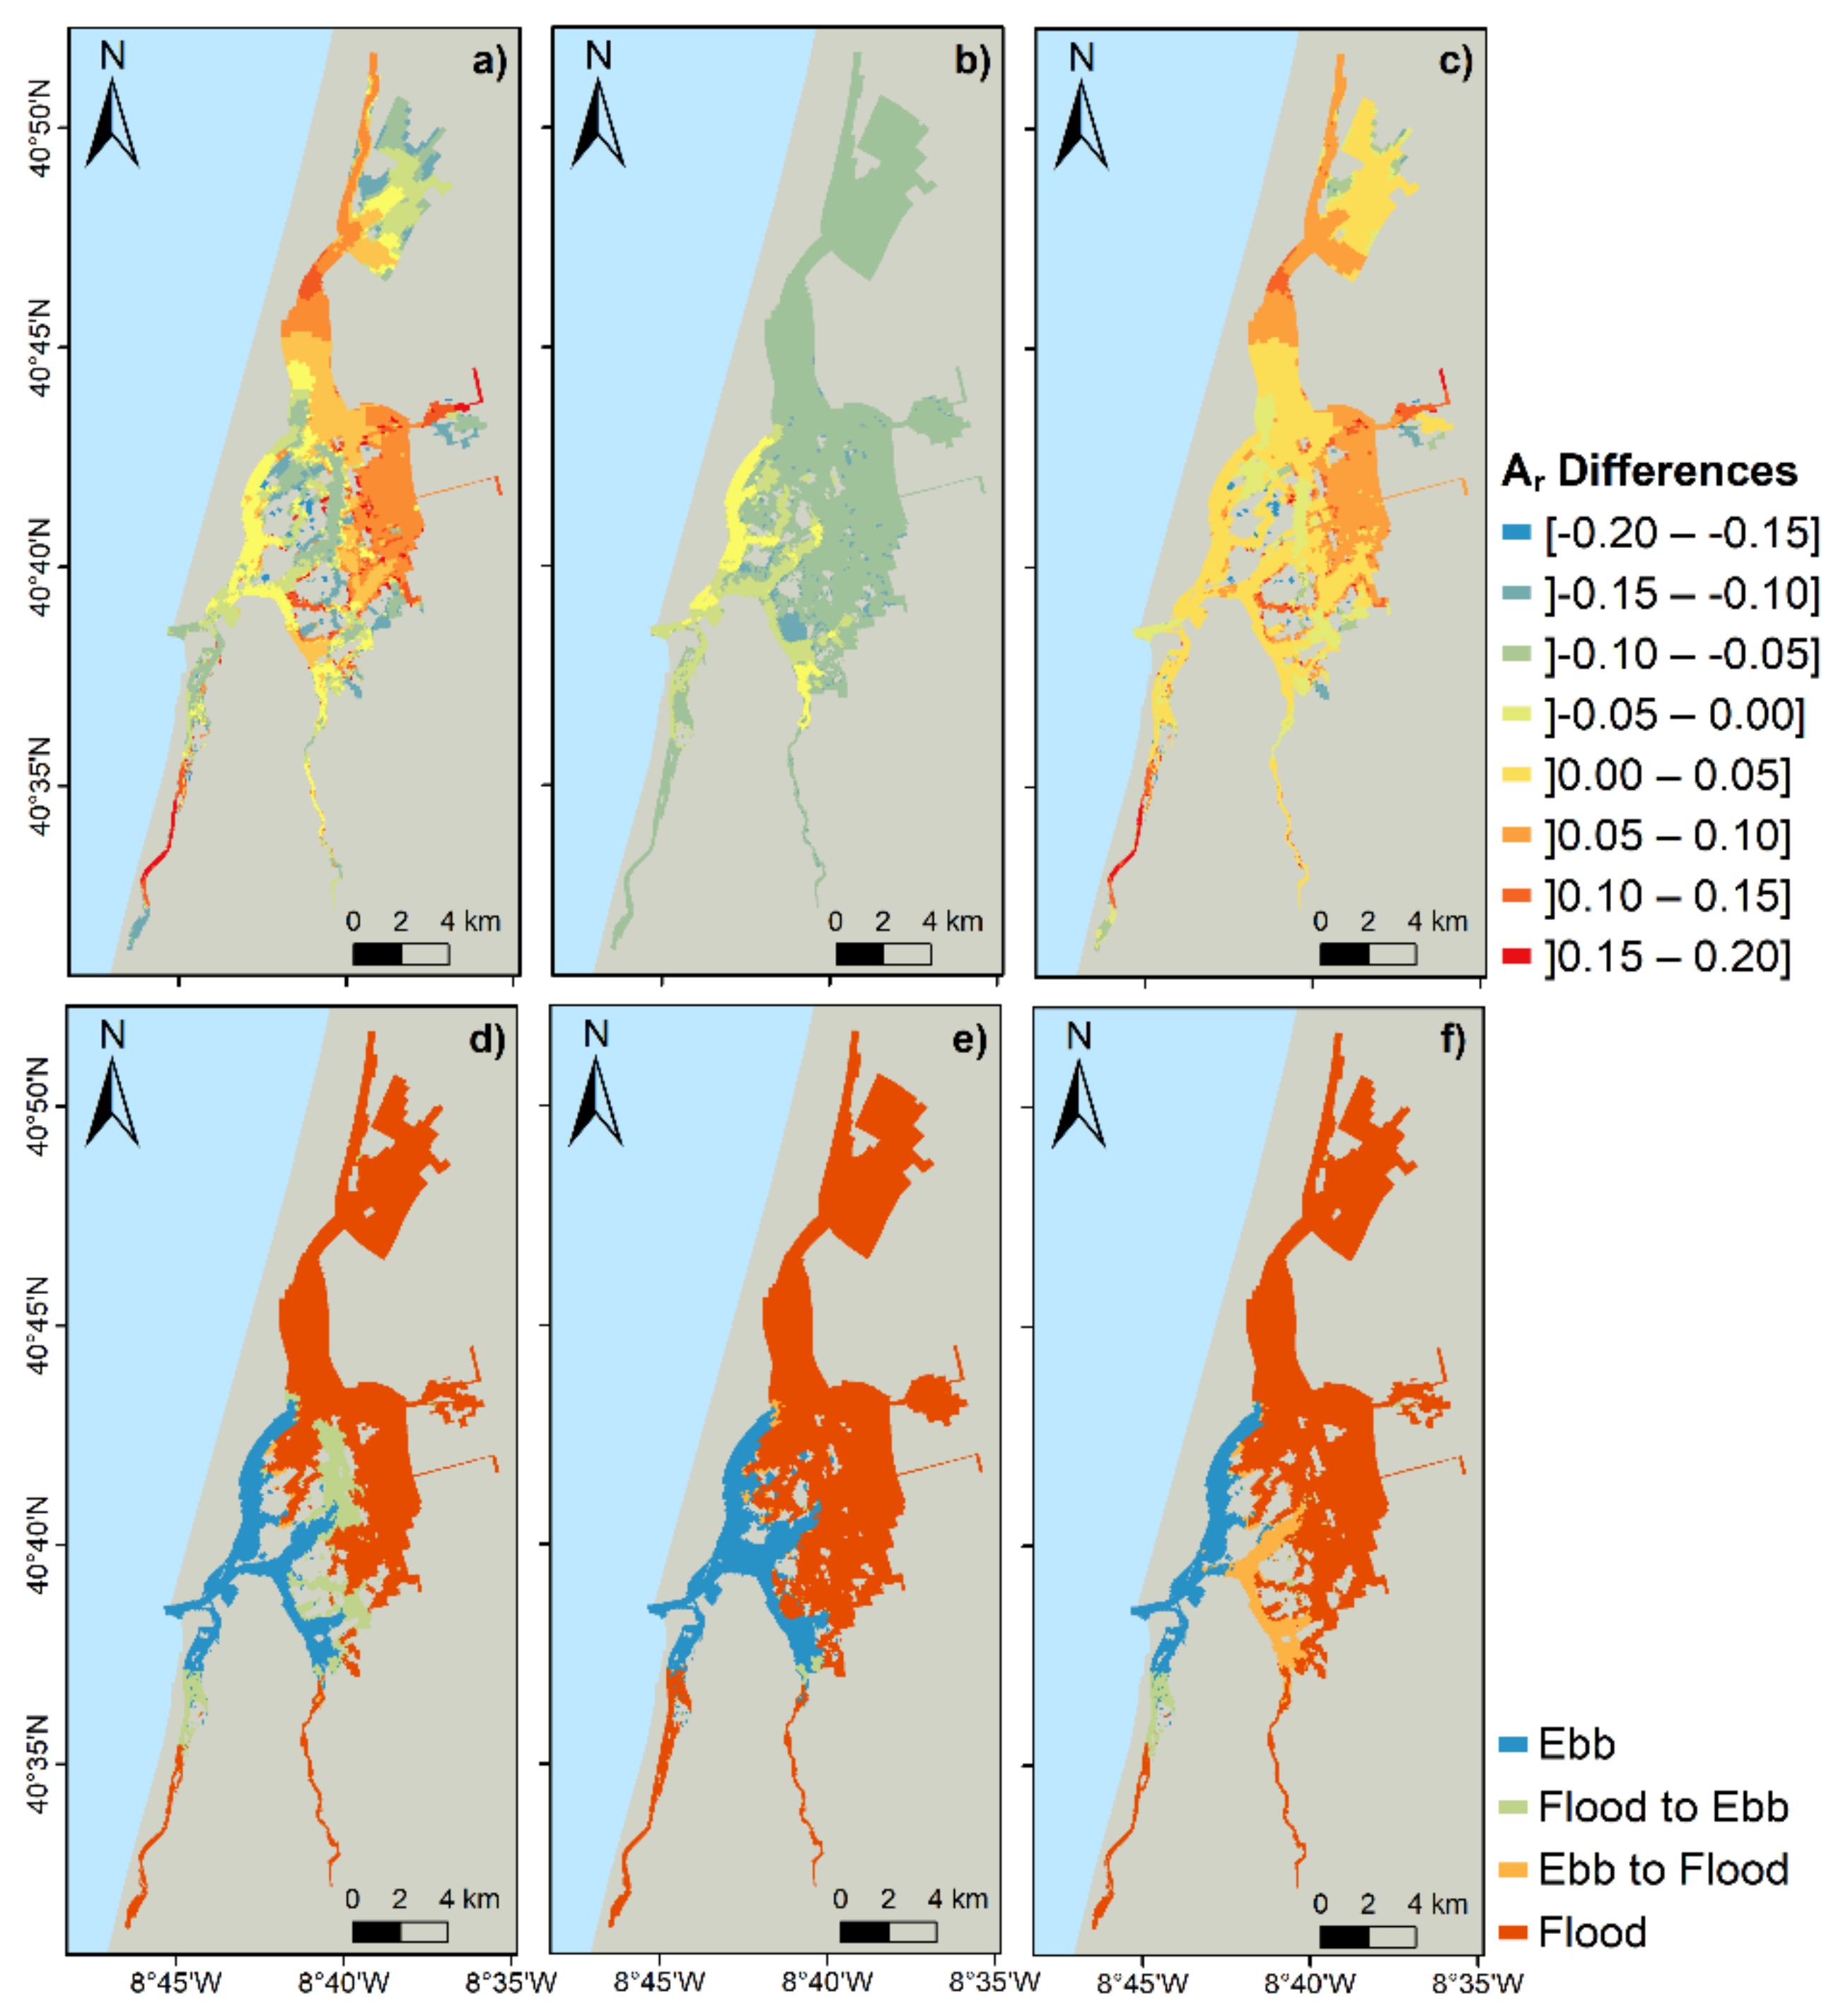
Generally, the results for tidal asymmetry suggest that the tidal wave is less distorted nowadays than in the past for most of the lagoon (Figure 10a). Exceptions are observed at the far end of the main channels and in a specific channel in the central lagoon, where a slight increase in the tidal distortion occurs. Additionally, in the inlet region and at the beginning of Mira channel, the amplitude ratio differences are negligible. Comparing the amplitude ratio between 1987 and Scenario 1, it is observed that the deepening of the inlet channel induces a reduction in the tidal wave distortion from the inlet to the middle of the main channels and an amplification of the wave distortion upstream (Figure 10b). Moreover, when the deepening of the main channels is considered (Scenario 2), results are similar to the ones observed for the 2020 configuration, with a general decrease of the tidal distortion (Figure 10c).
Regarding the relative phase, results show that the ebb dominance of the central lagoon extends further upstream from 1987 to 2020 (Figure 10d) and no differences occur between 1987 and Scenario 1. Otherwise, for Scenario 2 the ebb dominance observed at the beginning of Mira channel extends further upstream, and at the beginning of Espinheiro and Ílhavo channels, the tide dominance changes from ebb to flood (Figure 10f).
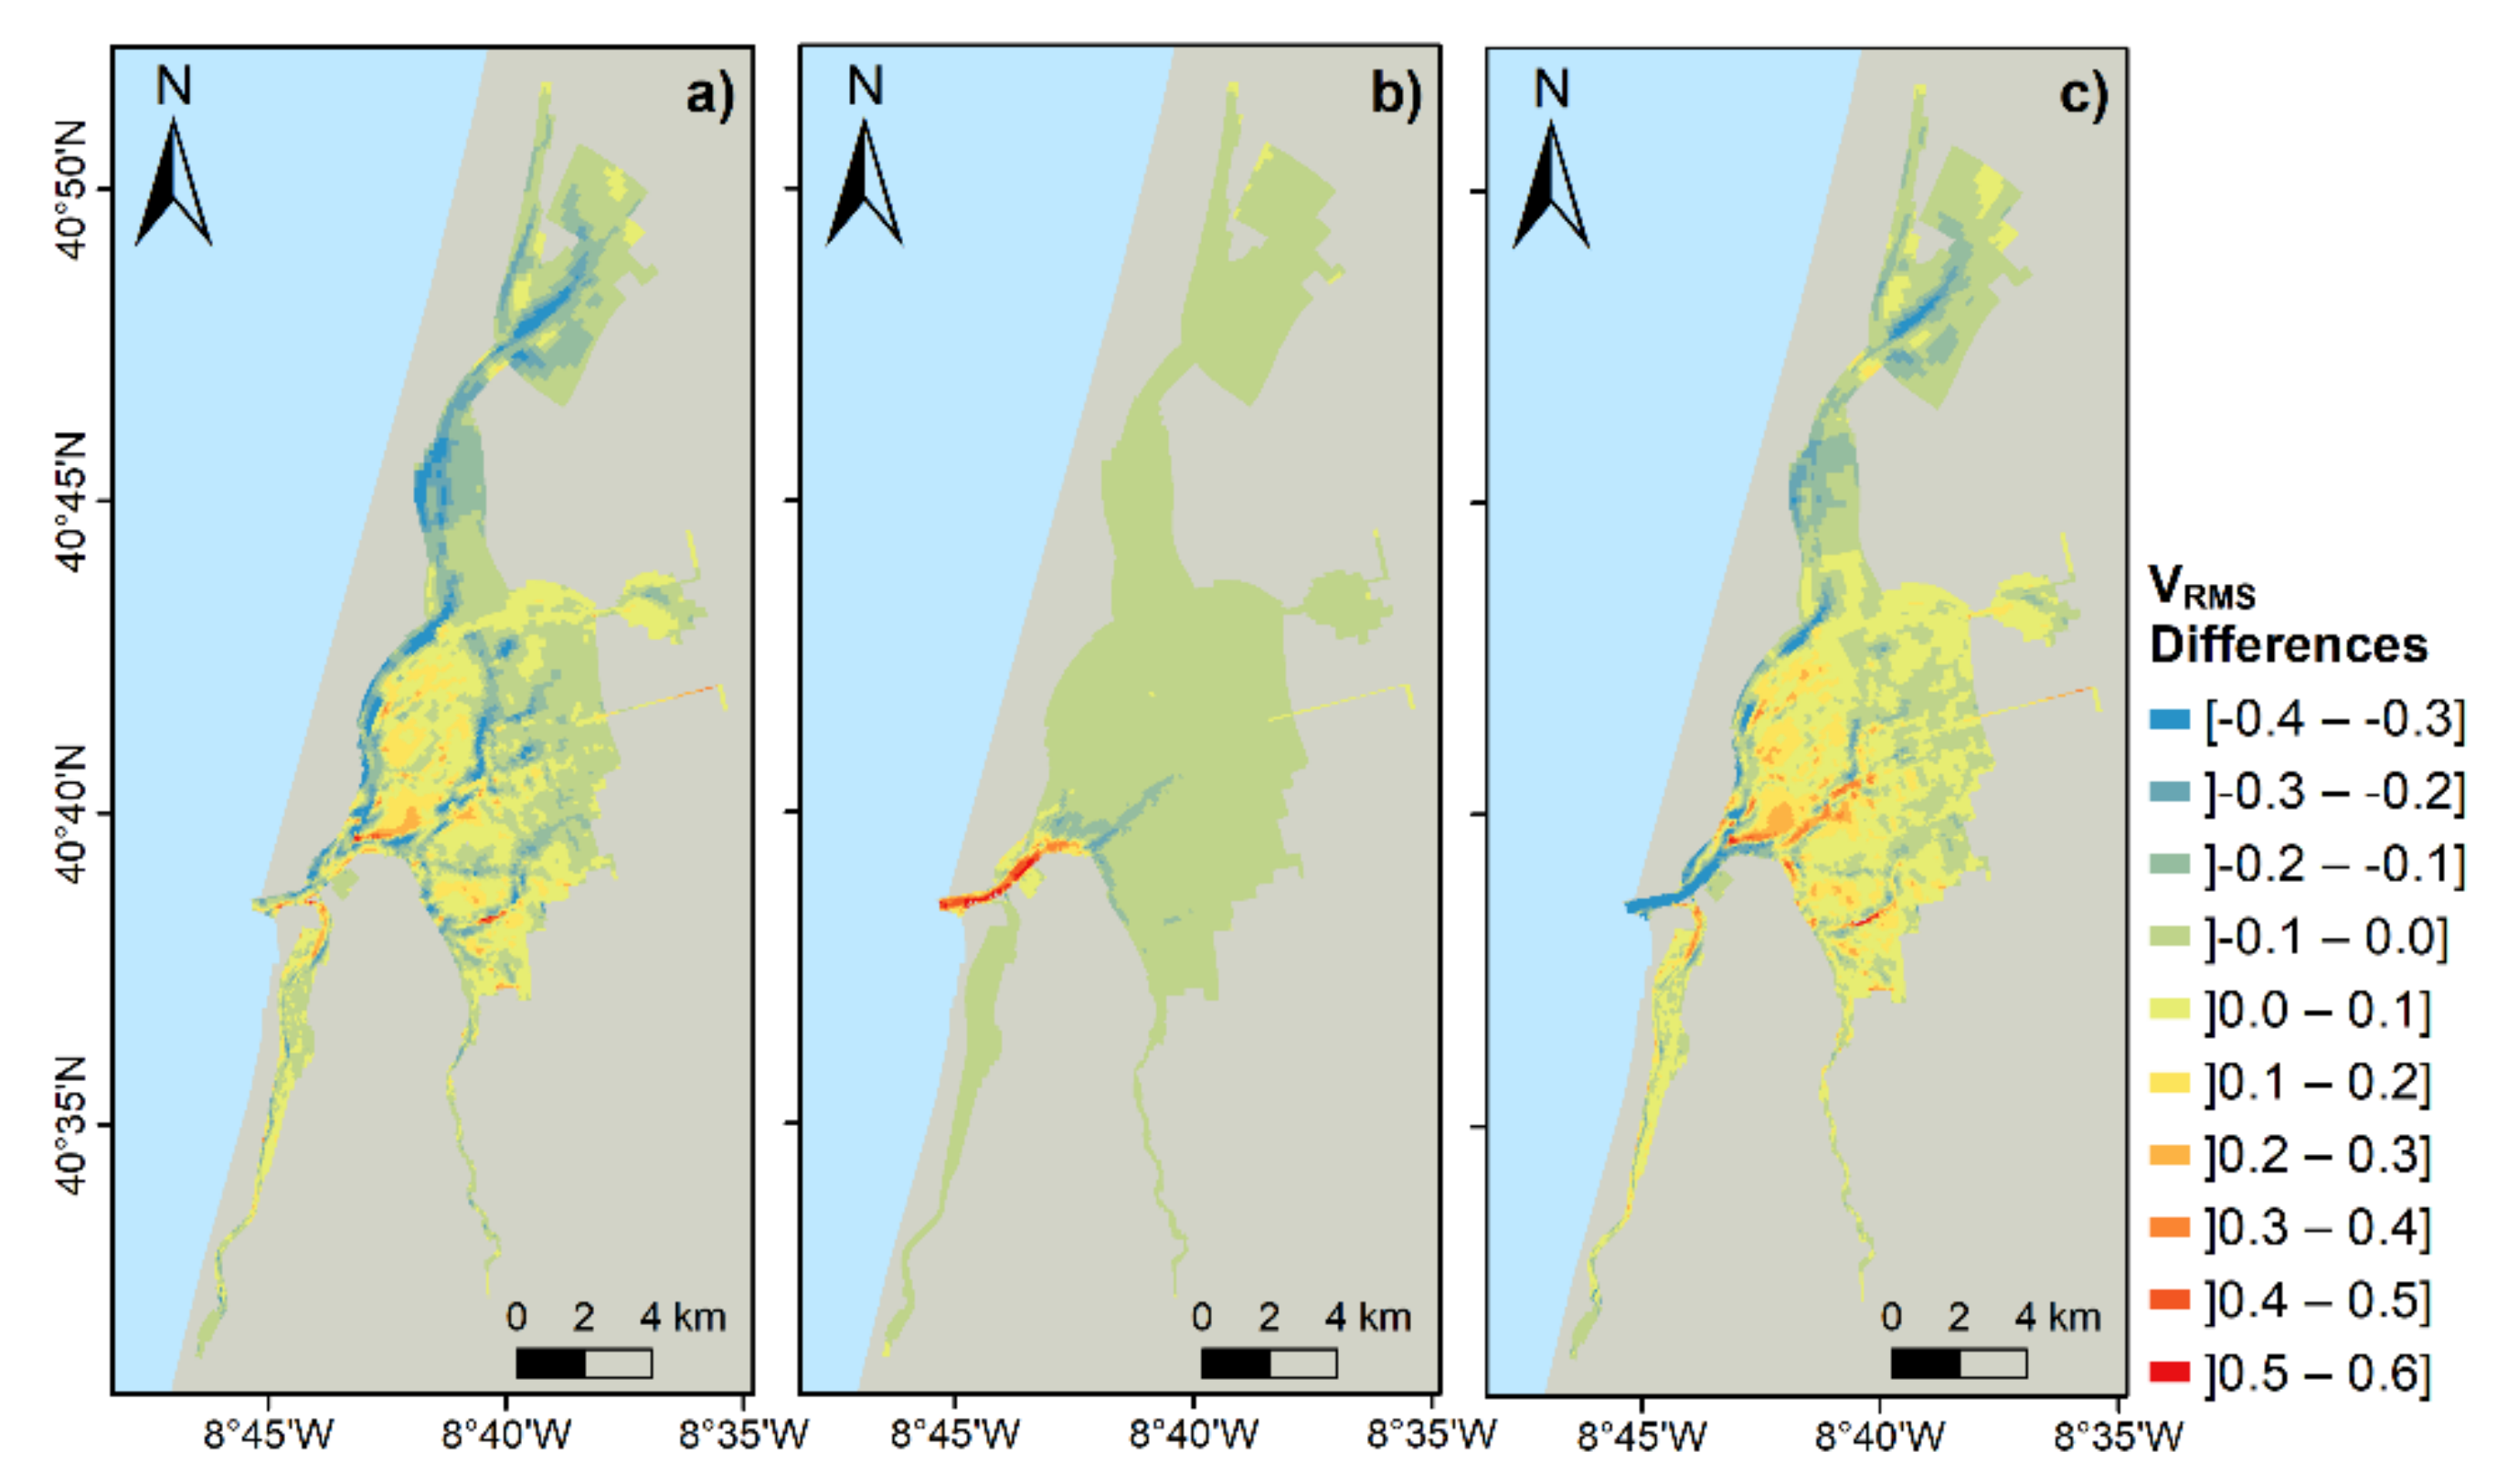
The current velocity was evaluated through the VRMS, and the results suggest its general increase along the main channels of the lagoon between 1987 and 2020 (Figure 11a), with the highest changes observed in S.Jacinto and Espinheiro channels (between 0.3 and 0.4 ms−1). At the intertidal areas, the current velocity slightly increases (less than 0.1 ms−1). When the deepening of the inlet is considered (Scenario 1), a decrease of the VRMS occurs at the inlet channel (more than 0.5 ms−1), while for the rest of the lagoon the differences are negligible. Additionally, the comparison between VRMS for 1987 and Scenario 2 shows that the channels deepening induce a significant increase of the current velocity in the main channels and a slight increase in intertidal areas. This pattern is very similar to that resulting from the differences between the 1987 and 2020 configurations, suggesting that the deepening of the lagoon main channels is the main cause of the changes verified in the Ria de Aveiro.
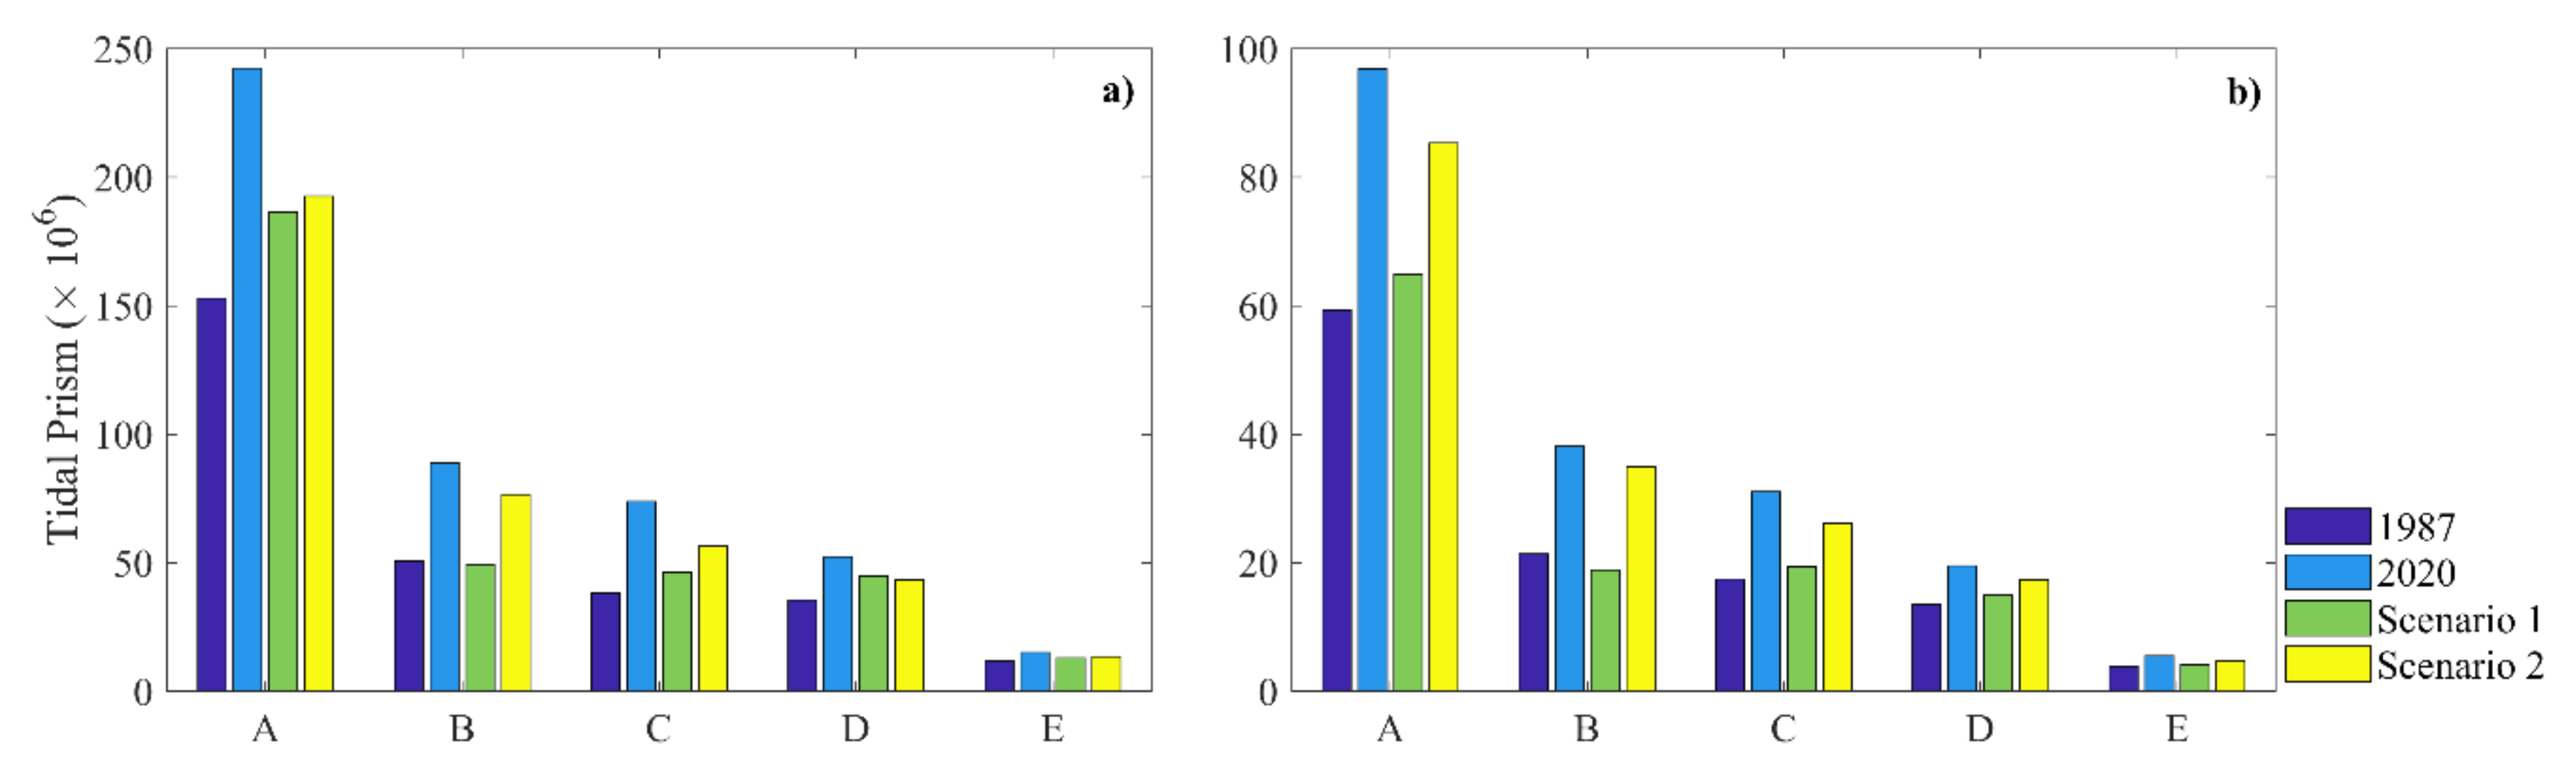
The values of computed tidal prisms (Figure 12) reveal a significant rise between 1987 and 2020 in all cross-sections analysed, and for both tidal conditions. In detail, at the inlet, the tidal prism increased 60% on average, from 153.0 × 10⁶ m3 to 242.2 × 10⁶ m3 (~58%) and from 59.4 × 10⁶ m3 to 96.9 × 10⁶ m3 (~63%) for maximum spring tide and minimum neap tide, respectively. Results evidence that the tidal prism rise is not uniform across the lagoon main channels. Indeed, Espinheiro and S.Jacinto channels experienced the highest increase rates (85% and 77%, respectively) while Ílhavo and Mira channels experienced the lowest ones (45% and 35%, respectively). It is noteworthy that the tidal prism changes observed in S.Jacinto and Mira channels were mostly due to the main channels deepening, whereas the changes observed in the Espinheiro and Ílhavo channels are explained by both the deepening of the inlet channel (~15% and ~17%, respectively) and the main channels (~50% and ~27%, respectively).
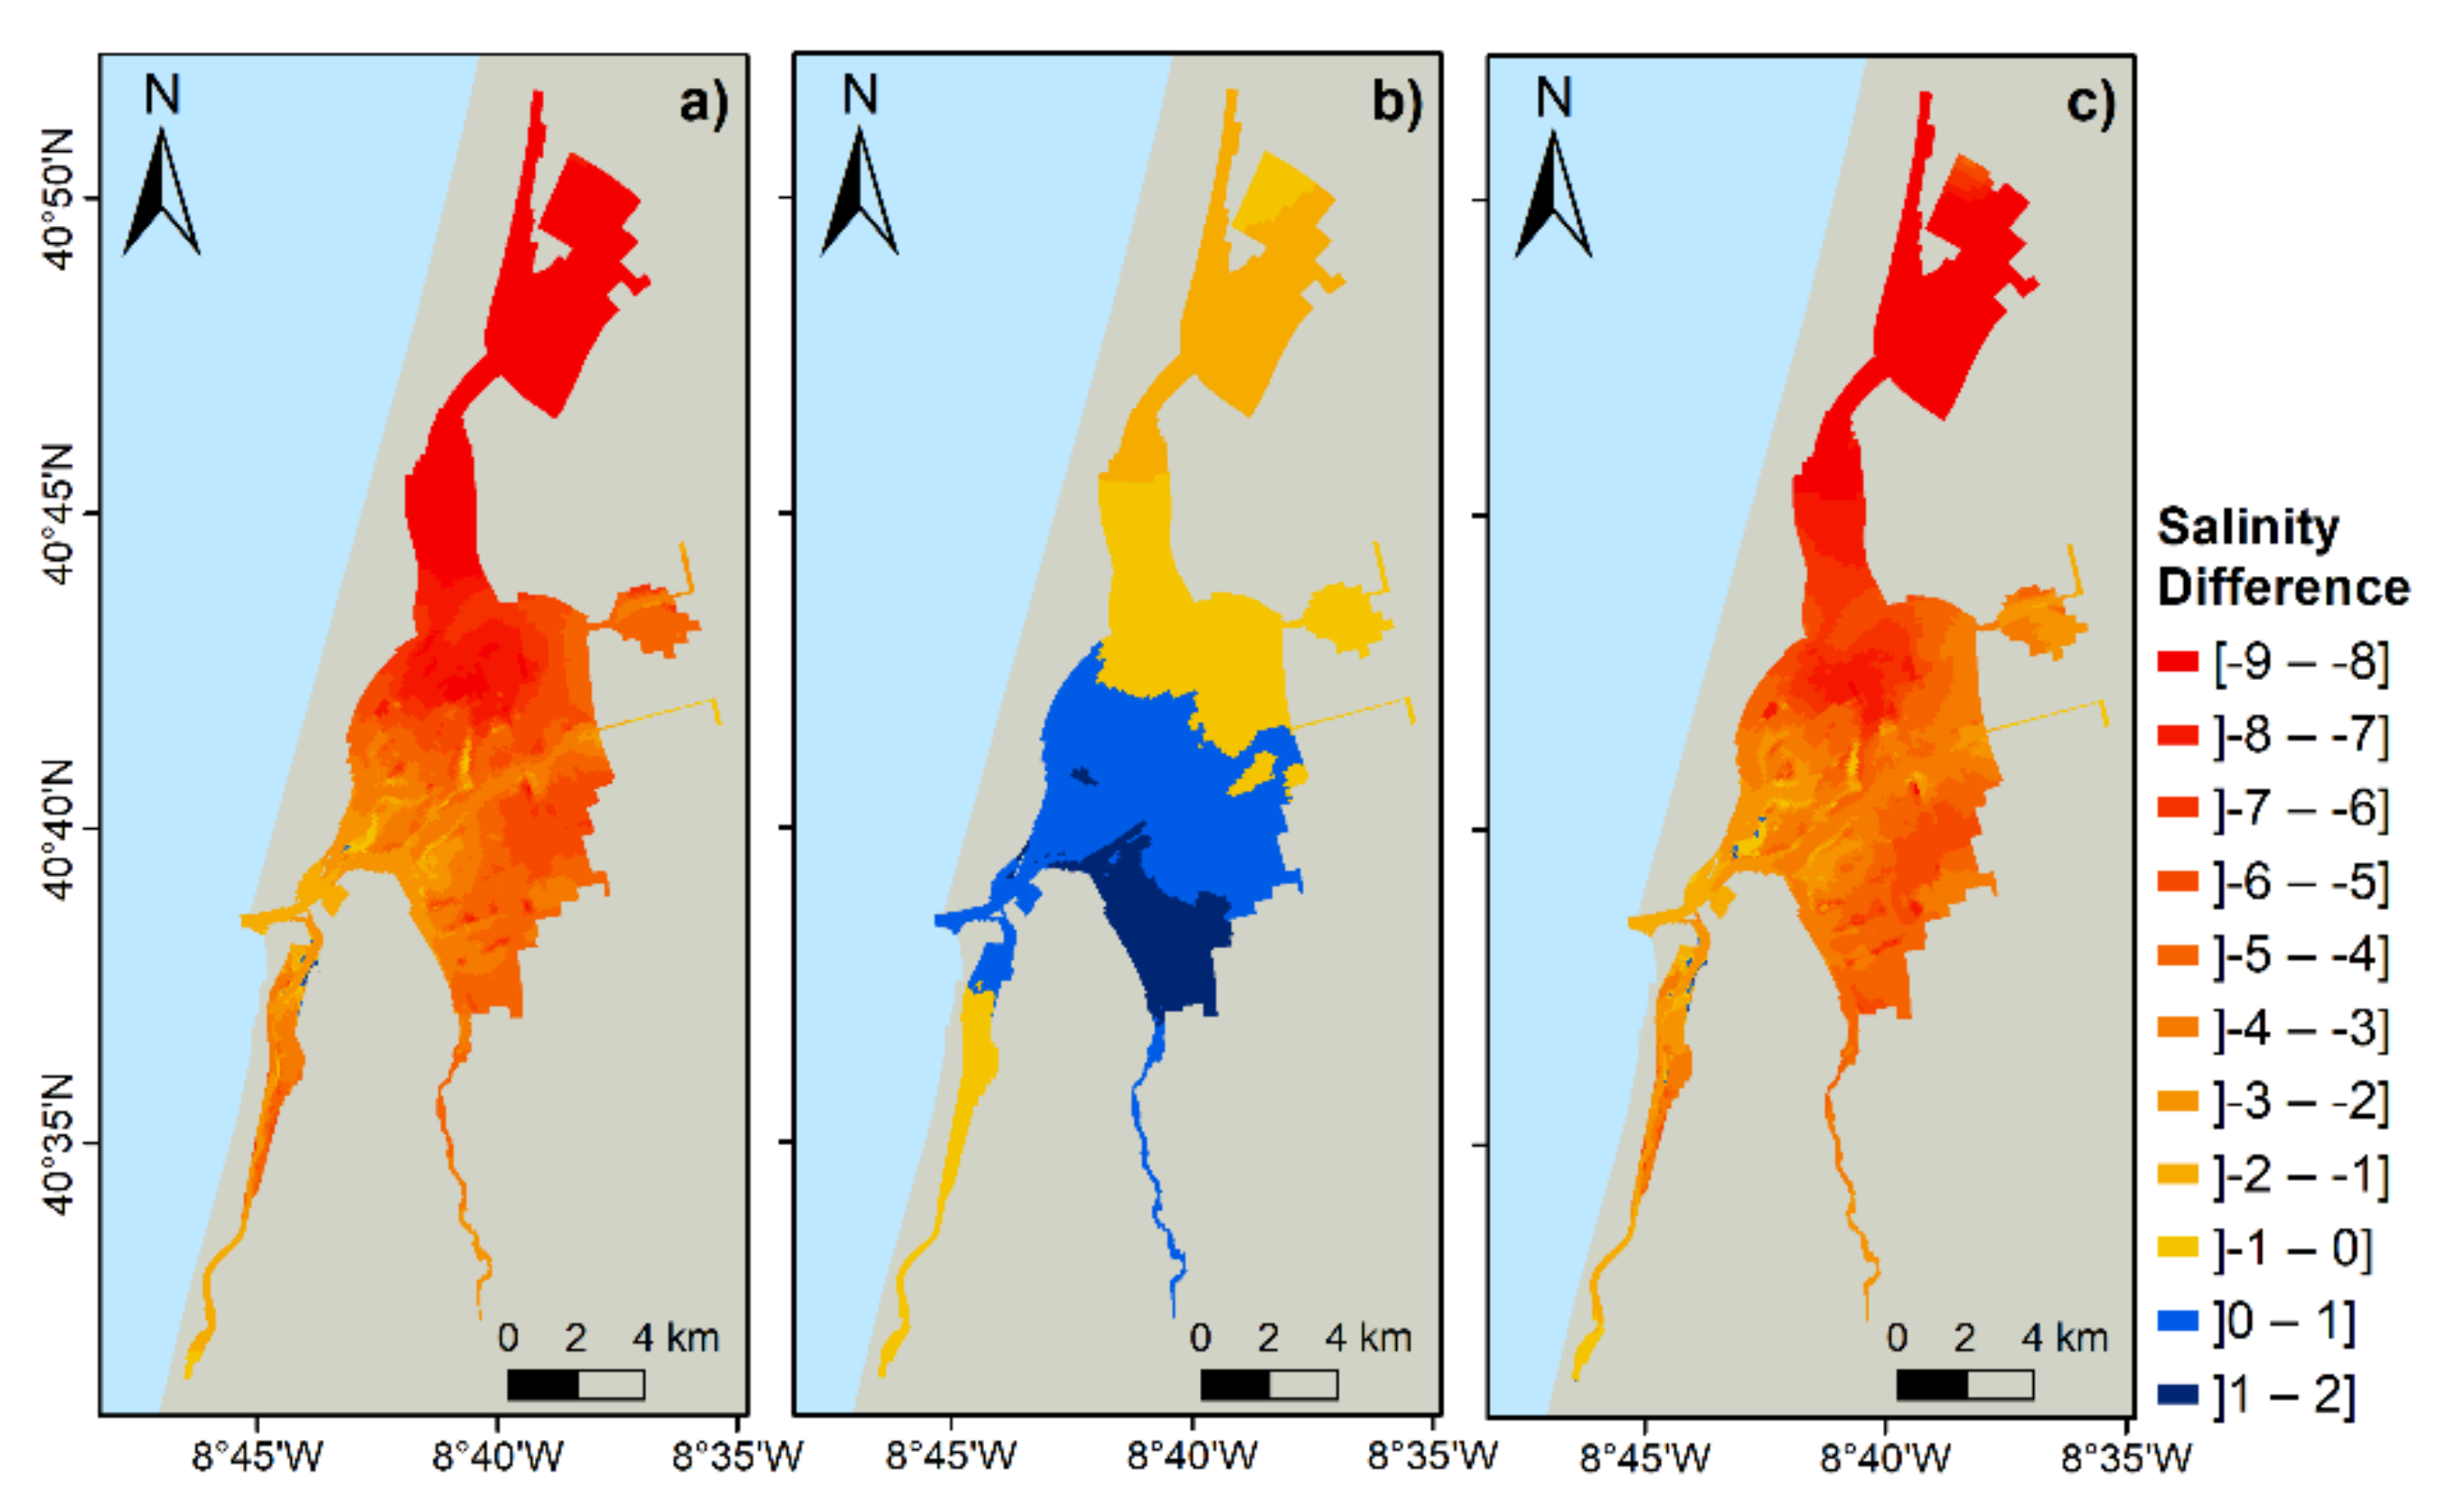
Differences between the 1987 configuration and the two synthesized scenarios (Figure 13) are also presented to assess the main causes of the changes observed in the salinity patterns. Results show that saline intrusion increased in the entire lagoon between 1987 and 2020. As for tidal propagation, salinity changes are almost negligible in the inlet and the highest differences are observed at the channel’s heads, with the maximum expression at S.Jacinto channel. So, salinity changes range from values close to 0 at the inlet to values between 8 and 14 at far the end of S.Jacinto channel, between 2 and 4 in Espinheiro and Ílhavo channels, and between 0 and 2 in Mira channel head.
Regarding the changes induced by the deepening of the inlet region (Scenario 1), they are almost negligible in the entire lagoon, ranging from −2 to 2. Otherwise, the deepening of the main channels (Scenario 2) induces a salinity increase in the entire lagoon, except for the inlet region and Mira channel head, where the differences are negligible. At the end of S.Jacinto channel, the salinity increases between 8 and 14, while for Espinheiro and Ílhavo heads, the salinity increases between 2 and 4, as found from the differences between the 1987 and 2020 configurations.

5. Discussion

5.1. Model Validation

The FLOW module of Delft3D was successfully implemented, revealing its accurate performance in representing the tidal propagation and the salinity in Ria de Aveiro, for both past and present configurations. Despite the model validation being a challenging task, mainly for salinity, a good fit between model results and observations was achieved.
Regarding the water level, both in 1987 and 2020 configurations, the model presents the highest accuracy for the stations located close to the lagoon’s inlet. Indeed, in Barra, S.Jacinto and Costa Nova stations, the deviations represent less than 5% of the tidal range. However, the model accuracy decreases towards the most upstream and shallower channels, with errors between 15 and 25% of the tidal range in some stations located at the head of the channels in the 1987 configuration. Moreover, the best fits were generally observed in 2020 configuration, with errors below 10% in most stations and the highest deviations not exceeding 17% of the total tidal range. The resolution of the numerical grid used in this work may explain some of the errors found for the validation of the water level since the narrowest channels may not be fully well represented, leading to inaccuracies in the final numerical bathymetry and therefore in tidal propagation.
Concerning salinity, the deviations were generally higher than those obtained for water level, as usual when modelling this variable. Though four stations presented good correlations between numerical results and observed salinities, with errors below 10% of the local salinity range, the other two presented errors higher than 40% (Vagueira and Rio Novo). The use of monthly climatological data for river flow can explain most of these errors, mainly in those stations closer to the river’s mouth (Vagueira and Rio Novo). Nevertheless, the difficulty in predicting salinity values in Mira channel (Vagueira), was recognized before by [13], who suggested that some unknown freshwater fonts in Mira Channel exist and are not being considered in modelling efforts. In fact, as aquifer effects in the lagoon are not documented, some sensitivity tests and analysis of satellite images done by other authors hypothesized that local agricultural discharge channels may be the freshwater source justifying the discrepancies found. However, this assumption is impossible to prove in this study and further investigation is needed to demonstrate its impacts on the Mira channel. Despite that, the relative errors obtained for salinity values are in the same order of magnitude as those obtained by [36] for Ria de Aveiro.
As the RMSE and skill values for both water level and salinity are in line with those observed in previous model validations for Ria de Aveiro [17,36,37,38,39] and for other estuaries [40,41,42,43,44], it can be considered that the model reproduces adequately the tidal propagation and salinity patterns in this lagoon for both model configurations developed.

5.2. Effects of Morphologic Changes on Tidal and Salinity Patterns

Both the analysis of in-situ data and numerical simulations revealed that the tidal action and salinity intrusion increased within the lagoon between 1987 and 2020. The numerical experiments performed showed results in agreement with the observations and allow to suppose that these changes are induced by the morphologic evolution of the lagoon. In fact, both the inlet and the main channels of the Ria de Aveiro are deeper today compared to 1987, due to several factors. Firstly, the effects of human intervention in this system must be considered, namely through frequent dredging operations carried out over the last few decades in the inlet, to facilitate the access of larger draft vessels to the Aveiro Port. A further noteworthy point is the general dredging of the main channels of the lagoon carried out in the late 1990s, which resulted in the significant deepening of these channels. Secondly, the natural evolution of the lagoon must be considered, which, according to the results obtained for the tidal asymmetry, presents a tendency of silting at the heads of the main channels, and of erosion in the lower lagoon. Results show that this trend has been accentuated over the last few decades, resulting in the long-term transport of sediments to the adjacent ocean, and consequently in the natural deepening of the inlet and of the main channels of the lower lagoon.
The changes found for the tidal characteristics are amplified toward the channel’s heads, with the highest modifications being observed in S.Jacinto channel. This means that the tidal wave propagates faster and dissipates less energy in its path nowadays than before, as the channels have a higher depth and therefore lower bottom stress (the bottom stress reduction induces the faster tidal wave propagation and decreases the energy dissipation that conducts to higher wave amplitudes). Salinity values increased in the entire lagoon, with the highest changes observed at the end of the channels. The saline intrusion now extends further inland than before, reflecting the tidal influence expansion towards the upper lagoon, which results from the increase in the tidal prism induced by the tidal amplitude amplification (around 60%, in agreement with [3]) and enlargement of the lagoon flooded area [10,11,45].
In detail, numerical results evidenced that the hydrodynamics changes found are strictly dependent on morphological modifications of the lagoon, as differences between the two periods simulated fully agree with observations. Indeed, the general deepening of the lagoon that occurred between 1987 and 2020 induces the amplification of the tidal amplitude in the entire lagoon and the decrease of the phase lag. This evidence is corroborated by previous works: [16] found an average increase of M2 amplitude in Ria de Aveiro by 0.245 m and a decrease of 17.4° in its phase and explained that changes with the deepening of the lagoon that occurred between 1987/88 and 2002/2003.
The results also showed that the deepening of the inlet observed between 1987 and 2020 only partially induces the tidal and salinity modifications observed in the recent decades. Indeed, [10] showed that the deepening of the inlet increased the M2 amplitude and decreased its phase delay along the main lagoon channels. However, the modifications induced by the inlet deepening do not reflect the magnitude and the pattern of the tidal and salinity modifications observed in the last decades. Indeed, the changes observed for M2 constituent due to the deepening of the inlet (Scenario 1) are almost negligible comparing to those observed between 1987 and 2020, both in in-situ data and in model results. In that scope, the impact of the deepening of the main channels was also studied (Scenario 2). The results showed that the morphologic modifications in the main channels resulted in an increase in the tidal amplitude and a decrease in the phase lag, as well as an increase in the mean salinity values. The changes are amplified towards the end of the channels, in a pattern similar to that described for 1987 and 2020 scenarios, both for in-situ data and model results. Consequently, it can be concluded that, although the modifications in the inlet impact the lagoon’s hydrodynamics, the changes observed from 1987 until the present in tidal propagation and mean salinity values are mainly due to the deepening of the main channels of the lagoon. Therefore, the local authorities and stakeholders should bear this fact in mind when designing measures to define the uses of the lagoon and its management.
It should be noted that the hydrodynamic changes that have been occurring in the Ria de Aveiro had a strong impact on the usual uses of this lagoon system, and consequently on its economic exploitation. In fact, the increase in tidal amplitude has several direct and indirect effects that must be discussed. Firstly, they lead to an increase in high tide level and a decrease in low tide level, especially at the upper lagoon, which leads to an increase in marginal floods in areas of lower topography (in the first case), and to a decrease in the water column height available for the navigation in the shallowest channels, in the second case. This situation results in great difficulties for navigation by local fishermen and recreational boating for several hours of each tidal cycle, which leads to frequent complaints about the silting up of the lagoon and demands to the competent authorities for carrying out further dredging operations. However, it should be emphasized that the results of this work demonstrate that new dredging operations will lead to a further increase in the tidal amplitude, and consequently to the aggravation of this and other problems.
It should also be noted that the increase in tidal amplitude leads to an increase in tidal asymmetry, tidal currents, tidal prism, and saline intrusion. Similar effects were reported in Venice (Italy) [6] and Óbidos (Portugal) [7] lagoons, and Seine (France) [9] and Ems estuaries [4,5]. The lower lagoon reveals a natural trend for the export of sediments to the adjacent ocean, which has been intensified over the last few decades, resulting in an acceleration of the natural deepening of these areas. In this case, there is a natural feedback process, since the increase in the depths of the channels in this zone induces changes in the hydrodynamics of the lagoon, which in turn increases the depth of the channels noticeably. Tidal currents of greater amplitude also reinforce the processes of erosion and transport of sediments within the lagoon, in addition to conditioning navigation. In fact, the walls that protect salt pans in the Ria de Aveiro have been undergoing accelerated destruction due to the higher tidal currents, which in turn change the lagoon geomorphology and consequently the hydrodynamics processes, in another feedback process. In addition, several benthic species have also been suffering the effects of the higher tidal currents, presenting difficulties in fixing at the bottom of the channels and, as such, have declined in the lagoon, with the consequent loss of ecological value [46,47]. Finally, the progression of saline intrusion also has several negative effects in the Ria de Aveiro. On the one hand, it can affect the survival and distribution of several species dependent on fresh or brackish water, whose habitat is being reduced and increasingly moved upstream [35]. This was also observed by [48] when studying the influence of salinity on seagrass in Biscayne Bay (Florida). On the other hand, and in conjunction with the growth of the tidal amplitude, the increasingly frequent marginal flooding in the upper lagoon [17,18,49] implies the submerging of agricultural fields by increasingly salty water, which destroys crops and disables the productive capacity of land previously very fertile.

5.3. Recommendations

To mitigate the negative effects of the tidal amplitude and currents amplification, and consequently of the increase in saline intrusion and in the frequency and area affected by marginal floods, the first recommendation to follow is to identify the most vulnerable regions by carrying out environmental impact studies. Subsequently, the design and construction of artificial structures that can control the exchange with the sea or protect the most threatened areas are suggested.
In this context, it is recommended to assess the effects of the construction of barriers that control the interchange with the sea and therefore will reduce the tidal amplitude and currents intensity, or of dikes and adherent longitudinal structures that prevent marginal flooding by increasingly salty water. The Maeslant barrier in Rhine River, the Thames Barrier, and the mobile gates installed in the Venice Lagoon are three examples of engineering works that could be investigated to evaluate their effectiveness in reducing the effects of the changes in tidal amplitude and currents registered in Ria de Aveiro. Moreover, in this lagoon some previous works were already done to determine the area’s most vulnerable to marginal flooding and salinity contamination, even in a future climate change context [18,49], being identified as the upstream regions of Espinheiro and S.Jacinto channels, and the areas marginal to Mira Channel. To protect these regions some works were already done and should be used as examples to follow. In the 1980s, a dike was projected to prevent the salinization of agricultural fields upstream regions of Espinheiro. However, only the central part of the dike was built, but the projected effect appears to have been achieved and there is no evidence of dike breach or overtopping. As the adjacent unprotected areas still report the occurrence of saltwater intrusion, it is recommended to conclude the dike extension northward and southward, in order to protect these regions. Moreover, the access road to agricultural fields parallel to the Mira channel was also raised a few years ago to protect this area from marginal flooding, and more recently adherent longitudinal structures have been built at the upstream regions of S.Jacinto channel for the same purpose. These are good examples of possible measures that can be followed to reduce the effects of the registered changes in Ria de Aveiro.

6. Conclusions

This study aimed to review the evolution of Ria de Aveiro lagoon hydrodynamics during the last 30 years, assessing tidal and salinity changes induced by morphological modifications that occurred between 1987 and 2020, and investigating the main causes of those changes. For this was used a remarkable database including bathymetric data of the entire lagoon and in-situ water level and salinity retrieved from several stations, as well as data generated from a set of numerical experiments.
The necessary model validation of the configurations developed for 1987 and 2020 bathymetries was performed comparing the model results and observed water level and salinity values. Results highlighted the adequate reproduction of tidal propagation and salinity patterns within the lagoon, demonstrating an excellent model performance for the aims of this study.
Once validated, the model was used to characterize the lagoon hydrodynamics and study the tidal modifications induced by morphological changes that occurred between 1987 and 2020, with a focus on those induced firstly by the deepening of the inlet and secondly by the deepening of the main channels. The results regarding the characterization of the lagoon showed that:
  • The tidal amplitude decreases with the distance from the inlet and the phase lag increases, revealing that the tide in the lagoon behaves as a damped progressive wave;
  • The tidal velocity is strongly dependent on the lagoon morphology, with maximum values found at the inlet and main channels, and minimum values at the shallowest regions and intertidal areas;
  • The tidal asymmetry revealed that the upper lagoon is flood dominated, while the lower lagoon is ebb dominated;
  • Salinity distribution is strongly dependent on the balance between freshwater input from the main tributaries and saltwater intrusion through the inlet, presenting typical longitudinal estuarine gradients.
Regarding the modifications induced by morphological changes that occurred between 1987 and 2020, the main results revealed:
  • A general increase/decrease in tidal amplitude/phase with the differences being amplified towards the end of the channels.
  • The tidal velocity, tidal asymmetry and tidal prism have also increased as well as the salinity intrusion.
The hydrodynamics-salinity changes found in this tidally dominated lagoon are mainly due to the impact of man-made activities on lagoon morphodynamics, namely through dredging operations carried out along the main channels of the lagoon during the last decades, which resulted in a general deepening of the lagoon. Moreover, this study allowed a more detailed analysis, which revealed that although the deepening of the inlet area partially explains the results found, the deepening of the lagoon main channels was the main responsible for the changes that occurred in the Ria de Aveiro in the last 30 years.
Consequently, this research provides the basis to understand the main impacts of morphological changes in Ria de Aveiro, considering the direct influence of dredging operations performed at the inlet region and at the main lagoon channels, and, therefore, to help decision-makers on evaluating the consequences of future dredging scenarios.

Author Contributions

Conceptualization, J.M.D., A.P., and C.L.L.; methodology, J.M.D., F.P., A.P., C.L.L., S.M.L., and P.G.P.; software, F.P., A.P., C.L.L., and J.P.P.; validation, F.P.; formal analysis, J.M.D., F.P., A.P., and C.L.L.; investigation, J.M.D., F.P., A.P., and C.L.L.; resources, J.M.D. and P.G.P.; data curation, J.M.D., F.P., A.P., C.L.L., J.P.P., S.M.L., and P.G.P.; writing—original draft preparation, F.P., A.P., and C.L.L.; writing—review and editing, J.M.D. and J.P.P.; visualization, J.M.D., F.P., A.P., C.L.L., and J.P.P.; supervision, J.M.D.; project administration, J.M.D.; funding acquisition, J.M.D. and P.G.P. All authors have read and agreed to the published version of the manuscript.

Funding

Thanks are due to FCT/MCTES for the financial support to CESAM (UIDP/50017/2020+UIDB/50017/2020), through national funds. CL Lopes was also funded by national funds through the FCT—Foundation for Science and Technology, I.P., under the project CEECIND/00459/2018. JP Pinheiro benefits from a PhD Grant (SFRH/BD/146153/2019) given by FCT—Foundation for Science and Technology, I.P. This work was partially funded under the projects RaMP (FA_06_2017_077) and SisMAR (FA_04_2017_009) financed by Programme—Fundo Azul of Direção Geral da Política do Mar (DGPM).

Acknowledgments

The authors would like to thank Hydrographic Institute of the Portuguese Navy (HIPV) for providing water level and bathymetric data, Aveiro Port Administration (APA) for providing topo-bathymetric and water level data, Polis Litoral Ria de Aveiro, S.A (PLRA) for providing topo-bathymetric, water level and salinity data and Directorate-General for Territory for providing topographic data.

Conflicts of Interest

The authors declare no conflict of interest. The funders had no role in the design of the study; in the collection, analyses, or interpretation of data; in the writing of the manuscript, or in the decision to publish the results

References

  1. Kjerfve, B. Chapter 1 Coastal Lagoons. In Elsevier Oceanography Series; Kjerfve, B., Ed.; Coastal Lagoon Processes; Elsevier: Amsterdam, The Netherlands, 1994; Volume 60, pp. 1–8. [Google Scholar]
  2. Vaz, N.; Dias, J.M.; Leitão, P.; Martins, I. Horizontal Patterns of Water Temperature and Salinity in an Estuarine Tidal Channel: Ria de Aveiro. Ocean Dyn. 2005, 55, 416–429. [Google Scholar] [CrossRef] [Green Version]
  3. Lopes, C.L.; Plecha, S.; Silva, P.A.; Dias, J.M. Influence of Morphological Changes in a Lagoon Flooding Extension: Case Study of Ria de Aveiro (Portugal). J. Coast. Res. 2013, 165, 1158–1163. [Google Scholar] [CrossRef]
  4. De Jonge, V.N.; Schuttelaars, H.M.; van Beusekom, J.E.E.; Talke, S.A.; de Swart, H.E. The Influence of Channel Deepening on Estuarine Turbidity Levels and Dynamics, as Exemplified by the Ems Estuary. Estuar. Coast. Shelf Sci. 2014, 139, 46–59. [Google Scholar] [CrossRef]
  5. Van Maren, D.S.; van Kessel, T.; Cronin, K.; Sittoni, L. The Impact of Channel Deepening and Dredging on Estuarine Sediment Concentration. Cont. Shelf Res. 2015, 95, 1–14. [Google Scholar] [CrossRef] [Green Version]
  6. Ferrarin, C.; Tomasin, A.; Bajo, M.; Petrizzo, A.; Umgiesser, G. Tidal Changes in a Heavily Modified Coastal Wetland. Cont. Shelf Res. 2015, 101, 22–33. [Google Scholar] [CrossRef]
  7. Oliveira, A.; Fortunato, A.B.; Rego, J.R.L. Effect of Morphological Changes on the Hydrodynamics and Flushing Properties of the Óbidos Lagoon (Portugal). Cont. Shelf Res. 2006, 26, 917–942. [Google Scholar] [CrossRef]
  8. Ralston, D.K.; Talke, S.; Geyer, W.R.; Al-Zubaidi, H.A.M.; Sommerfield, C.K. Bigger Tides, Less Flooding: Effects of Dredging on Barotropic Dynamics in a Highly Modified Estuary. J. Geophys. Res. Ocean. 2019, 124, 196–211. [Google Scholar] [CrossRef] [Green Version]
  9. Grasso, F.; Le Hir, P. Influence of Morphological Changes on Suspended Sediment Dynamics in a Macrotidal Estuary: Diachronic Analysis in the Seine Estuary (France) from 1960 to 2010. Ocean Dyn. 2019, 69, 83–100. [Google Scholar] [CrossRef] [Green Version]
  10. Dias, J.M.; Picado, A. Impact of Morphologic Anthropogenic and Natural Changes in Estuarine Tidal Dynamics. J. Coast. Res. 2011, SI64, 1490–1494. [Google Scholar]
  11. Picado, A.; Dias, J.M.; Fortunato, A.B. Tidal Changes in Estuarine Systems Induced by Local Geomorphologic Modifications. Cont. Shelf Res. 2010, 30, 1854–1864. [Google Scholar] [CrossRef] [Green Version]
  12. Duck, R.W.; da Silva, J.F. Coastal Lagoons and Their Evolution: A Hydromorphological Perspective. Estuar. Coast. Shelf Sci. 2012, 110, 2–14. [Google Scholar] [CrossRef]
  13. Dias, J.M. Contribution to the Study of the Ria de Aveiro Hydrodynamics. Ph.D. Thesis, Universidade de Aveiro, Aveiro, Portugal, 2001. [Google Scholar]
  14. Da Silva, J.F.; Duck, R.W. Historical Changes of Bottom Topography and Tidal Amplitude in the Ria de Aveiro, Portugal: Trends for Future Evolution. Clim. Res. 2001, 18, 17–24. [Google Scholar] [CrossRef] [Green Version]
  15. Dias, J.M.; Lopes, J.F.; Dekeyser, I. Tidal Propagation in Ria de Aveiro Lagoon, Portugal. Phys. Chem. Earth B 2000, 25, 369–374. [Google Scholar] [CrossRef]
  16. Araújo, I.B.; Dias, J.M.; Pugh, D.T. Model Simulations of Tidal Changes in a Coastal Lagoon, the Ria de Aveiro (Portugal). Cont. Shelf Res. 2008, 28, 1010–1025. [Google Scholar] [CrossRef]
  17. Lopes, C.L.; Dias, J.M. Tidal Dynamics in a Changing Lagoon: Flooding or Not Flooding the Marginal Regions. Estuar. Coast. Shelf Sci. 2015, 167, 14–24. [Google Scholar] [CrossRef]
  18. Lopes, C.L.; Alves, F.L.; Dias, J.M. Flood Risk Assessment in a Coastal Lagoon under Present and Future Scenarios: Ria de Aveiro Case Study. Nat. Hazards 2017, 89, 1307–1325. [Google Scholar] [CrossRef]
  19. Dias, J.M.; Lopes, J.; Dekeyser, I. Hydrological Characterisation of Ria de Aveiro, Portugal, in Early Summer. Oceanol. Acta 1999, 22, 473–485. [Google Scholar] [CrossRef] [Green Version]
  20. Vaz, N.; Miguel Dias, J.; Chambel Leitão, P. Three-Dimensional Modelling of a Tidal Channel: The Espinheiro Channel (Portugal). Cont. Shelf Res. 2009, 29, 29–41. [Google Scholar] [CrossRef]
  21. Cavalinhos, R.; Correia, R.; Rosa, P.; Lillebo, A.I.; Pinheiro, L.M. Processed Multibeam Bathymetry Data Collected around the Ria de Aveiro, Portugal, Onboard the NEREIDE Research Vessel [Data set]. Zenodo 2020. [Google Scholar] [CrossRef]
  22. Vaz, N. Study of Heat and Salt Transport Processes in the Espinheiro Channel (Ria de Aveiro). Ph.D. Thesis, Universidade de Aveiro, Aveiro, Portugal, 2007. [Google Scholar]
  23. Vaz, N.; Dias, J.M. Hydrographic Characterization of an Estuarine Tidal Channel. J. Mar. Syst. 2008, 70, 168–181. [Google Scholar] [CrossRef]
  24. Pawlowicz, R.; Beardsley, B.; Lentz, S. Classical Tidal Harmonic Analysis Including Error Estimates in MATLAB Using T_TIDE. Comput. Geosci. 2002, 28, 929–937. [Google Scholar] [CrossRef]
  25. Aubrey, D.G.; Speer, P.E. A Study of Non-Linear Tidal Propagation in Shallow Inlet/Estuarine Systems Part I: Observations. Estuar. Coast. Shelf Sci. 1985, 21, 185–205. [Google Scholar] [CrossRef]
  26. Grunnet, N.; Walstra, D.-J.; Ruessink, G. Process-Based Modelling of a Shoreface Nourishment. Coast. Eng. 2004, 51, 581–607. [Google Scholar] [CrossRef]
  27. Lencart e Silva, J.D.; Azevedo, A.; Lillebø, A.I.; Dias, J.M. Turbidity under Changing Physical Forcing over Two Contrasting Locations of Seagrass Meadows. J. Coast. Res. 2013, 165, 2023–2028. [Google Scholar] [CrossRef]
  28. Copernicus. Available online: https://marine.copernicus.eu/ (accessed on 29 November 2020).
  29. ECMWF. Available online: https://www.ecmwf.int/ (accessed on 29 November 2020).
  30. Stefanova, A.; Krysanova, V.; Hesse, C.; Lillebø, A.I. Climate Change Impact Assessment on Water Inflow to a Coastal Lagoon: The Ria de Aveiro Watershed, Portugal. Hydrol. Sci. J. 2015, 60, 929–948. [Google Scholar] [CrossRef]
  31. Rijn, L.; Walstra, D.-J.; Ormondt, M. Unified View of Sediment Transport by Currents and Waves. IV: Application of Morphodynamic Model. J. Hydraul. Eng. 2007, 133. [Google Scholar] [CrossRef]
  32. Warner, J.C.; Geyer, W.R.; Lerczak, J.A. Numerical Modeling of an Estuary: A Comprehensive Skill Assessment. J. Geophys. Res. Ocean. 2005, 110. [Google Scholar] [CrossRef]
  33. Plecha, S. Contribution to the Study of the Ria de Aveiro Inlet Morphodynamics. Ph.D. Thesis, Universidade de Aveiro, Aveiro, Portugal, 2011. [Google Scholar]
  34. Plecha, S.; Silva, P.A.; Oliveira, A.; Dias, J.M. Establishing the Wave Climate Influence on the Morphodynamics of a Coastal Lagoon Inlet. Ocean Dyn. 2012, 62, 799–814. [Google Scholar] [CrossRef]
  35. Dias, J.M. Dinâmica de maré na Ria de Aveiro. In Quintas da Ria-Contributos Sobre a Proteção, Valorização e Gestão da Ria de Aveiro; Fidélis, T., Martins, F.C., Teles, F., Coelho, C., Fonseca, C., Albino, C., Pereira, E., Queiroga, H., Dias, J.M., Pinheiro, L.M., et al., Eds.; Universidade de Aveiro: Aveiro, Portugal, 2016; pp. 59–77. ISBN 978-972-789-492-5. [Google Scholar]
  36. Vargas, C.I.C.; Vaz, N.; Dias, J.M. An Evaluation of Climate Change Effects in Estuarine Salinity Patterns: Application to Ria de Aveiro Shallow Water System. Estuar. Coast. Shelf Sci. 2017, 189, 33–45. [Google Scholar] [CrossRef]
  37. Dias, J.M.; Lopes, J.F. Implementation and Assessment of Hydrodynamic, Salt and Heat Transport Models: The Case of Ria de Aveiro Lagoon (Portugal). Environ. Model. Softw. 2006, 21, 1–15. [Google Scholar] [CrossRef]
  38. Lopes, C.L.; Azevedo, A.; Dias, J.M. Flooding Assessment under Sea Level Rise Scenarios: Ria de Aveiro Case Study. J. Coast. Res. 2013, 65, 766–771. [Google Scholar] [CrossRef]
  39. Pinheiro, J.P.; Lopes, C.L.; Ribeiro, A.S.; Sousa, M.C.; Dias, J.M. Tide-Surge Interaction in Ria de Aveiro Lagoon and Its Influence in Local Inundation Patterns. Cont. Shelf Res. 2020, 200, 104132. [Google Scholar] [CrossRef]
  40. Dias, J.M.; Sousa, M.C.; Bertin, X.; Fortunato, A.B.; Oliveira, A. Numerical Modeling of the Impact of the Ancão Inlet Relocation (Ria Formosa, Portugal). Environ. Model. Softw. 2009, 24, 711–725. [Google Scholar] [CrossRef]
  41. Dias, J.M.; Valentim, J.M.; Sousa, M.C. A Numerical Study of Local Variations in Tidal Regime of Tagus Estuary, Portugal. PLoS ONE 2013, 8, e80450. [Google Scholar] [CrossRef] [PubMed]
  42. Calero Quesada, M.C.; García-Lafuente, J.; Garel, E.; Delgado Cabello, J.; Martins, F.; Moreno-Navas, J. Effects of Tidal and River Discharge Forcings on Tidal Propagation along the Guadiana Estuary. J. Sea Res. 2019, 146, 1–13. [Google Scholar] [CrossRef]
  43. Liu, W.-C.; Ke, M.-H.; Liu, H.-M. Response of Salt Transport and Residence Time to Geomorphologic Changes in an Estuarine System. Water 2020, 12, 1091. [Google Scholar] [CrossRef]
  44. António, M.H.P.; Fernandes, E.H.; Muelbert, J.H. Impact of Jetty Configuration Changes on the Hydrodynamics of the Subtropical Patos Lagoon Estuary, Brazil. Water 2020, 12, 3197. [Google Scholar] [CrossRef]
  45. Picado, A.; Dias, J.; Fortunato, A. Effect of Flooding the Salt Pans in the Ria de Aveiro. J. Coast. Res. 2009, SI56, 1395–1399. [Google Scholar]
  46. Azevedo, A.; Dias, J.M.; Lillebø, A.I. Thriving of Zostera Noltei under Intertidal Conditions: Implications for the Modelling of Seagrass Populations. Mar. Biol. 2016, 163, 114. [Google Scholar] [CrossRef]
  47. Azevedo, A.; Lillebø, A.I.; Lencart e Silva, J.; Dias, J.M. Intertidal Seagrass Models: Insights towards the Development and Implementation of a Desiccation Module. Ecol. Model. 2017, 354, 20–25. [Google Scholar] [CrossRef]
  48. Lirman, D.; Cropper, W.P. The Influence of Salinity on Seagrass Growth, Survivorship, and Distribution within Biscayne Bay, Florida: Field, Experimental, and Modeling Studies. Estuaries 2003, 26, 131–141. [Google Scholar] [CrossRef]
  49. Lopes, C.L.; Dias, J.M. Assessment of Flood Hazard during Extreme Sea Levels in a Tidally Dominated Lagoon. Nat. Hazards 2015, 77, 1345–1364. [Google Scholar] [CrossRef]
Figure 1. Location of Ria de Aveiro (a) and its bathymetry in 2020 (b), showing the location of the main channels and tributaries. The marks represent the location of the tide gauge (red and green) and salinity stations (green). Zoom of the inlet region showing the location of cross-sections where tidal prism was evaluated (c).
Jmse 09 00234 g001
Figure 2. Difference between 2020 and 1987 bathymetries.
Jmse 09 00234 g002
Figure 3. Temporal evolution of M2 amplitude (left) and phase (right) throughout the lagoon entrance (a,b), S.Jacinto channel (c,d), Mira channel (e,f), Ílhavo channel (g,h) and Espinheiro channel (i,j).
Jmse 09 00234 g003
Figure 4. Temporal evolution of amplitude ratio (left) and relative phase (right) throughout the lagoon entrance (a,b), S.Jacinto channel (c,d), Mira channel (e,f), Ílhavo channel (g,h) and Espinheiro channel (i,j). The dashed line represents the transition between ebb/flood dominance.
Jmse 09 00234 g004
Figure 5. M2 constituent amplitude (a,b) and phase (c,d) for 1987 (left) and 2020 (right) bathymetries.
Jmse 09 00234 g005
Figure 6. Amplitude ratio (Ar) (a,b) and relative phase (φ) (c,d) for 1987 (left) and 2020 (right) bathymetries.
Jmse 09 00234 g006
Figure 7. VRMS for 1987 (a) and 2020 (b) bathymetries.
Jmse 09 00234 g007
Figure 8. Annual mean salinity for 1987 (a) and 2020 (b) bathymetries.
Jmse 09 00234 g008
Figure 9. M2 amplitude and phase differences between 1987 and 2020 (a,d), 1987 and Scenario 1 (b,e), and 1987 and Scenario 2 (c,f).
Jmse 09 00234 g009
Figure 10. Amplitude ratio differences between 1987 and 2020 (a), 1987 and Scenario 1 (b) and 1987 and Scenario 2 (c). Relative phase variations between 1987 and 2020 (d), 1987 and Scenario 1 (e), and 1987 and Scenario 2 (f).
Jmse 09 00234 g010
Figure 11. VRMS differences between 1987 and 2020 (a), 1987 and Scenario 1 (b), and 1987 and Scenario 2 (c).
Jmse 09 00234 g011
Figure 12. Tidal prisms at five cross-sections of Ria de Aveiro (Figure 1), at maximum spring tide (a) and minimum neap tide (b) for each model configuration.
Jmse 09 00234 g012
Figure 13. Annual mean salinity difference between 1987 and 2020 (a), 1987 and Scenario 1 (b) and 1987 and Scenario 2 (c).
Jmse 09 00234 g013
Table 1. Details of tide gauge stations.
DomainStation1987/882002/032012/172019/20
Lagoon EntranceBA—Barra 101/01/198701/01/200201/04/201201/06/2019
31/12/198831/12/200231/03/201731/08/2020
SJ—São Jacinto23/06/198711/12/2003 09/01/2004--
04/08/1987
CN—Costa Nova 125/05/198721/11/2002 20/02/200301/01/2013 31/12/2013-
28/06/1987
CI—Cires11/08/198707/08/2003--
17/09/198708/09/2003
S.Jacinto ChannelT—Torreira 123/06/1987 04/08/198709/01/2004-01/06/2019
09/04/200431/08/2020
V—Varela 116/06/1987 06/08/1987-01/04/2012-
31/03/2017
C—Carregal 108/10/1987 13/11/198727/08/2002 18/10/2002-01/06/2019 31/08/2020
PU—Puxadouro 114/10/1987 25/11/198726/08/2002 18/10/2002-01/06/2019
31/08/2020
PA—Pardilhó13/10/1987 25/11/198726/08/2002 18/10/2002--
M—Manchão13/10/1987 25/11/198727/08/2002 18/10/2002--
Mira ChannelVG—Vagueira 128/04/1987 10/06/198721/11/200201/04/201201/06/2019
20/02/200331/03/201731/08/2020
A—Areão 1-22/11/2002-01/06/2019
29/12/200231/08/2020
Ílhavo ChannelP2—Ponte Cais 228/09/198807/08/2003--
10/11/198804/09/2003
L—Lota23/03/198706/03/2003--
17/05/198709/04/2003
VA—Vista Alegre 126/09/198809/09/200301/04/201201/06/2019
08/11/198809/12/200331/03/201731/08/2020
CP—Cais da Pedra28/09/198810/09/2003-01/06/2019
10/11/198810/10/200331/08/2020
Espinheiro ChannelCB—Cais do Bico 126/08/198712/06/200301/04/201201/06/2019
10/12/198714/07/200331/03/201731/08/2020
RN—Rio Novo 101/02/198808/03/200301/04/201201/06/2019
14/04/198809/04/200331/03/201731/08/2020
CA—Cacia11/02/198806/03/2003
14/04/198809/04/2003
1 Stations used for model validation.
Table 2. Details of salinity records.
DomainStation19972012/17
Lagoon EntranceBA—Barra03/06/199701/02/2013
22/06/199731/08/2014
CN—Costa Nova20/06/199701/01/2013
31/12/2013
S.Jacinto ChannelV—Varela19/06/199701/04/2012
31/03/2017
Mira ChannelVG—Vagueira22/06/199701/04/2012
31/03/2017
Ílhavo ChannelVA—Vista Alegre10/06/199701/04/2012
31/03/2017
Espinheiro ChannelCB—Cais do Bico-01/04/2012
31/03/2017
RN—Rio Novo-01/04/2012
31/03/2017
Table 3. Description of the bathymetric configurations.
YearDescription
1987Survey by HIPV
2020Set of surveys from 1987/88 by IHPV, 2011 PLRA, 2020 APA and UA [21]
Scenario 11987/88 bathymetry updated with 2020 inlet
Scenario 22020 bathymetry with 1987/88 inlet
Table 4. Mean and maximum salinity values and the respective temporal variation (dMean, dMax).
StationPeriodMeandMeanMax.dMax
Barra199733.60+1.3336.14−0.43
2012/201734.9335.71
Vagueira199716.60+1.1027.90+3.70
2012/201717.7031.57
Vista Alegre199715.85+12.0026.57+6.82
2012/1727.8533.52
Varela199721.94+4.6026.30+5.67
2012/1726.5431.97
Table 5. Root mean square error (RMSE) (m), skill, and estimated normalized root mean square Error (NRMSE) (%) for water level time series.
Stations1987/19882013/2016/2019
RMSE (m)SkillNRMSE (%) RMSE (m)SkillNRMSE (%)
Barra0.080.99650.050.9992
Costa Nova0.070.99740.100.9954
São Jacinto0.070.9974
Cires0.140.9897
Ponte Cais 20.150.982
Lota0.180.97211
Vagueira0.150.942140.070.9964
Vista Alegre0.170.946160.220.96213
Rio Novo0.200.955140.170.9858
Cais do Bico0.140.970120.180.9839
Cacia0.150.97212
Torreira0.110.966110.100.9935
Varela0.120.915160.130.9877
Manchão0.110.87325
Pardilhó0.140.87522
Puxadouro0.140.853230.190.96213
Carregal0.160.820230.190.9789
Cais da Pedra0.170.940170.250.93217
Areão 0.220.92115
Table 6. RMSE, skill, and estimated NRMSE (%) values for salinity time series.
StationsRMSESkillNRMSE (%)
Barra1.620.8045
Costa Nova4.510.87518
Vagueira4.340.90943
Vista Alegre2.160.9258
Varela1.710.7876
Cais do Bico3.020.68810
Rio Novo5.700.89041
Publisher’s Note: MDPI stays neutral with regard to jurisdictional claims in published maps and institutional affiliations.

