
Threat Posed by Future Sea-Level Rise to Freshwater Resources in the Upper Pearl River Estuary

1
School of Civil and Transportation Engineering, South China University of Technology, Wushan Rd., Tianhe District, Guangzhou 510641, China
2
Southern Laboratory of Ocean Science and Engineering (Guangdong, Zhuhai), Zhuhai 519000, China
*
Author to whom correspondence should be addressed.
J. Mar. Sci. Eng. 2021, 9(3), 291; https://0-doi-org.brum.beds.ac.uk/10.3390/jmse9030291
Submission received: 12 February 2021
/
Revised: 28 February 2021
/
Accepted: 2 March 2021
/
Published: 6 March 2021
(This article belongs to the Section Coastal Engineering)
Abstract
:The degradation of densely populated river delta environments due to the accelerating rise in sea level can affect the availability of freshwater for municipal supplies, irrigation, and industrial use. A fully calibrated three-dimensional numerical model is used in this study to evaluate the threat posed by the sea-level rise, which predicted to occur by 2100, to freshwater resources in the upper tributaries of Pearl River Estuary. The results indicate that both the intensity and duration of dry-season saltwater intrusion greatly increase as the sea level rises, making the water at drinking-water intake stations for the four waterworks no longer suitable for municipal supply. Flow modulation is performed to identify the threshold at which saltwater intrusion could be effectively suppressed in response to both sea-level rise and dry season hydrodynamics. The number of days for which water meets the drinking-water standard decreases as the sea level rises, but increases with increased river flow. The combined effect of future drought and sea-level rise would further limit the availability of freshwater in the upper tributaries. Stronger upstream salinity transport during flood tide are found in the sea-level rise case. The increased flood tidal salinity transport would have great impact on the tidal freshwater wetlands.
1. Introduction
The threat of future sea-level rise to coastal areas has drawn much attention worldwide. With climate change, the sea level is rising continuously at an accelerating rate. The global sea-level rise is reported to have occurred at an average rate of 1.7 mm/yr during the 20th century and is currently 3.2 mm/yr [1,2,3]. The Intergovernmental Panel on Climate Change (IPCC) Fifth Assessment Report suggested that the global mean sea-level rise could be in the range of 63–98 cm by the year 2100 [4]. However, due to the uncertainties associated with the contribution of ice melt, it is possible that this rate is severely underestimated [5]. A large proportion of the population lives in coastal zones with low elevation that are particularly at risk from the hazards of sea-level rise. Especially in river delta areas, sea-level rise can result in severe saltwater intrusion that brings saline water to points where freshwater had previously existed [6,7,8,9,10,11]. The freshwater resources in the upper reaches of estuaries are therefore vulnerable. Such saline water migration not only causes shifts in salt-sensitive habitats but also affects freshwater availability for municipal supplies, irrigation, and industrial use. Surrounded by megalopolises, the degradation of river delta environments due to sea-level rise could result in enormous economic and social losses. The study of the impact of sea-level rise on upstream freshwater resources is of high priority to enable evaluation of the future sea-level rise hazards under the background of climate change.
Previous studies have indicated that sea-level rise could cause saline water to migrate farther upstream. Using a numerical model, Langevin and Zygnerski [12] found that sea-level rise would cause saltwater intrusion in southeast Florida and the local salinity would significantly exceed drinking-water standards. In the Weser Estuary (Germany), a sea-level rise of 55 cm would lead to a 2-km upstream shift of the brackish water zone [13]. In the Gorai River network (Bangladesh), a sea-level rise of 59 cm could increase salinity by 0.9 ppt at a point 80 km upstream from the river mouth [14]. A numerical model study of salinity change due to sea-level rise in the James River showed that salinity would intrude approximately 10 km farther upstream for a sea-level rise of 1.0 m [11]. At the drinking-water intake station in the upper tributary of the James River, the number of days with salinity greater than 0.1 ppt would increase with increasing sea level and would exceed 0.1 ppt for more than 100 days during the dry season with a sea-level rise of 30 cm. Elsewhere, a sea-level rise of 105 cm would cause the salinity profile to shift 1.2 km upstream in the Tamsui River estuarine system in Taiwan [15].
Sea-level rise also increases the salinity in estuaries. With a sea-level rise of 85 cm, Xiao et al. [16] found that salinity in the mid-estuary of the St. Mark River Estuary would increase by 5.6 ppt in surface water and by 3.8 ppt in bottom water. According to Najjar et al. [17], a sea-level rise of 70–160 cm by the year 2100 would increase salinity by 1.4–3.2 ppt in Chesapeake Bay. Based on a model simulation in Chesapeake Bay, Hilton et al. [18] found a bay-averaged salinity increase of approximately 0.5 ppt for a sea-level rise of 20 cm. Hong and Shen [8] reported that the average salinity, salt intrusion distance, and stratification in Chesapeake Bay show obvious increases in response to sea-level rise and these increases have seasonal variations. The results of a study in the Changjiang (Yangtze) River Estuary indicated that sea-level rise would cause nonlinear upstream isohaline shifts, and a shift in the 0.45-ppt isohaline would be much greater than those of the 1-ppt, 2-ppt, and 5-ppt isohalines with the same magnitude of sea-level rise [19].
Even at the current mean sea level, freshwater contamination by saltwater intrusion occurs frequently during the winter dry season in the Pearl River Estuary (PRE) (e.g., [20,21,22,23]). The discharge of the Pearl River has obvious seasonal variation, reaching a maximum in summer (~2.1 × 10⁴ m3/s) and a minimum in winter (~3.4 × 10³ m3/s) [24]. The hydrodynamic conditions during the winter dry season (November to February) facilitate saltwater intrusion to the upstream of the PRE. For example, a serious saltwater intrusion lasted for more than five months in 2004 and resulted in the contamination of freshwater over a large area of the Pearl River Delta [23]. The freshwater allocation/diversion method has been adopted by the local government to suppress saltwater intrusion [25,26]. With this method, flow bifurcation is artificially controlled to create a high flow that extrudes saltwater from upstream tributaries. This method has proved to be effective in preventing saltwater intrusion in both the PRE [25,27] and the Changjiang Estuary [28]. However, as the sea level continues to rise, the salt content, stratification, and tidal range will also increase in the PRE [7]. Based on the projected future sea level, Mills et al. [9] predicted that the increases in salinity in the Guadiana Estuary, which is generally well mixed, would be most significant at times of low freshwater flow (dry season). In the upper tributaries of the PRE, freshwater resources are at particular risk from sea-level rise during the dry season.
To date, there have been few studies of the effects of sea-level rise on the brackish water and drinking-water supply of upstream tributaries of the PRE. The water allocation threshold required to suppress saltwater intrusion during the dry season against the sea-level rise must also be quantitatively evaluated to determine the threat that future sea-level rise poses to freshwater resources. These are the motivation of conducting this study.
The aim of this study was to investigate the impact of future sea-level rise on the freshwater resources in the upstream tributaries of the PRE during the dry season. Flow modulation was performed to identify the threshold at which saltwater intrusion could be effectively suppressed in response to both sea-level rise and dry season hydrodynamics. A fully calibrated three-dimensional numerical model was used to simulate the hydrodynamic circulation of the PRE under different conditions. The remainder of this paper is organized as follows. The study area is described in Section 2. Section 3 introduces the methods, Section 4 presents the results, and a discussion and conclusions are presented in Section 5 and Section 6, respectively.
2. Description of Study Area
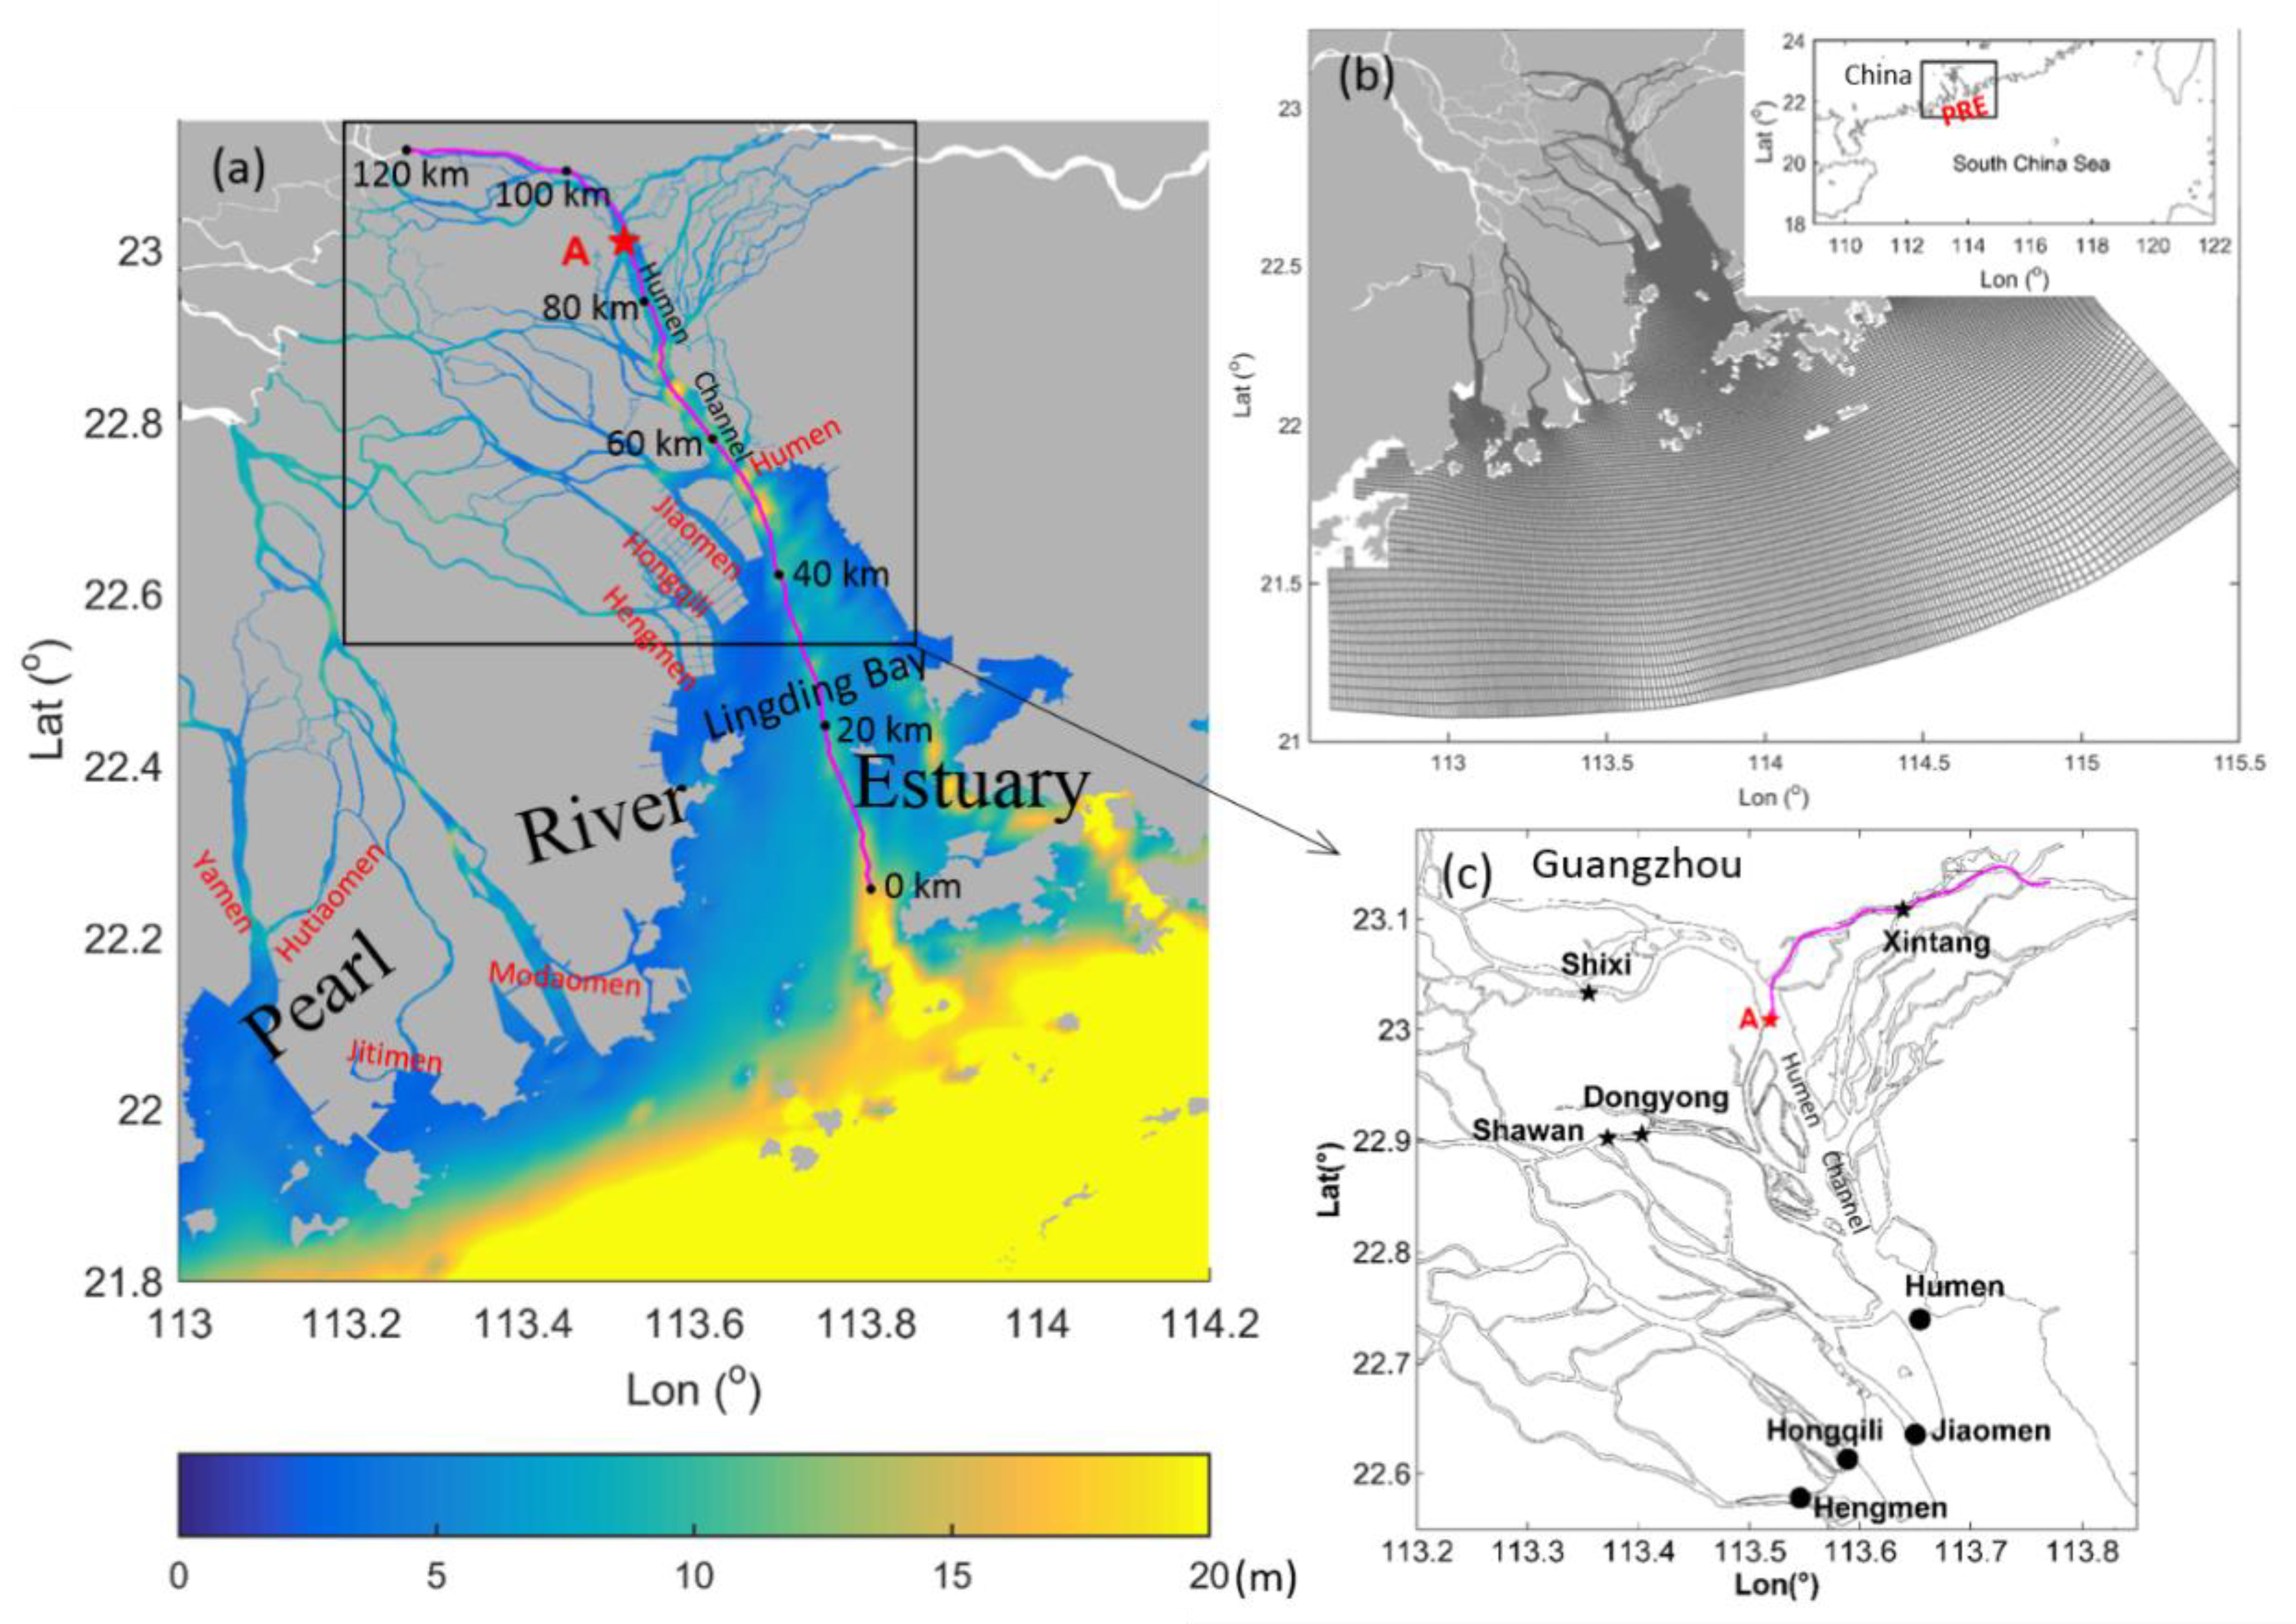
The study was conducted in the upper PRE. The PRE is a bell-shaped estuary on the southern coast of China (Figure 1). As the second largest river in China, the Pearl River has a very complex river network that discharges freshwater into the estuary via eight outlets (Humen, Jiaomen, Hongqili, Hengmen, Modaomen, Jitimen, Hutiaomen, and Yamen). The Lingding Bay is the largest sub-estuary in the PRE. Salt water from the Lingding Bay occupies the most portion of the Humen Channel during the dry season [7]. The Humen Channel is a major passage that connects upper tributaries to the downstream estuary (Figure 1a,c). The mean water depth of those upstream tributaries is less than 10 m. Tidal wave progress upstream through the Humen channel and the tidal range is amplified in the upstream because of the shallowed water and narrowed channel [29].
In the upper reaches of PRE, there are densely populated cities, factories, and farm lands surrounding river delta. This area has become the second largest urban agglomeration in the world [30]. Four waterworks supply drinking water to the region. These four drinking-water intake stations, i.e., Xintang, Shixi, Dongyong, and Shawan, are located in the upstream tributaries (as marked in Figure 1c). Due to the large population relying on the drinking water from these intake stations, the freshwater resources in these tributaries are a major concern of the local community. Evaluating the effects of sea-level rise on these upstream tributaries is critical to the sustainability of the drinking-water supply.
3. Methods
3.1. Numerical Model
To simulate the hydrodynamic circulation in the PRE, we used the thee-dimensional hydrodynamic model EFDC (Environmental Fluid Dynamics Code) developed by the Virginia Institute of Marine Science [31]. The EFDC model uses curvilinear, orthogonal horizontal coordinates and sigma vertical coordinates to represent the physical characteristics of a water body. It solves three-dimensional, time-dependent flows governed by hydrostatic primitive equations. The modified Mellor and Yamada [32] level 2.5 turbulence closure model is implemented in the model. The EFDC model has been applied to a wide range of environmental studies in the Chesapeake Bay, Pearl River Estuary, Changjiang Estuary, and Perdido Bay Estuary, to name a few [7,8,33,34,35,36]. In the application to the PRE, the model domain (as shown in Figure 1b,) extended from the upstream river network to the adjacent shelf water of the northern South China Sea. The horizontal resolution of the model grids in the upstream tributaries was approximately 40 m. Coarser model grids were used in the shelf sea to improve the computation efficiency. There were 20 vertical sigma layers with high resolutions near the surface and bottom layers, respectively. At the upstream river boundaries, the daily river discharge data observed at stations in the major tributaries of the Pearl River and the ratio of freshwater distribution among eight outlets [37] were used to determine the distribution of river discharge in each water channel. This method has been proved efficient to provide the best river flow distribution to each water channel of the crisscrossed river network in the PRE [7,38,39]. Our model skill assessment had been done in detail and the model-data calibration for tides, salinity, and current velocity on a variety of time-scales in the PRE had been conducted by Hong et al. [7]. It has been proved to be robust in reproducing the hydrodynamic circulation in the PRE under realistic forcing. The model configuration and external forcing fields used in this study were the same as those used by Hong et al. [7], where detailed information about our model skill assessment can be found. The model was run from 1 January 2007 to 31 May 2008 with a hot start from the model results obtained at the end of 2006. The outputs from November 2007 to April 2008, which cover the entire dry season period, were used for the subsequent analyses.
3.2. Sea-Level Rise Scenarios
According to the predicted accelerated rate of sea-level rise by 2100, the sea level will increase by 50 cm, based on the 20th century rate plus 2 mm, and by 100 cm, based on the 20th century rate plus 7 mm [4]. These rates may be underestimated due to the uncertainties regarding the contribution of ice melt [5]. Based on the prediction, the 50-cm and 100-cm sea-level rise scenarios, which are referred to as P50 and P100, respectively, were simulated by the numerical model in this study. The effects of sea-level rise on the upstream freshwater resources were assessed using the following strategy. The base case was defined as the model simulation using the present mean sea level. For the future sea-level-rise scenarios, the increased magnitude was added to the mean sea level used in the base case. As the model domain extended to the adjacent shelf sea and the open boundary of the model was more than 110 km away from the mouth of the PRE, the results in the estuary can be deemed reliable for investigating the effect of sea-level rise.
3.3. Flow Modulation
The competition between freshwater inflow from the head and saltwater intrusion from the mouth results in the variation of the along-estuary salinity. In the PRE, flow modulation has been adopted by the local government to suppress the winter dry season saltwater intrusion in the past decades [25,26,27]. During the flow modulation, the freshwater is transferred from other river branches either by the dam or by the water-storage reservoir to increase the river flow. Thus, the water at the drinking-water intake stations would meet the drinking water standard during dry season. Such flow modulation needs to be done at the best time period to improve the efficiency of supressing saltwater. As the sea-level rises, the dry season saltwater intrusion would be stronger. It is worthwhile to assess the threshold of river flow that is needed to suppress the saltwater under the estimated sea-level rise. This will help to determine the flow and timing of the modulation in advance and provide guidance to the local government for dealing with the threat of accelerated sea-level rise.
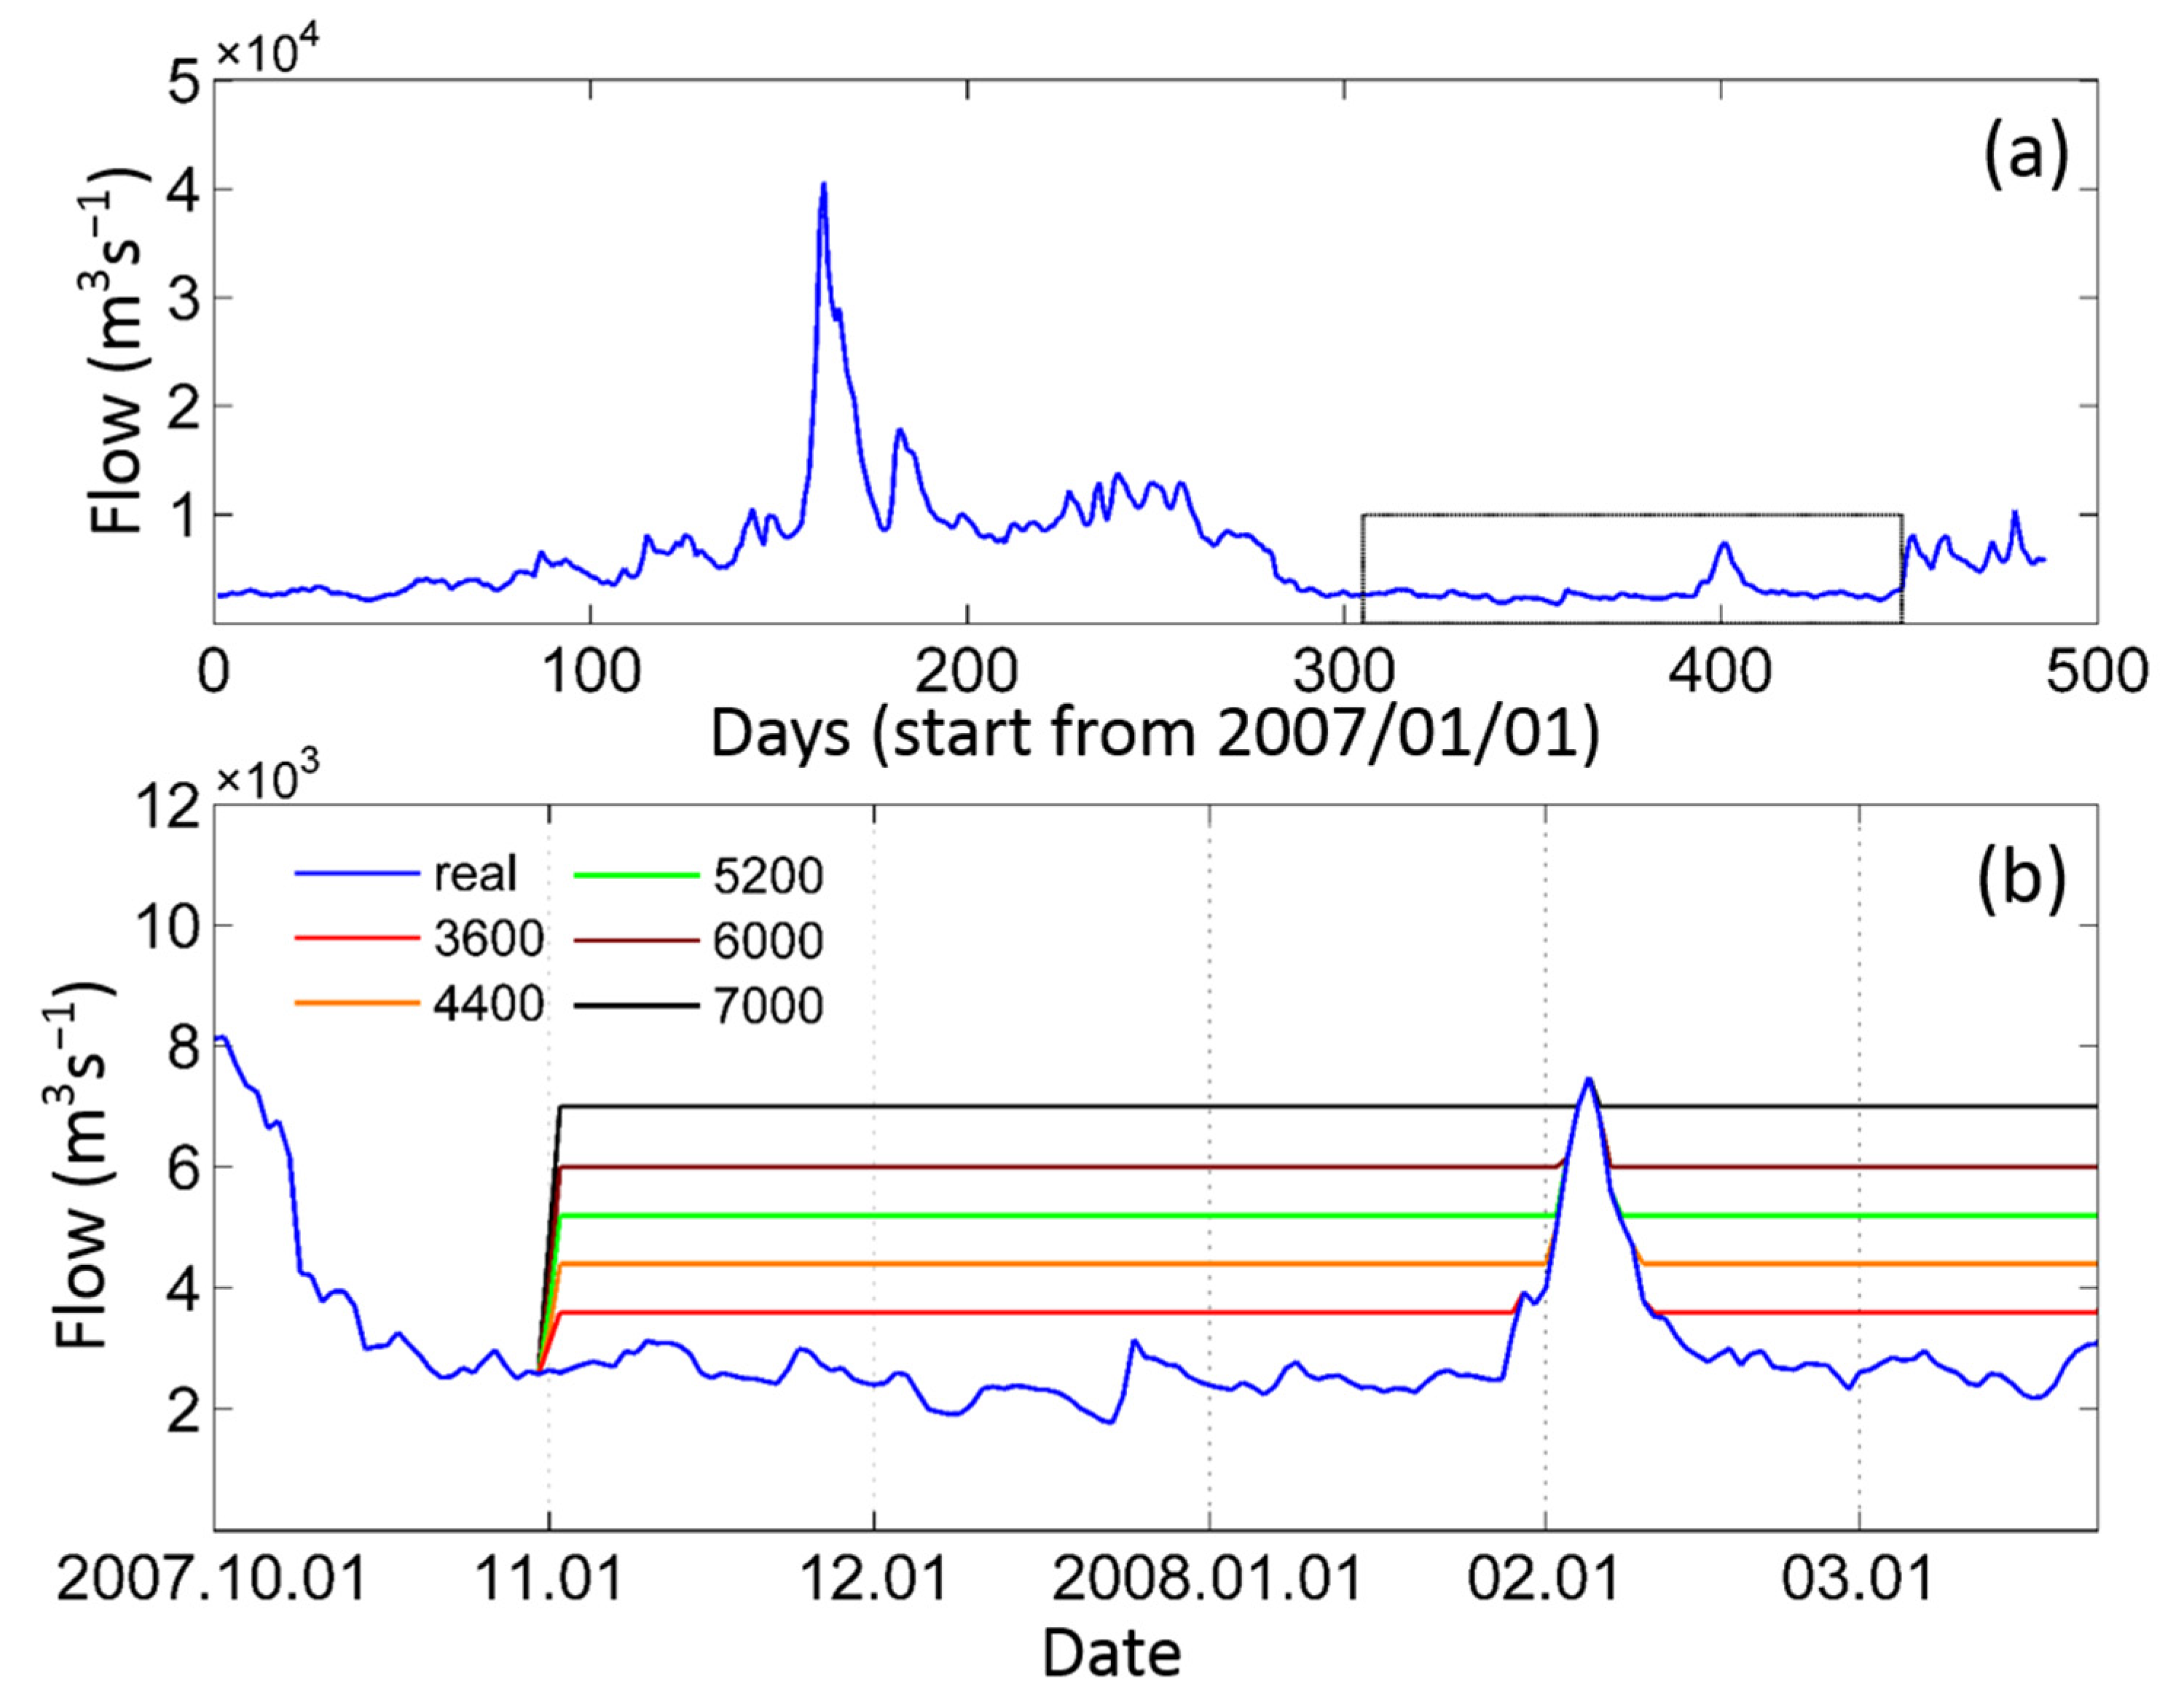
Figure 2a shows the discharge of the Pearl River from 1 January 2007 to 30 April 2008. Based on that reported by Zhao [24], the long-term annual mean river discharge is 10,524 m3/s, of which the dry season from October to March accounts for 20% and the wet season from April to September accounts for 80%. The average discharge during the dry season of 2007–2008 was 2533 m3/s, which is close to the long-term mean dry season value. As such, the hydrodynamic condition in the dry season of 2007–2008 can be regarded as typical. Flow allocation is the main method used by the local government to suppress saltwater intrusion during dry seasons [25,27,40]. As the freshwater resources are threatened by the acceleration of sea-level rise, it is important to evaluate the effect of flow modulation against the background of sea-level rise. For this purpose, the river flow in the numerical model was adjusted to a higher value (see Figure 2b). Minimum flow thresholds of 3000, 3400, 3600, 4000, 4400, 4800, 5200, 5600, 6000, and 7000 m3/s were set in each case. When the measured runoff was lower than the threshold value, the flow was set to be equal to the threshold, whereas if it was higher than the threshold value, the flow remained unchanged. To focus on the hydrodynamic conditions during the dry season, we set the flow modulation to take effect from 1 November 2007 to 31 March 2008. To prevent abrupt numerical perturbation, the flow was increased smoothly at first, i.e., it was increased gradually to reach the threshold value within two days. The flow modulation cases were conducted under the assumption of a 100-cm sea-level rise to evaluate the efficiency of flow modulation against the background of sea-level rise.
4. Results
4.1. Impact of Sea-Level Rise on the Upstream Brackish Water
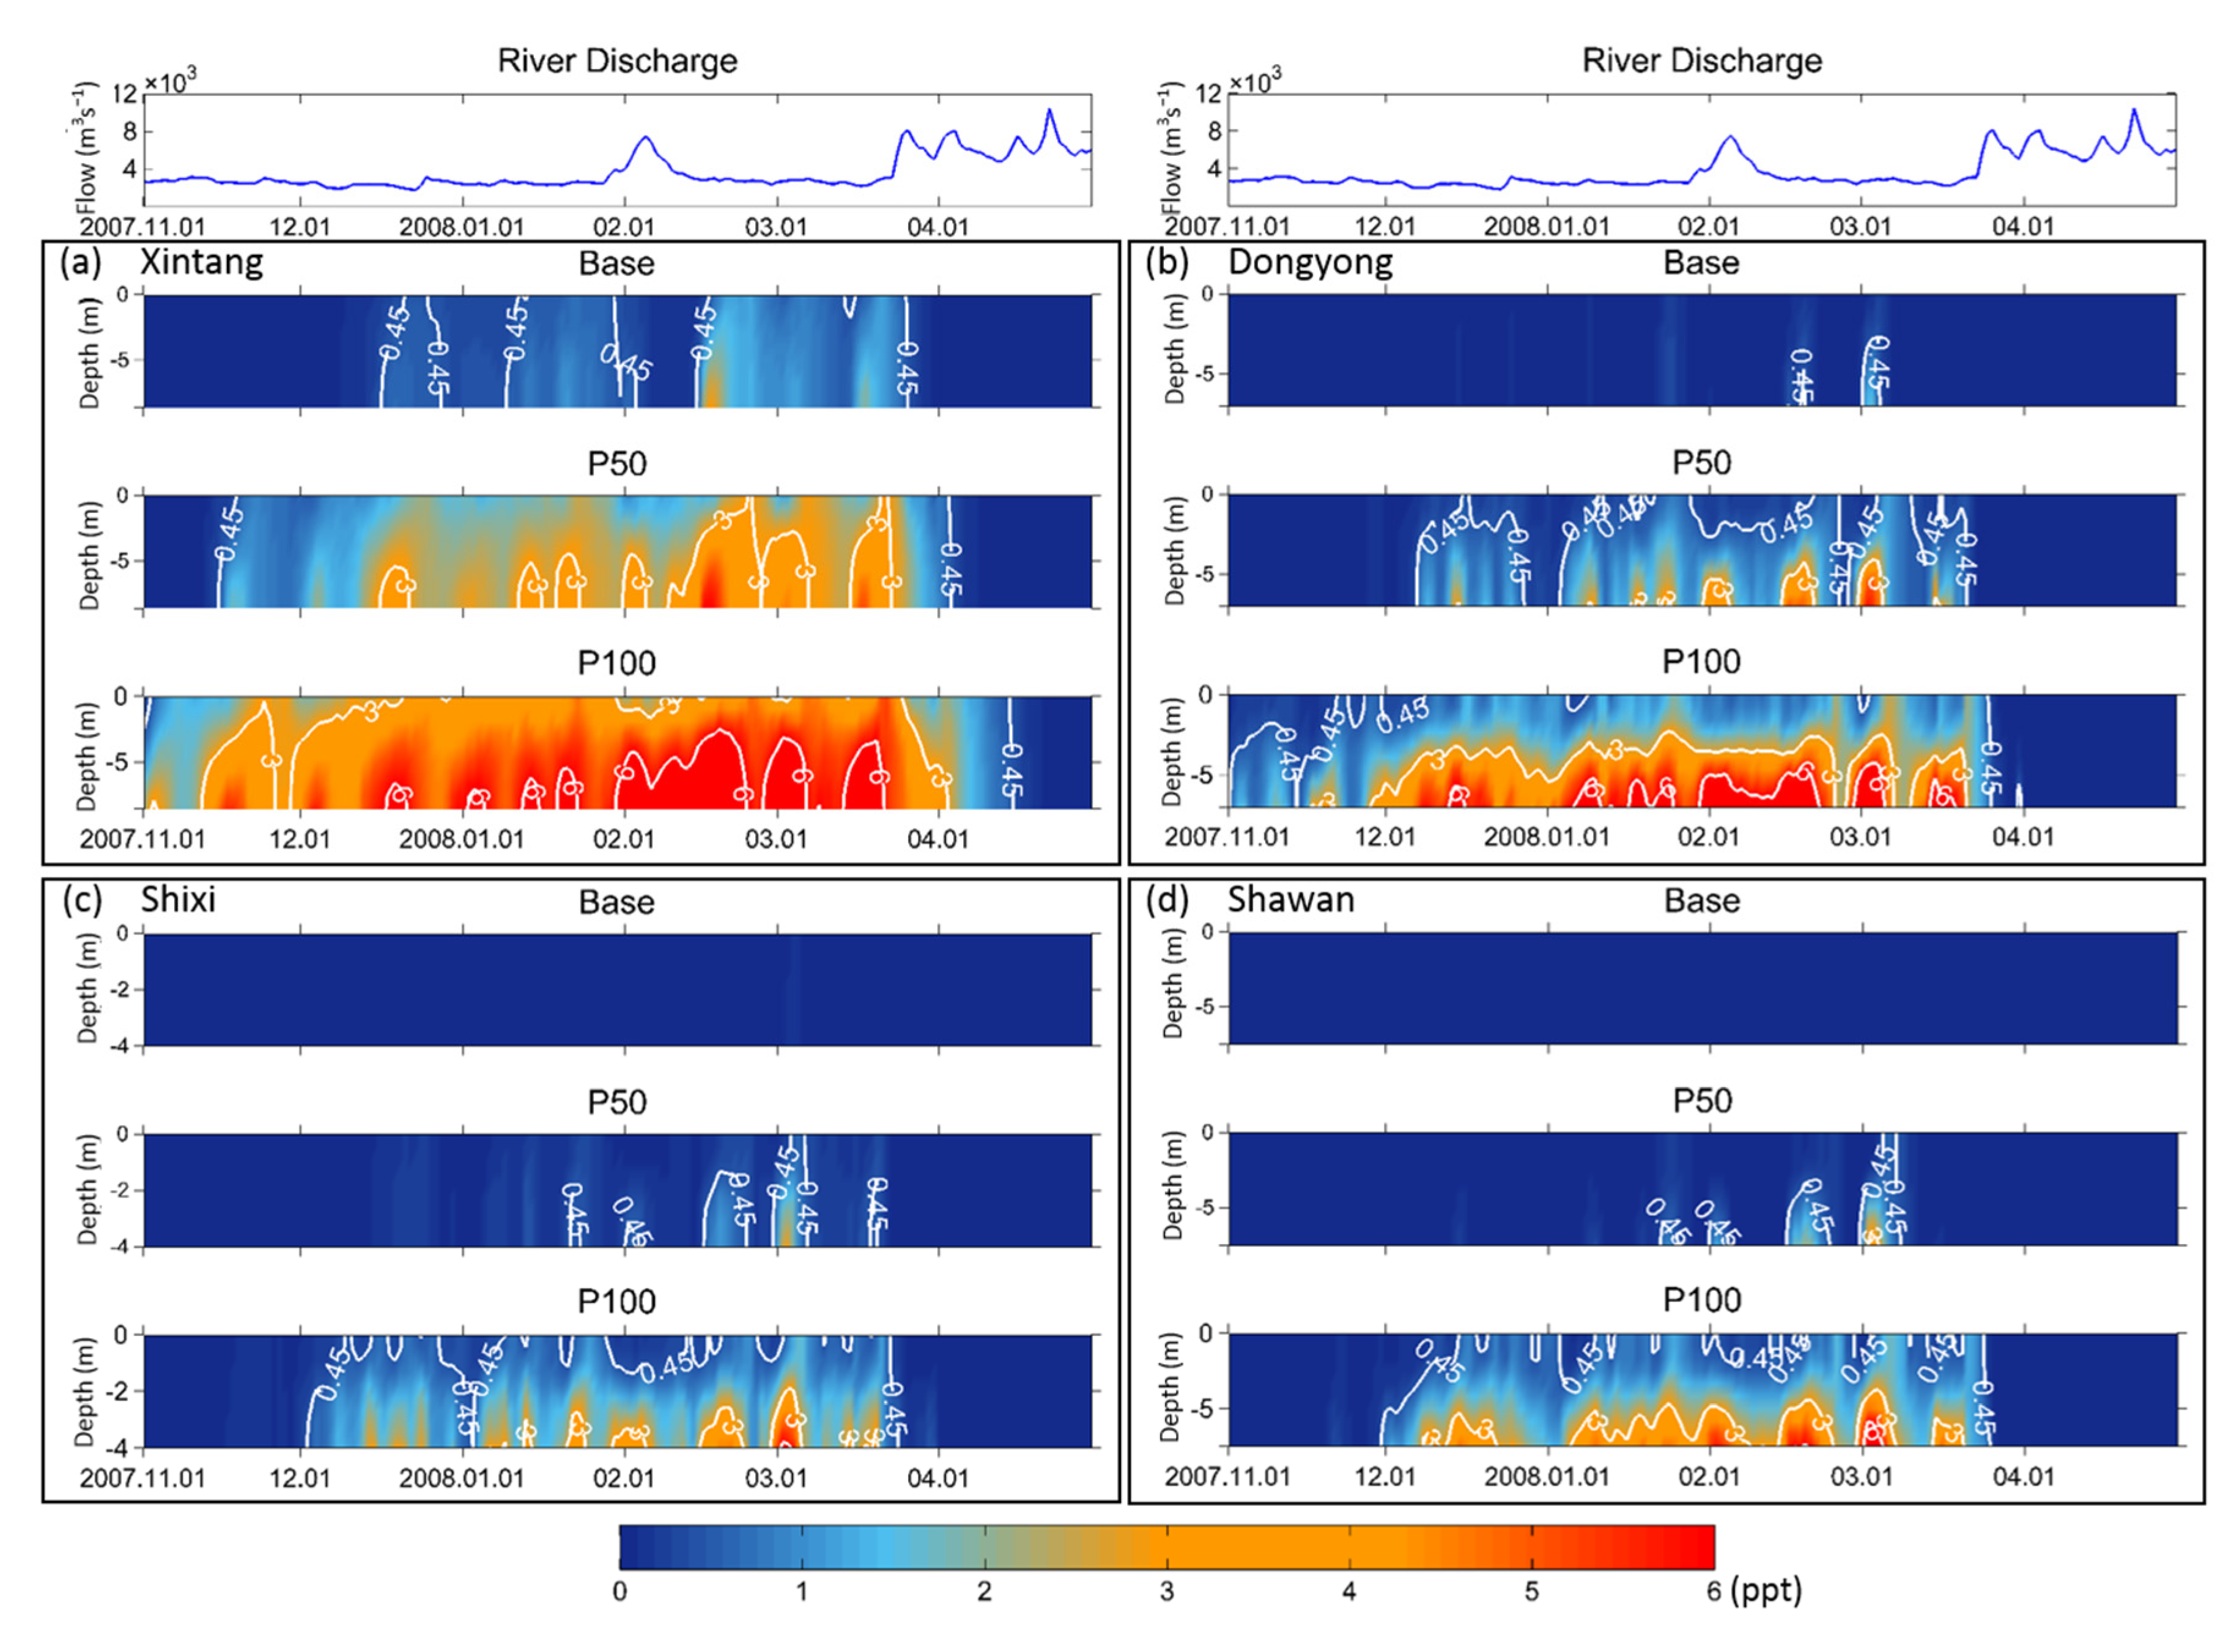
In the upstream tributaries of the PRE, there are four drinking-water intake stations (shown in Figure 1c). Figure 3 shows the depth–time salinity variations at each water-intake station. We plotted the 0.45-ppt isohaline as it is regarded as the threshold of the drinking water standard. The results clearly indicate that sea-level rise can strengthen the saltwater intrusion, and bring saline water to points where only freshwater had previously existed. Among the four stations, Xintang is most greatly affected, with its salinity levels higher than those at other stations in all cases (Figure 3a). From December to March, the bottom salinity frequently exceeds 3 ppt with the sea-level rise of 50 cm. For the 100-cm rise, the salinity in the entire water column is greater than 3 ppt during the dry season and the bottom salinity frequently exceeds 6 ppt. At Dongyong (Figure 3b), salinity >0.45 ppt occurs only for a few days in the base case. For a 50-cm sea-level rise, salinity >0.45 ppt can be observed most of the time from December to March. For a 100-cm sea-level rise, the bottom salinity continuously exceeds 3 ppt and at times even exceeds 6 ppt. The stations at Shixi (Figure 3c) and Shawan (Figure 3d) are not affected by saline water at the current mean sea level (base case). However, their bottom salinity increases to more than 0.45 ppt for a 50-cm sea-level rise and saline water occupies the entire water column for a 100-cm sea-level rise. As the sea level rises, both the intensity and duration of saltwater intrusion greatly increase. As such, during the dry season, the water at these stations is no longer suitable for the municipal drinking-water supply. This condition is reversed at the onset of the wet season (April–May).
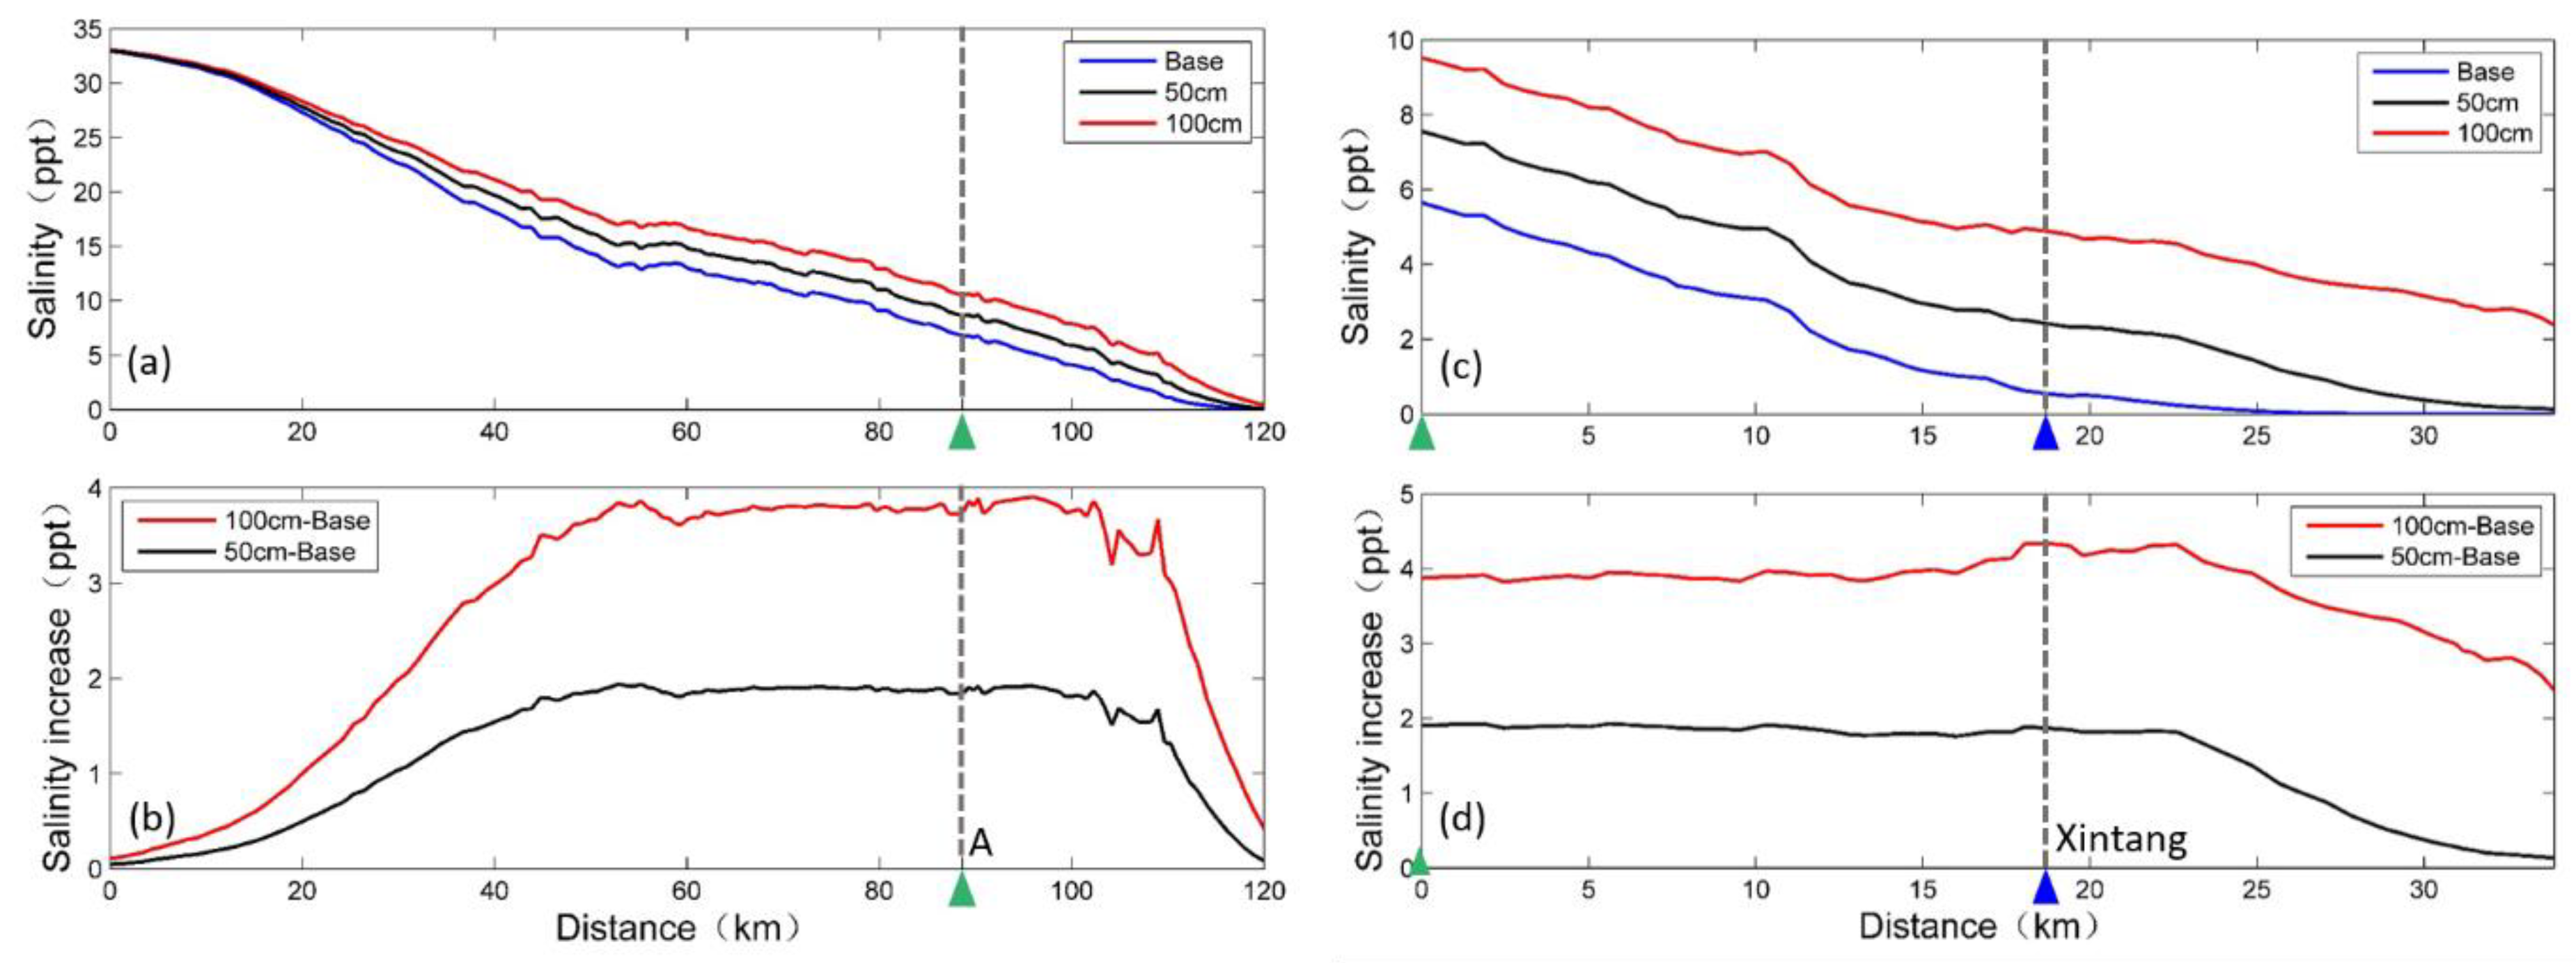
Figure 4a shows the depth-averaged salinity along the transect in the main channel of the PRE (see Figure 1a for the location). The results are average values from January, which show a typical dry season condition. Salinity increases as the sea level rises and exhibits different patterns in different areas of the estuary. Along the channel, the most significant increase in salinity occurs from 40 to 110 km upstream of the estuary mouth, where the salinity increases to 1.8 and 3.8 ppt for the 50- and 100-cm rises in sea level, respectively (Figure 4b). For example, at station A (a confluence point of the upper tributaries, see Figure 1a for the location), salinity increases from 7 ppt in the base case to approximately 11 ppt in the case of a 100-cm sea-level rise. As the sea-level rise has the most significant impact on the tributary where Xintang is located (Figure 3), Figure 4c shows the mean salinity along this tributary (see Figure 1c for the transect location) in January, which increases continuously. The salt intrusion length (defined by the position of the 0.45-ppt isohaline) increases approximately 10 km with the sea-level rising 50 cm. Given a 100-cm rise, the saltwater intrusion length increases more than 18 km. The mean salinity increase at Xintang could be approximately 2 and 4.2 ppt for the 50- and 100-cm sea-level rise, respectively (Figure 4d). As such, a supply of drinking water is no longer available at Xintang.
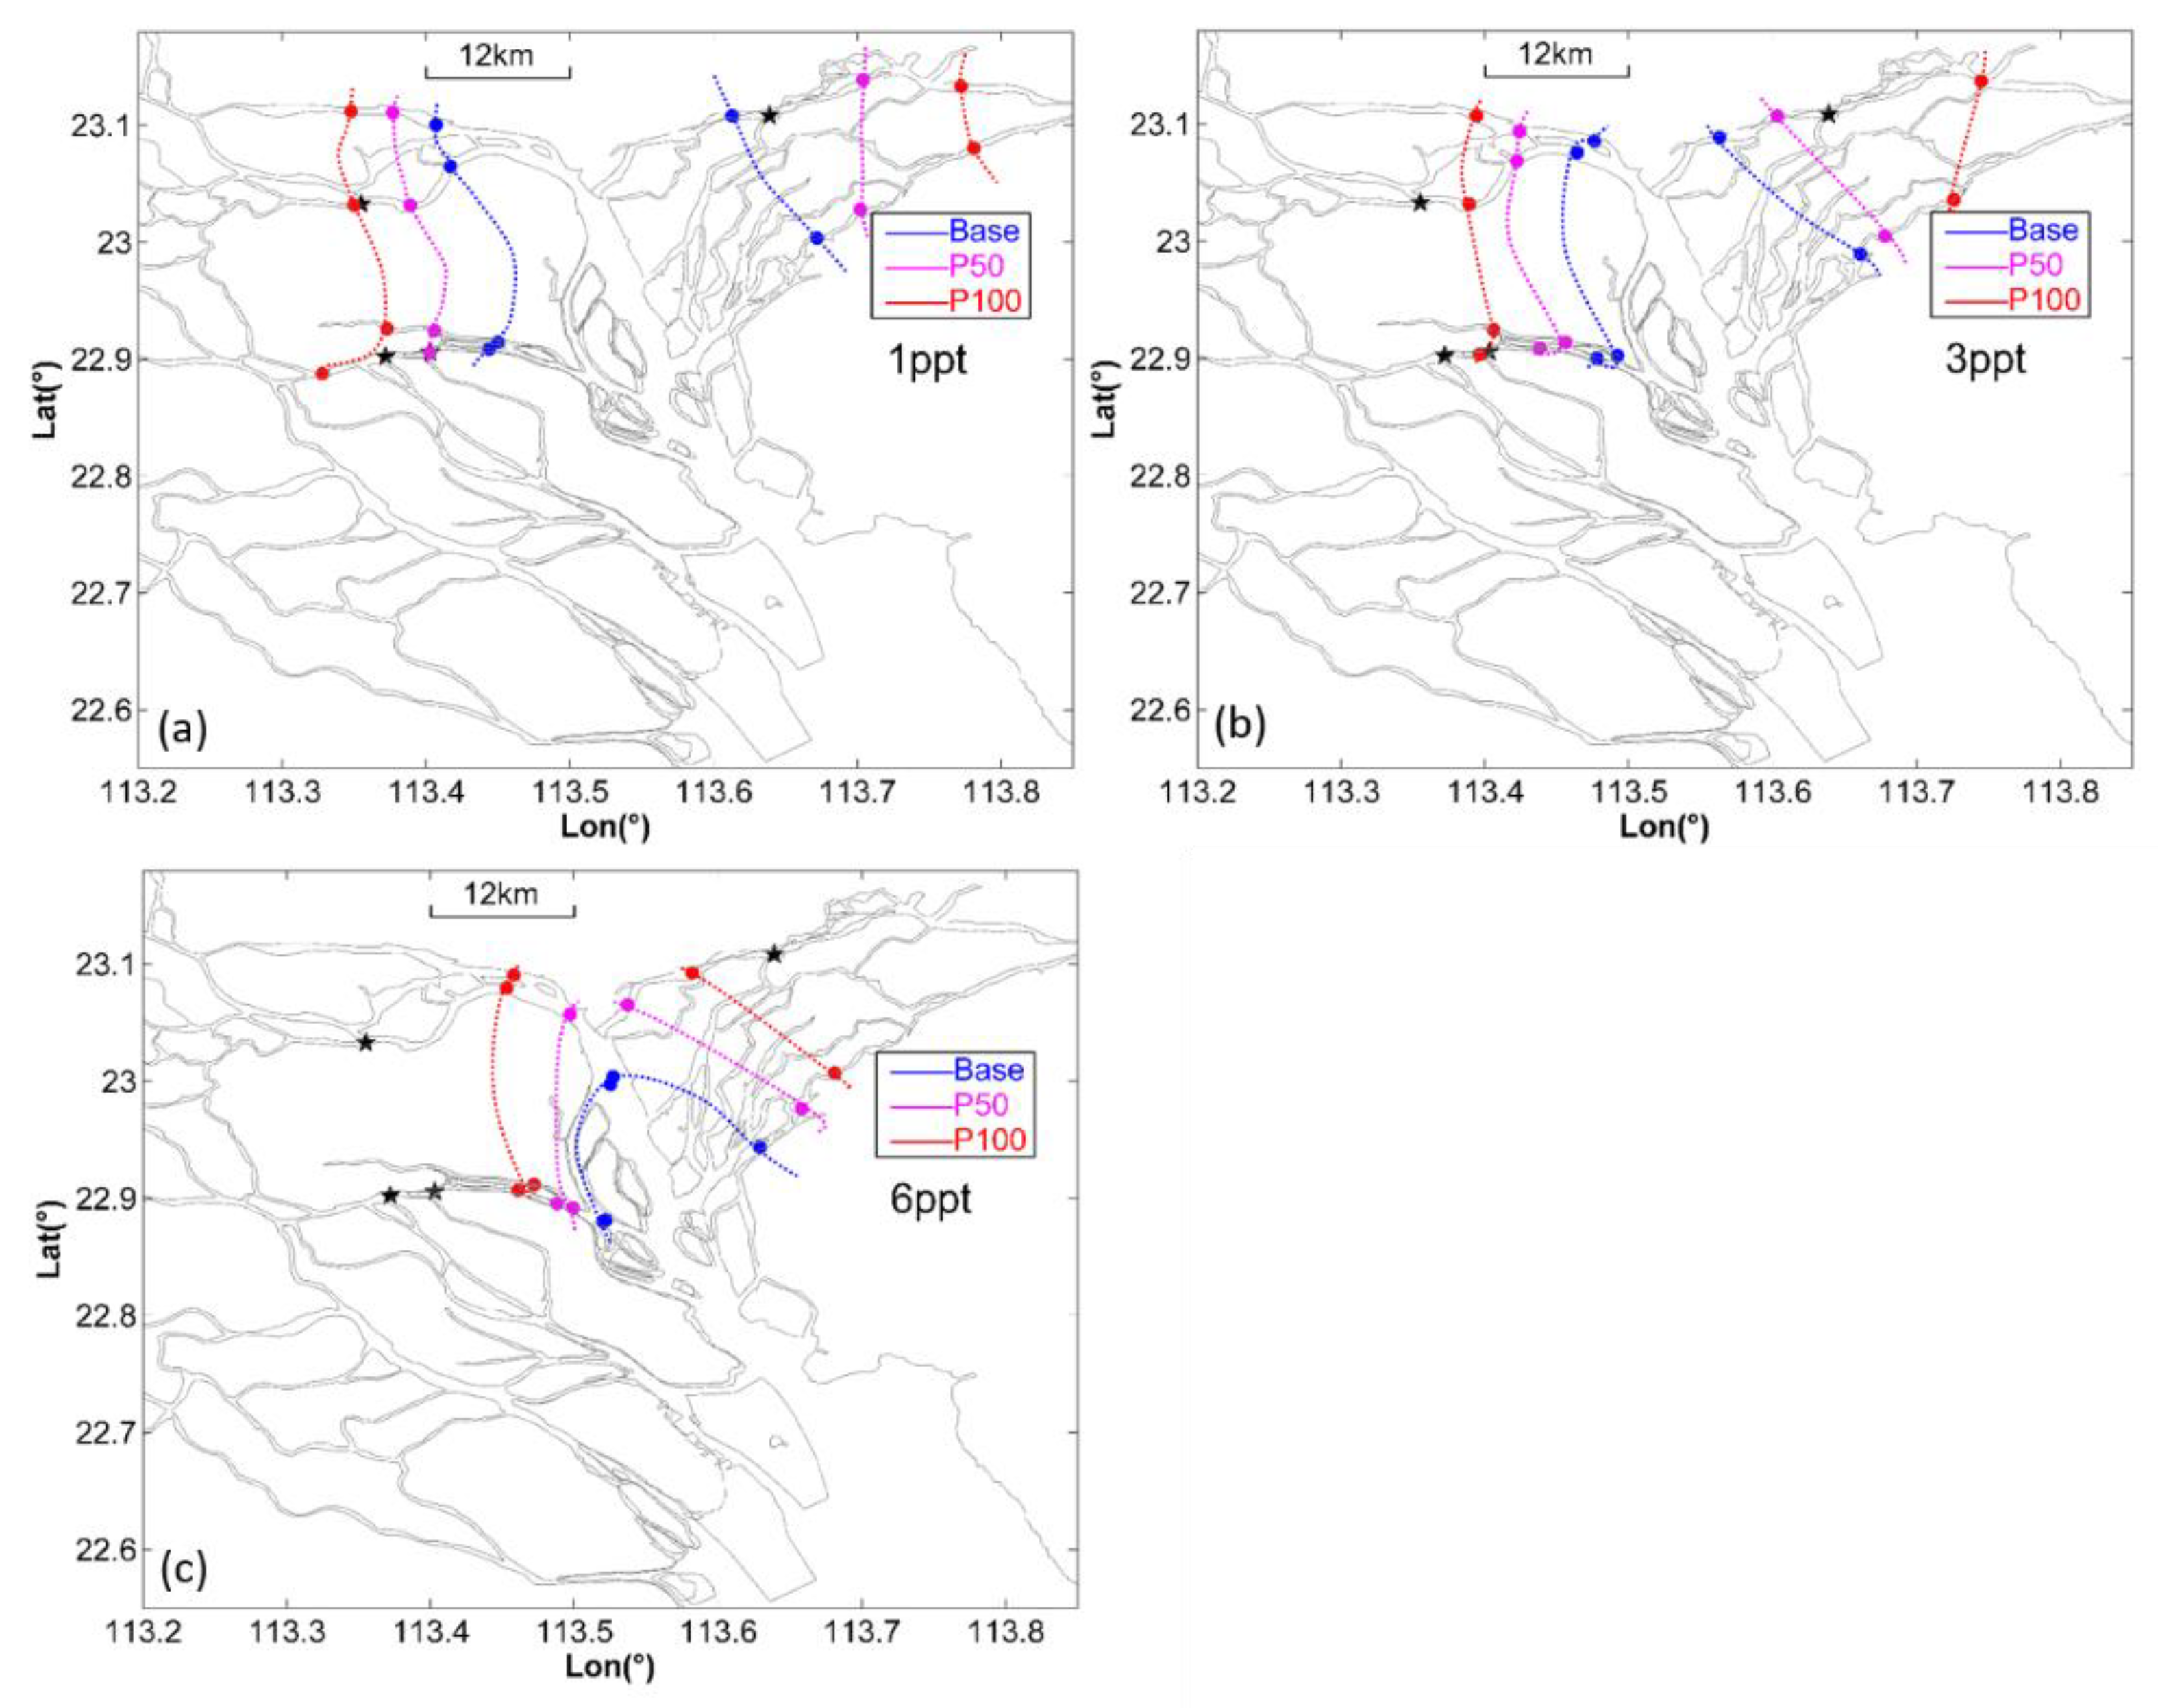
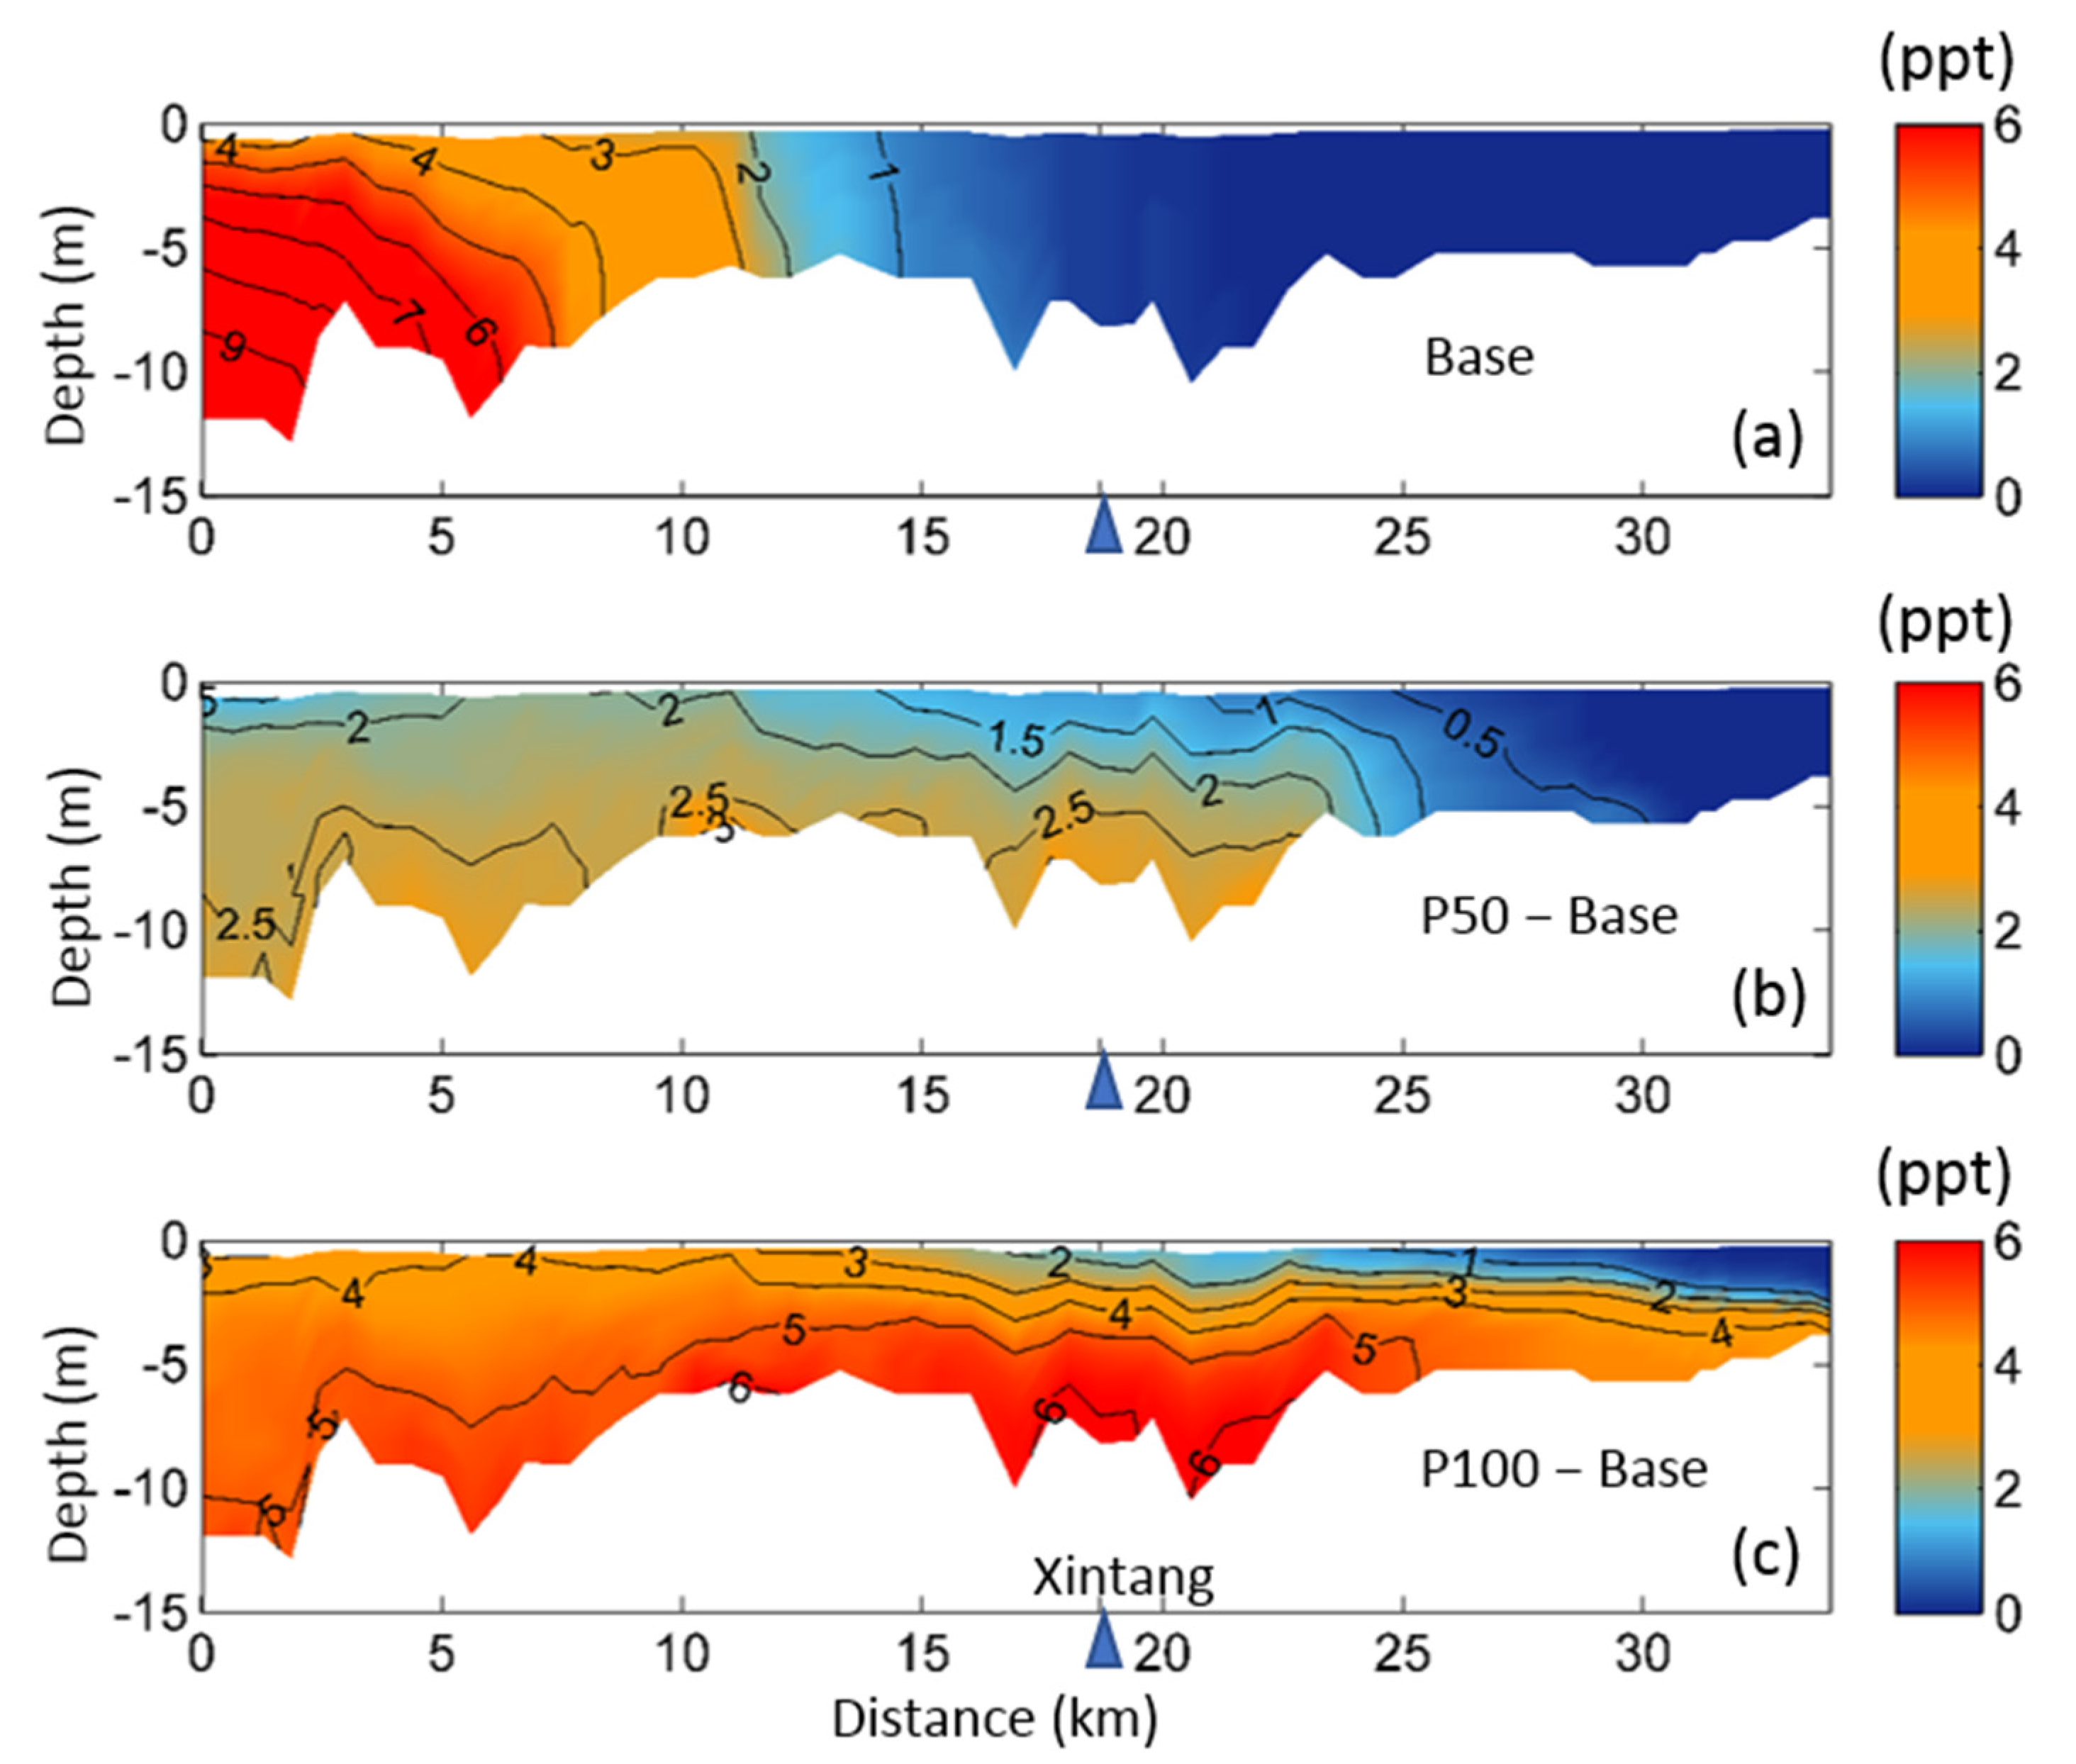
Figure 5 presents the depth-averaged isohalines in the upper reaches of the PRE, in which, for the sake of clarity, only the 1-, 3-, and 6-ppt isohalines are plotted. The results are average values from January, which represent typical dry season conditions. All of the isohalines shift further landward with rises in sea level. The distance of this landward shift differs in different tributaries, with the most significant impact occurring in the tributary where the Xintang station is located. Generally, sea-level rise has more significant impacts on the 1- and 3-ppt isohalines than on the 6-ppt isohaline. For example, the 1-ppt isohaline shifts approximately 13 km towards the river head where Xintang is located when the sea level rises 50 cm. For the 3- and 6-ppt isohalines, this landward shift is approximately 7 and 6 km, respectively. Changes in the spatial distribution of the isohalines indicate an obvious decrease in brackish water. The municipal supply and ecological system in the upper reaches of the PRE would be greatly impacted by these changes.
4.2. Flow Modulation under the Constraint of Rising Sea Level
To assess the effect of flow modulation against the background of sea-level rise, a series of model simulations were conducted. Section 3.3 above provides a detailed description of the flow modulation strategy we adopted. The flow modulation was started on 1 November 2007 and lasted until 31 March 2008. All cases were run with a 100-cm sea-level rise as this future sea-level-rise scenario shows a severe impact on the upstream tributaries.
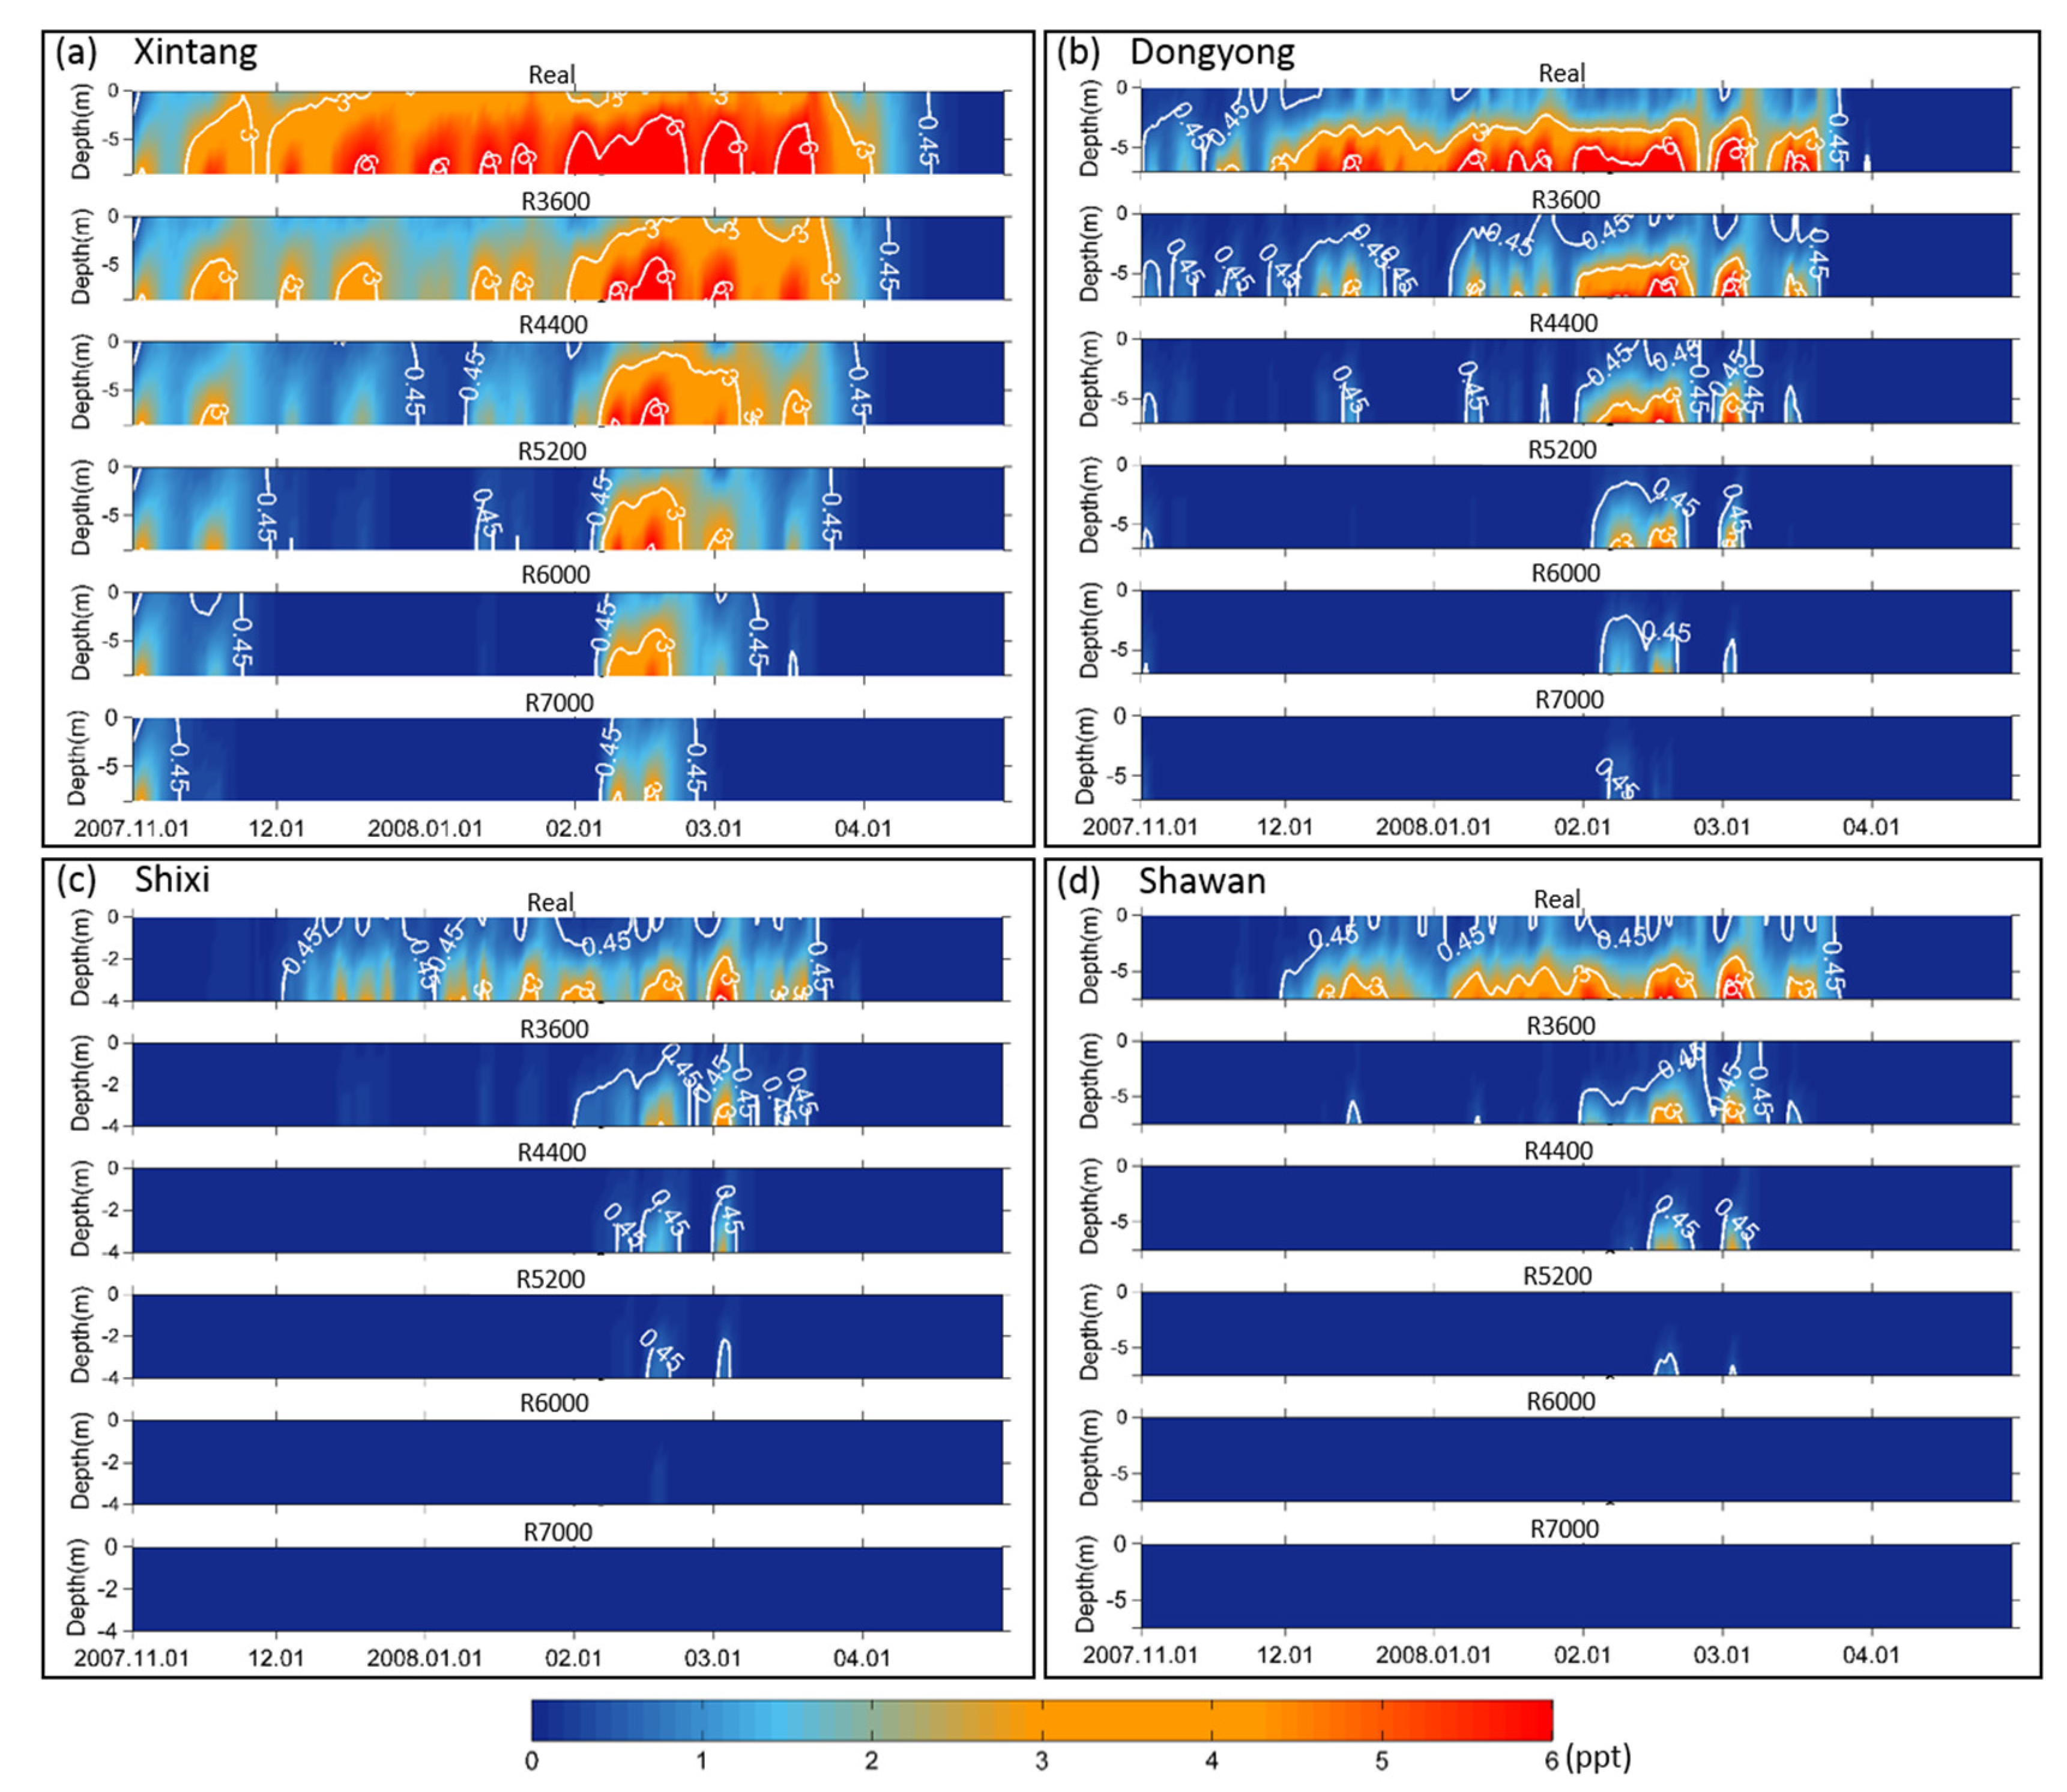
Figure 6 shows the salinity variation at each water-intake station, where, as the sea level rises 100 cm, the salinity would exceed 0.45 ppt for more than four months at the actual rate of river flow. However, with flow modulation, the saltwater intrusion is greatly alleviated and the duration of time in which the salinity >0.45 ppt is greatly reduced. At Xintang, the water still exceeds the drinking-water standard for approximately three months at a river flow rate of 5200 m3/s. In February, however, even in the case of 7000 m3/s, the river flow is not quite enough to prevent saltwater intrusion. The situation in February differs from those in December and January. The hydrodynamic condition in February, which includes the combined effect of favorable wind and tidal forcing, facilitates a strong saltwater intrusion. The detailed dynamic mechanisms that promote this strong salt intrusion event are presented in a separate paper (Hong et al., submitted). We also note that the high salinity at the beginning of November is attributable to the flow modulation being initiated on 1 November and the salinity decreasing gradually in response to increases in the flow threshold value. At Dongyong, a river flow of 4800 m3/s is enough to maintain salinity <0.45 ppt at the drinking-water intake station in December and January (figure not shown). For a river flow of 5200 m3/s, bottom saline water appears in February and the beginning of March at Shixi and Shawan but is observed only occasionally. For a river flow of 7000 m3/s, saline water appears only for a few days in Dongyong. The water at Shixi and Shawan satisfies the water intake standard when the river flow rate is greater than 6000 m3/s.
Saltwater intrusion into the upstream tributary of an estuary is influenced not only by the river flow, but also by the tide, bathymetry, and wind. The bathymetry and hydrodynamic conditions at Xintang and Dongyong are more favorable for saltwater intrusion. As a result, the saltwater intrusions at Xintang and Dongyong are stronger than those at Shixi and Shawan. To suppress the intrusion of saline water, higher flow threshold values are needed at Xintang and Dongyong. Generally, the threat posed by sea-level rise to freshwater resources is stronger at Xintang and Dongyong than at Shixi and Shawan.
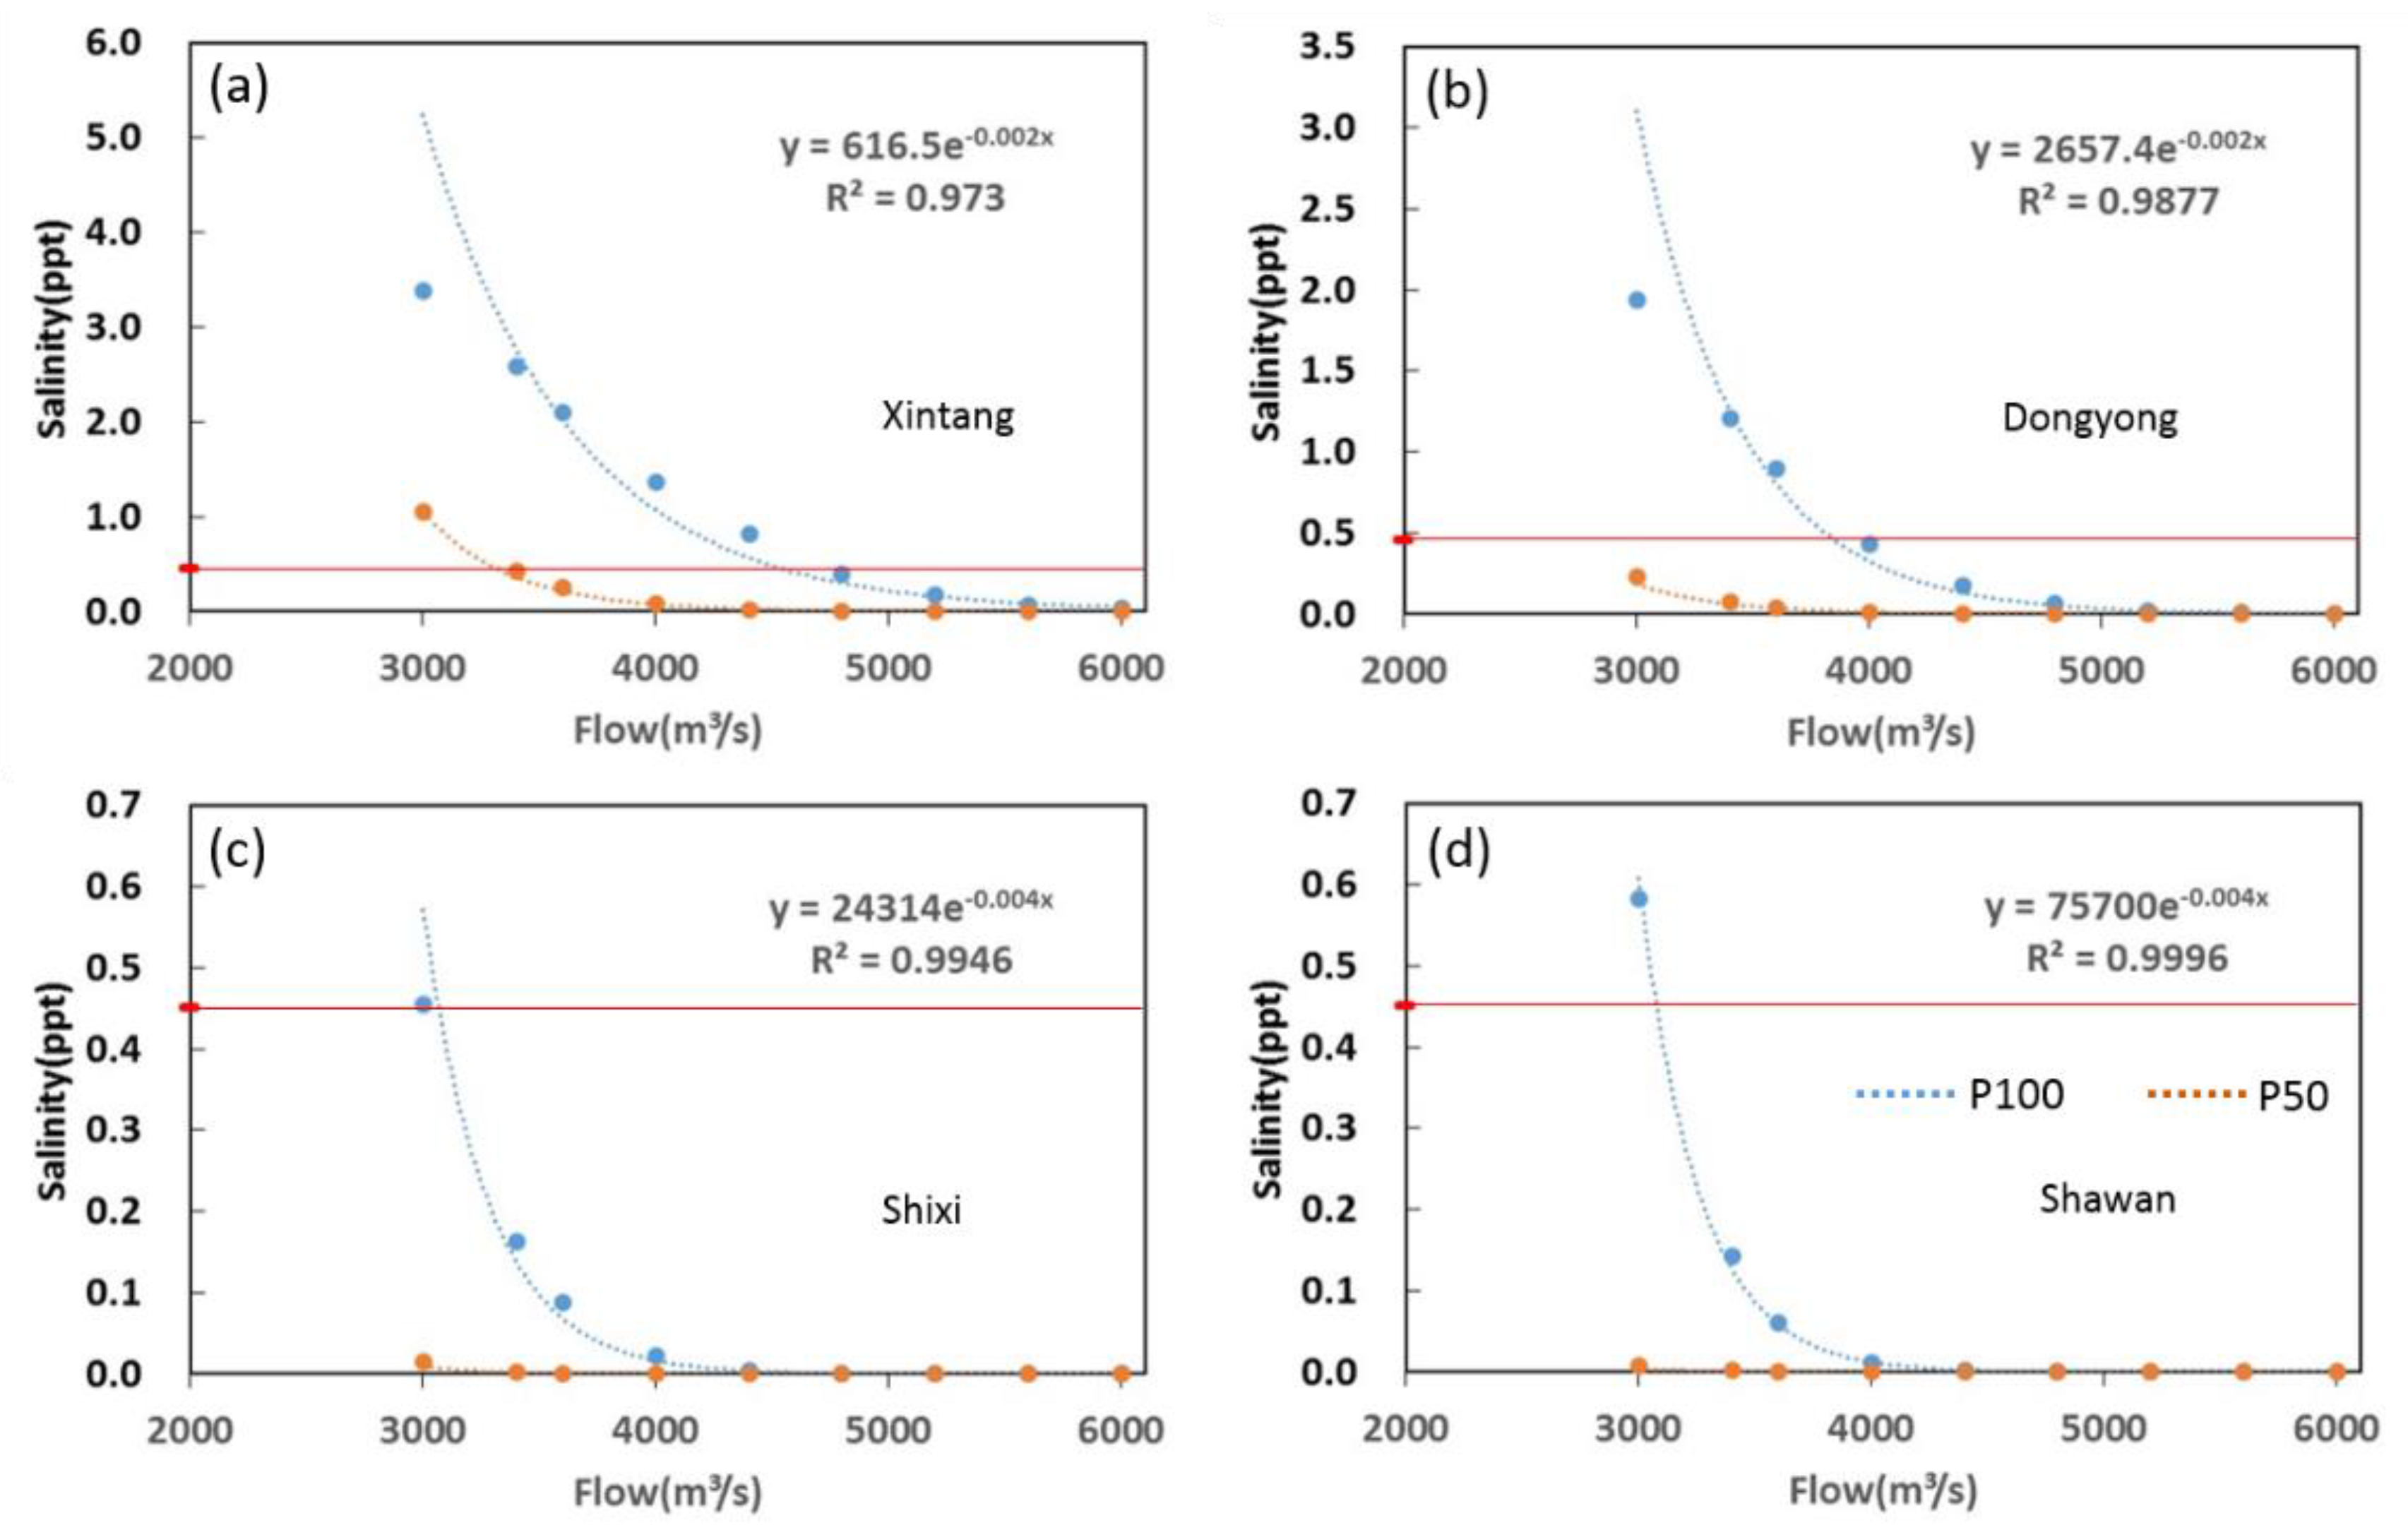
Figure 7 shows the relationship between the river flow and depth-averaged salinity at each water intake station. The mean salinity in January is used for the analyses as it represents a typical dry season condition. As the river flow increases, the salinity at each station decreases exponentially. For a 100-cm sea-level rise, to obtain water with suitable quality for municipal and industrial use, river flow rates of 4800, 4000, 3000, and 3400 m3/s are needed for Xintang, Dongyong, Shixi, and Shawan, respectively. For a 50-cm sea-level rise, the river flow rate must be higher than 3400 m3/s for Xintang, but a river flow rate of 3000 m3/s is sufficient for the other three stations. Although flow modulation is generally used to suppress saltwater intrusion during the dry season, it is typically limited by the long distance associated with the water transfer, large degree of engineering required, and the precious freshwater resources during the dry season [40]. Therefore, it is very important to precisely determine the flow and timing of the modulation in advance. Using the exponential relationship shown in Figure 7, we can more accurately estimate the amount of flow needed to suppress dry-season saltwater intrusion against the background of sea-level rise.
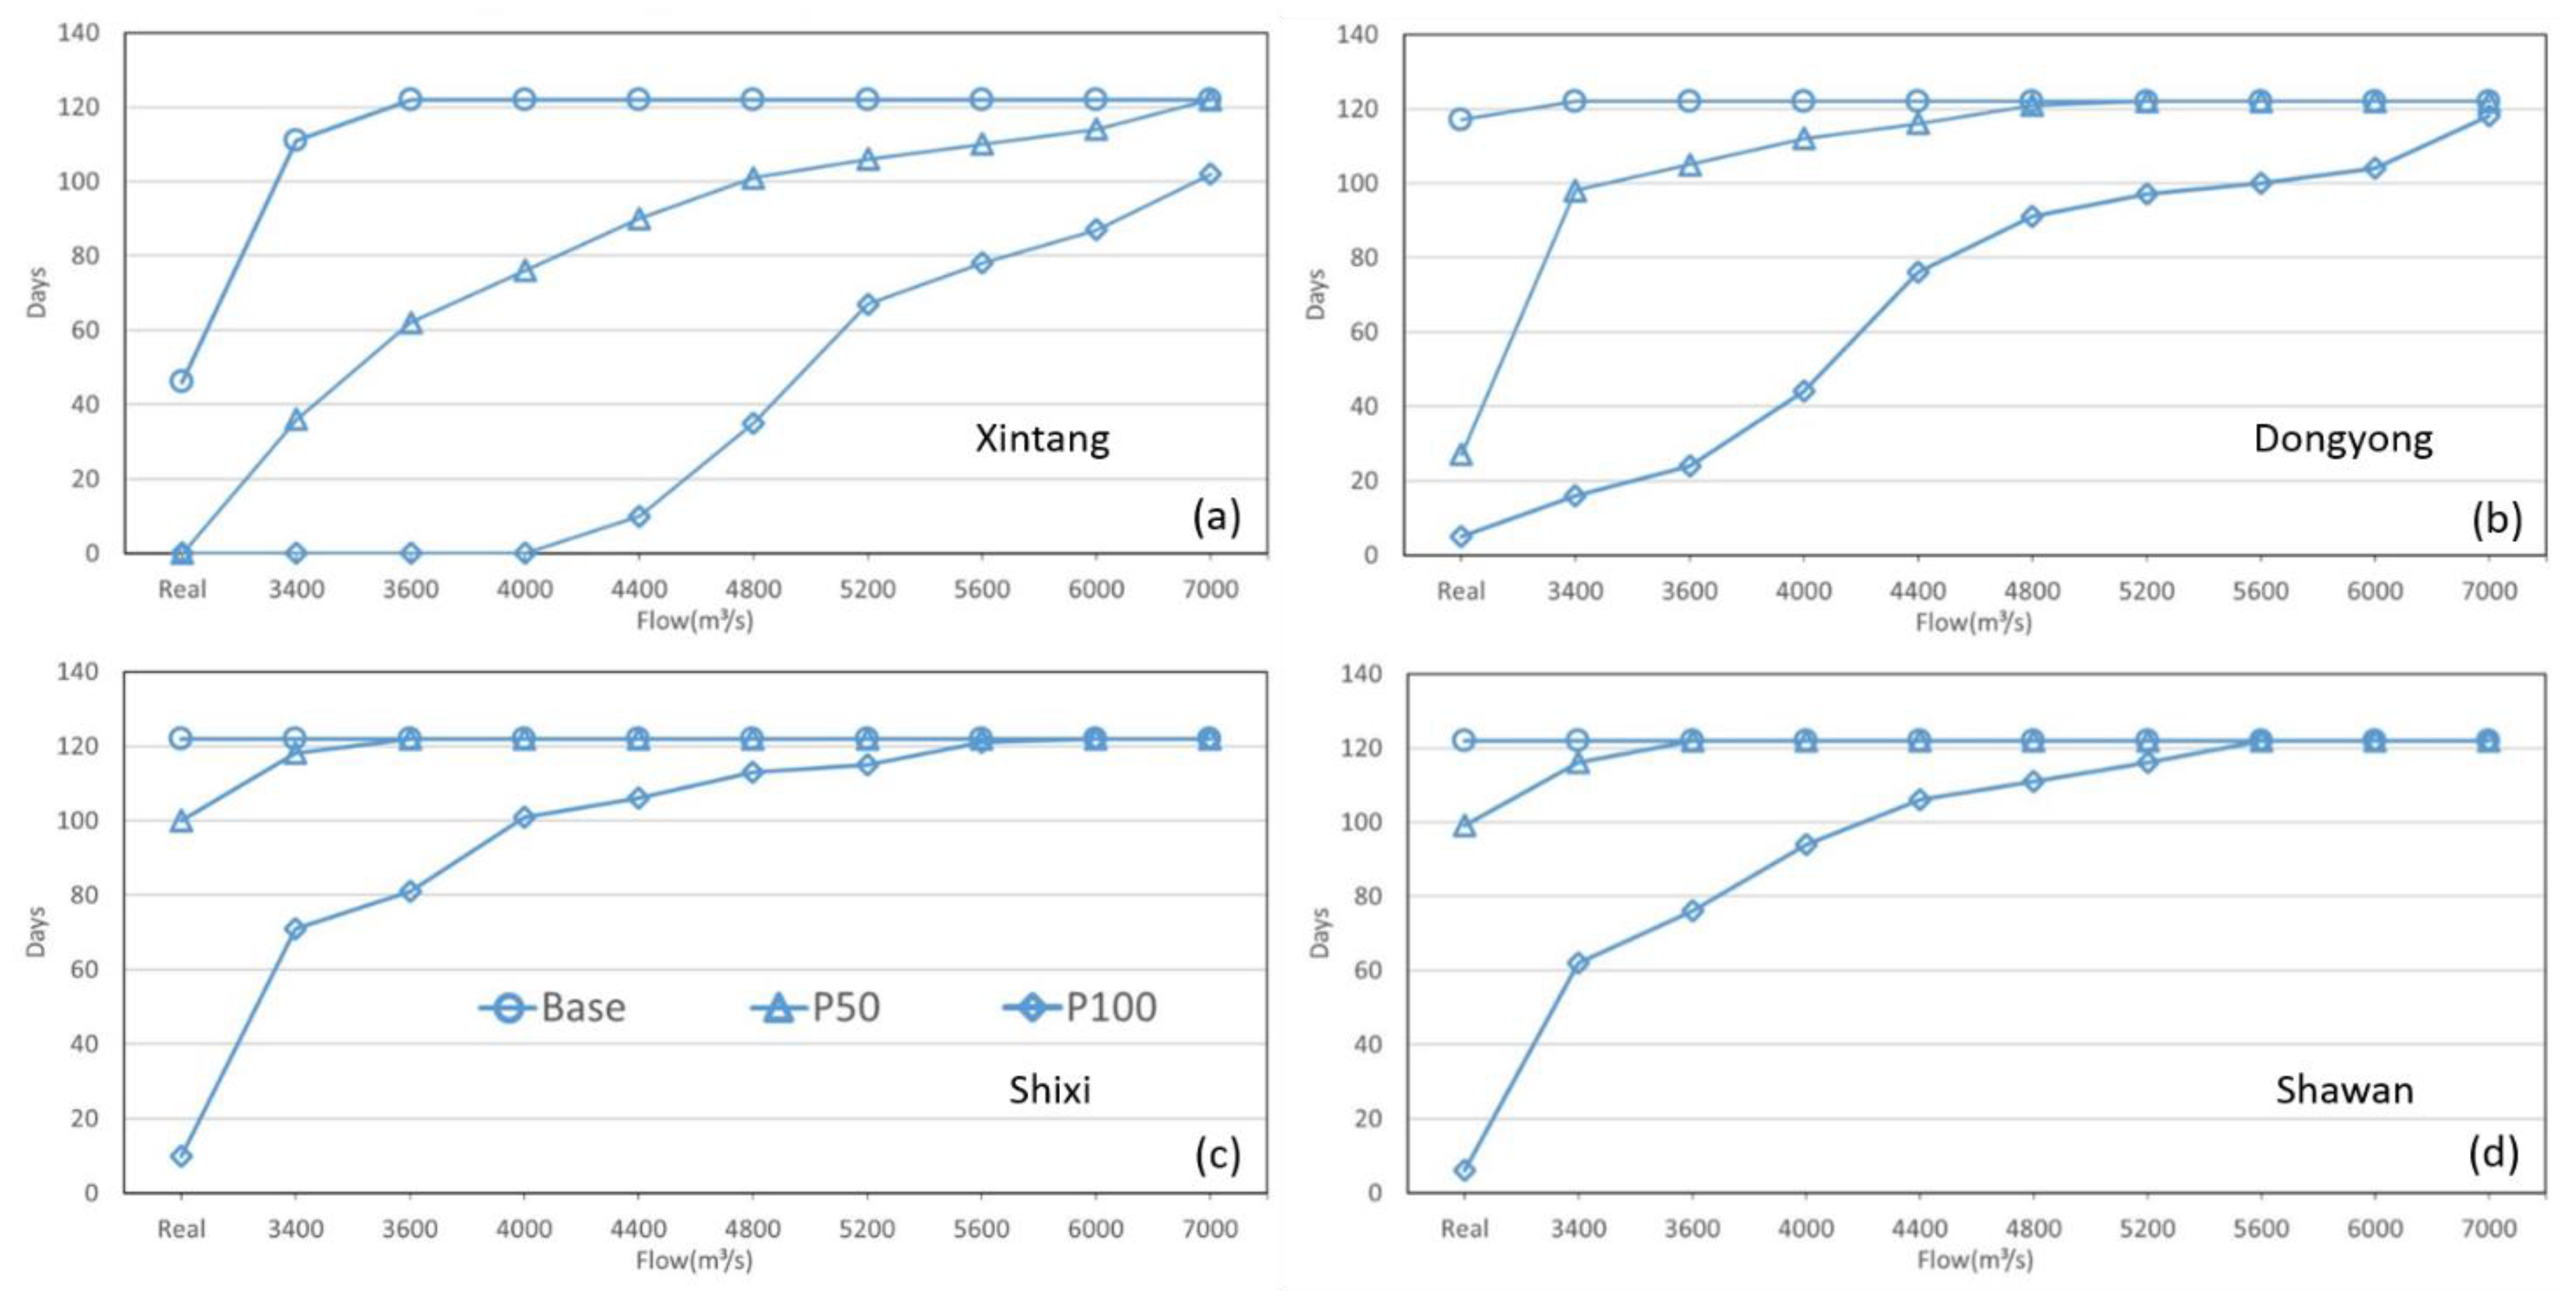
The number of days in which water meets the drinking water standard is an important index for measuring freshwater availability. Figure 8 shows the number of days when the salinity <0.45 ppt at each drinking-water intake station. Data from 1 December 2007 to 31 March 2008 (122 days in total) were used for the calculation. The results from the base case, P50 and P100 are plotted for each station. Generally, the number of days decreases as sea level rises but increases with increases in the river flow. If we take Xintang as an example, there are 122 days when the flow >3600 m3/s in the base case. However, a flow of 3600 m3/s results in only 62 days in the P50 case and 0 days in the P100 case. A flow of 7000 m3/s results in 122 days in the P50 case for which the water meets the drinking-water standard, but only 102 days in the P100 case. The response of Xintang delays those of Dongying, Shixi, and Shawan. For a 100-cm sea-level rise, a flow of 5600 is needed for 122 days of drinking-water supply at Shixi and Shawan. During the dry season, flow modulation is a critical tool for ensuring the availability of adequate freshwater for the municipal supply.
5. Discussion
5.1. Competitive Effect of River Flow and Sea-Level Rise
The salinity distribution in estuaries is governed by the balance between the downstream advection of salt by river flow and the upstream transport of salt by dispersive processes [41]. Accelerated sea-level rise causes saline water to intrude further upstream (e.g., [7,8,11,12,14,15]). During the dry season, this change can greatly impact the upstream freshwater resources. On the other hand, high flow can suppress saltwater intrusion and push the salinity front downstream. As shown in Figure 2a, there is a river flow pulse at the beginning of February. The peak of this pulse is approximately 7500 m3/s, which is greater than the maximum river flow modulation threshold values used in Section 3.2. However, this high flow pulse cannot maintain a salinity <0.45 ppt at the drinking-water intake stations as the sea level rises 50 and 100 cm (see Figure 3). Figure 9 shows the vertical salinity profile on 6 February 2008 along the tributary where Xintang is located. The flow pulse reaches its peak on 5 February 2008. Unlike the base case, the effect of high flow from the flow pulse is confined to the upper layer of the water column as the sea level rises (Figure 9b,c). This indicates that as the bottom salinity in the upstream tributary increases due to the sea-level rise, river flow has a stronger impact on the surface layer than on the bottom layer of the tributary. This finding is consistent with those reported by Zhi et al. [42]. The flow pulse lasted for approximately just one week. Compared with the results shown in Figure 6, this indicates that the duration of high flow is also an important factor for maintaining salinity <0.45 ppt at drinking-water intake stations. When the sea level rises by 100 cm, a short-term flow pulse will no longer suppress saltwater intrusion, and the effect of a high-flow pulse will be overwhelmed by the effect of the sea-level rise. It can be predicted that when the mean sea level rises to a certain height in the future, stronger flow modulation must be conducted for a sufficient duration to effectively suppress saltwater intrusion.
5.2. Combined Effect of Future Drought and Sea-Level Rise
The severity and duration of drought are expected to increase under future climate projections based on general circulation models for the three representative concentration pathway scenarios [4]. According to the research of Wang et al. [43], future drought conditions (2016–2100) in the Pearl River Basin are expected to be more serious than any historical (1960–2015) drought conditions. The severity and variability of future drought conditions are also predicted to be higher than they were in the historical period. At the seasonal scale, drought severity shows the highest increment in winter. The above information indicates that the Pearl River has a strong possibility of experiencing severe drought in the future as a result of climate change.
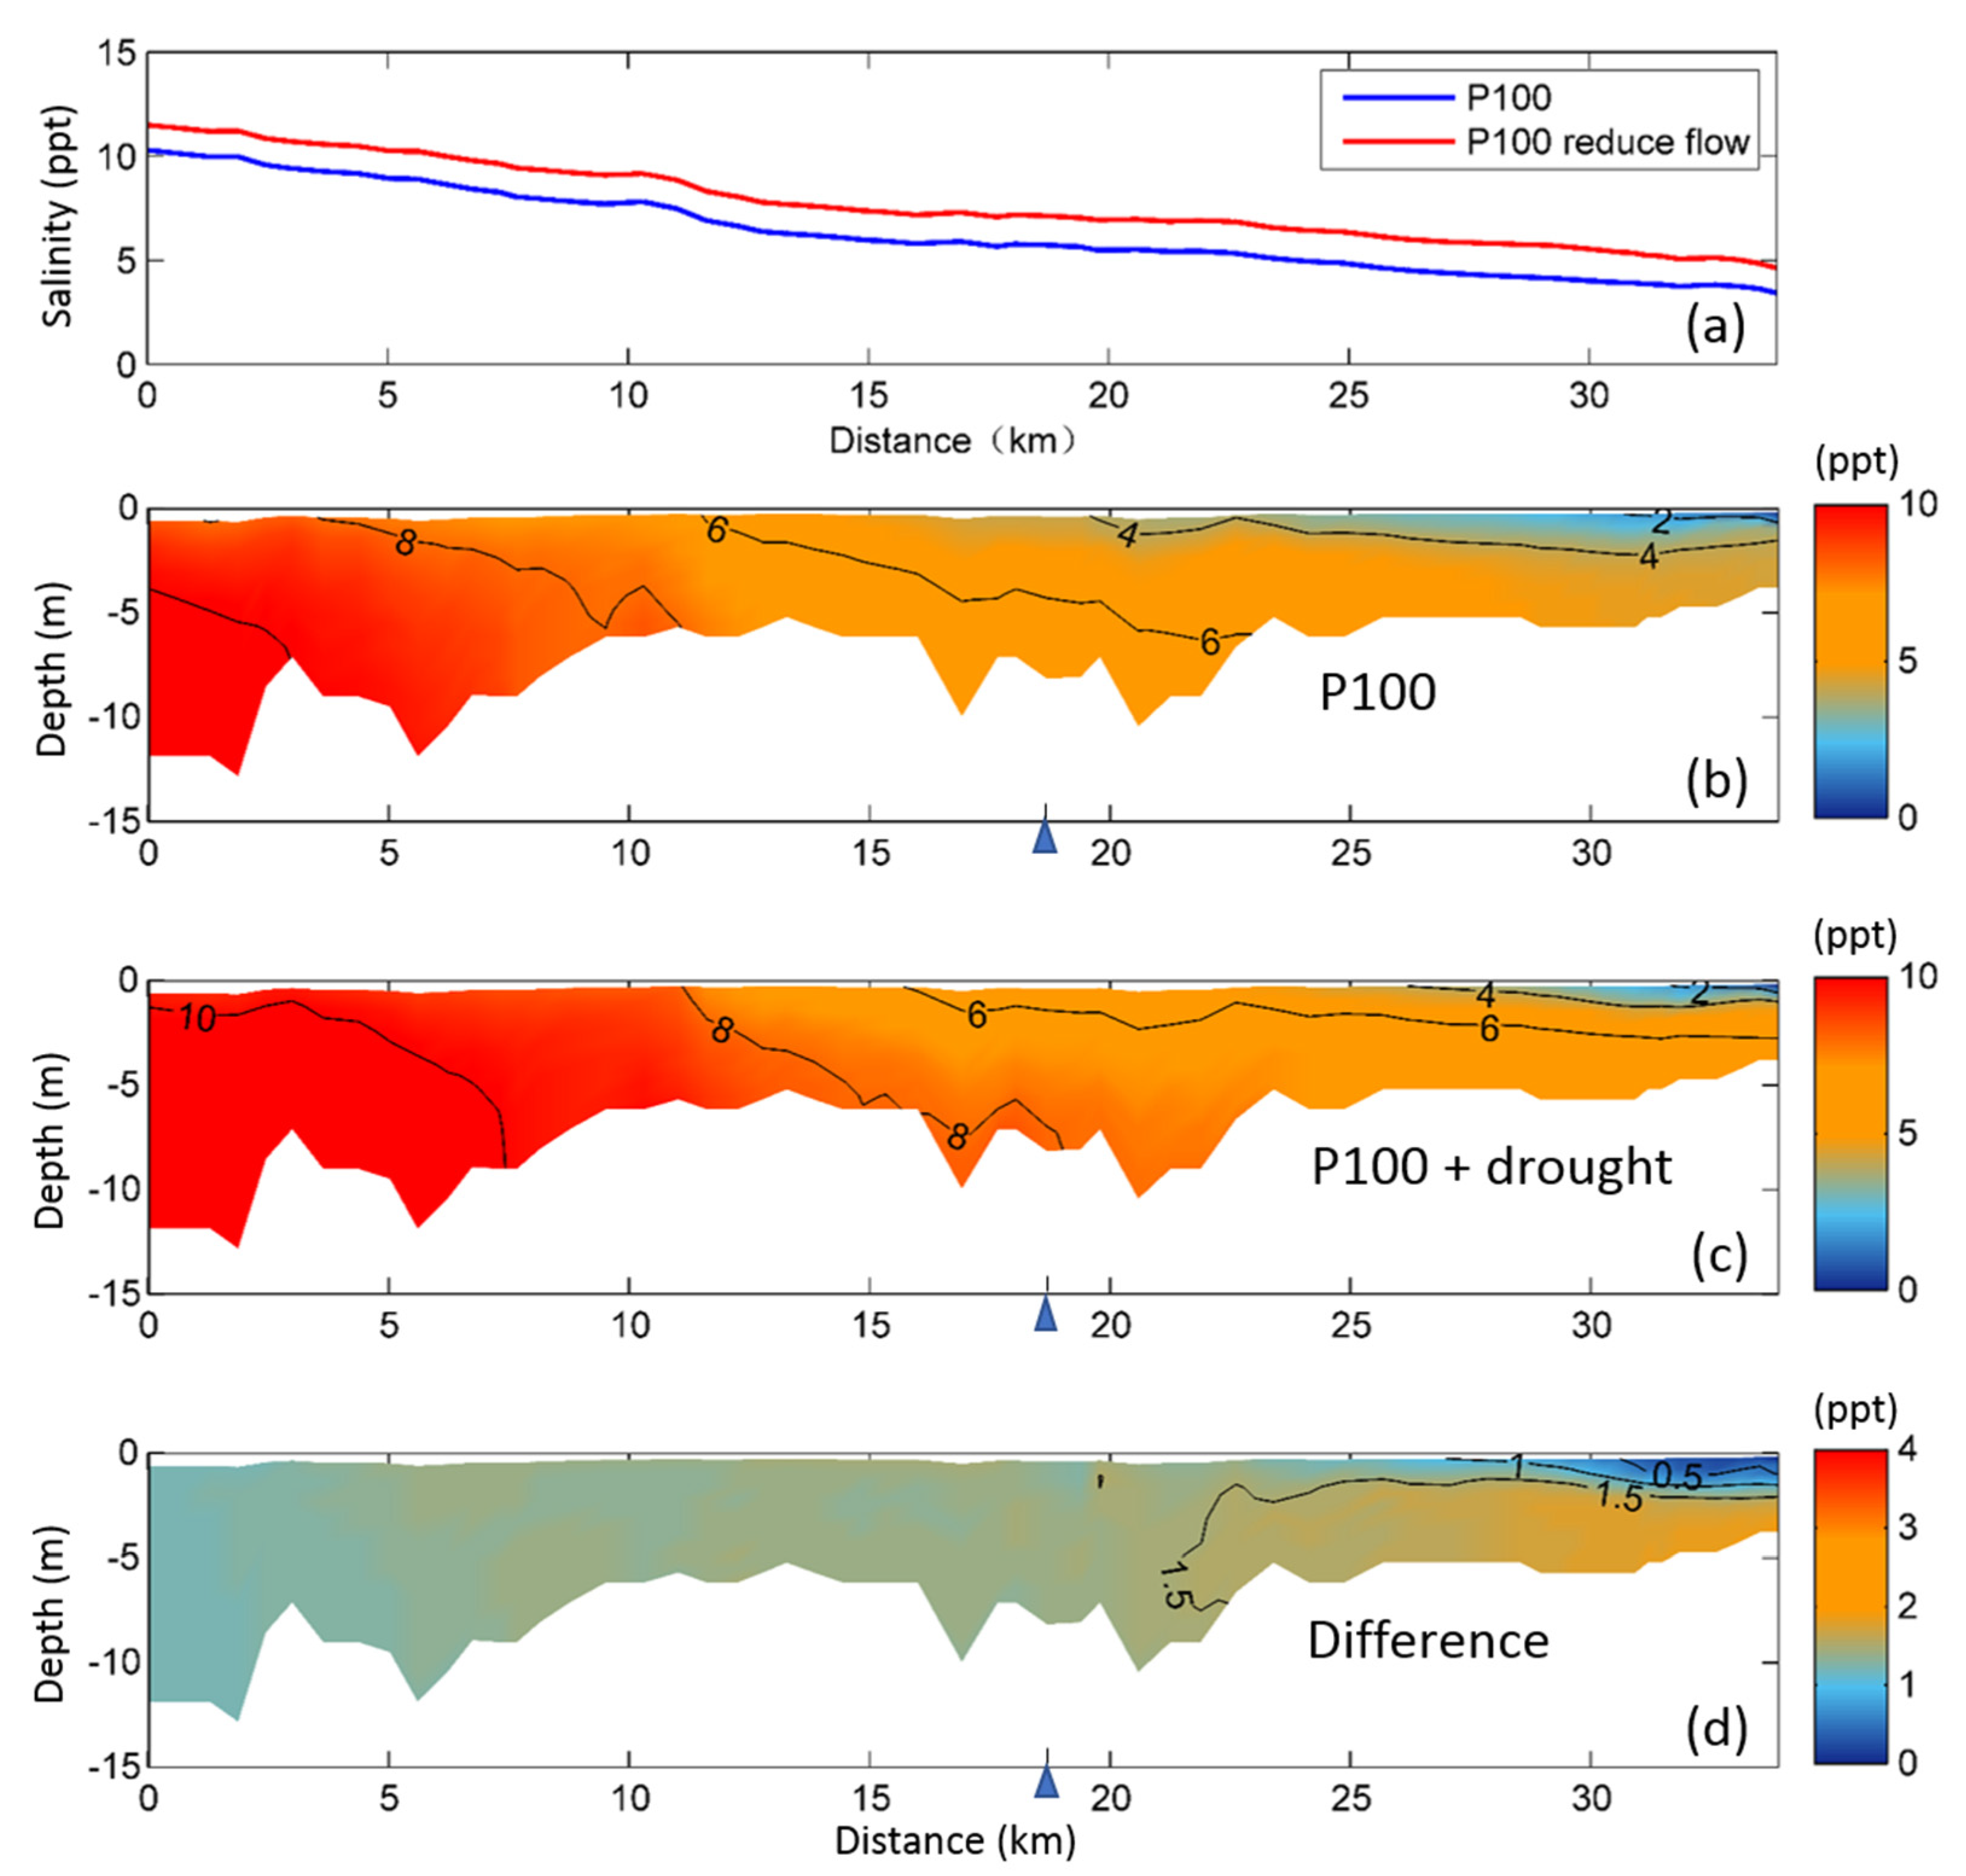
To examine the combined effect of future drought and sea-level rise on the PRE, model simulations of an extreme condition were performed by reducing the winter river flow (December, January, and February) by 30% to mimic a short-term drought, combined with a 100-cm sea-level rise. Figure 10 shows the salinity distribution along the tributary where Xintang is located with and without reduced winter flow. A winter drought would allow saline water to migrate further upstream during January, with the increase in the depth-averaged salinity being slightly higher in the upstream than in the downstream (Figure 10a). The monthly mean vertical salinity profiles indicate that the drought would result in the 6-ppt isohaline shifting landward by approximately 13 km in the bottom layer (Figure 10b,c). With drought, the salinity increase will be greater than 1.5 ppt in the upstream bottom layer (Figure 10d). The results along the tributaries where other drinking-water intake stations are located show similar behaviour (figures not shown).
Sea-level rise superimposed on a drought event is highly likely to occur in the PRE under the background of climate change. Our results indicate that this combined effect would further reduce the availability of freshwater in the upper tributaries. In addition, the current area of brackish water would be occupied instead by saline water. The water supply for municipal and industrial use during the winter dry season would be greatly challenged by 2100.
5.3. Salinity Change Caused by Amplified Tidal Range
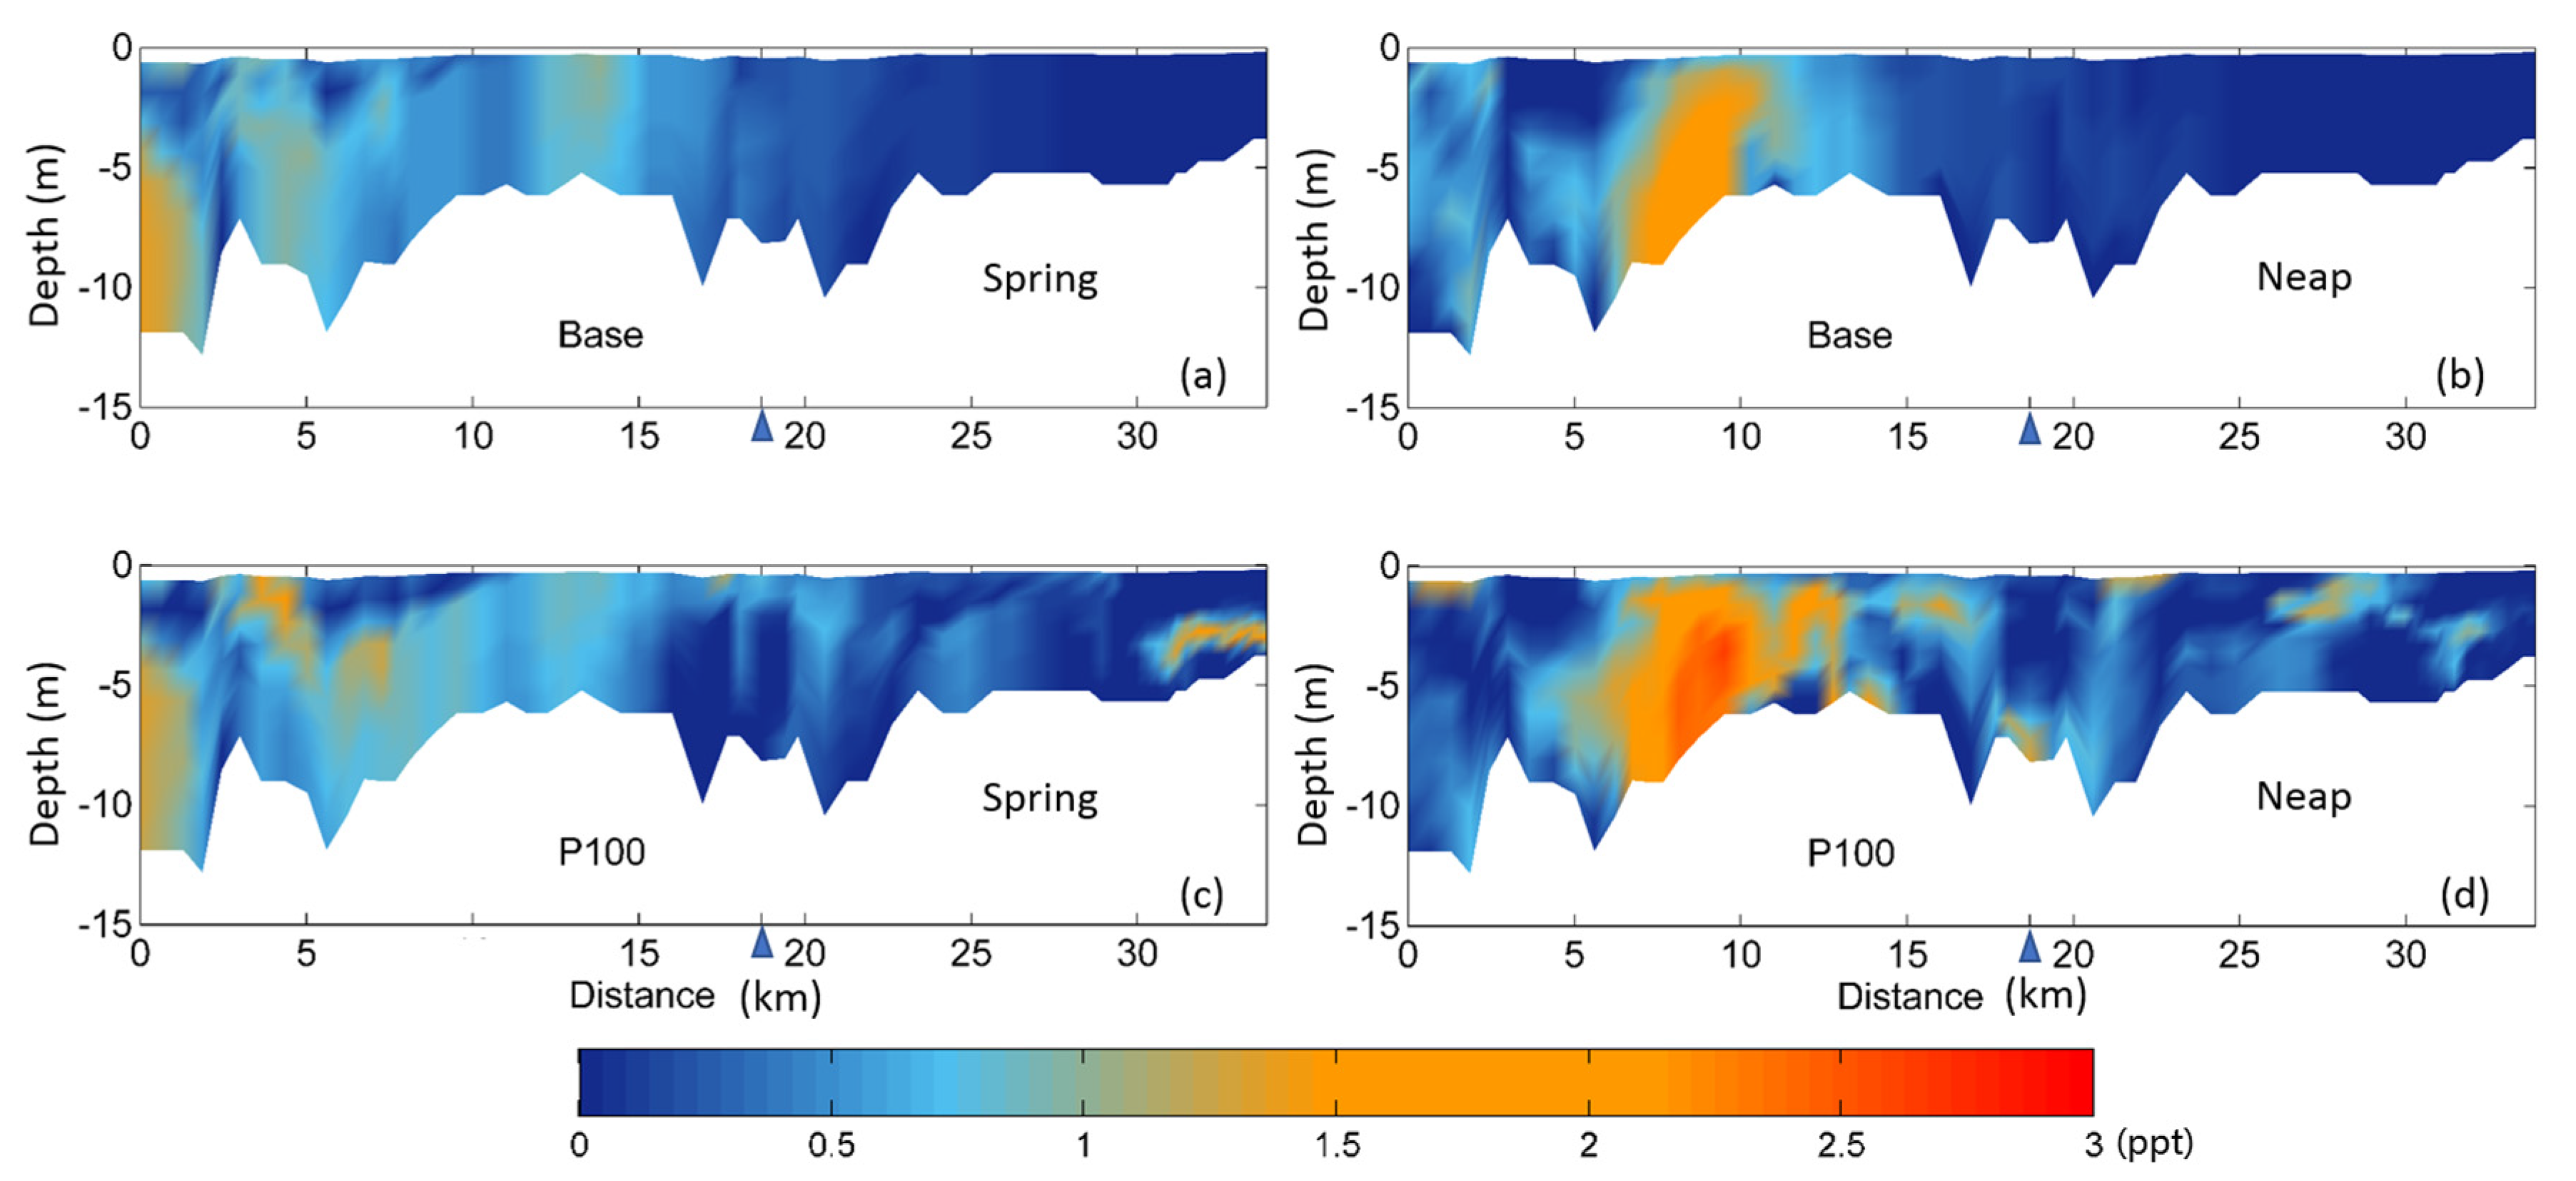
The study of Hong et al. [7] revealed that the tidal range and tidal current in the PRE would increase as the sea level rises. Such increase would be amplified in the upstream, with the greatest increase occurring in the upper tributaries [7]. Similar phenomena were also predicted for the Chesapeake Bay [8,44]. It is worthwhile to examine the salinity change caused by the amplified tidal range. The landward transport of saline water during a flood tide can be used as an index to measure the potential upstream salt transport in the tidal scale. For this purpose, is used to represent the salinity increase (= St2 − St1) at the end of a flood tide (St2) relative to the value at the beginning of a flood tide (St1). Figure 11 shows the vertical profiles of along the tributary where Xintang is located. Both the typical spring (21 January 2008) and typical neap (31 January 2008) tidal conditions are considered. An obvious change in is observed in the cases with and without sea-level rise. Generally, a larger value is obtained in the sea-level rise case (Figure 11c,d) than in the base case (Figure 11a,b). The flood tide can transport more saline water upstream as the sea level rises. More notable changes in are observed during the neap tide (Figure 11b,d) than those during the spring tide (Figure 11a,c), which indicates that sea-level rise has a stronger impact on the tidal upstream salinity transport during neap tide than during spring tide.
Our results indicate that sea-level rise causes salinity increases not only through stronger gravitational circulation, but also through the stronger upstream salinity transport during flood tide, especially during neap tide. This increase in the flood tidal salinity transport would have a great impact on the tidal freshwater wetlands in the upper reaches of estuaries, as more saline water can be brought into the tidal freshwater wetlands during flood tide. The water quality and drinking-water intake in these area are more vulnerable to sea-level rise. Forecasting the climate change impact on the upper freshwater resources is vital for ensuring that appropriate river management decisions are made.
6. Conclusions
The threat posed by future sea-level rise to the freshwater resources in the upper PRE was evaluated in this study based on the results obtained by a fully calibrated three-dimensional numerical model. Sea-level rise predictions for 2100 from the IPCC report were used in the model to simulate the effects of sea-level rise. In the upper reaches of the PRE, there are numerous densely populated cities, factories, and farm lands. Four drinking-water intake stations in the upstream tributaries provide water supply to the region. The model results clearly indicated that the sea-level rise will strengthen the saltwater intrusion, and bring saline water to areas in which there was previously only freshwater existed. Both the intensity and duration of dry-season saltwater intrusion into the drinking-water intake stations will be greatly increased. Water at these stations would not be suitable for the municipal supply until the onset of the wet season. Among the four stations, Xintang is most vulnerable to the impact by sea-level rise. The most significant increase in the salinity during the dry season is predicted to occur 40 to 110 km upstream of the PRE mouth. The salt intrusion length in the tributary where Xintang is located is predicted to increase approximately 10 and 18 km with sea-level rises of 50 and 100 cm, respectively. The mean salinity increase at Xintang would be approximately 2 and 4.2 ppt for the 50- and 100-cm sea-level rises, respectively. Sea-level rise will have more notable impacts on the 1- and 3-ppt isohalines than on the 6-ppt isohaline. Changes in the spatial distribution of isohalines indicate an obvious decrease in brackish water.
A freshwater allocation method has been adopted by the local government to suppress dry-season saltwater intrusion in the PRE. A series of model simulations were conducted to assess the effect of flow allocation under the background of sea-level rise. The results showed that as the sea level rises 100 cm, the salinity will exceed 0.45 ppt for approximately four months at the real river flow. With flow modulation, however, the duration of the period with salinity >0.45 ppt would be greatly reduced. The relationship between river flow and depth-averaged salinity at each drinking-water intake station indicated that as river flow increases, the salinity at each station will decrease exponentially. Based on this exponential relationship, we estimated the amount of flow needed to suppress dry-season saltwater intrusion under the background of sea-level rise. The number of days in which water meets the drinking-water standard decreases as the sea level rises but increases as the river flow increases. At Xintang, a flow of 7000 m3/s results in 122 days of safe drinking water in the P50 case but only 102 days in the P100 case. With river flow modulations, the responses of Xintang and Dongyong delay those of Shixi and Shawan. In addition to the magnitude of the river flow, the duration of high flow is also an important factor for maintaining water that meets the drinking-water intake standard. A one-week flow pulse of 7500 m3/s cannot effectively suppress saltwater intrusion and its impact is confined to the upper layer of the water column as the sea level rises 100 cm.
An extreme case was conducted to evaluate the combined effect of future drought and sea-level rise on the PRE. Future drought would further reduce the availability of freshwater in the upper tributaries. When the winter river flow is reduced by 30%, the 6-ppt isohaline shifts landward by approximately 13 km and the salinity increase can be greater than 1.5 ppt in the bottom layer of the tributary where Xintang is located. Sea-level rise causes salinity to increase not only through stronger gravitational circulation, but also through the stronger upstream salinity transport during flood tide, and especially during neap tide. This increase would greatly impact tidal freshwater wetlands, and correspondingly impact water quality and municipal supply.
Author Contributions
Conceptualization, B.H.; methodology, B.H. and J.W.; validation, B.H. and J.W.; formal analysis, J.W. and B.H.; investigation, J.W. and B.H.; resources, B.H.; data curation, J.W.; writing—original draft preparation, J.W. and B.H.; writing—review and editing, B.H.; visualization, J.W.; supervision, B.H.; project administration, B.H.; funding acquisition, B.H. All authors have read and agreed to the published version of the manuscript.
Funding
This research was funded by the National Natural Science Foundation of China (Grant Nos. 41976014, 51761135021, 41406005), the Key Research Program of Frontier Sciences, Chinese Academy Sciences (No. QYZDJ-SSW-DQC022).
Data Availability Statement
Conceptualization, B.H.; methodology, B.H. and J.W.; validation, B.H. and J.W.; formal analysis, J.W. and B.H.; investigation, J.W. and B.H.; resources, B.H.; data curation, J.W.; writing—original draft preparation, J.W. and B.H.; writing—review and editing, B.H.; visualization, J.W.; supervision, B.H.; project administration, B.H.; funding acquisition, B.H. All authors have read and agreed to the published version of the manuscript.
Acknowledgments
Data available on request due to restrictions. The data presented in this study are available on request from the corresponding author. The data are not publicly available due to privacy.
Conflicts of Interest
The authors declare no conflict of interest.
References
- Church, J.A.; Monselesan, D.; Gregory, J.M.; Marzeion, B. Evaluating the ability of process based models to project sea-level change. Environ. Res. Lett. 2013, 8, 014051. [Google Scholar] [CrossRef]
- Church, J.A.; White, N.J. A 20th century acceleration in global sea-level rise. Geophys. Res. Lett. 2006, 33, L01602. [Google Scholar] [CrossRef]
- Woodworth, P.; Gehrels, W.; Nerem, R. Nineteenth and twentieth century changes in sea level. Oceanography 2011, 24, 80–93. [Google Scholar] [CrossRef]
- IPCC. Climate Change 2014: Mitigation of Climate Change. Contribution of Working Group III to the Fifth Assessment Report of the Intergovernmental Panel on Climate Change; Edenhofer, O., Pichs-Madruga, R., Sokona, Y., Farahani, E., Kadner, S., Seyboth, K., Adler, A., Baum, I., Brunner, S., Eickemeier, P., et al., Eds.; Cambridge University Press: Cambridge, UK; New York, NY, USA.
- Nicholls, R.J.; Marinova, N.; Lowe, J.A.; Brown, S.; Vellinga, P.; de Gusmao, D.; Hinkel, J.; Tol, R.S.J. Sea-level rise and its possible impacts given a ‘beyond 4oc world’ in the twenth-first century. Philos. Trans. R. Soc. Lond. 2011, 369, 161–181. [Google Scholar]
- Hai, T.X.; Nghi, V.V.; Hung, V.H.; Tuan, D.N.; Lam, D.T.; Van, C.T. Assessing and forecasting saline intrusion in the Vietnamese Mekong Delta Under the impact of upstream flow and sea level rise. J. Environ. Sci. Eng. B 2019, 8, 174–185. [Google Scholar]
- Hong, B.; Liu, Z.H.; Shen, J.; Wu, H.; Gong, W.P.; Xu, H.Z.; Wang, D.X. Potential physical impacts of sea-level rise on the Pearl River Estuary, China. J. Marine Syst. 2020, 201, 103245. [Google Scholar] [CrossRef]
- Hong, B.; Shen, J. Responses of estuarine salinity and transport processes to potential future sea-level rise in the Chesapeake Bay. Estuar. Coast. Shelf Sci. 2012, 104-105, 33–45. [Google Scholar] [CrossRef]
- Mills, L.; Janeiro, J.; Neves, A.; Martins, F. The impact of sea level rise in the Guadiana Estuary. J. Comput. Sci. 2020, 44, 101169. [Google Scholar] [CrossRef]
- Poff, N.L.; Brinson, M.M.; Day, J.W., Jr. Aquatic Ecosystems and Global Climate Change: Potential Impacts on Inland Freshwater and Coastal Wetland Ecosystems in the United States; Pew Center on Global Climate Change: Washington, DC, USA, 2002; 45p, Available online: http://rydberg.biology.colostate.edu/wpoff/Public/poffpubs/Poff2002(PEW_AquaticEcosys).pdf (accessed on 25 February 2019).
- Rice, K.C.; Hong, B.; Shen, J. Assessment of salinity intrusion in the James and Chickahominy rivers as a result of simulated sea-level rise in Chesapeake Bay, East coast, United States. J. Environ. Manag. 2012, 111, 61–69. [Google Scholar] [CrossRef]
- Langevin, C.; Zygnerski, M. Effect of sea-level rise on salt water intrusion near a coastal well field in southeastern Floda. Groundwater 2013, 51, 781–803. [Google Scholar] [CrossRef] [PubMed]
- Grabemann, H.; Grabemann, I.; Herbers, D.; Muller, A. Effects of a specific climate scenario on the hydrography and transport of conservative substances in the Weser estuary, Germany: A case study. Clim. Res. 2001, 18, 77–87. [Google Scholar] [CrossRef] [Green Version]
- Bhuiyan, M.; Dutta, D. Assessing impacts of sea level rise on river salinity in the Gorai River network, Bangladesh. Estuar. Coast. Shelf Sci. 2012, 96, 219–227. [Google Scholar] [CrossRef]
- Chen, W.B.; Liu, W.C.; Hsu, M.H. Modeling assessment of a saltwater intrusion and a transport time scale response to sea-level rise in a tidal estuary. Environ. Fluid Mech. 2015, 15, 491–514. [Google Scholar] [CrossRef]
- Xiao, H.; Huang, W.; Johnson, E.; Lou, S.; Wan, W. Effects of sea level rise on salinity intrusion in St. Marks River Estuary, Florida, U.S.A. J. Coast. Res. 2014, 98, 89–96. [Google Scholar] [CrossRef]
- Najjar, R.G.; Pyke, C.R.; Adams, M.B.; Breitburg, D.; Hershner, C.; Kemp, M.; Howarth, R.; Mulholland, M.R.; Paolisso, M.; Secor, D.; et al. Potential climate-change impacts on the Chesapeake Bay. Estuar. Coast. Shelf Sci. 2010, 86, 1–20. [Google Scholar] [CrossRef]
- Hilton, T.W.; Najjar, R.G.; Zhong, L.; Li, M. Is there a signal of sea-level rise in Chesapeake Bay salinity? J. Geophys. Res. 2008, 113, C09002. [Google Scholar] [CrossRef] [Green Version]
- Chen, W.; Chen, K.; Kuang, C.P.; Zhu, D.Z.; He, L.L.; Mao, X.D.; Liang, H.D.; Song, H.L. Influence of sea level rise on saline water intrusion in the Yangtze River Estuary, China. Appl. Ocean. Res. 2016, 54, 12–25. [Google Scholar] [CrossRef]
- Gong, W.P.; Maa, P.Y.; Hong, B.; Shen, J. Salt transport during a dry season in the Modalmen Estuary, Pearl River Delta, China. Ocean. Coast. Manag. 2014, 100, 139–150. [Google Scholar] [CrossRef]
- Gong, W.P.; Lin, Z.Y.; Chen, Y.Z.; Chen, Z.Y.; Zhang, H. Effect of winds and waves on salt intrusion in the Pearl River estuary. Ocean. Sci. 2018, 14, 139–159. [Google Scholar] [CrossRef] [Green Version]
- Wei, X.Y.; Zhu, Y.L.; Zhang, W.; Sun, S.W. Numerical simulation of salt flux in dry season in the Pearl River Delta. Trop. Geogr. 2012, 32, 216–222. [Google Scholar]
- Zhang, W.; Feng, H.; Zheng, J.; Hoitink, A.; Van Der Vegt, M.; Zhu, Y.; Cai, H. Numerical simulation and analysis of saltwater intrusion lengths in the Pearl River Delta, China. J. Coast. Res. 2013, 29, 372–382. [Google Scholar] [CrossRef]
- Zhao, H. The Evolution of the Pearl River Estuary; China Ocean Press: Beijing, China, 1990; pp. 1–357. [Google Scholar]
- Liu, Z.; Huang, G.; Gao, S. Physical model research on water dispatch in dry season in Pearl River mouth area. Pearl. River 2009, 27–28. [Google Scholar]
- Xiao, D.C.; Jia, H.F.; Wang, Z. Modeling Megacity Drinking Water Security under a DSS Framework in a Tidal River at the North Pearl River Delta, China. J. Am. Water Resour. Assoc. 2015, 51, 637–654. [Google Scholar] [CrossRef]
- Wang, Y. Summary of the emergency water diversion of the Pearl River in 2006. Pearl River 2006, 27, 6. [Google Scholar]
- He, J.J.; Liu, F.Q. Numerical simulation on salt water intrusion in Yangtze River Estuary by Three Gorges Reservoir Discharge in dry season. J. Green Sci. Technol. 2017, 000, 43–48. [Google Scholar]
- Mao, Q.; Shi, P.; Yin, K.; Gan, J.; Qi, Y. Tides and tidal currents in the Pearl River estuary. Cont. Shelf Res. 2004, 24, 1797–1808. [Google Scholar] [CrossRef]
- Brinkhoff, T. Major Agglomerations of the World. Available online: https://www.citypopulation.de/en/world/agglomerations/ (accessed on 13 October 2020).
- Hamrick, J.M.; Wu, T.S. Computational design and optimization of the EFDC/HEM3D surface water hydrodynamic and eutrophication models. In Next Generation Environmental Models and Computational Methods; Delich, G., Wheeler, M.F., Eds.; Society for Industrial and Applied Mathematics: Philadelphia, PA, USA, 1997; pp. 143–161. [Google Scholar]
- Mellor, G.L.; Yamada, T. Development of a turbulence closure model for geophysical fluid problems. Rev. Geophys. Space Phys. 1982, 20, 851–875. [Google Scholar] [CrossRef] [Green Version]
- Shen, J.; Haas, L. Calculating age and residence time in the tidal York River using three-dimensional model experiments. Estuar. Coast. Shelf Sci. 2004, 61, 449–461. [Google Scholar] [CrossRef]
- Wang, Y.; Shen, J.; He, Q. A modeling study of the variation of the transport timescale and change of estuarine circulation due to human impact in the Changjiang Estuary, China. J. Mar. Syst. 2010, 82, 154–170. [Google Scholar] [CrossRef]
- Xia, M.; Xie, L.; Pietrafesa, L.J.; Whitney, M.M. The ideal response of a Gulf of Mexico estuary plume to wind forcing: Its connection with salt flux and a Lagrangian view. J. Geophys. Res. 2011, 116, C08035. [Google Scholar] [CrossRef]
- Hong, B.; Shen, J. Linking dynamics of transport timescale and variations of hypoxia in the Chesapeake. J. Geophys. Res. 2013, 118, 1–13. [Google Scholar] [CrossRef] [Green Version]
- Cheng, Z.L. Decadal variation of hydrological status in stream network area and the eight outlets of Pearl River Delta. Acta Sci. Nat. Univ. Sunyatseni 2001, 40 (Suppl. S2), 29–31. (In Chinese) [Google Scholar]
- Wong, L.; Chen, J.; Xue, H.; Dong, L.; Su, J.; Heinke, G. A model study of the circulation in the Pearl River estuary (PRE) and its adjacent coastal waters: 1. Simulations and comparison with observations. J. Geophys. Res. 2003, 108, 3156. [Google Scholar] [CrossRef]
- Zhai, W.; Dai, M.; Cai, W.-J.; Wang, Y.; Wang, Z. High partial pressure of CO2 and its maintaining mechanism in a subtropical estuary: The Pearl River estuary. China. Mar. Chem. 2005, 93, 21–32. [Google Scholar] [CrossRef]
- Yin, X.L.; Zhang, H.W.; Fang, H.W. Hydrodynamic analysis and control on saline water intrusion in Modaomen waterway during the dry season. Chinese J. Hydrodyn. Ser. A 2008, 23, 554–559. [Google Scholar]
- Ralston, D.; Geyer, R.; Lerczak, J. Subtidal salinity and velocity in the Hudson River Estuary: Observations and Modeling. J. Phys. Oceanogr. 2008, 38, 753–770. [Google Scholar] [CrossRef]
- Zhi, X.; Jing, M.; Hao, W.; Yajie, H.; Guiyu, Y.; Wei, D. River discharge and saltwater intrusion level study of Yangtze River estuary, china. Water 2018, 10, 683. [Google Scholar]
- Wang, Z.; Zhong, R.; Lai, C.; Zeng, Z.; Lian, Y.; Bai, X. Climate change enhances the severity and variability of drought in the Pearl River Basin in South China in the 21st century. Agr. Forest Meteorol. 2018, 249, 149–162. [Google Scholar] [CrossRef]
- Du, J.B.; Shen, J.; Zhang, Y.J.; Ye, F.; Liu, Z.; Wang, Z.G.; Wang, Y.P.; Yu, X.; Sisson, M.; Wang, H.V. Tidal response to sea-level rise in different types of estuaries: The importance of length, bathymetry, and geometry. Geophys. Res. Lett. 2018, 45, 227–235. [Google Scholar] [CrossRef] [Green Version]
Figure 1.
(a) Bathymetry of Pearl River Estuary (PRE), which includes eight outlets (Humen, Jiaomen, Hongqili, Hengmen, Modaomen, Jitimen, Hutiaomen, and Yamen). The Humen Channel connects the upper tributaries to the downstream estuary (Lingding Bay). The transect along the main channel of the estuary is approximately 120 km from the mouth to the head. The red pentangle in the Humen Channel indicates the location of station A for later analyses. (b) Model grids covering the entire PRE and adjacent shelf water of the northern South China Sea. (c) Locations of drinking-water intake stations for the four waterworks (Xintang, Shixi, Dongyong, and Shawan) in the upper tributaries of the PRE. The transect along the tributary where Xintang is located is used for later analyses.

Figure 2.
(a) River flow of the PRE from 1 January 2007 to 30 April 2008. (b) Flow modulation strategy, with the threshold value set to 3000, 3400, 3600, 4000, 4400, 4800, 5200, 5600, 6000, and 7000 m3/s for each case. When the measured river flow is lower than the threshold value, the flow is set equal to the threshold value, whereas if it is higher than the threshold value, the flow remains unchanged.

Figure 3.
Depth–time variations of salinity at stations in Xintang (a), Shixi (b), Dongyong (c), and Shawan (d) (see Figure 1b for the location of each station). Results are shown for the base case and each sea-level rise case. The contour lines indicate salinities of 0.45, 3, and 6 ppt. For reference, the measured river flow at the corresponding time is shown in the top panel.

Figure 4.
(a) Mean salinity along the transect in the main channel of the PRE (see Figure 1a for the location) for the base case and each sea-level rise case; (b) the increase in the mean salinity along the transect in the main channel of the PRE in each Scheme 1. c for the location); (d) same as (b) but for the transect along the tributary where Xintang is located. The results are average values from January 2008. The triangles indicate the location of station A (a,b) and Xintang (c,d) in each panel.

Figure 5.
Locations of depth-averaged salinity isohalines in the upper reaches of the PRE for the base case and each sea-level rise case. (a) 1 ppt; (b) 3 ppt; (c) 6 ppt. The results are average values from January 2008.
Figure 5.
Locations of depth-averaged salinity isohalines in the upper reaches of the PRE for the base case and each sea-level rise case. (a) 1 ppt; (b) 3 ppt; (c) 6 ppt. The results are average values from January 2008.

Figure 6.
Responses of salinity to the flow modulation under the 100-cm sea-level-rise scenario. (a) Xintang; (b) Dongyong; (c) Shixi; (d) Shawan. Results from the real flow and each flow-modulation case are presented. The cases with river flows of 3600, 4400, 5200, 6000, and 7000 m3/s are referred to as R3600, R4400, R5200, R6000, and R7000, respectively.

Figure 7.
Exponential relationship between the river flow and salinity at Xingtang (a), Dongyong (b), Shixi (c), and Shawan (d). The results are obtained under the 50- and 100-cm sea-level-rise scenarios, respectively. The threshold rates of river flow are set to 3000, 3400, 3600, 4000, 4400, 4800, 5200, 5600, and 6000 m3/s, respectively.

Figure 8.
Number of days for which water meets the drinking-water standard (salinity < 0.45 ppt) at Xintang (a), Dongyong (b), Shixi (c), and Shawan (d), in response to flow modulation. The statistical results are based on the period 1 December 2007 to 31 March 2008 (122 days in total). The base case and each sea-level rise case are presented.

Figure 9.
Vertical profiles of salinity (ppt) in the base case (a) and salinity increase in each sea-level rise case relative to the base case (b,c) along the tributary where Xintang is located. The results are averaged from 6 February 2008, the day after the flow pulse reached a peak. The triangle indicates the location of Xintang.

Figure 10.
(a) Change in the mean salinity distribution with and without flow reduction in the tributary where Xintang is located for 100-cm sea-level rise; salinity vertical profile along the tributary where Xintang is located for (b) 100-cm sea-level rise with real flow; (c) 100-cm sea-level rise with 30% reduction of flow in winter; and (d) the salinity difference between (c,b), indicating the change of salinity under extreme conditions. The results are averaged from January 2008. The triangle indicates the location of Xintang.

Figure 11.
Vertical profiles of salinity change ( = St2 − St1) during a flood tide along the tributary where Xintang is located. Here, St1 represents the salinity at the beginning of the flood tide and St2 that at the end of the flood tide. The results obtained during a typical spring tide (a,c) and typical neap tide (b,d), for the base case (a,b) and the case with 100-cm sea-level rise (c,d). The triangle indicates the location of Xintang.

Publisher’s Note: MDPI stays neutral with regard to jurisdictional claims in published maps and institutional affiliations. |
© 2021 by the authors. Licensee MDPI, Basel, Switzerland. This article is an open access article distributed under the terms and conditions of the Creative Commons Attribution (CC BY) license (http://creativecommons.org/licenses/by/4.0/).
Share and Cite
MDPI and ACS Style
Wang, J.; Hong, B. Threat Posed by Future Sea-Level Rise to Freshwater Resources in the Upper Pearl River Estuary. J. Mar. Sci. Eng. 2021, 9, 291. https://0-doi-org.brum.beds.ac.uk/10.3390/jmse9030291
AMA Style
Wang J, Hong B. Threat Posed by Future Sea-Level Rise to Freshwater Resources in the Upper Pearl River Estuary. Journal of Marine Science and Engineering. 2021; 9(3):291. https://0-doi-org.brum.beds.ac.uk/10.3390/jmse9030291
Chicago/Turabian StyleWang, Jiaxi, and Bo Hong. 2021. "Threat Posed by Future Sea-Level Rise to Freshwater Resources in the Upper Pearl River Estuary" Journal of Marine Science and Engineering 9, no. 3: 291. https://0-doi-org.brum.beds.ac.uk/10.3390/jmse9030291
Note that from the first issue of 2016, this journal uses article numbers instead of page numbers. See further details here.