1. Introduction
In the last few decades, the coastal engineering profession has promoted solutions for the protection of the areas exposed to severe wave attack through the use of concrete armor units (CAUs) in the armor layers of rubble-mound breakwaters. Currently, more than 100 different types of CAU are available, each one characterized by specific shapes and properties [
1]. It is possible to consult engineering manuals (e.g., [
2,
3,
4,
5]) which provide descriptive guides of the most popular blocks. A recent development in the design of breakwater concrete units has been to prioritize unit shapes that can remove altogether the issue of subjectivity in the CAU armor layer placement and construction quality control. This has resulted in an additional sub-group of fixed orientation and location ‘pattern-placed’ units such as the XblocPlus [
6] and C-roc [
7]. While receiving considerable interest, the practical application and widespread adoption of such pattern-placed units as an alternative to popular irregularly placed unit solutions are uncertain. For clarity, this paper does not address the pattern-placed subgroup; rather, it refers to the vast majority of CAU types in use, which rely on a more flexible placement: one that accommodates pseudo-randomness of orientation during placement, i.e., in a manner most widely associated with concrete armor layers for rubble-mound designs. Examples would include Dolos, Tetrapod, (the original slender type associated with double layers); Accropode I, Core-loc, X-bloc, Accropode II, (more robust type associated with single layer solutions); and Cube, Antifer cube, Cubipod, and others. The choice of CAU for a project does not arise simply by following objective quantitative criteria; the type of block has to be selected at the designer’s discretion, i.e., there is no objective decision tree to follow that leads to the best unit for the job. It is not only the hydraulic stability, as traditionally predicted with use of a K
D or similar stability factor, but also the structural integrity that should be taken into consideration for CAU selection [
8], because no matter how high the packing density or the placing tolerances achieved, the possibility of a significant number of rocking units under storm conditions cannot be discounted. The scientific and engineering community is, therefore, looking for a way to select the type of CAU that better balances hydraulic stability and structural integrity. This is because the maximum stress within a concrete unit that may cause it to crack is not necessarily linked directly to the ‘averaged’ hydrodynamic loads assumed from knowledge of the incoming wave parameters or the static contact forces from the weight of overlying or neighbor units. Rather, it is likely to be a consequence of stochastic time and space variations in unit stability and the impact loads caused by the unavoidable collisions between CAUs while rocking or rolling under storm conditions. Where and when hydraulic loads from drag, inertia, and buoyancy exceed the combined resistance forces of its weight and the frictional and interlocking contact forces mobilized with neighbor units, locally varying unit displacements and, hence, rocking and rolling impacts may occur. The proportion of units exhibiting rocking, therefore, depends on the storm event severity, the inherent conservatism in the design, the type of units, and the construction quality achieved in meeting the unit designer’s construction specification. In one extreme example in the early days of deploying Core-Locs and before tighter packing densities were adopted for Core-Loc structures, the small Port St Francis breakwater suffered 35 broken units from 800. The high breakage was mostly attributed to the storm arriving during construction and the low dimensionless packing density of 0.58 adopted [
9].
Currently, progress is being made in evaluating the potential crack arrest advantages of applying polypropylene fiber-reinforced concrete to armor units [
10]. However, the mass of concrete needed in breakwater units means that it has not yet been proven that it would be economically viable in a mass casting operation to use such polypropylene fiber-reinforced concrete. Therefore, whether a given rocking gives rise to cracking and breakages depends on the subjectively assessed ‘robustness’ characteristics of the unit’s shape, i.e., the susceptibility of the particular unit shape to amplify tensile and shear stress to critical levels if loaded with a sharp knock from a neighbor unit. It also depends on the unit’s relative size and, hence, the rocking impact magnitude, together with the concrete strength. If the high dynamic tensile and shear stresses cause breakages such that interlock between units is then impaired and, over time, areas become loosened, this can become very dangerous for the armor layer integrity and possibly lead to a major unravelling of the cover layer and eventual failure of the breakwater.
Therefore, an objective measure of structural integrity or structural robustness of the building blocks of the rubble-mound armor layer, which is essentially a massive granular material, i.e., CAUs, needs to be demonstrated to the breakwater owner, even if it is neither easy to be defined in detail nor quantified. The scaling theory demonstrated in Burcharth and Brejnegaard-Nielsen (1986) [
11] concluded that the stress level in CAUs attributable to static and hydrodynamic loads increases linearly with CAU size, while impacts generate dynamic stress levels proportional to the square root of the colliding CAU size. Ultimately, if you increase the size of any unit enough, the ‘arms’ or ‘legs’ responsible for the interlocking behavior will crack under their own weights as static stresses in corners and in bending become excessive for the concrete tensile strength, (which can be assumed relatively constant at around 3–4 MPa). The CAU designers, therefore, tend to put a limit on the largest unit size they can recommend because the possible stress amplification with size at the most vulnerable corner sites of their unit is judged to exceed the concrete strength at this upper size limit. For example, amongst the generation of single armor units, the X-bloc has an upper size unit of 48 t, whereas the Accropode II unit comes in unit sizes up to about 70 t. The precise rationale and method to calculate such upper limits and, therefore, how different unit shapes lead to different upper limits is a worthy research topic. Little has been published on this to date, although it is recognized that, so long as significant collision velocities are possible, dynamic stresses have the potential to rise far above static loading stresses and are the main cause of concern.
Unit designers have employed finite element analysis (FEA) to compute stress levels under different loading conditions which have typically been static or dynamic point loading with various displacement controlled boundary conditions to impose flexure and torsion on vulnerable parts of the unit, e.g., see Muttray et al. (2005) [
12], where results for a few different unit types are compared. However, there is no general agreement on the best dynamic loading configuration(s) to apply that would be representative of rocking collisions in a field scenario. What tends to happen in practice today is for the hydraulic stability of the design of a new structure to be presented to the client on the basis of empirical stability formulae and hydraulic stability performance in model-scale tests together with precedent practice. For structural stability, in the absence of more objective methods, it is not uncommon for risk of fracture breakages to be covered under quality control of the construction protocol and an indicative test of the structural integrity of the proposed units under a proxy for in-service dynamic loading. Such proxy testing might be demonstrated by means of drop tests or overturning test of the full-scale unit in nominally repeatable conditions, e.g., at the stocking yard or construction site. The robustness under in-service conditions is then judged on the basis of the unit’s survivability, sometimes after being subjected to repeated drops. This practice is far from satisfactory as engineers need to design on the basis of forces and stresses to be encountered in service. Until numerical models or field experiments of rubble-mounds can reveal the realistic nature of the stochastic variations of forces and stresses in units during storm sea states, the structural integrity of CAUs will continue to be demonstrated by means of drop test experiments, increasingly supported by numerical simulations. Eventually, confidence in the validity of numerical methods to predict resistance of CAU’s to dynamic loads will probably render obsolete the use of physical drop tests which are quite dangerous and expensive. For a fuller discussion of the literature on modeling forces and stresses in armor layers, see Latham et al. (2013) [
13], and for one on modeling CAU breakages, see Guo et al. (2015) [
14].
The research objective of this paper was to take forward the modeling technology of Guo et al. [
14] and apply it to model the behavior of CAU’s when subjected to a free-fall drop test collision, as well as to take advantage of an excellent dataset available in the literature. The three-dimensional fracture model in the context of the FDEM using the recently parallelized version of the code, Solidity, is first calibrated using the results of the field drop tests of a 15 t conventional Cube as provided in the paper by Medina et al. (2011) [
15]. The structural integrity of a 16 t Cubipod is then investigated with the numerical model and results are compared with the observed Cubipod drop test results in a full validation study of the code. It is worth mentioning that, in engineering practice today, numerical and experimental methodologies are considered complementary, and both should be carried out to achieve the best understanding of performance under drop test type conditions.
First, the results of the experimental drop tests submitted by Medina et al. (2011) [
15] are quickly reviewed in
Section 2. Next, in
Section 3, there is a brief description of the three-dimensional fracture model in the context of the FDEM method used to investigate the structural integrity of the units.
Section 4 and
Section 5 respectively describe the setup of the numerical tests and the calibration study of the properties and boundary conditions adopted for the simulated test. The results of the Cube and Cubipod free-fall tests are shown in detail in
Section 6, and the methodology and validation study are discussed in
Section 7. Lastly, conclusions and concluding remarks are given in
Section 8 in the context of future coastal engineering opportunities.
2. Experimental Prototype Drop Tests Provided by Medina et al. (2011)
According to [
15], the Cubipod® is a massive armor unit belonging to the Cube family. The Universitat Politècnica de Valencia (UPV) registered the patent of the Cubipod® unit to the Spanish Patent and Trademark Office (SPTO) in 2005. SATO (OHL Group) is the exclusive holder of the registered trademark license and the patent. Further information is given in the Cubipod® Manual 2016 [
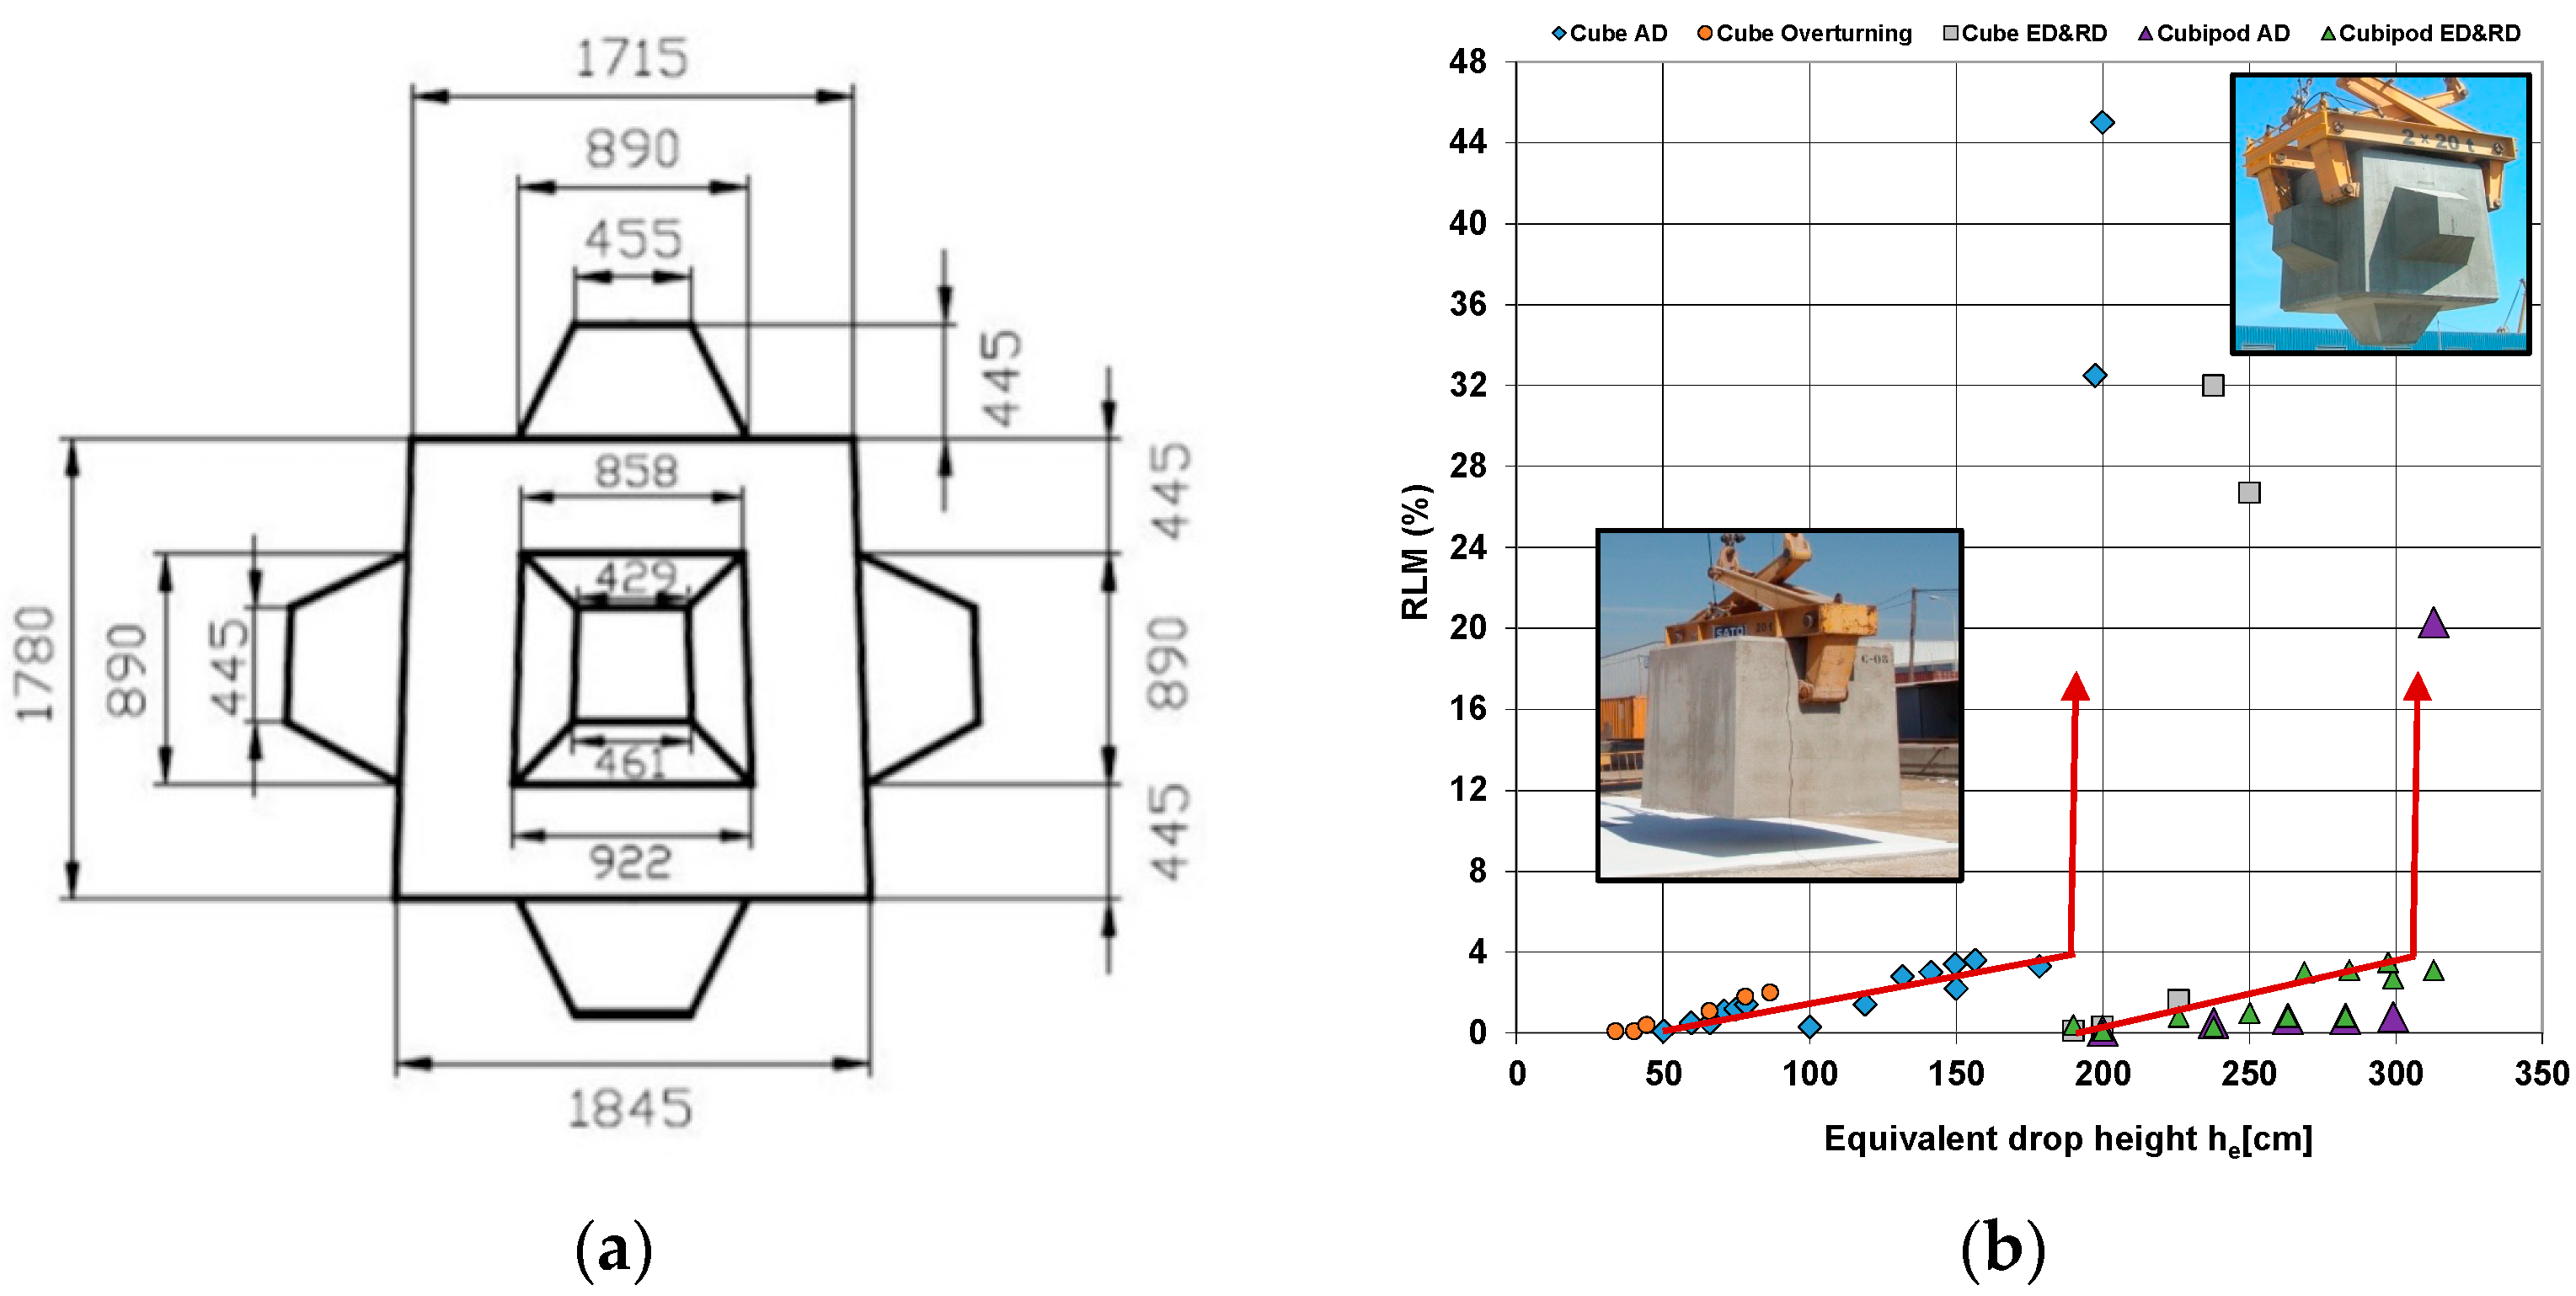
16], which provides its features and the basic criteria for design, manufacture, handling, storage, and placement of this CAU. The Cubipod® does not have an exactly repeating regular symmetry for each cube-facing direction, although it does at first glance appear to be such a regular repeat symmetry shape. The size and dimensions of the prototype analyzed in [
15] are shown in
Figure 1a.
In order to assess the structural strength of the prototype, Medina et al. (2011) [
15] decided to take into consideration drop test methods. In their work, the experimental free-fall drop tests using 15 t Cubic blocks (6.5 m3) and 16 t Cubipod units (7.1 m3) was described. These types of free-fall tests are designed to demonstrate robustness in a repeatable way that can give reassurance of relative performance for scenarios that may arise for collisions between CAUs when rocking and rolling, as well as the impacts generated during handling, transport, and placing of the blocks on the armor layer. Of course, there are many types of tests that can simulate dynamic load conditions, e.g., the overturning test, the hammer drop test, or the pendulum test originally investigated for the Dolos unit by Burcharth [
17] and further discussed in breakage simulations by Guo, Latham, and Xiang [
14].
Medina et al. (2011) [
15] performed three different free-fall tests in their work, whose results are summarized in
Figure 1b, which was used by the authors to convince readers of the structural strength of the CAU. However, in this work only the Anvil
1 drop test (AD) was simulated.
3. The Finite–Discrete Element Method
The combined finite–discrete element method (FDEM) was first proposed by Munjiza in the 1990s and a 2D FDEM code, called “Y2D”, was developed and is used worldwide [
18,
19]. FDEM combines the advantages of the finite element method (FEM) for modeling solid deformation/stress and the discrete element method (DEM) for simulating contact interaction between solid bodies. It can simulate crack initiation and propagation using the cohesive zone model. Xiang et al. (2009) proposed Finite strain, a finite rotation quadratic tetrahedral element for FDEM, and developed a 3D FDEM code named “Y3D”, which is the first 3D multibody transient dynamic model of FDEM [
20]. It has been applied to simulate complex 3D deformable shapes of CAUs for coastal engineering applications [
21]. Since 2009, many researchers have further developed the 3D FDEM code and applied their models to the research of the concrete armor layer (see [
22,
23,
24,
25,
26]). Xiang, Latham, et al. (2012) implemented a new tool called “POSITIT” which can deposit rocks and units in a computational domain and subject it to dynamic loads [
27]. Karantzoulis [
28] implemented an elastic–plastic model in the 3D FDEM code and applied it to investigate the effect of plastic deformation during collision between CAUs. Guo [
14] implemented a 3D cohesive zone fracture model which can simulate crack initiation and propagation caused by the collisions between CAUs. This model was used in the current study. Recently, Latham and Xiang founded the multipurpose open-source software platform,
Solidity, which is a leading combined finite-discrete element method (FDEM) code that has discrete fracturing modelling capabilities. Solidity uses a GUI preprocessor,
GiD (CIMNE)
2 to apply boundary conditions and material properties, as well as to generate tetrahedral meshes for the FDEM solver. In this study, Solidity is used to simulate the behavior of CAUs during free-fall tests, using a three-dimensional fracture model, while
Paraview is the software package used in post-processing.
4. Prototype Drop Test: Numerical Simulation
As mentioned above, the drop test aims to model the wave-induced rocking of the units. The numerical simulation study was structured in two different phases. In the first part, the aim was to calibrate the material property parameters required to reproduce the behavior of the prototype drop test, through the simulation of the Cube free-fall tests. The calibration data include both the results provided in
Figure 1b and qualitative data observable from watching the videos of the experimental drop tests (see
Supplementary Materials). Subsequently, after setting all the numerical model input parameters to achieve observed fracture of the Cube, the second part focused on validating the numerical model using the results observed for the Cubipod’s structural integrity for drop tests carried out in [
15].
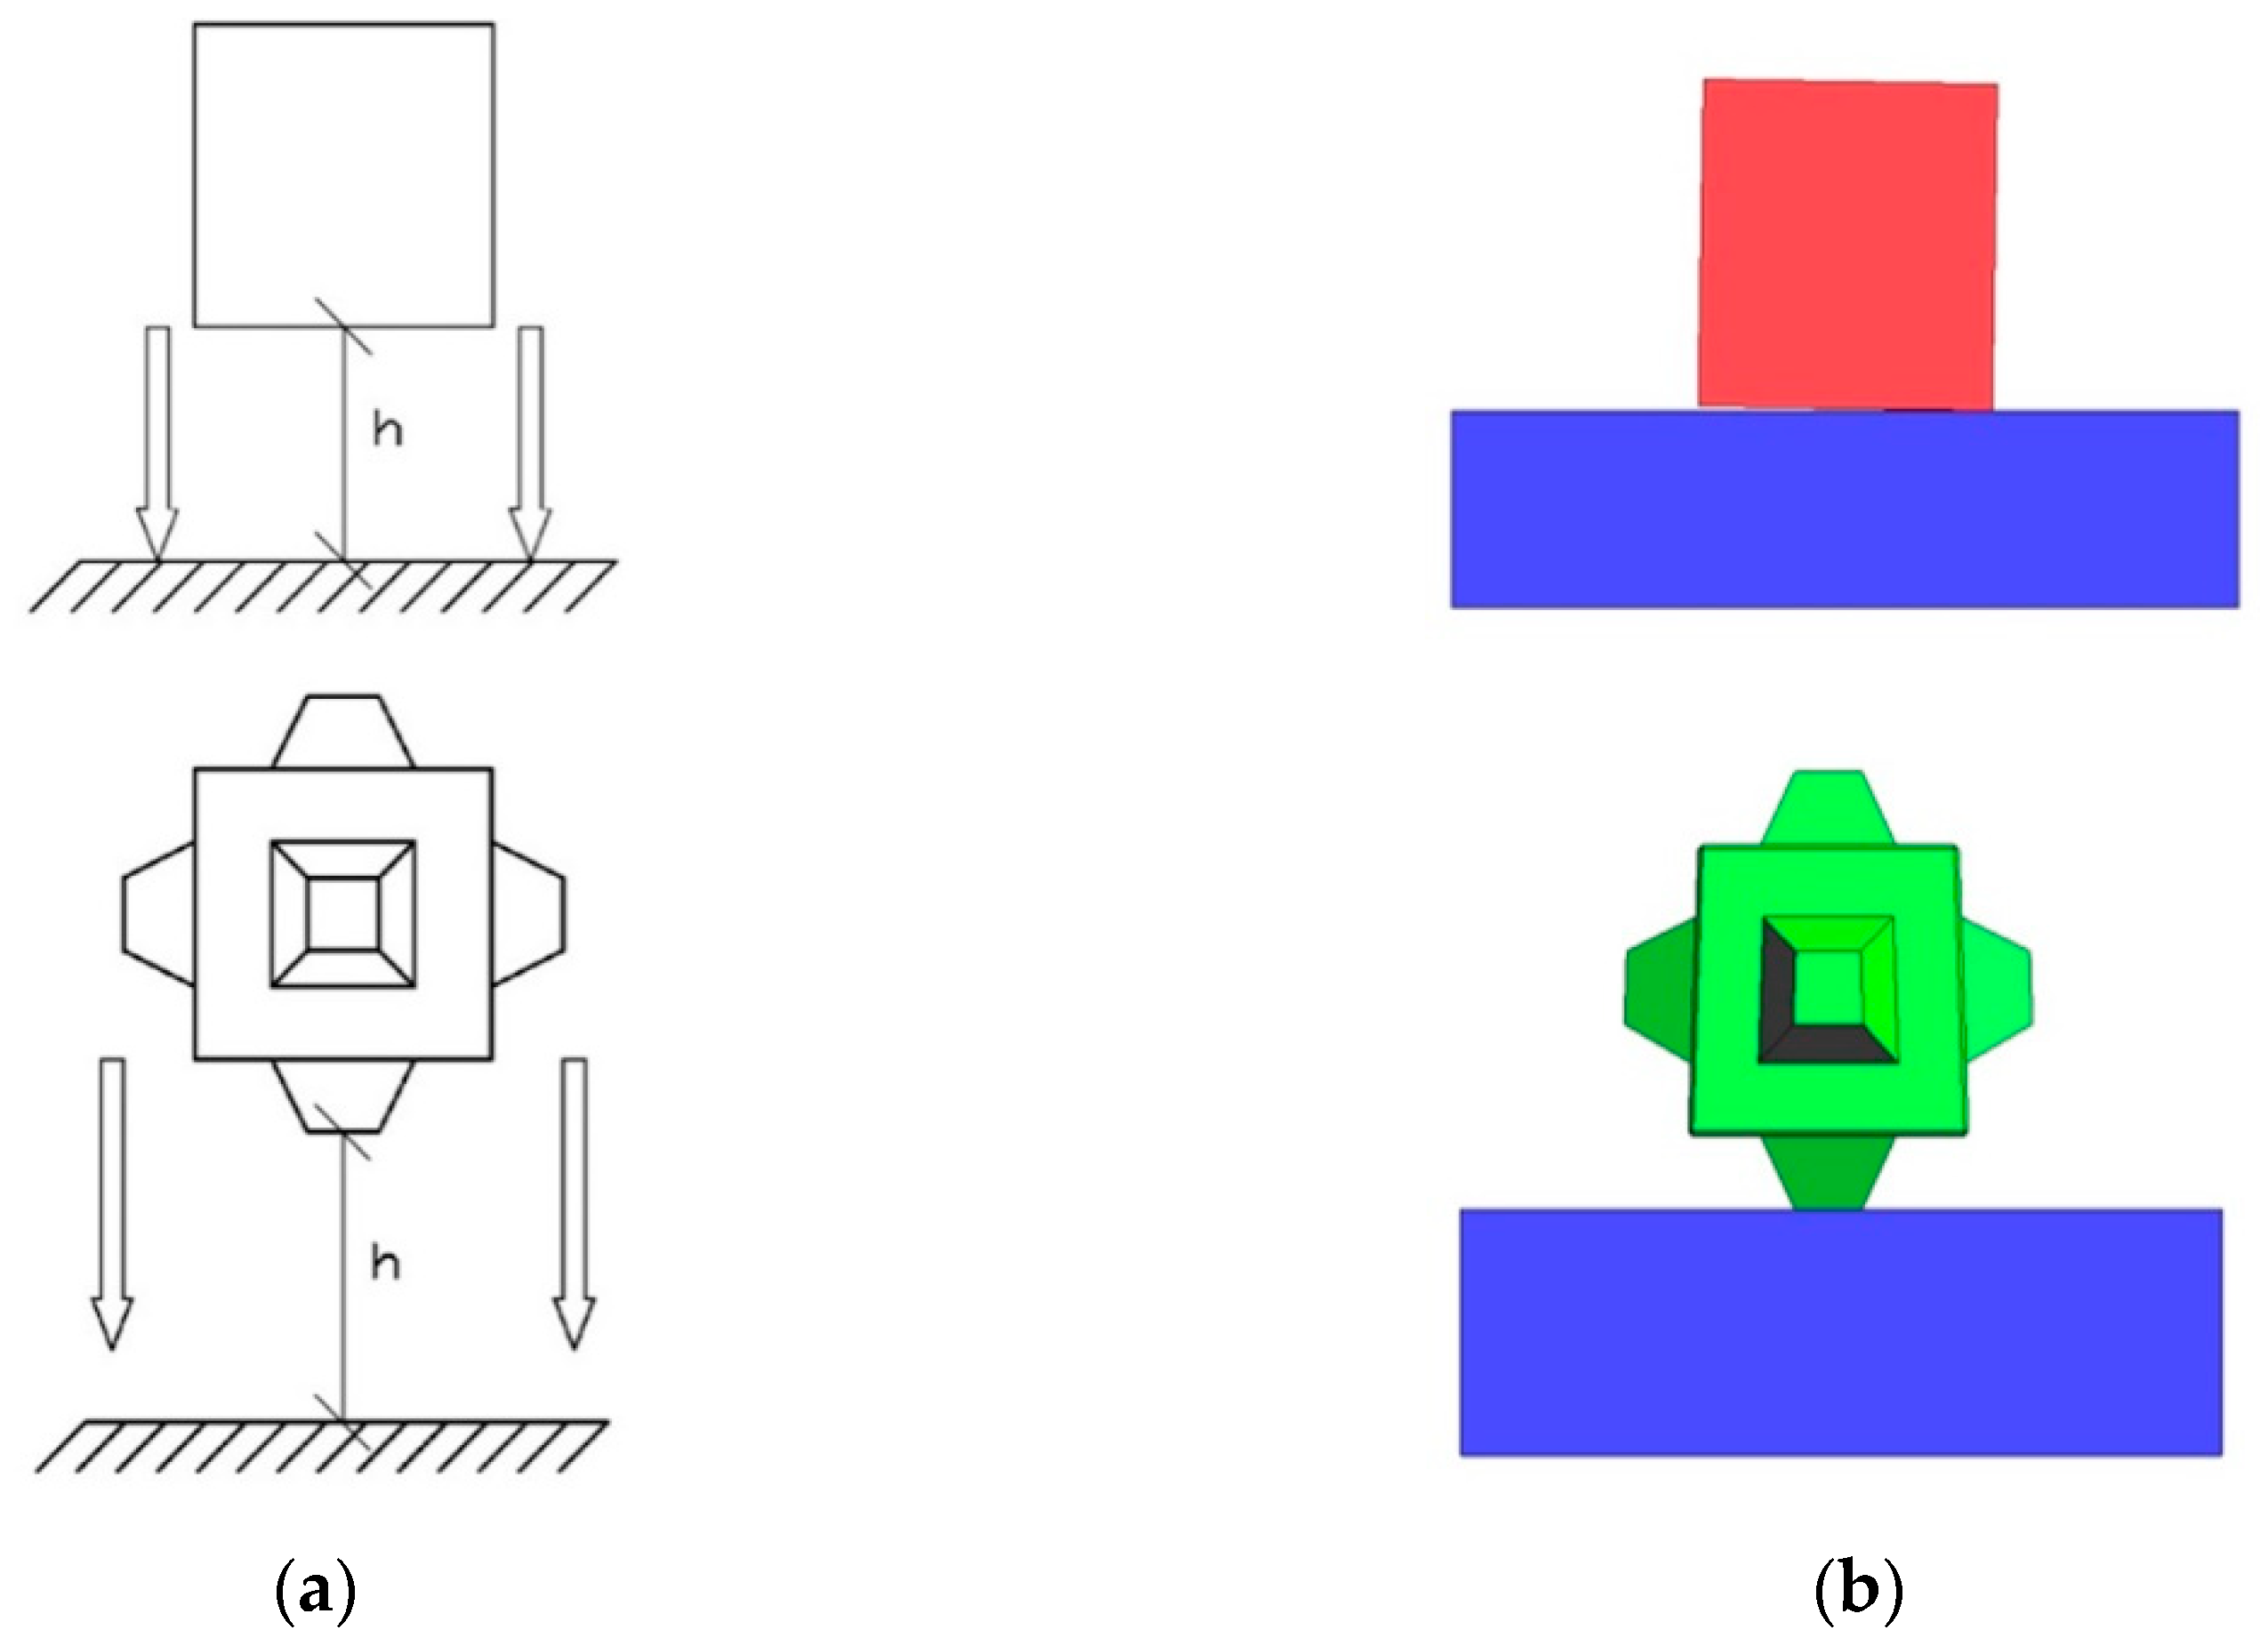
The conventional Cube is a 15 t prototype, whereas the Cubipod is 16 t, and both were dropped on a free-fall anvil platform (reinforced concrete platform, covered by a 20 mm steel plate) of 5.0 × 5.0 × 1.15 m as shown in
Figure 2b. The prototype units were simulated to drop from a certain height h on to the free-fall platform under gravity (
Figure 2a). The free-fall test examines the progressive increase in height of fall and the observation of the sensitivity between the amount of fracture damage of the blocks and the height of drop. In order to simulate the real drop test, the Cube orientation was adjusted by a certain angle to avoid a perfect flat-on-flat impact and to make it more realistic according to the video observations of block orientation on impact. Several simulations were carried out, varying the steady fall angle of the base plane from the horizontal. A rotation of 1° was found to give a close match to the experimental performance, as described below.
In this numerical model, the following conditions were applied:
Velocity-constrained boundary conditions were applied to the base of the plate. The bottom surface of the base was restrained to zero velocity in all directions. These conditions guaranteed that there was no rigid body motion of the base. Of course, it is just a simplification of reality. In the field tests, after the fall of the units, the plate gets damaged and moves.
The cohesive zone fracture model was applied to the brittle breakable CAU blocks, whereas a viscoelastic constitutive model was applied to represent the behavior of the unbreakable platform.
The acceleration of gravity g was set to be 9.8 m/s2.
To set up the drop height of the units, the unit was positioned very close (~1 mm) above the platform, and the impact speed in m/s was then assigned using the following formula coming from an energy balance:
where
g stands for the acceleration of gravity, and
h stands for the height of fall.
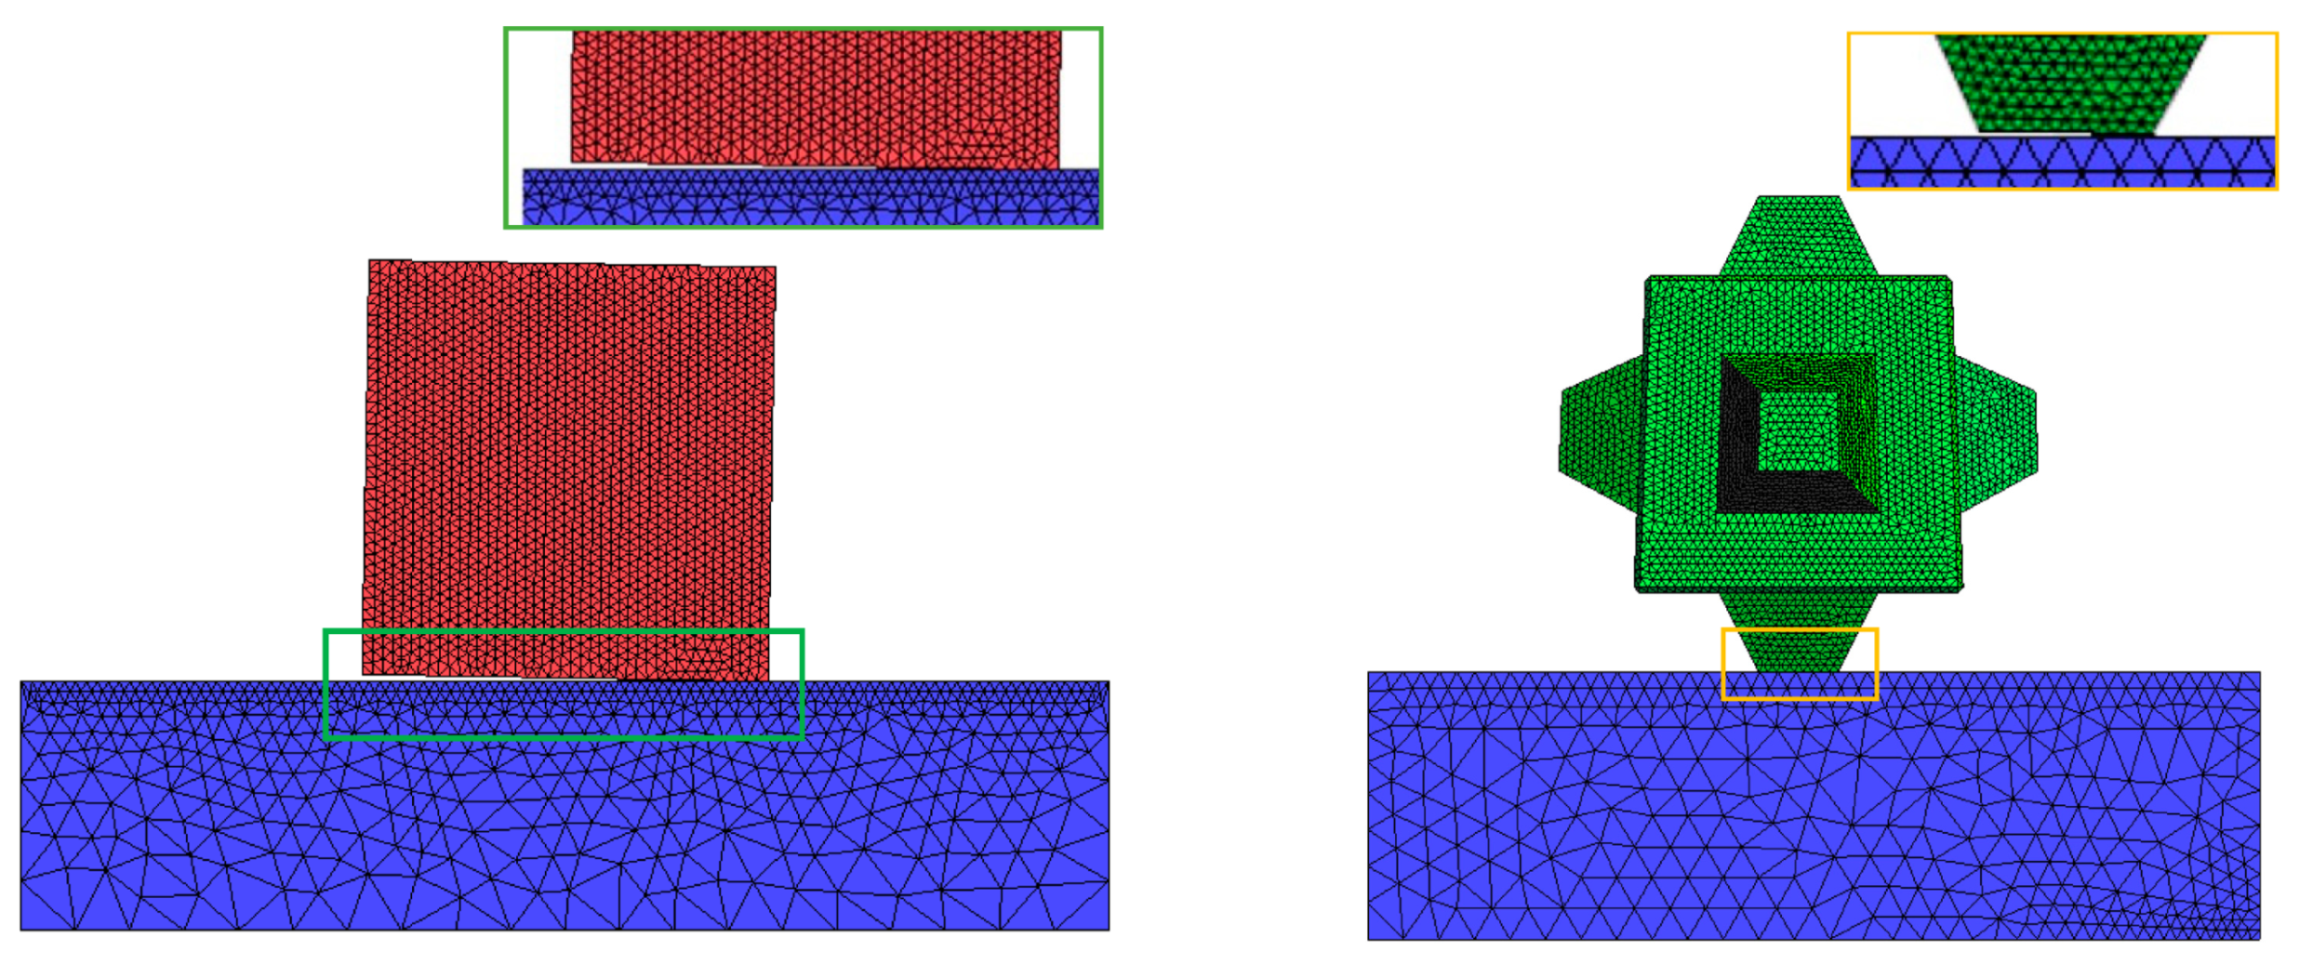
In addition, highly resolved volumes represented by tetrahedral element meshes are required to properly visualize the fracture paths. After numerous tests and after deciding on an acceptably converged maximum element size both for the unstructured mesh for the base and the all-important concrete unit, the target mesh size of 0.05 m was chosen for the CAUs (
Figure 3). The optimum size of the mesh element was investigated by setting up a series of tests using models with the same geometry but progressively more refined meshes in order to find the best combination between a reasonable CPU time and a consistent expression and distribution of crushing crack networks and propagating discrete cracks.
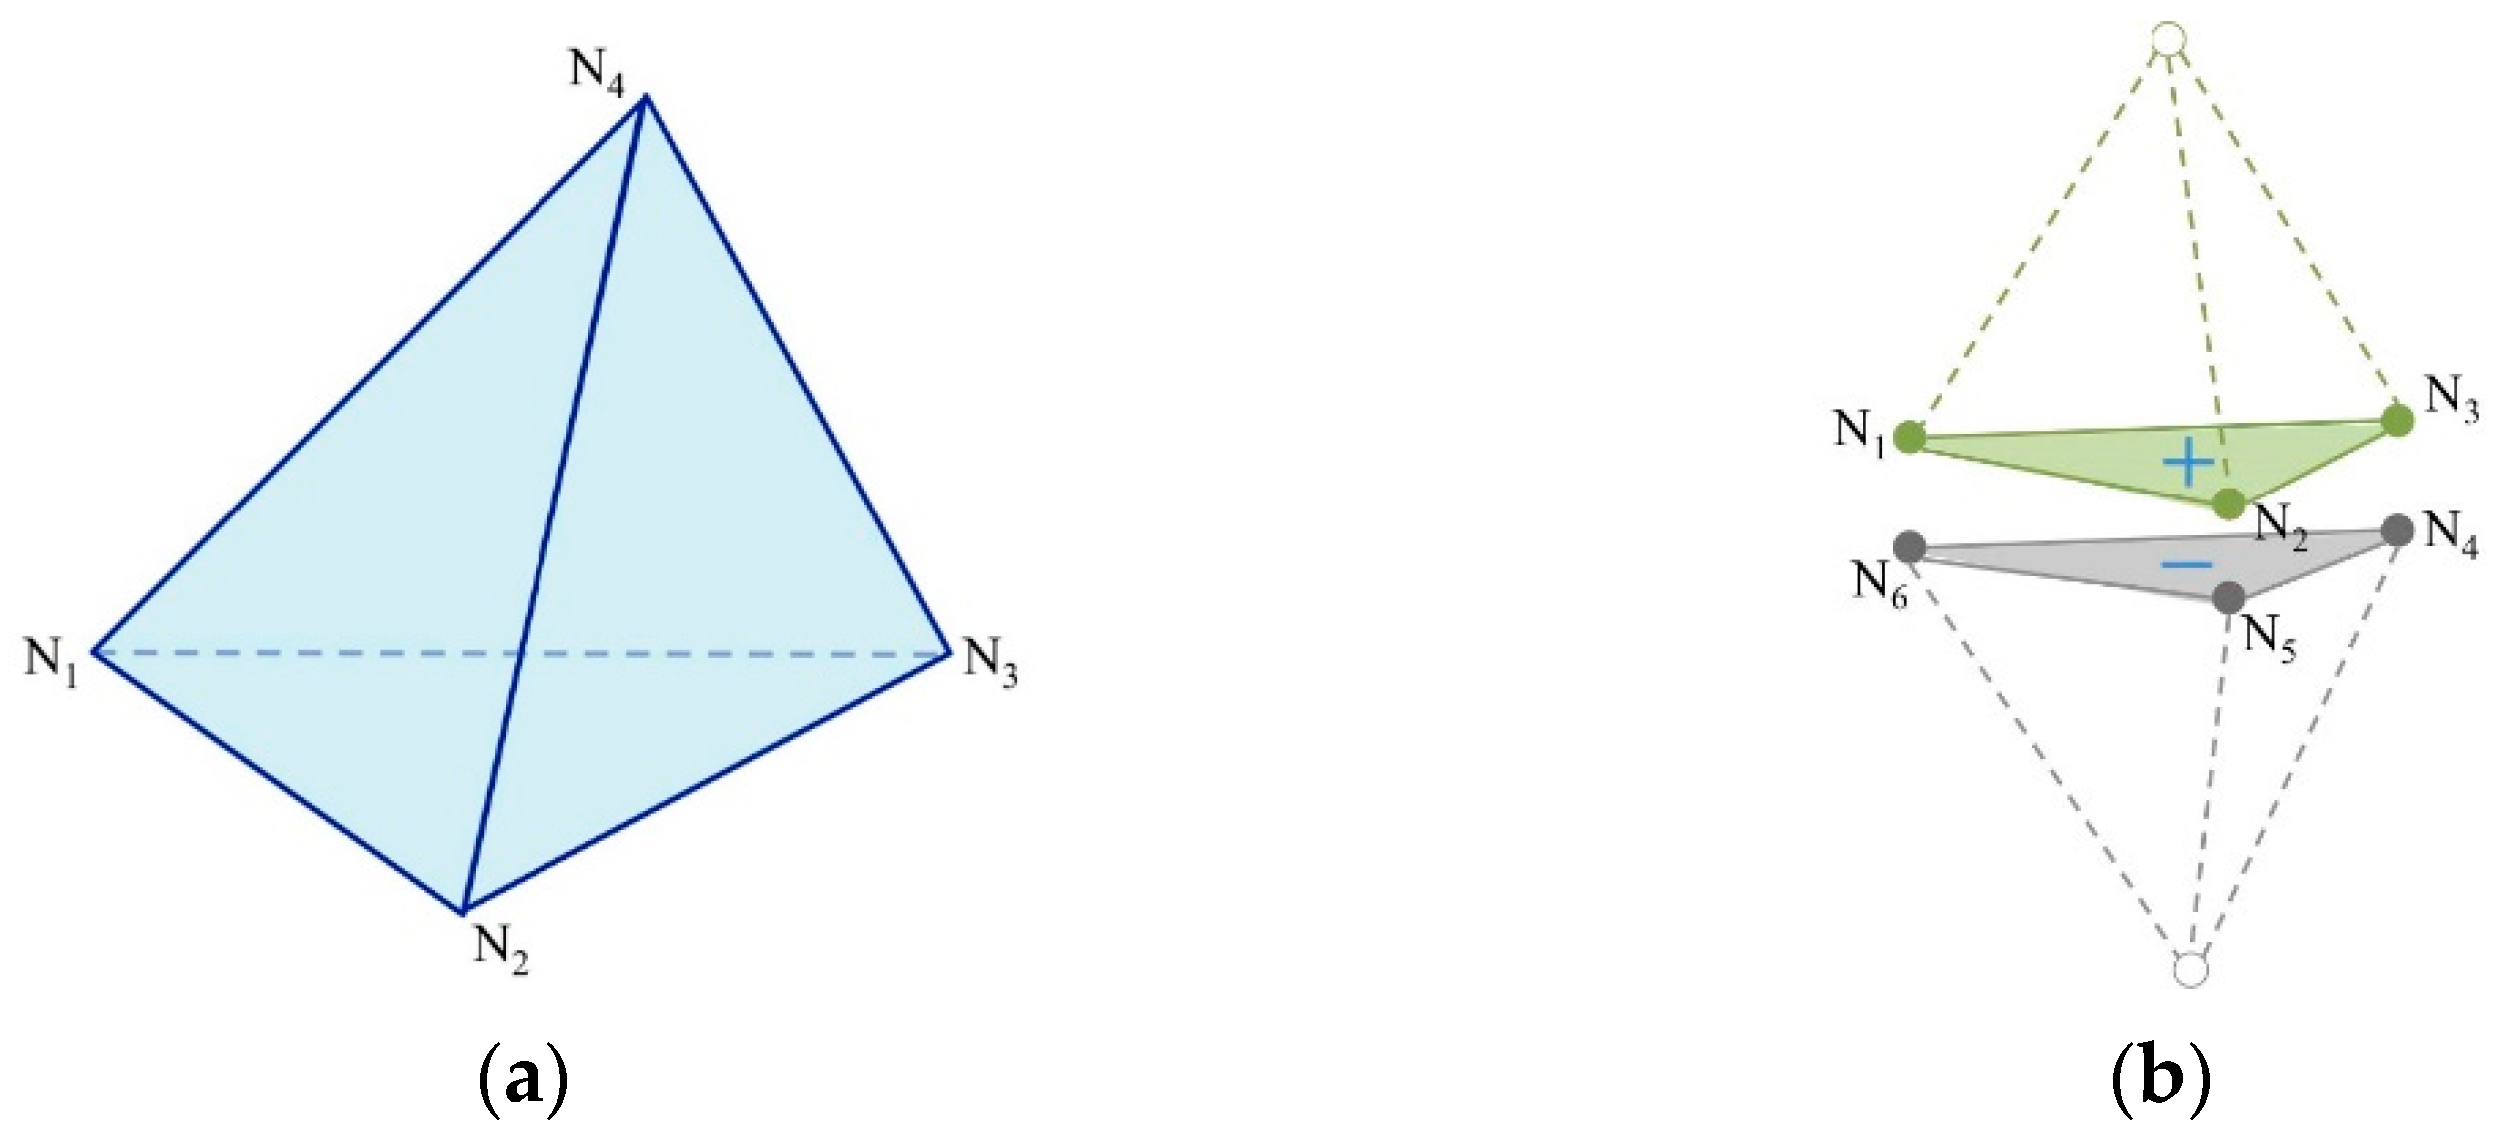
The mesh quality is important for preventing numerical simulation errors and optimizing the time step so that the simulation can run efficiently and accurately. The three-dimensional fracture model exploits a modified four-node tetrahedral element mesh. First, all of the solid domain is meshed by unstructured four-node tetrahedral elements; then, special six-node joint elements are inserted between tetrahedral elements with zero thickness. Each tetrahedral element is connected to four joint elements, and each joint element is connected to two tetrahedral elements (
Figure 4).
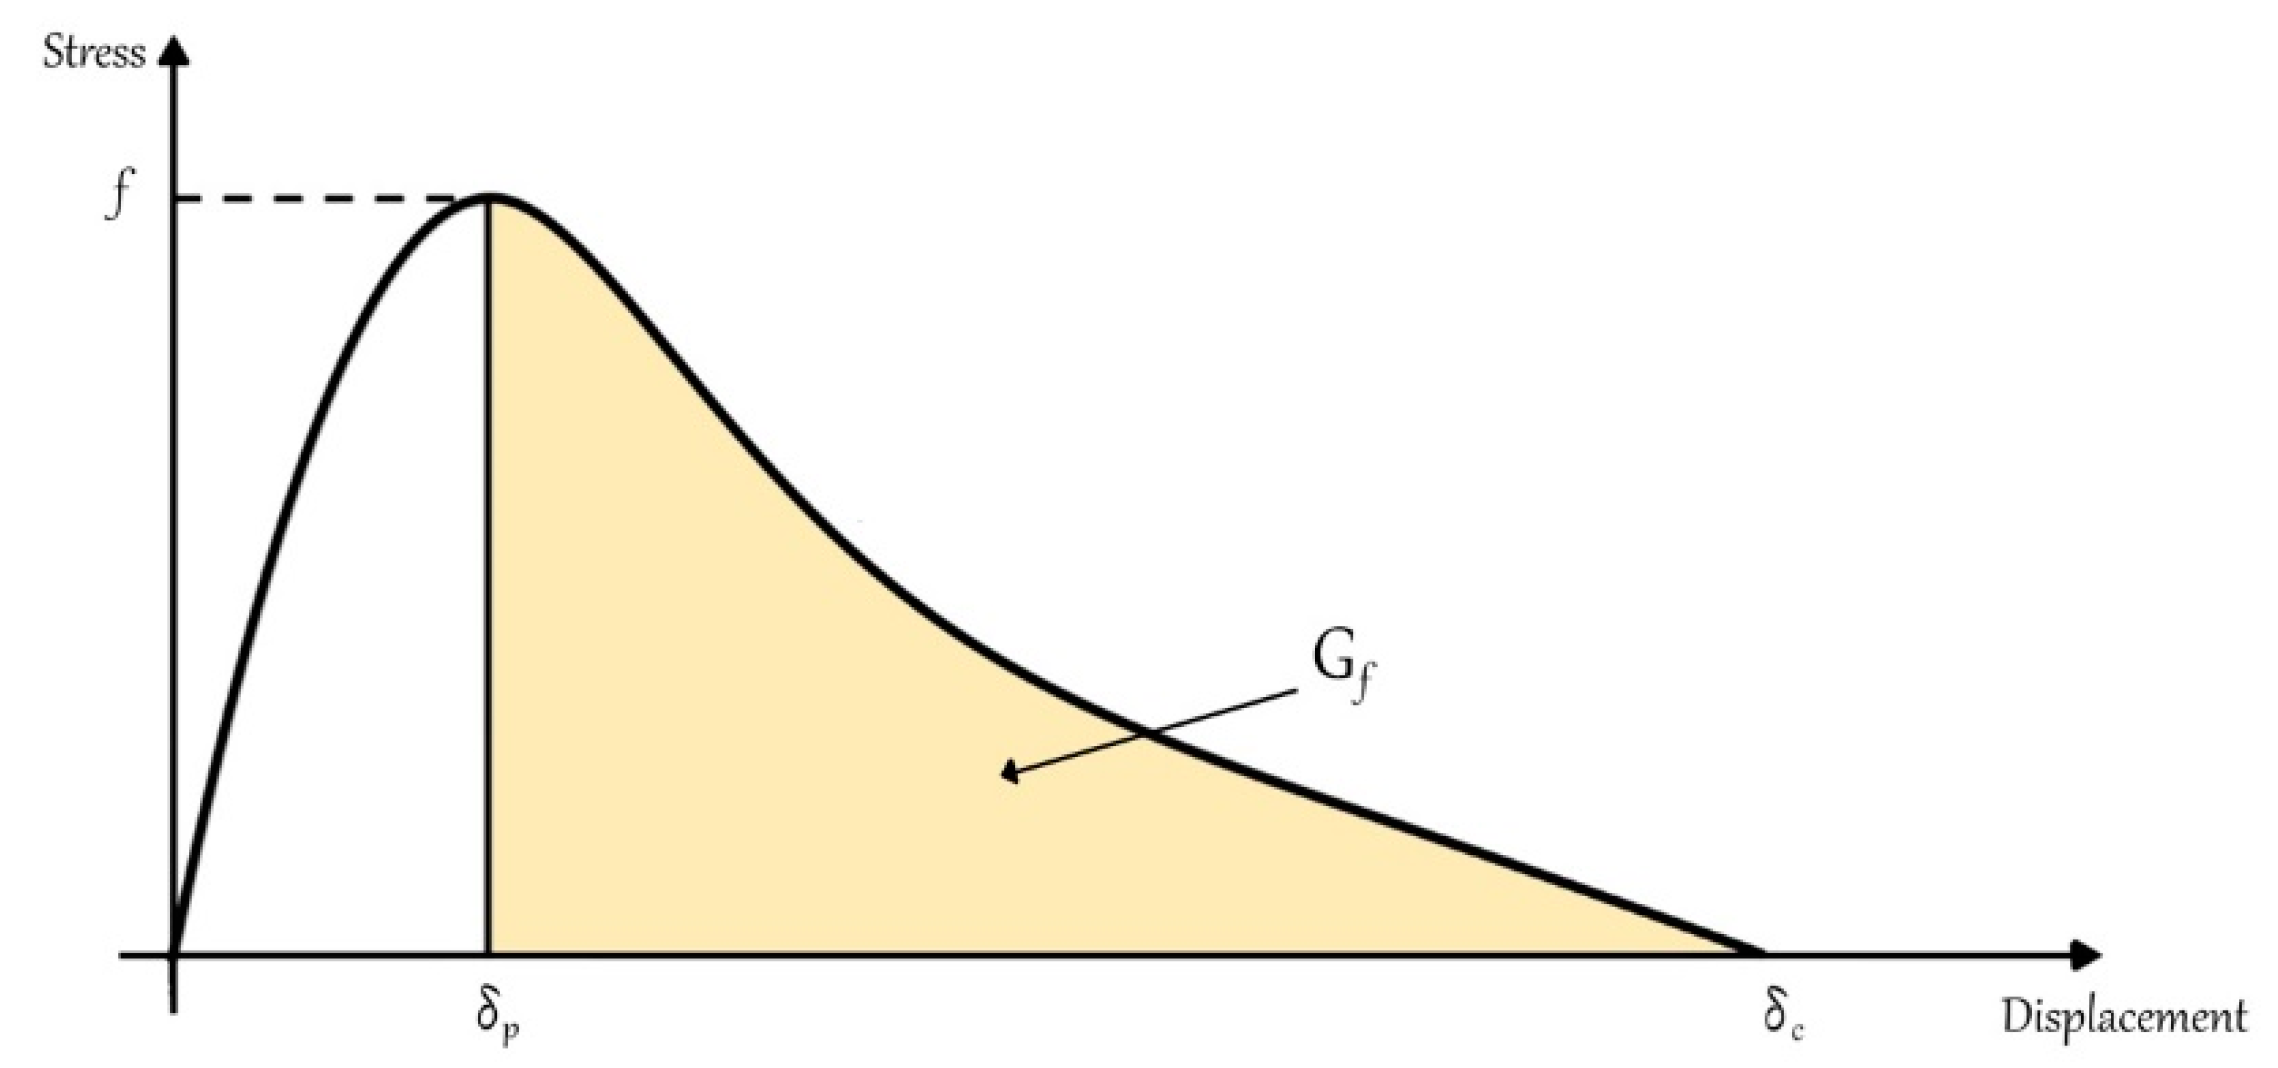
Strain in the continuum domain will produce stresses in both the four-node and the six-node joint elements. In order to simulate the fracturing process clearly, the tetrahedral elements were allowed to separate according to a failure criterion applied to the joint elements [
30]. The normal stress σ and the shear stress
τ, corresponding to the normal displacement δ
n and the shear displacement
δs between triangular surfaces
N1N2N3 and
N4N5N6, respectively, were calculated according to the constitutive law presented in
Figure 5.
The peak stress on this stress–strain curve
f represents the material strength. Therefore, for normal stress
σ, it means tensile strength
ft, and, for shear stress
τ, it means shear strength
fs. A Mohr–Coulomb criterion with a tension cutoff was used to determine the shear strength on the basis of the normal stress acting perpendicular to the shear direction [
14,
30]. Fracture energy
Gf is a material property, which defines the energy needed for fracture surface to propagate per unit area, and it is the area under the graph (
Figure 5).
For the Cube, a total number of 546,056 tetrahedral elements were generated, the minimum element edge length was 0.0148 m, and the minimum volume was 7.21 × 10⁻⁷ m3. Due to its greater volume, the Cubipod had 607,059 elements, with a minimum element edge of 0.0141 m and a minimum volume of 5.87 × 10⁻⁷ m3.
Since these values were very similar, both simulations were carried out with the same time step, which was fixed at Δt = 3.3 × 10⁻⁸ s.
5. Calibration
This section illustrates the procedure adopted for calibrating the numerical model by seeking a match to the trend of the experimental results on the 15 t Cube in
Figure 1b. In the experimental tests, the type of damage suffered by the prototype during the drop was measured through a parameter called RLM (relative loss of mass (%)). This parameter clearly depends on the drop height, the number of drops, and the type of armor unit. This part of the research investigates the influence of the following properties during the free-fall test:
Finally, after the optimal physical setup for the drop test was determined with approximate material properties, final material properties including fracture energy were calibrated by trial and error, and numerical coefficients such as mass damping and penalty number (
Table 1) were determined for further application to model the response of both the units to a similar drop test series. The friction coefficient μ between the units and the base was set to be 0.556.
In order to achieve the accuracy of the results, the penalty number was estimated as
E/2, where
E stands for Young’s modulus [
31]. The mass damping coefficient
η was calculated through the following formula:
where
l is the minimum edge length of the tetrahedra, and
ρ is the density of the material.
5.1. The Influence of the Angle of Drop on the Free-Fall Test Results
It is worth noting that, to calibrate the numerical model with test data from Medina et al. (2011), it is important to capture the sensitivity of the test to the impact angle between the units and the platform. In the field experiments, CAUs are supposed to drop near to flat-on-flat to the platform, with recognition by many engineers that a perfect flat-on-flat would render the block too prone to failure. However, in practice, the fall orientation of the units is notoriously difficult to control during the test, which somewhat randomly results in the released block impacting the platform with different inclinations to the horizontal. The collision orientation mismatch can be fixed in the numerical simulation, by setting different angles of impact. Several free-fall drop tests were simulated where the angle of impact between the unit and the platform was calibrated to better model reality (
Figure 6,
Figure 7 and
Figure 8). The following cases were analyzed:
After applying commonly reported elastic and strength material properties and numerous tests, an angle of 1° to the horizontal was found to greatly reduce the catastrophic fracturing behavior
3 of a flat-on-flat impact for drop heights of about 2 m, while not overly reducing the impact to an excessively rotating collision of the type not seen in the field tests.
5.2. The Influence of the Tensile Strength on the Free-Fall Test Results
The CAU damage in a prototype drop test depends on the prototype size, concrete strength, drop test type, drop height, platform stiffness, and accumulation of damage inside the prototype unit [
15]. Particularly, it was observed in the simulations that the total new fracture surface area generated by a free-fall test is very sensitive, especially to the concrete tensile strength and to the height of fall of units. A greater tensile strength leads to fewer cracks being generated in the prototype. In comparison, it is not too sensitive to the fracture energy release rate G (which governs the energy required to propagate cracks). This subsection shows the sensitivity of the drop test results to the tensile strength of the Cube prototype for a defined height of drop of 2 m. The Cube was rotated by 1° in order to compare the results with Medina et al. (2011). The following tensile strength values were analyzed:
2.5 MPa,
3 MPa,
3.5 MPa,
4.5 MPa.
The results were very sensitive to this parameter. The Cubes with tensile strengths of 2.5 MPa and 3.0 MPa showed a very similar behavior to the drop test (
Figure 9 and
Figure 10). At the last frame, substantial cracks were generated and a defined fractured plane of approximately 45° split the Cube into two parts. Similarly, the Cube with 3.5 MPa also showed the same trend with fewer cracks (
Figure 11). However, all three values were excluded due to too evident fracture generation, whereas the Cube with 4.5 MPa was excluded because of minor cracks (
Figure 12). Ultimately, a tensile strength of 4 MPa was chosen for the numerical model because it was the value that best represented the Cube behavior from that height of drop.
Additionally, the simulated fractured area (calculated from the cumulative sum of broken joint elements) generated by the free-fall test was also found very sensitive to the platform stiffness, investigated by changing the Young’s modulus between different platform materials. In the field tests, the prototypes drop on a platform of concrete topped with a thin layer of steel. The two parts of the platform are not completely locked or bolted together throughout, and this unfortunately allows the possibility of plate movement, damping, and damage to occur to differing degrees as the series of drop tests evolves. In all the numerical tests, to remove this source of uncertainty, the units were dropped on a platform modeled as a deep anvil of steel.
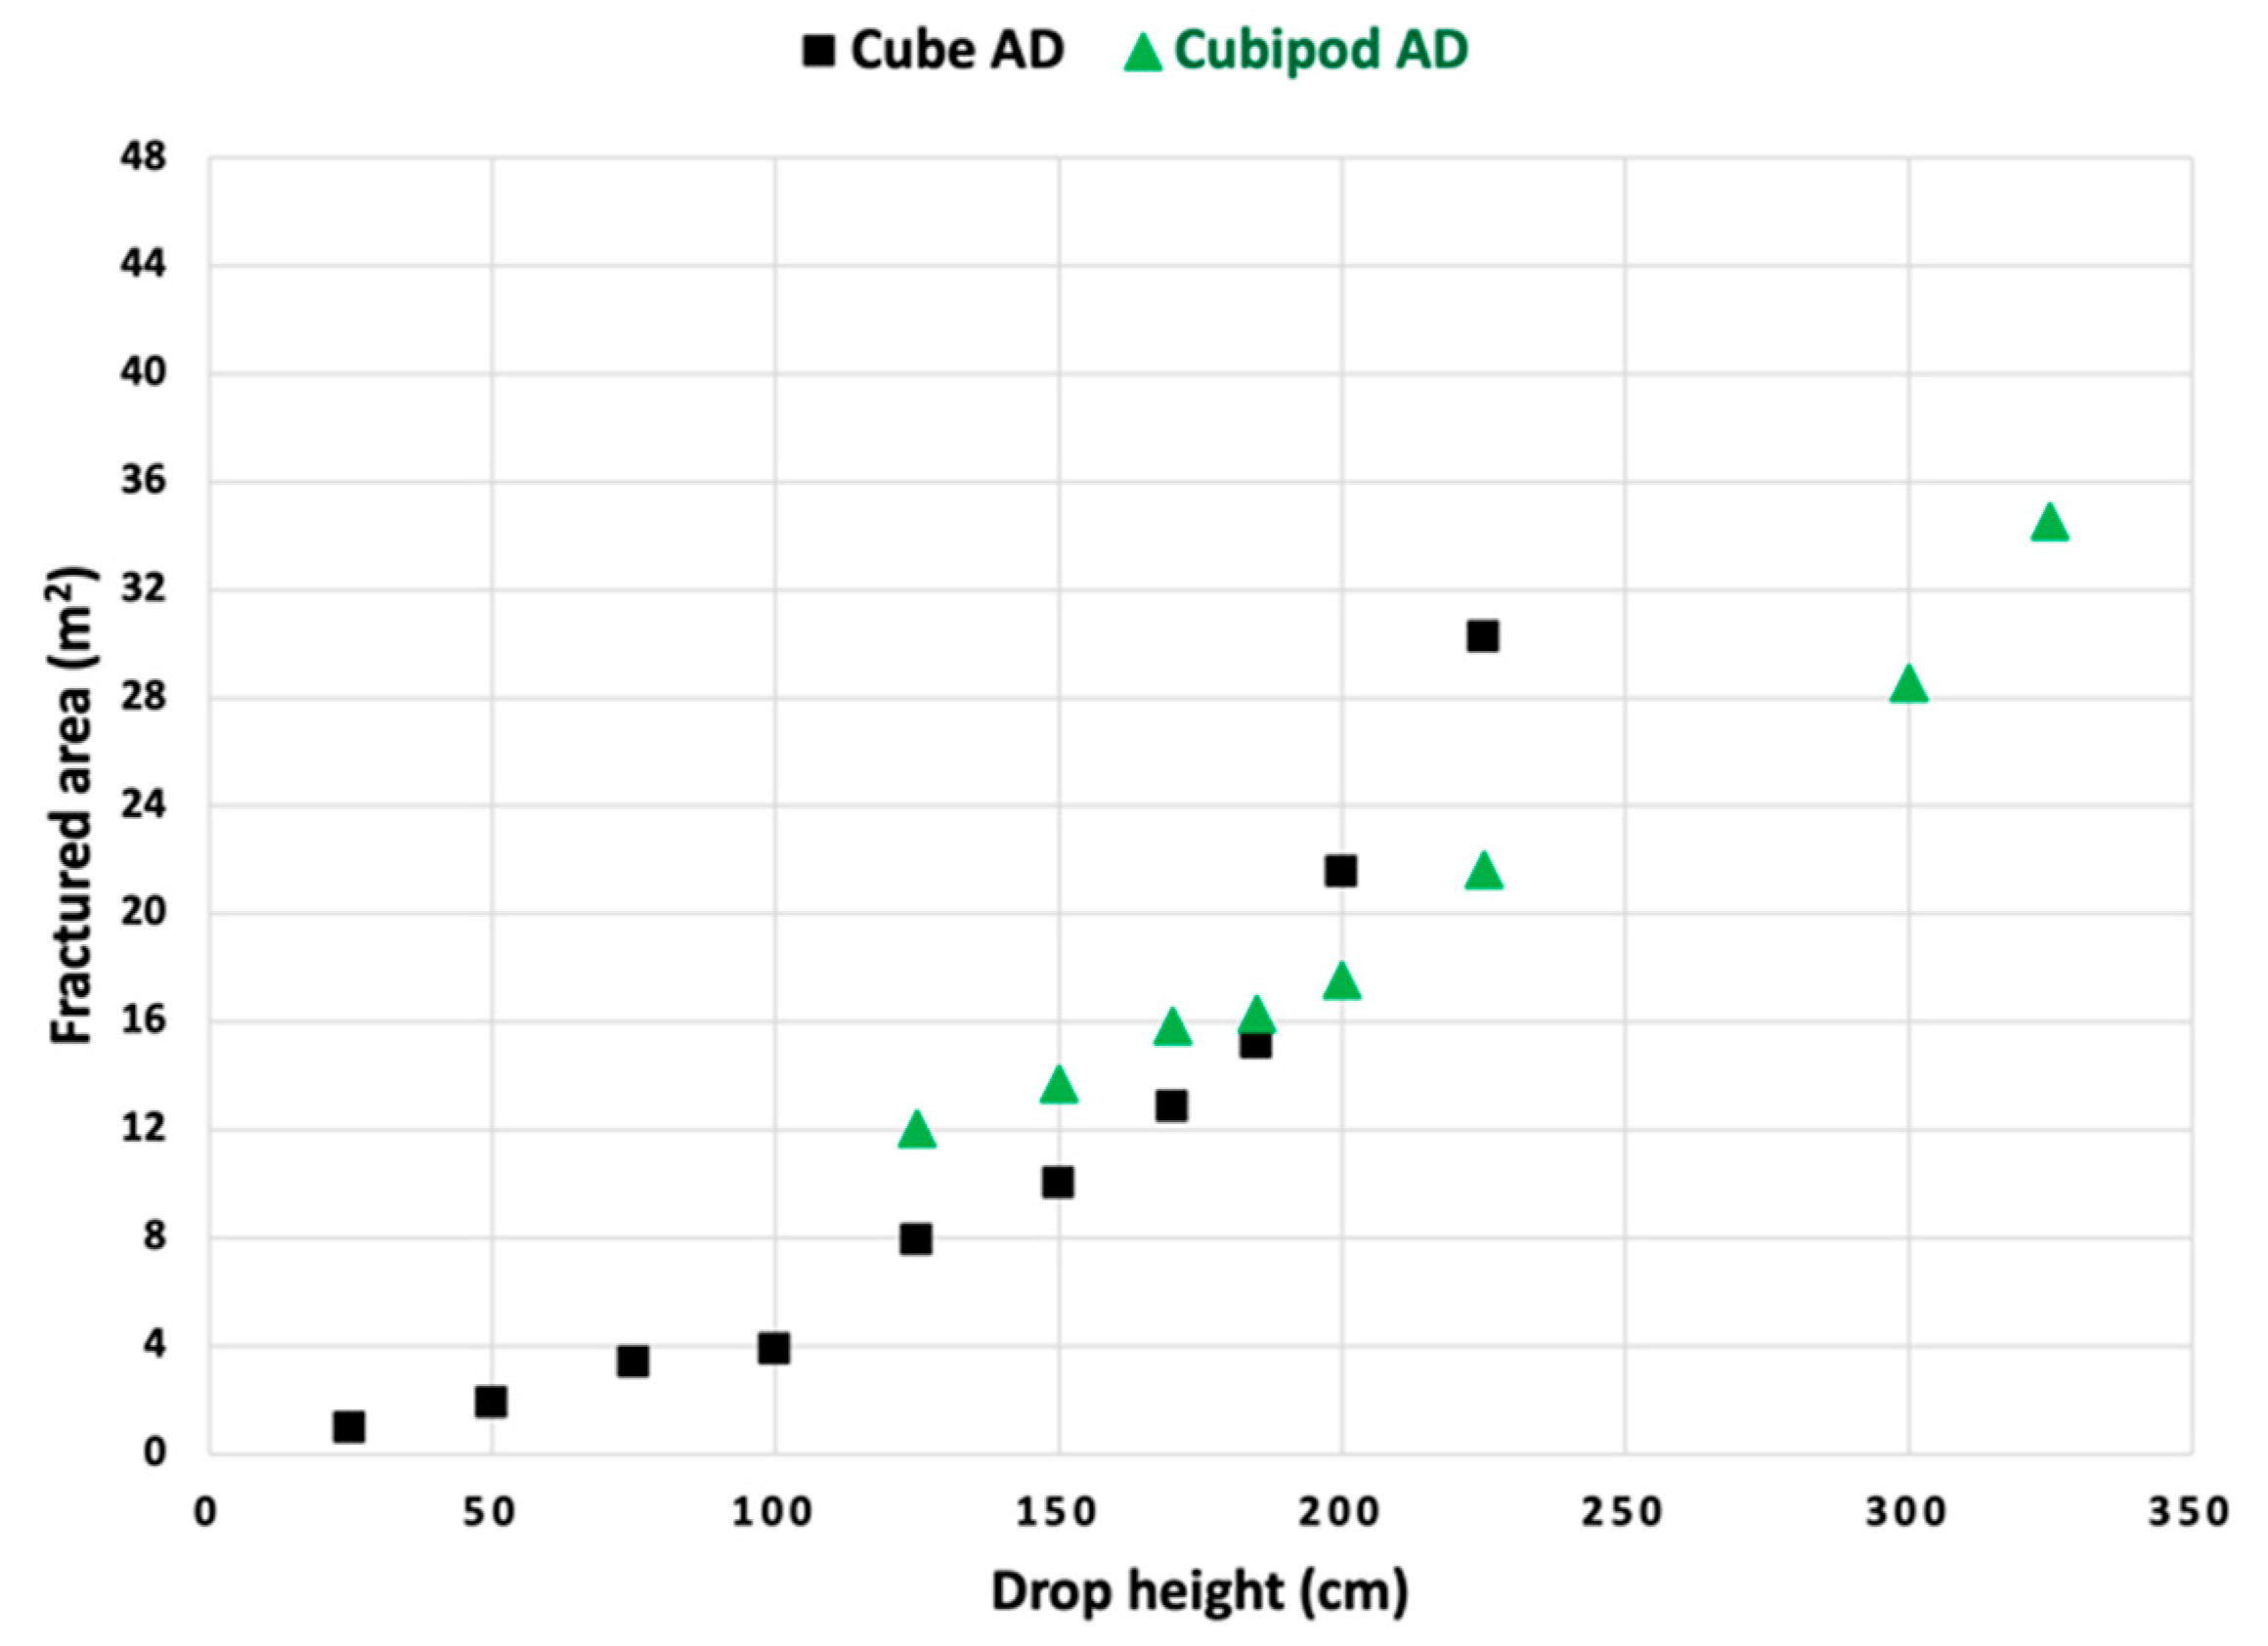
6. Free-Fall Test Results
After calibrating the numerical model parameters (
Table 1), these values were used to simulate the Cube and the Cubipod fracture behaviours as a function of drop height. The aim was to evaluate the ability of the numerical model to predict the lower levels of damage observed in the Cubipod prototype tests compared with the Cube, as a numerical model validation exercise, and to validate, firstly, the numerical model and, secondly, the structural integrity estimated in [
15]. The outcomes of the test are displayed in
Figure 13, showing the relative fractured area (m
2) generated from different heights of drop (cm) at the end of the test for both the Cube and the Cubipod unit.
As with the Cube, the Cubipod unit was rotated by 1° on the lowest edge. Although the fracture area trends of the Cubipod and of the Cube were similar, the Cubipod damaged with less fracture area compared to the Cube when dropped from heights above 2 m. This is because the nonlinear trend toward increasing fracture area accelerated faster for the Cube. Unfortunately, there were insufficient data for fracture area with increasing drop heights to warrant a statistical curve fitting analysis for both units. However, it is, in any case, overly simplistic to use fracture surface area as a proxy for the RLM or percentage of original mass of the largest fragment of the block. A measure of the largest piece, after testing, in the range of, say, 35–65% of the original unit, might be taken as an indicator of a catastrophic failure having occurred. The computer code is currently being modified to output the fragment size distribution, and a better signature of the type of fracture and damage will be reported in future work.
6.1. Cube Free-Fall Test Results
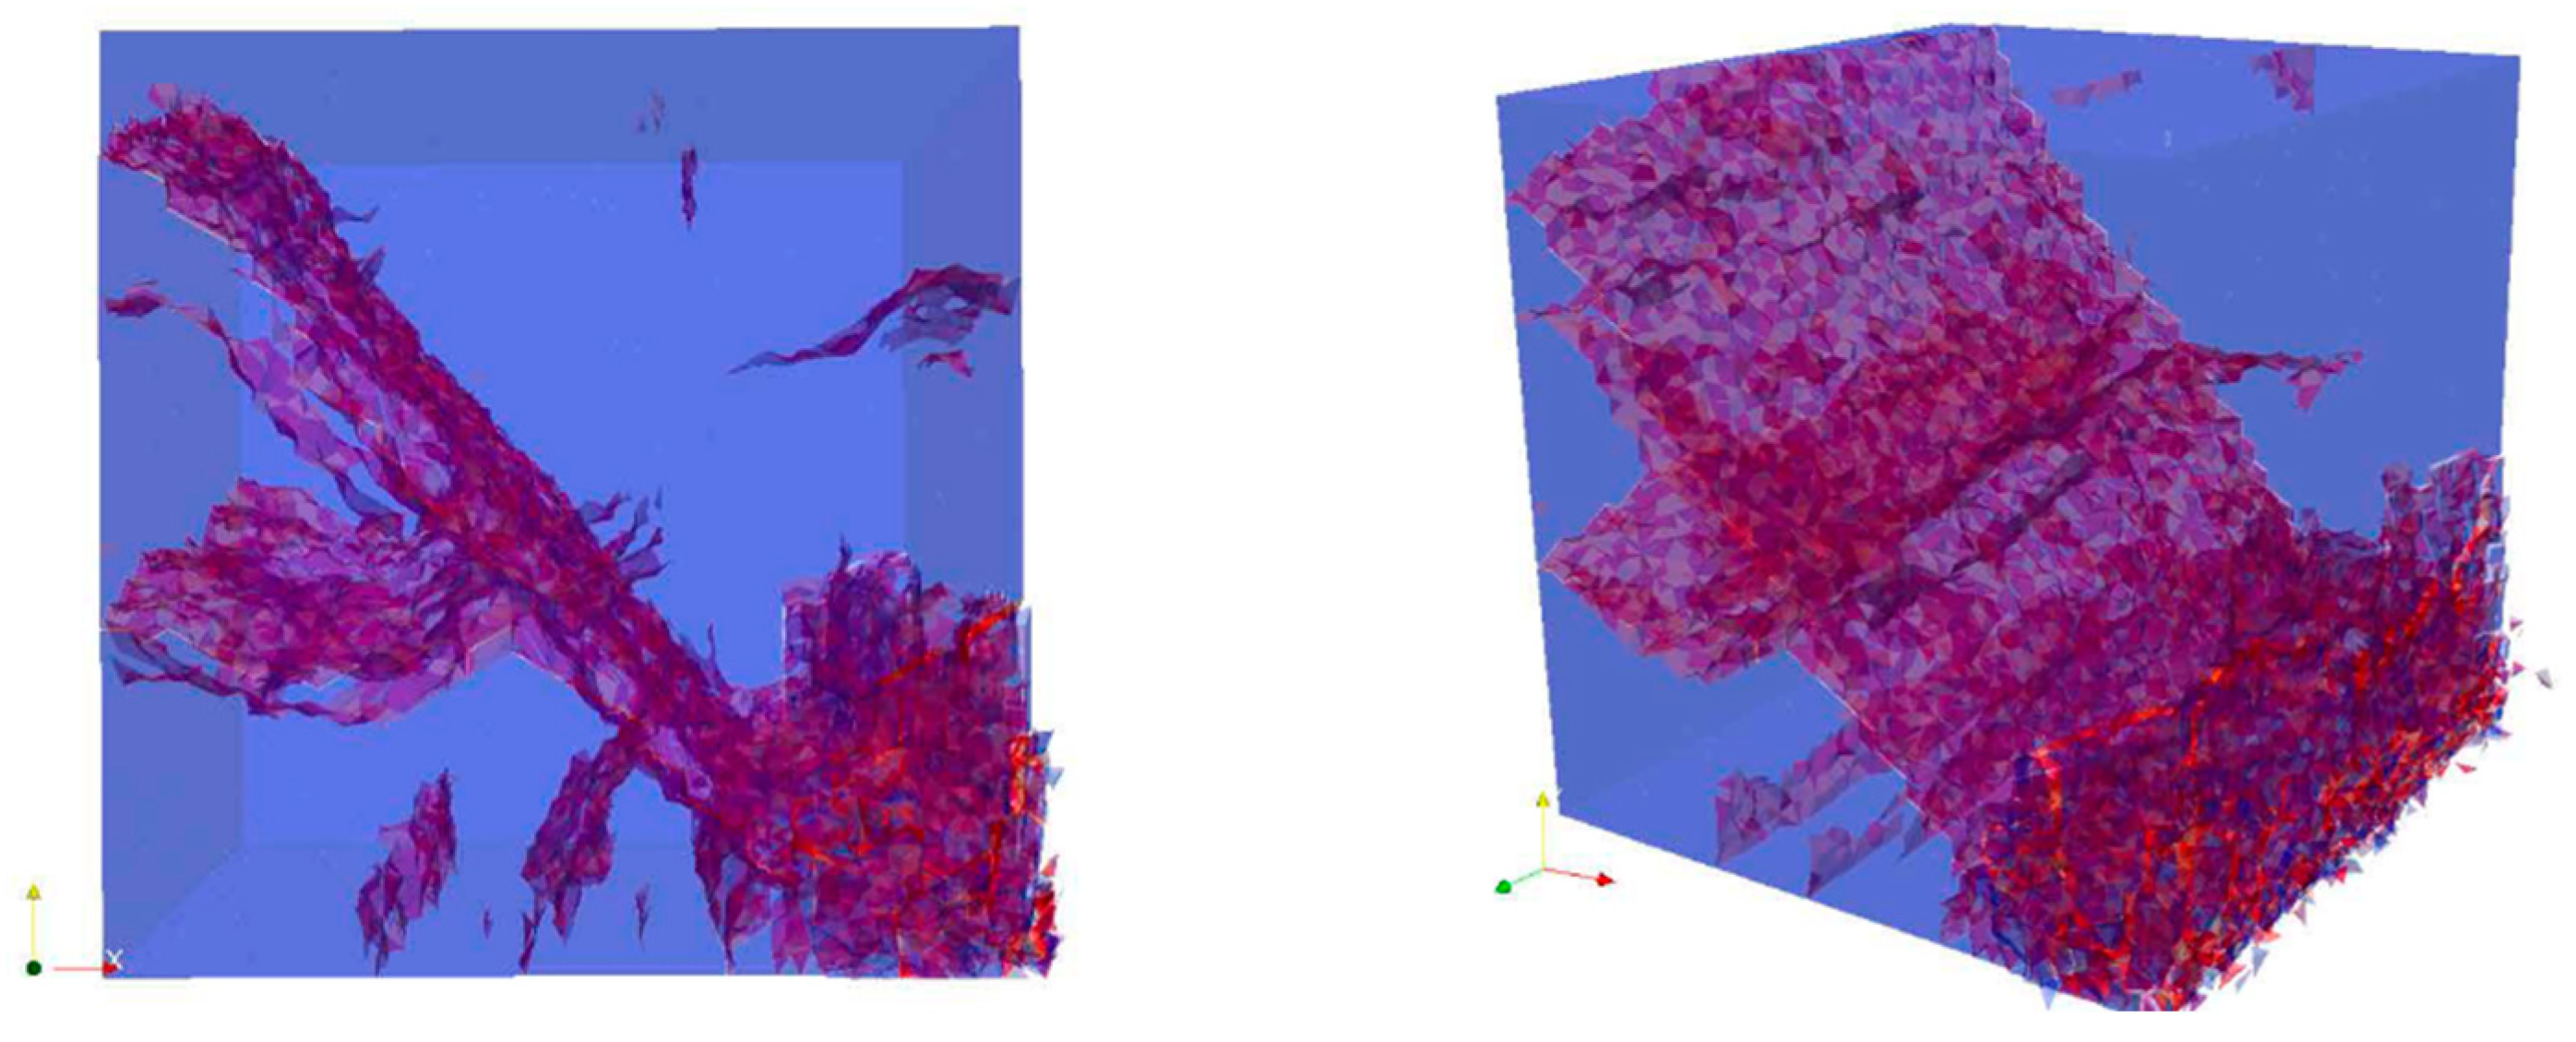
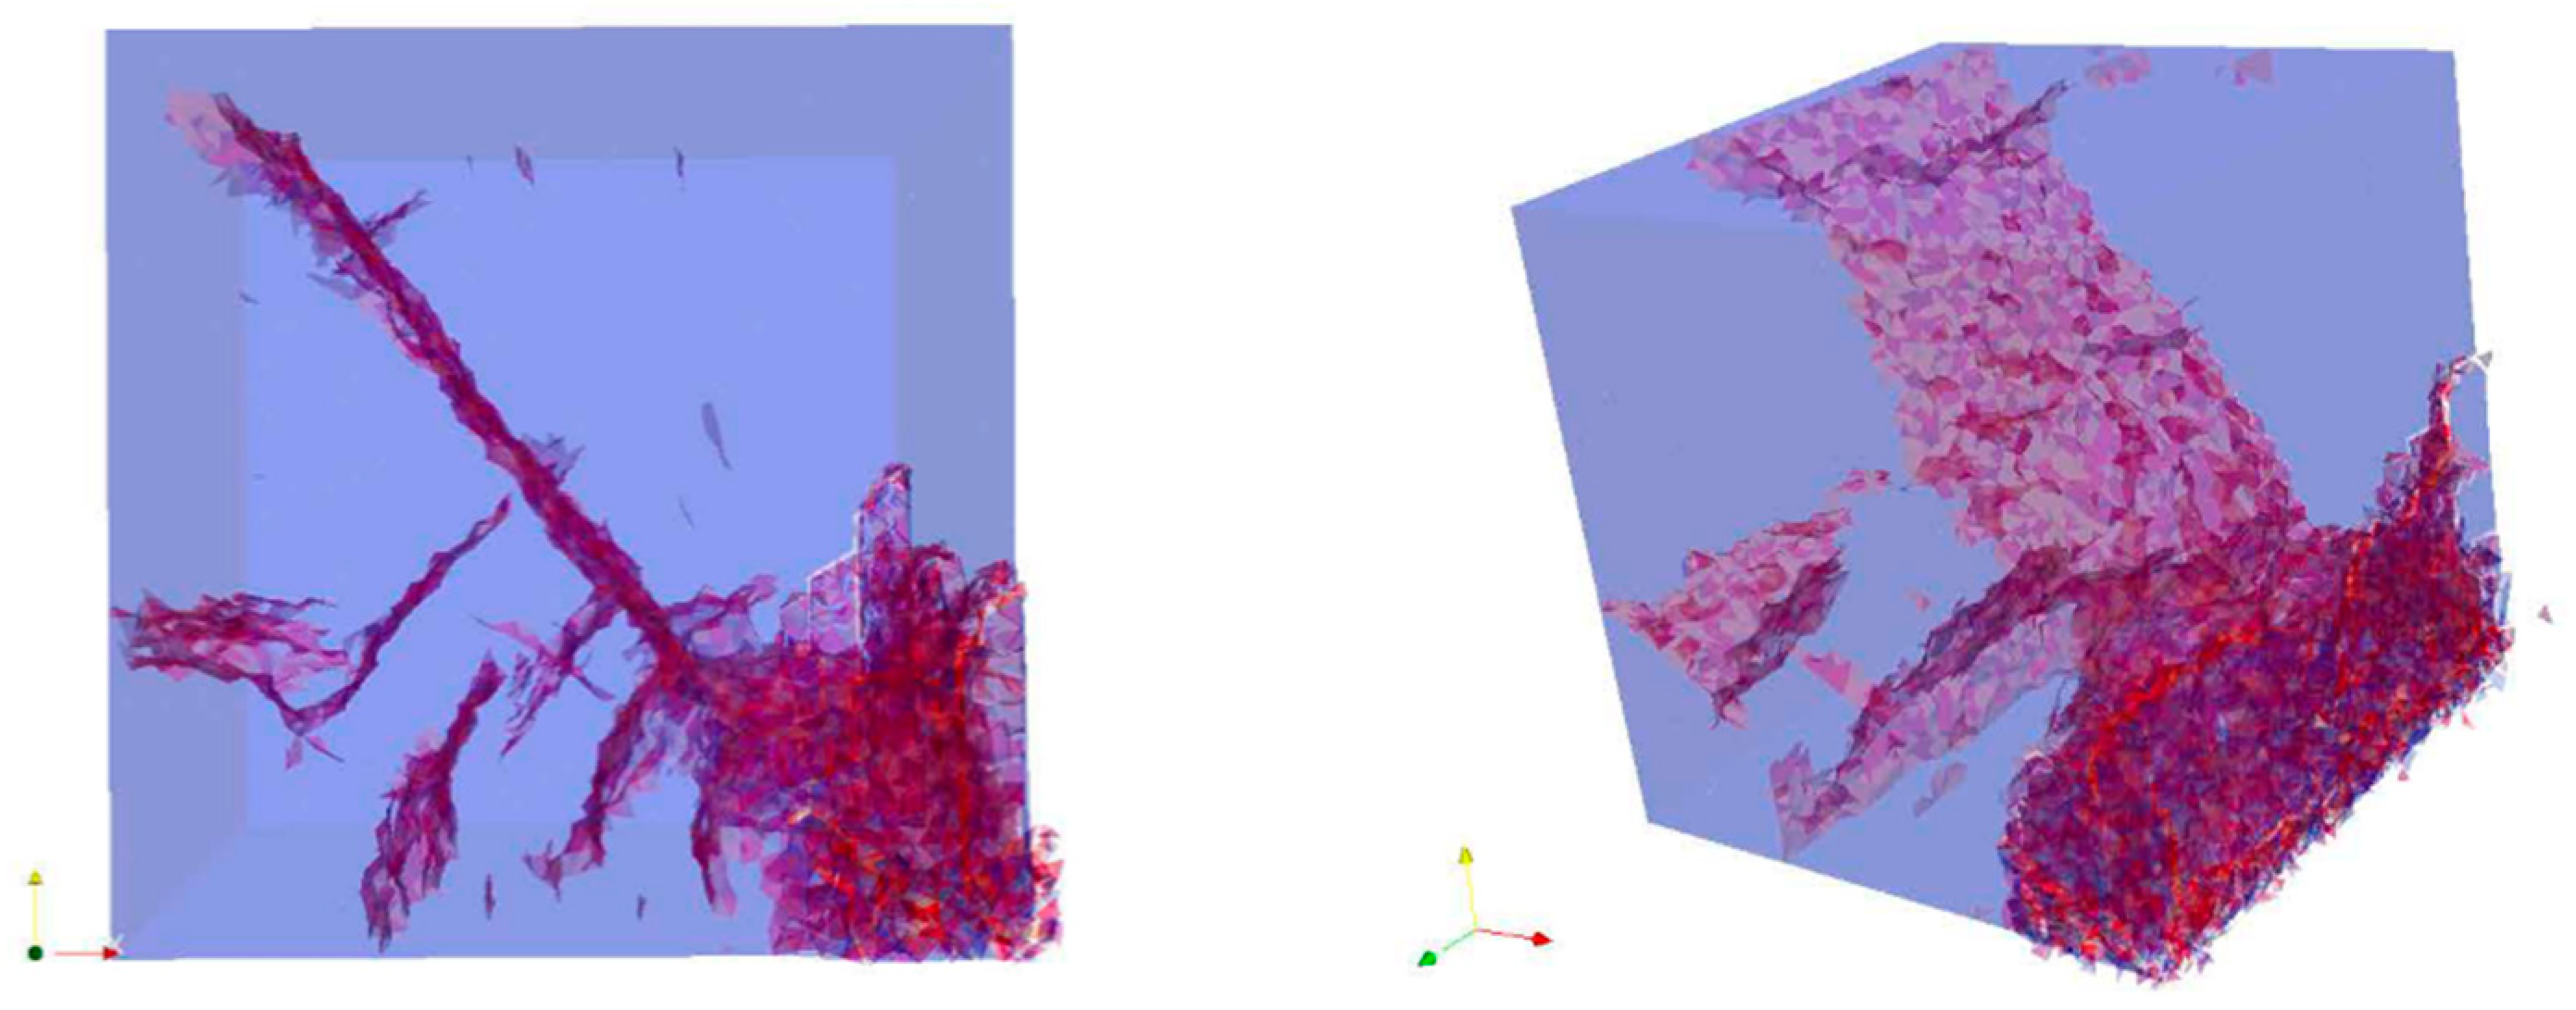
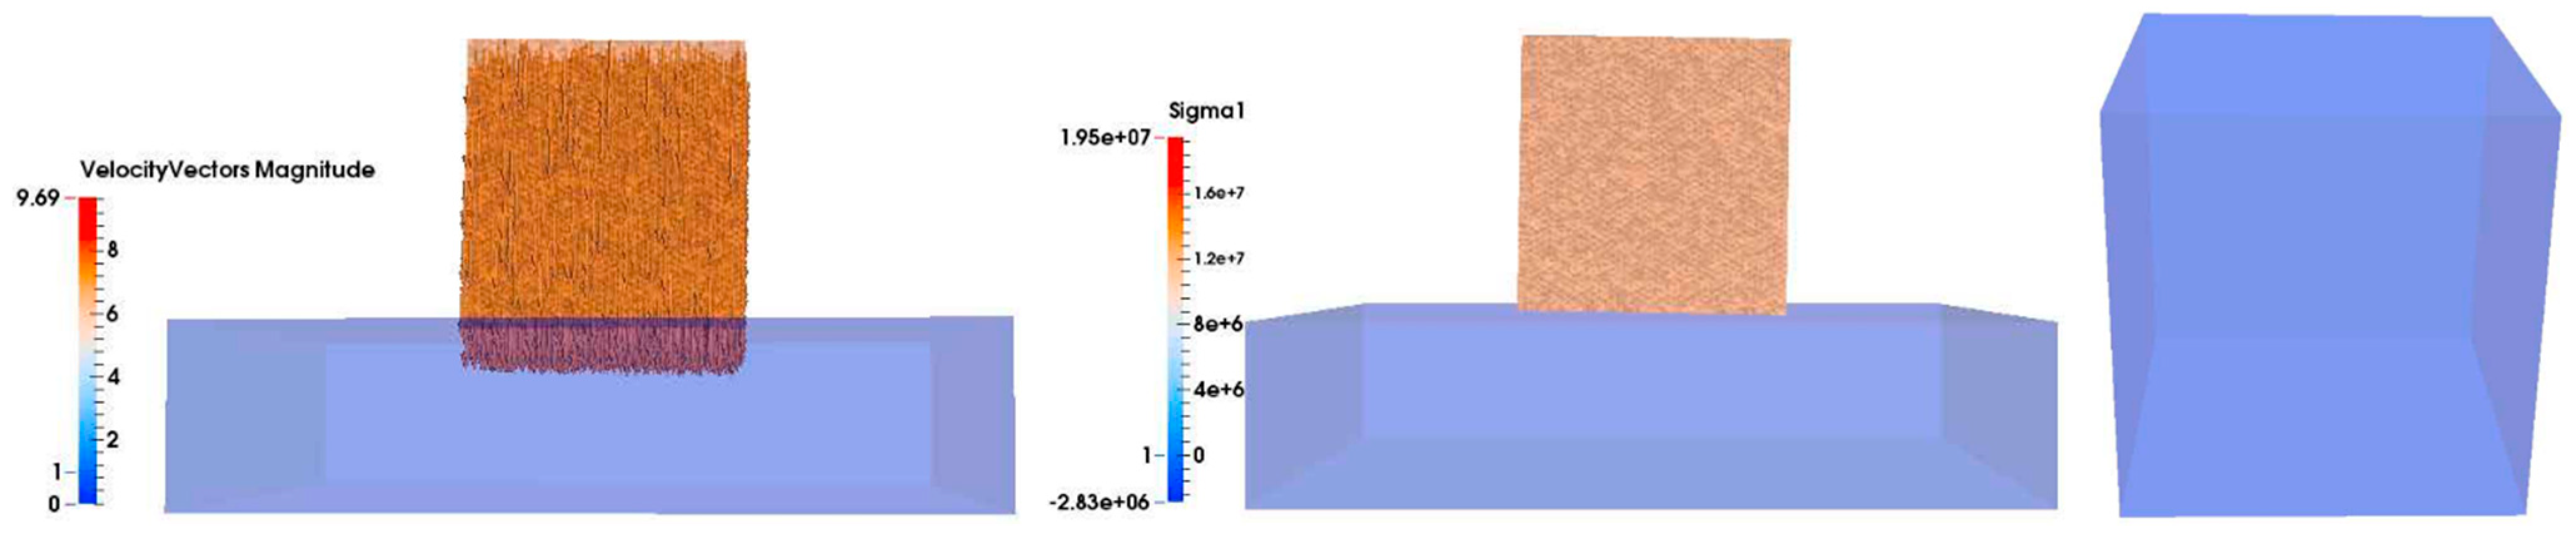
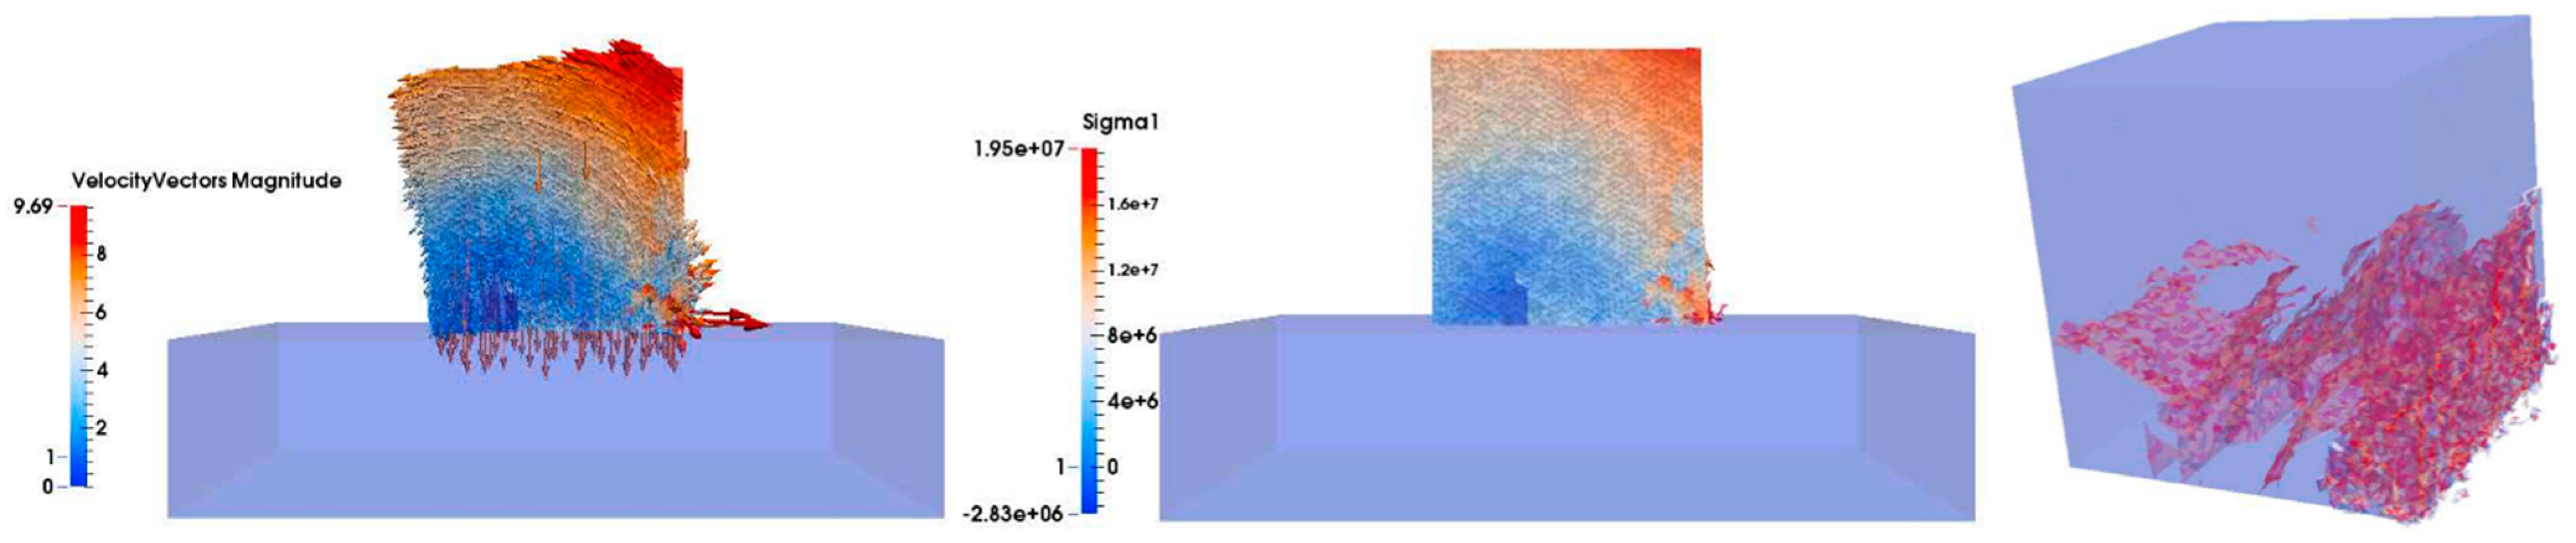
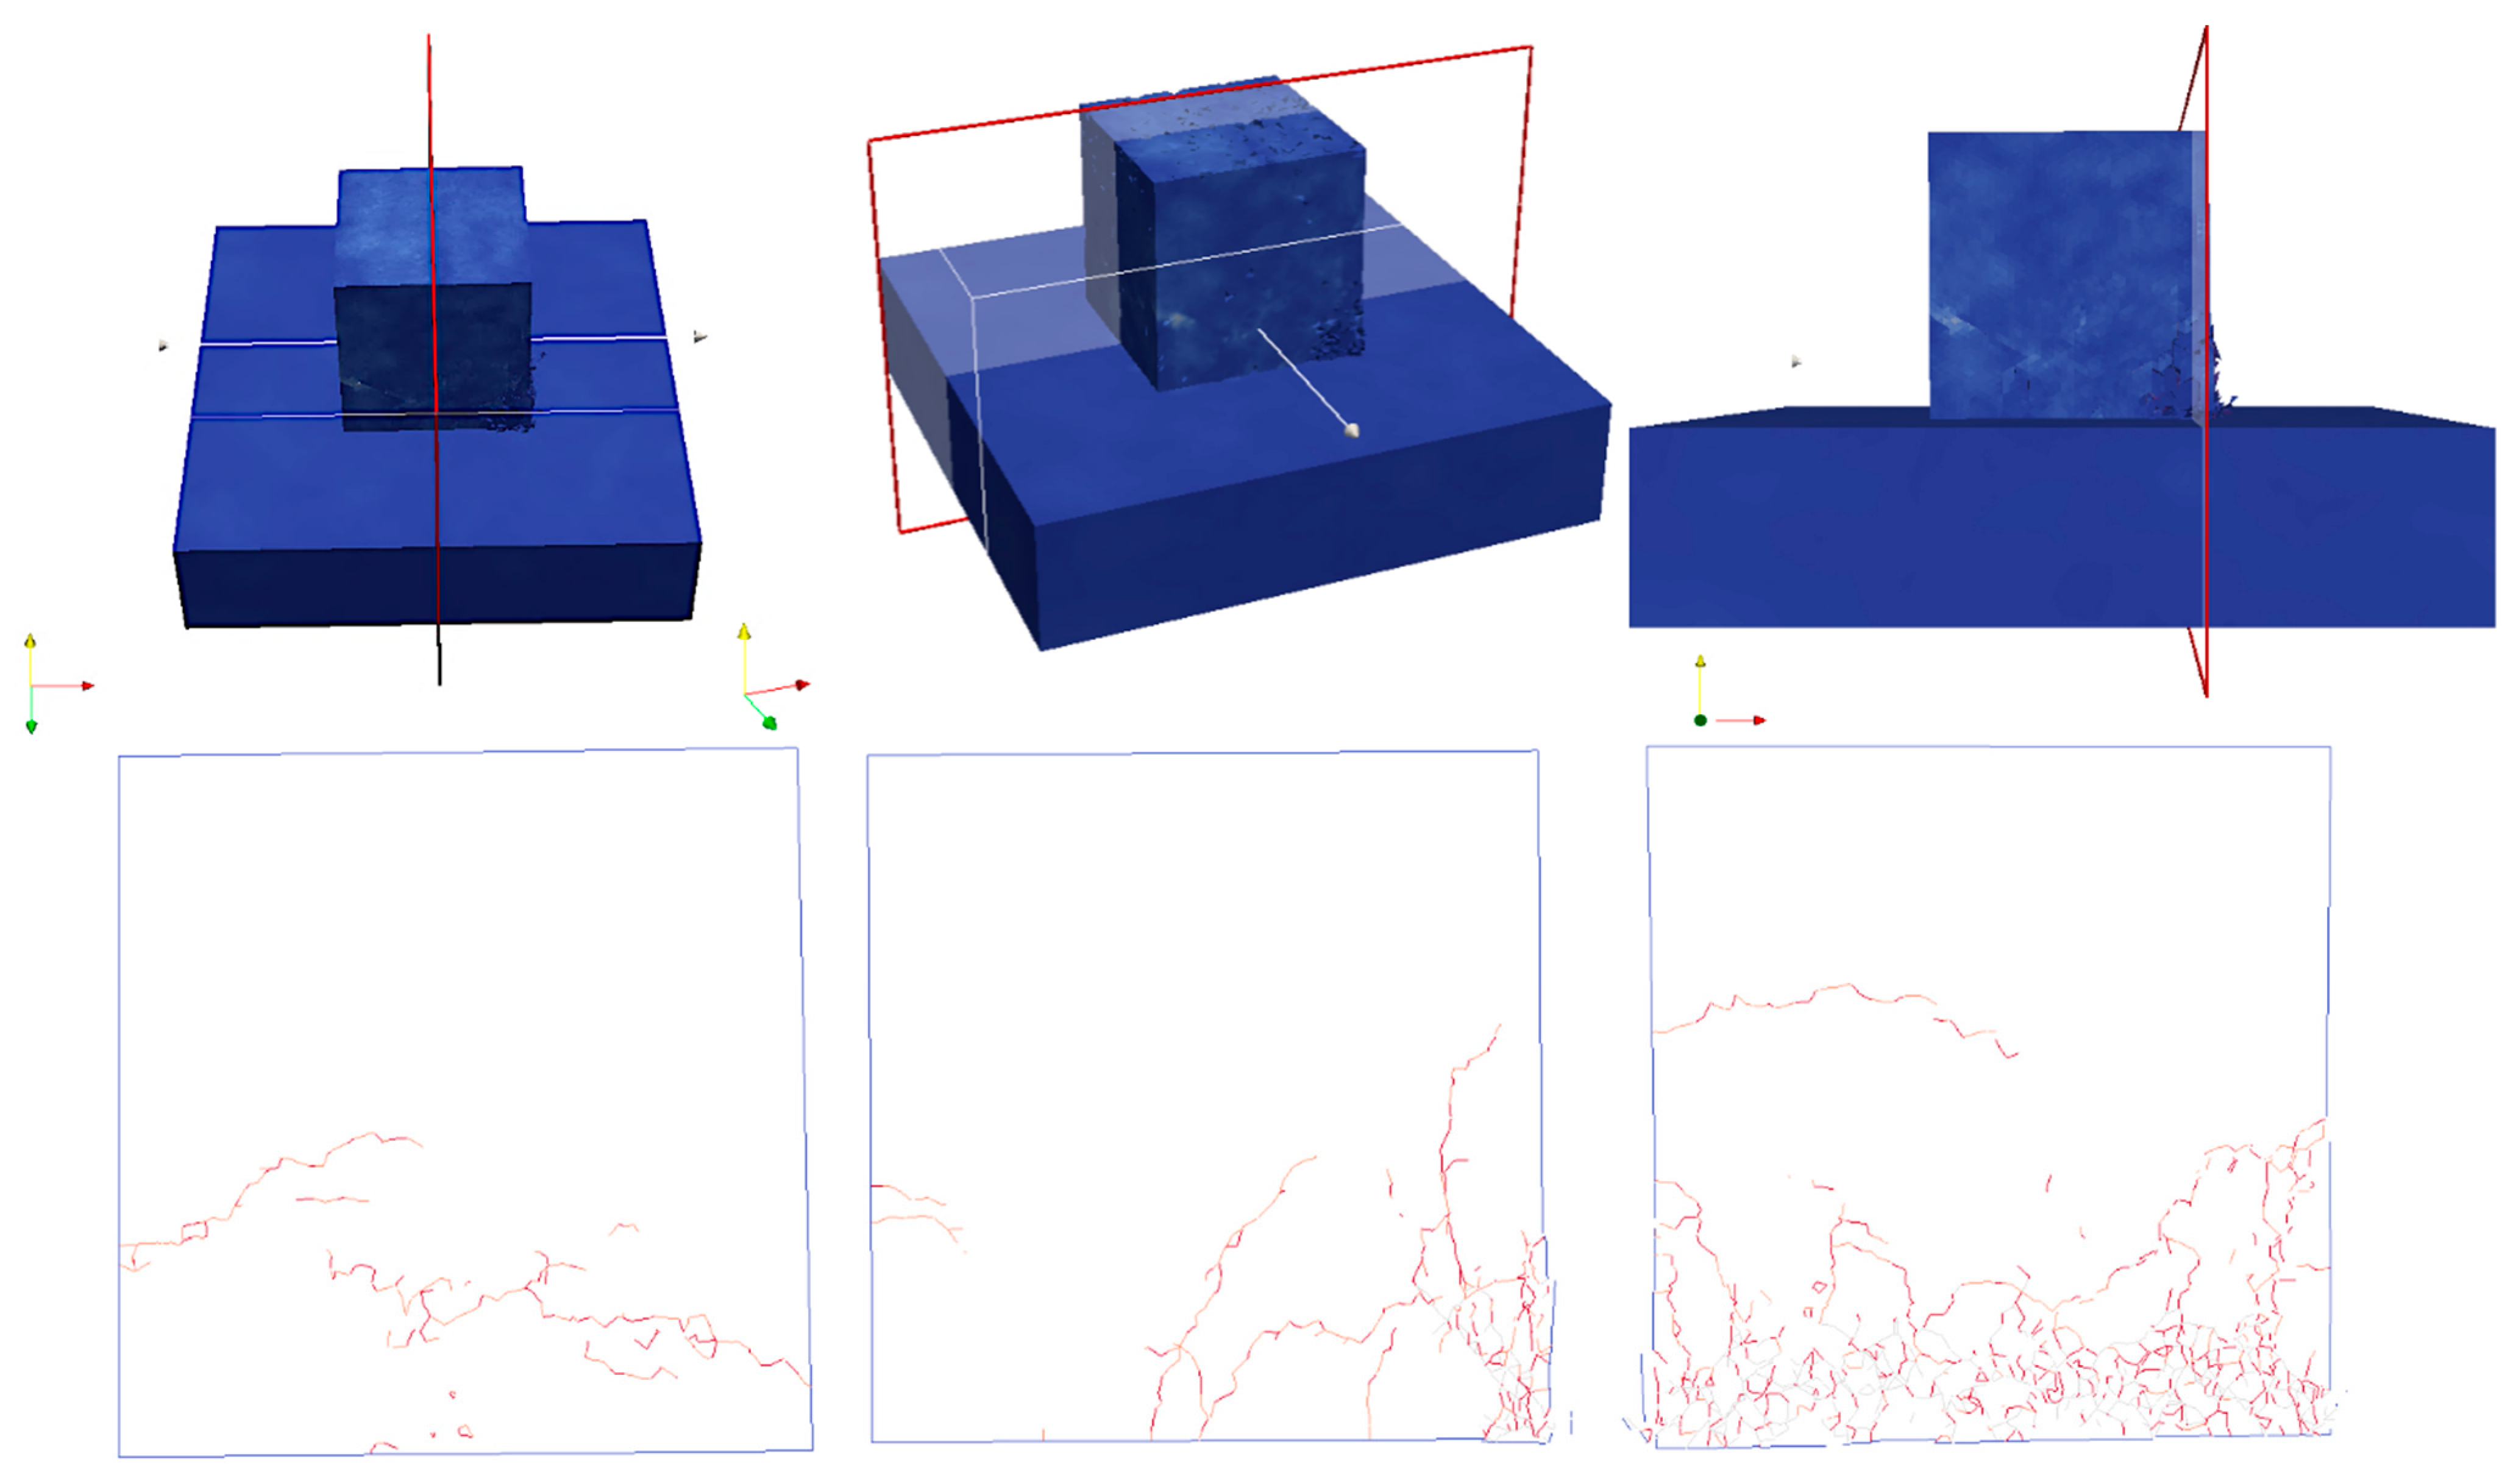
This subsection shows the results of the 15 t Cube drop test, for a drop height of 2 m, arranged in time sequence in order to compare the results with the data provided by Medina et al. (2011). The left-hand column shows the velocity vector and magnitude in the cut plane perpendicular to the y-direction. The middle column shows the maximum principal stress σ1 (Pa) in the cut plane perpendicular to the y-direction, where tensile stress is positive and compressive stress is negative. The right-hand column shows the three-dimensional fracture development in the Cube unit, where the red color represents fractured surfaces.
To better visualize the fracture paths,
Figure 14,
Figure 15,
Figure 16,
Figure 17,
Figure 18,
Figure 19,
Figure 20,
Figure 21 and
Figure 22 are respectively a section perpendicular to the
x-direction, a section perpendicular to the
y-direction passing through the center of the unit, and a section perpendicular to the
x-direction, passing near the edge of the Cube (where there is the highest density of cracks) at the last frame of the simulation.
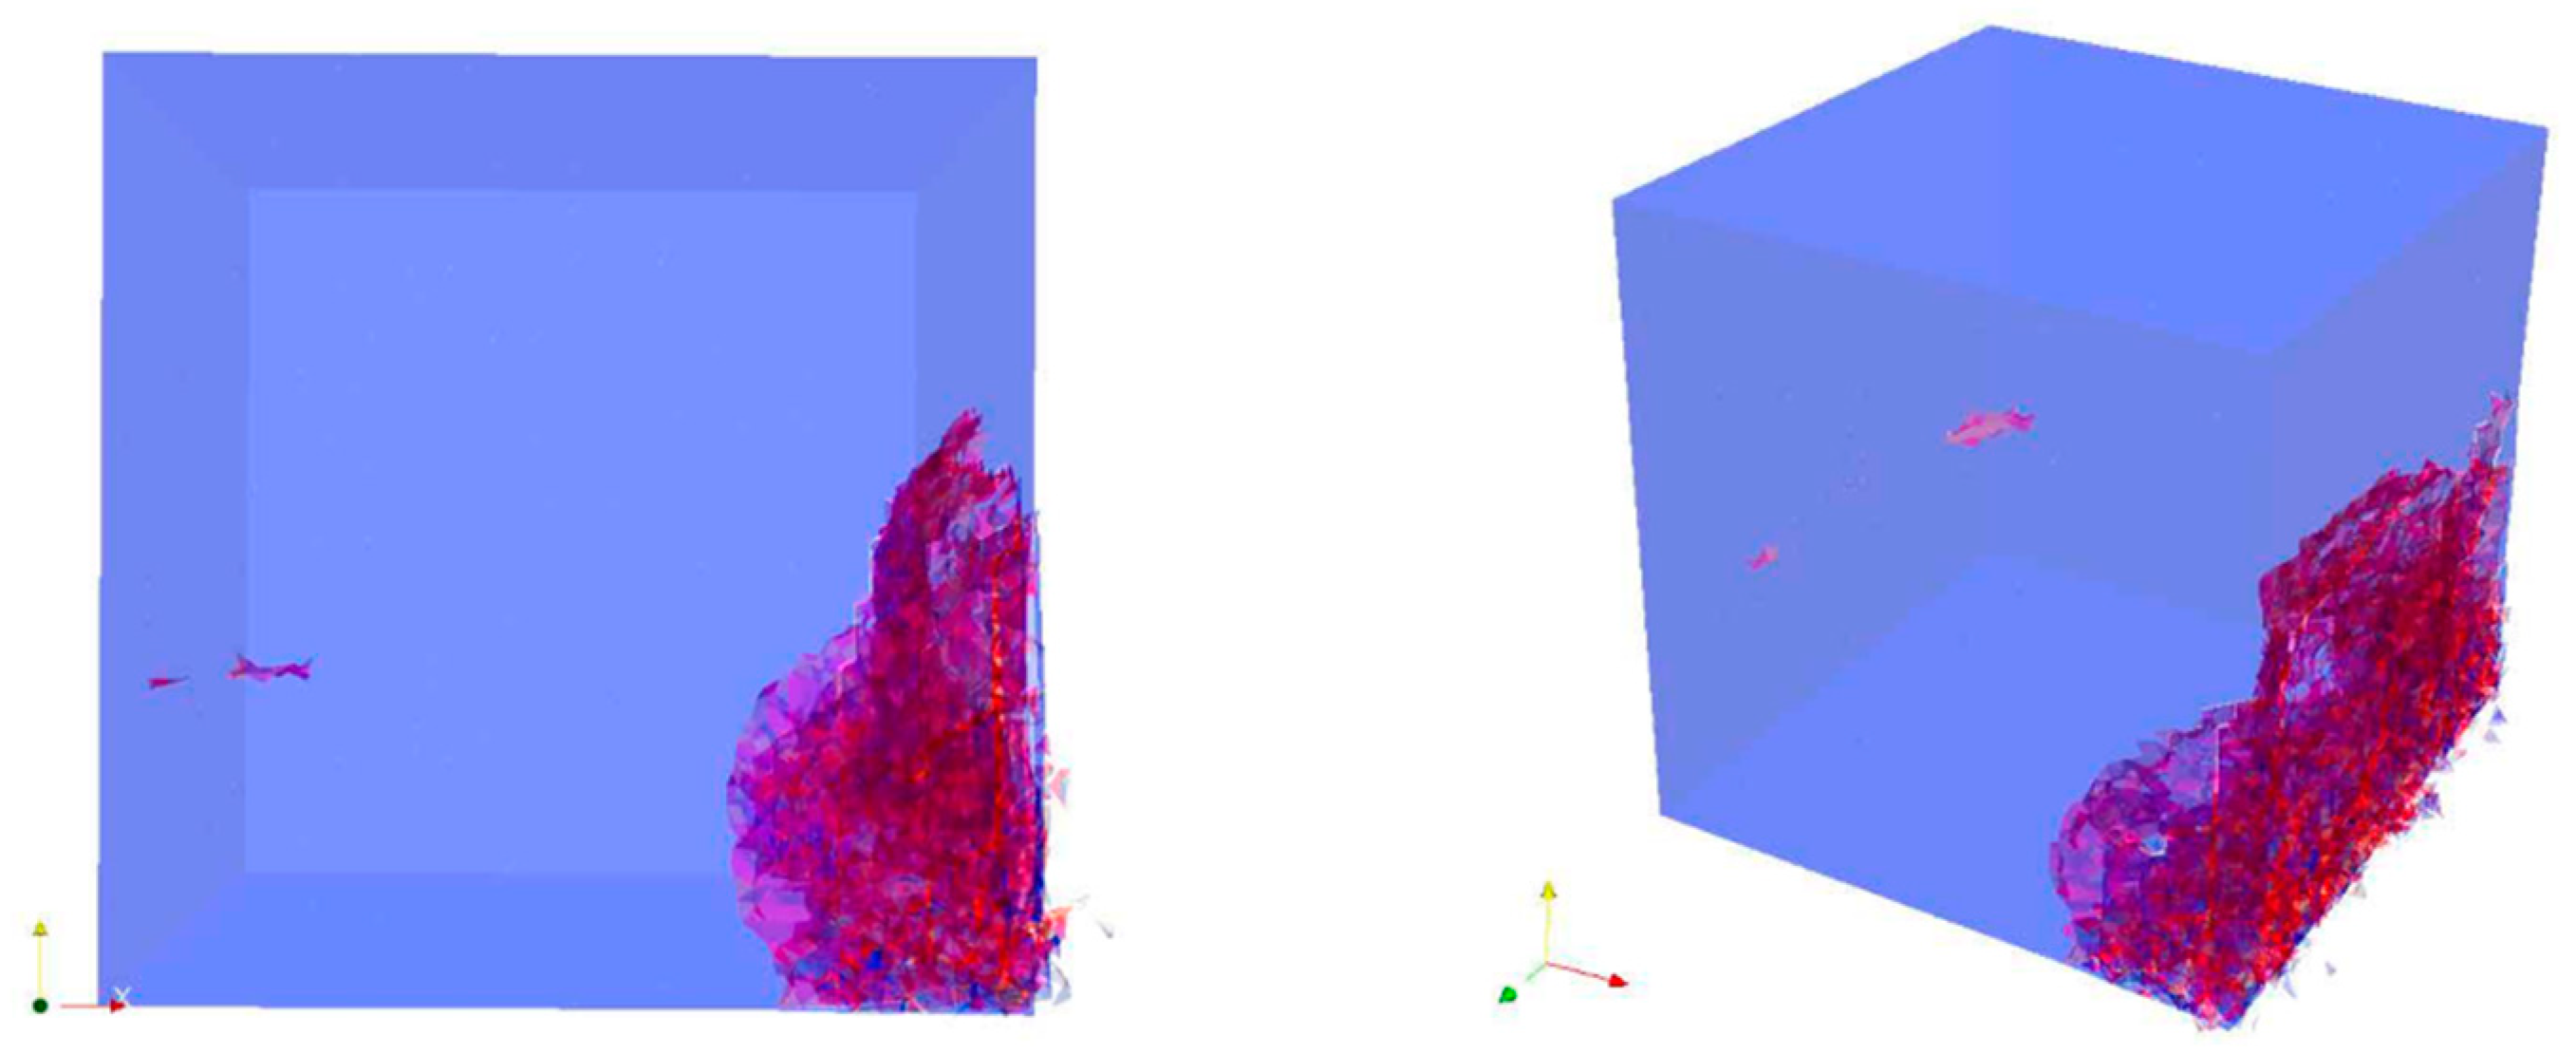
The above results accurately capture the evolution of the fractures inside the unit during the test. Originally, in frame 1, the velocity of the Cube was 6.024 m/s when about to fall on the platform and no stress was registered from the contact (
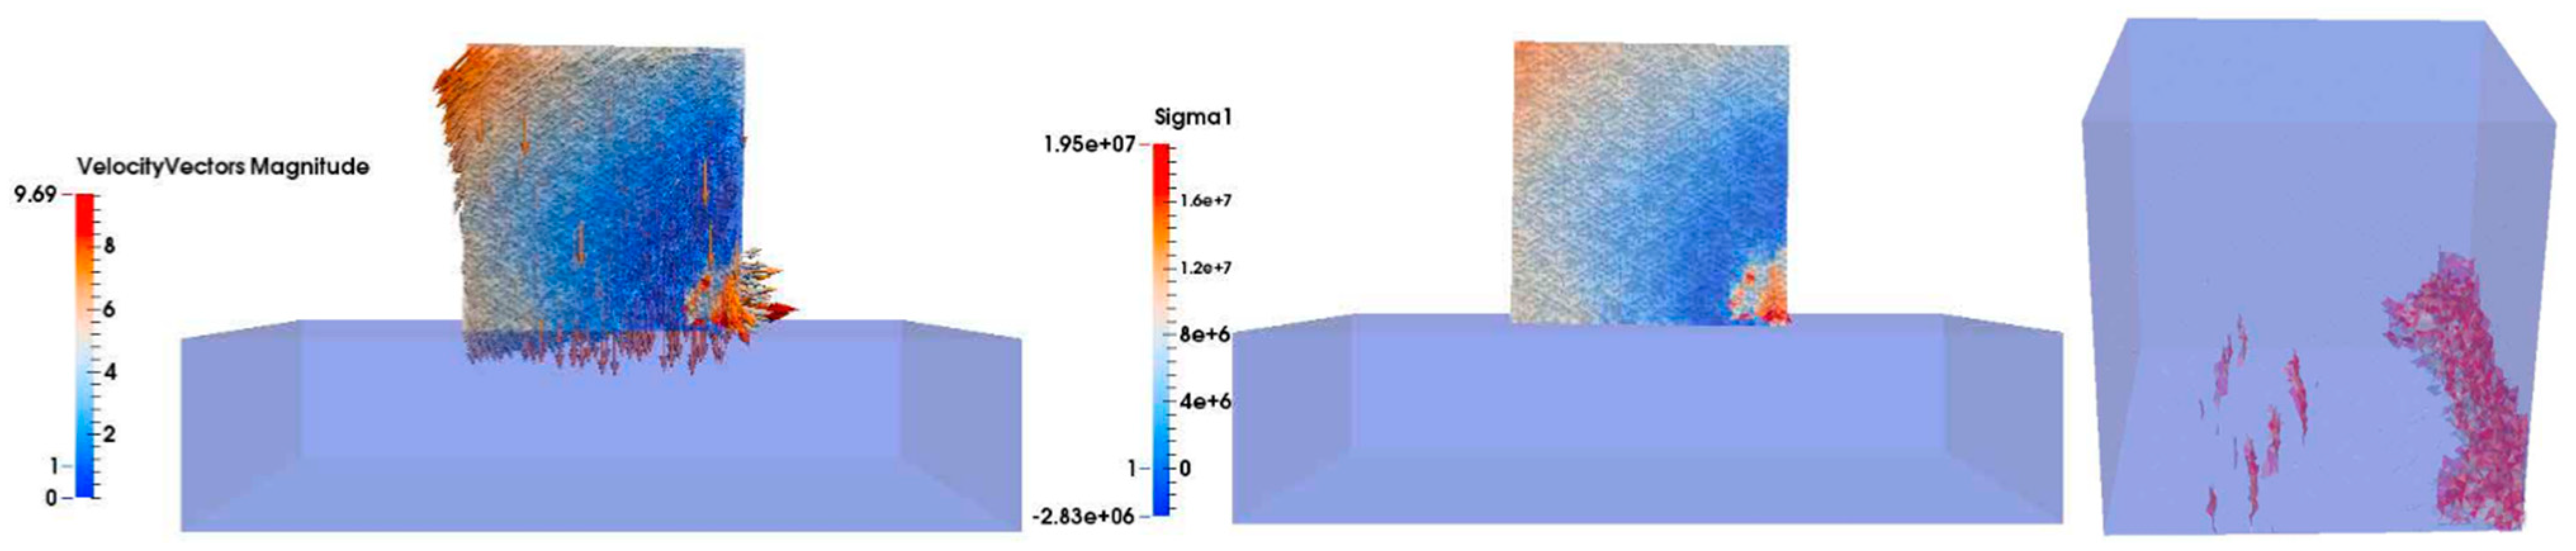
Figure 14). In frame 40, shortly after the impact, some cracks spread along the edge of the cube. Simultaneously, although the trend of the velocity was almost the same, some vectors on the edge of the unit showed the detachment of some fragments, and, by observing the principal tension σ
1, it was possible to observe how the edge of the Cube experienced compression and the stress wave was at the point of spreading inside the unit (
Figure 15). In frame 84, it is worth noting that the fractures along the edge continued to develop but there were new vertical cracks along the
y-direction on the bottom side of the Cube (
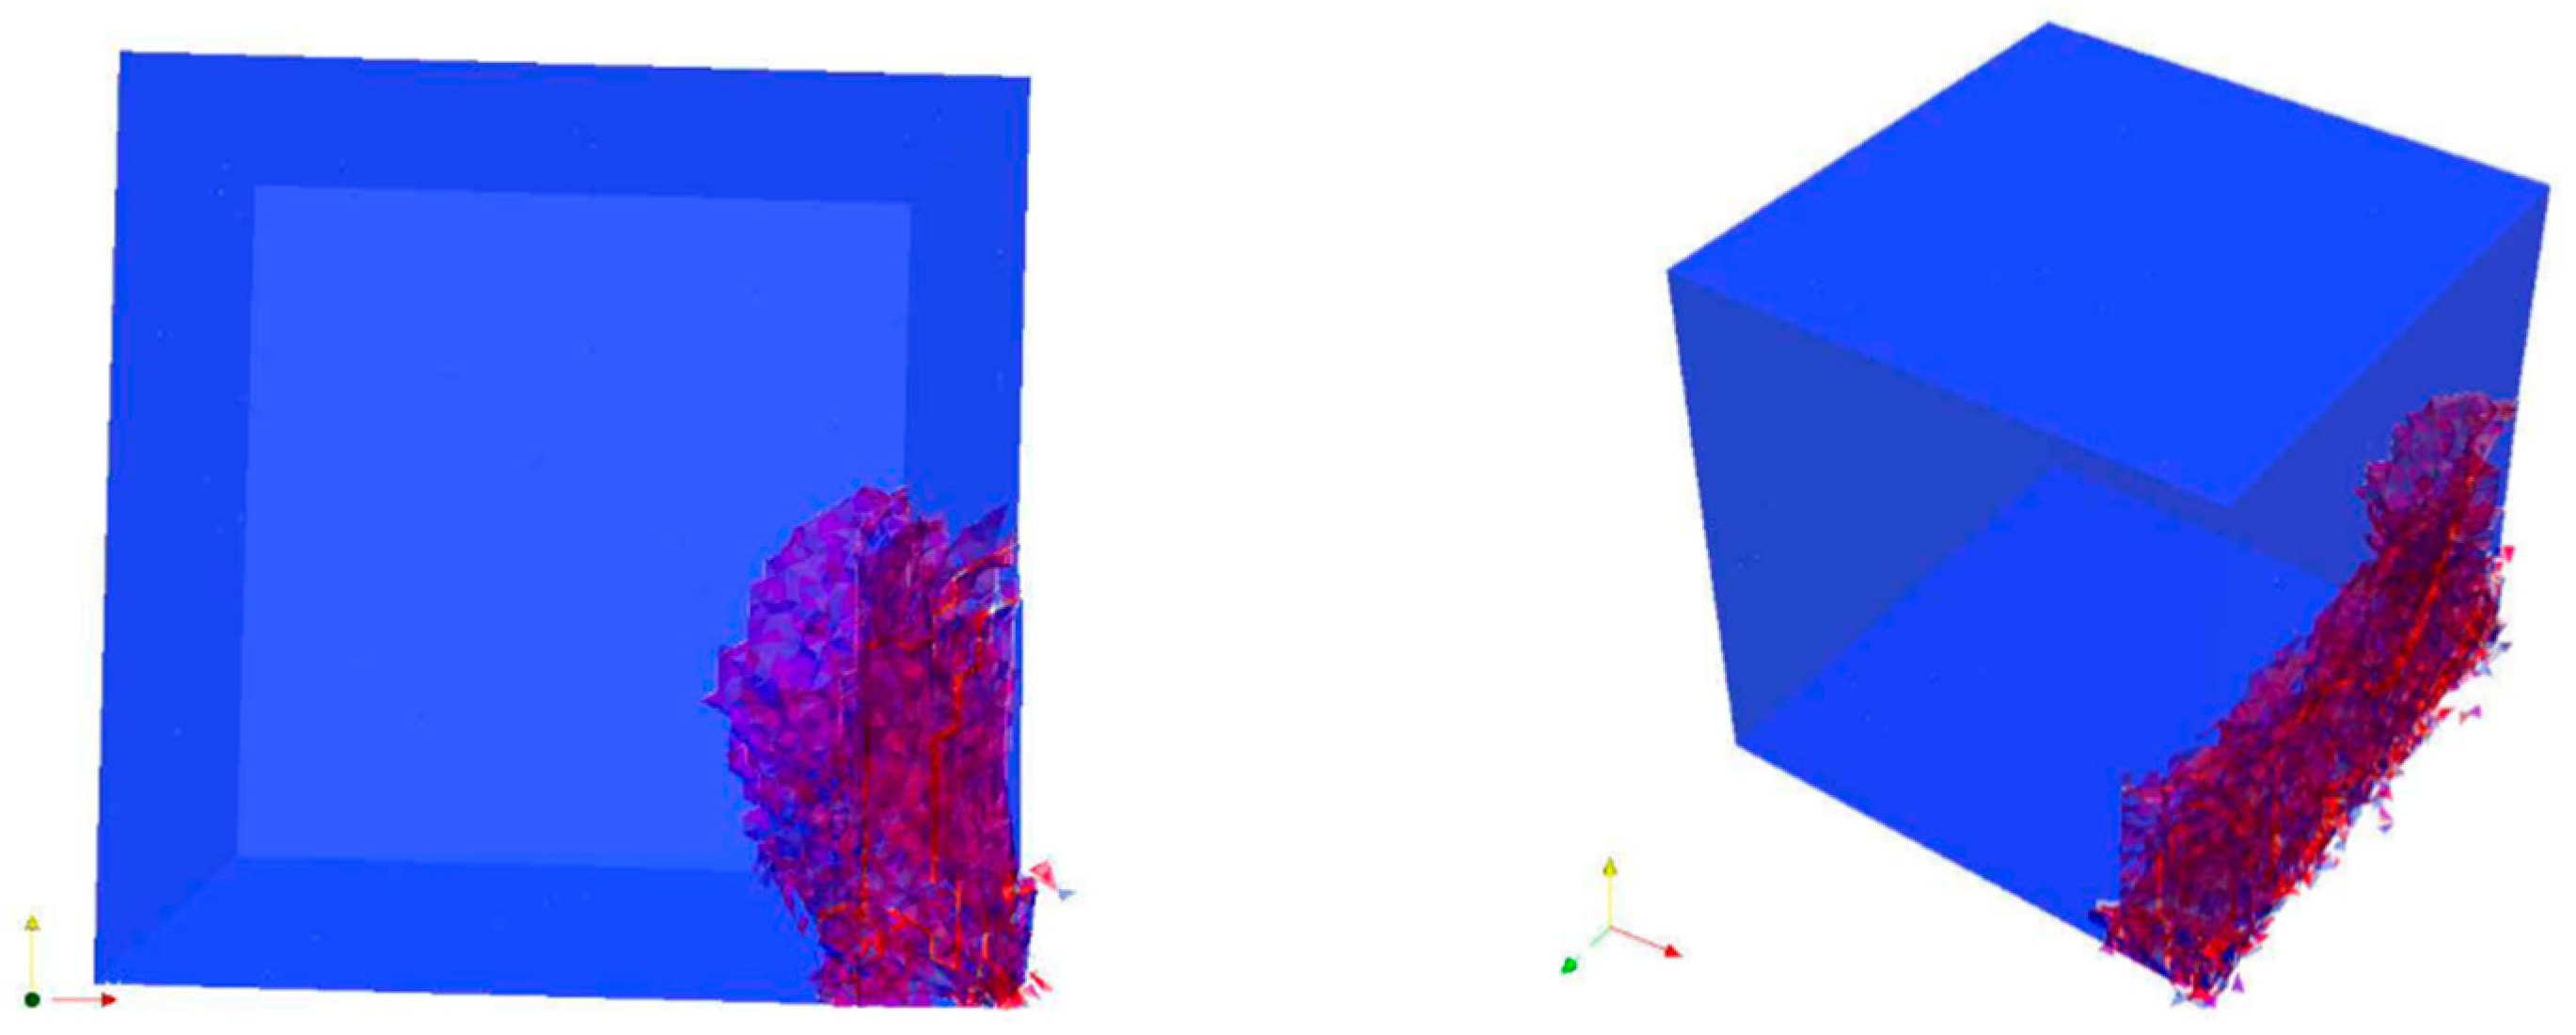
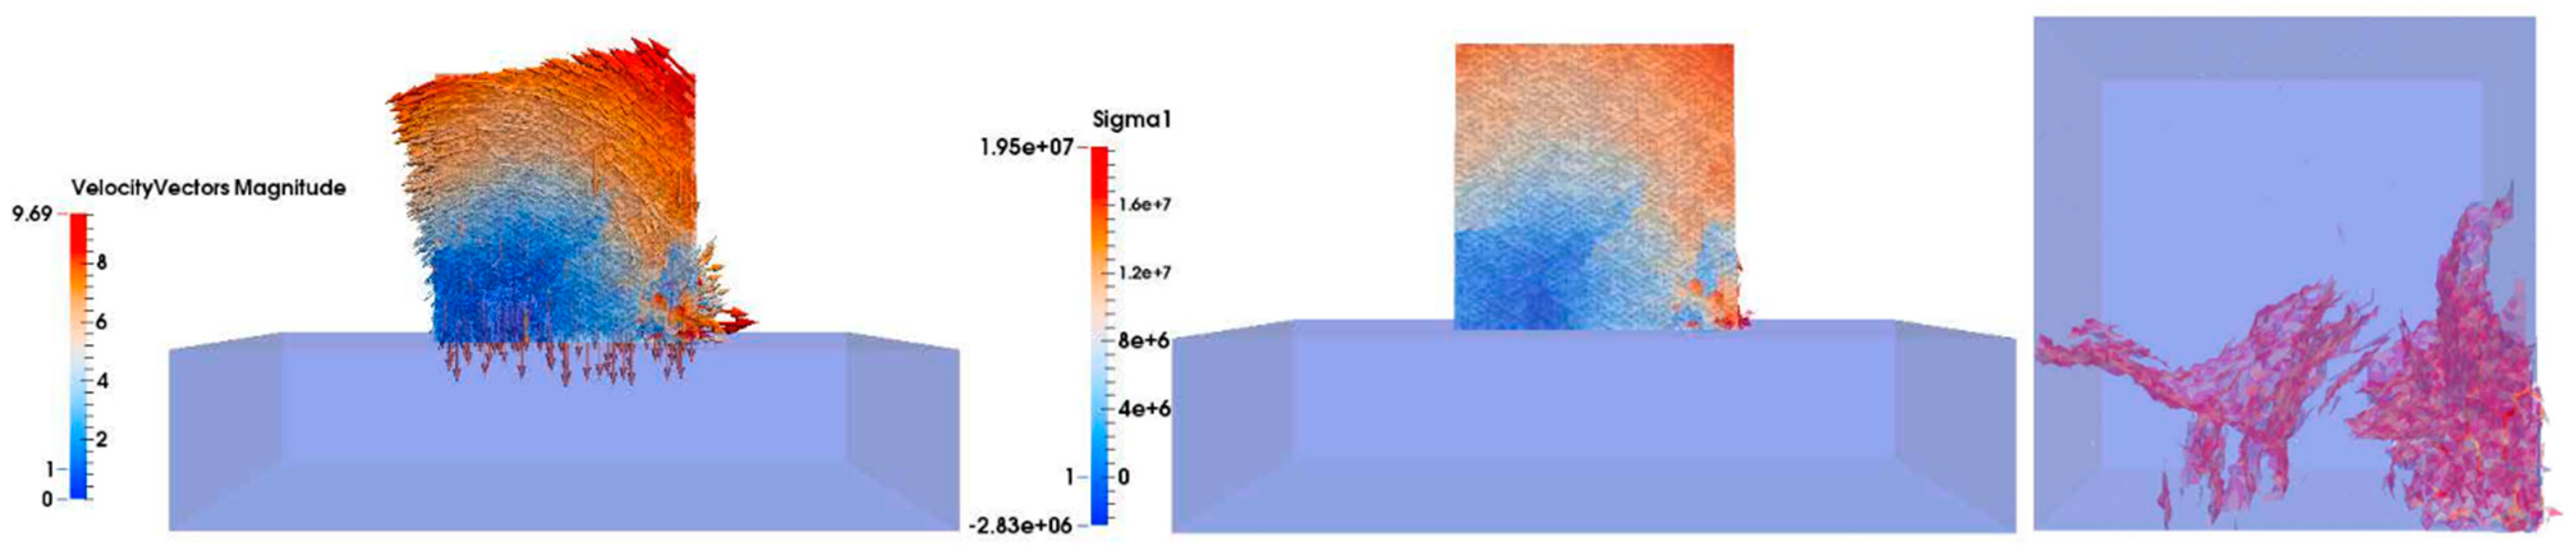
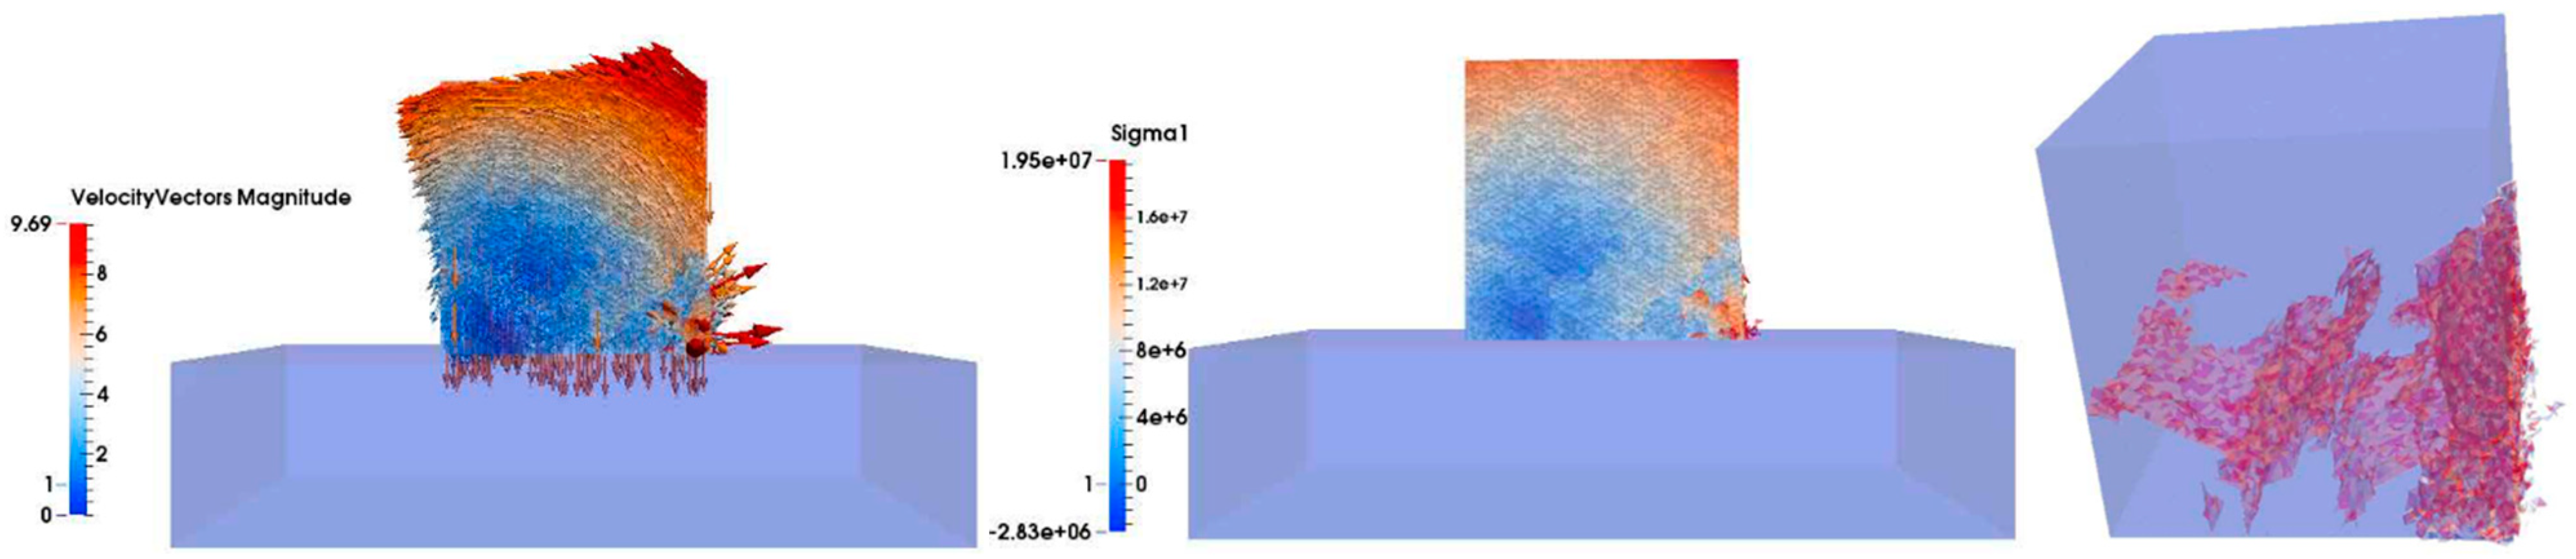
Figure 16). In frame 110, new fractures were generated parallel to the
x-direction (
Figure 17). Thus, three different main directions of fracture were revealed. The velocity and stress trends were the same until frame 170, in which the right-hand edge of the Cube increased its velocity (
Figure 18). Note that when the Cube dropped, at the beginning, it reduced its velocity; however, later, it bounced off the base and the upper part could again move with increasing velocity. In frame 200, all different types of fractures were linked with each other. The main fracture damage was in the area subjected to tensile stress where pieces of concrete split from the unit (
Figure 19 and
Figure 20). Finally, in the last frame (249), in the 2 m drop with tensile strength of 4 MPa, the 45° fracture planes were clearly seen in embryonic form but not fully traversing (
Figure 21). By increasing the drop height above 2.25 m, it is considered highly probable that the fully traversing fracture surfaced at 45° would have become evident.
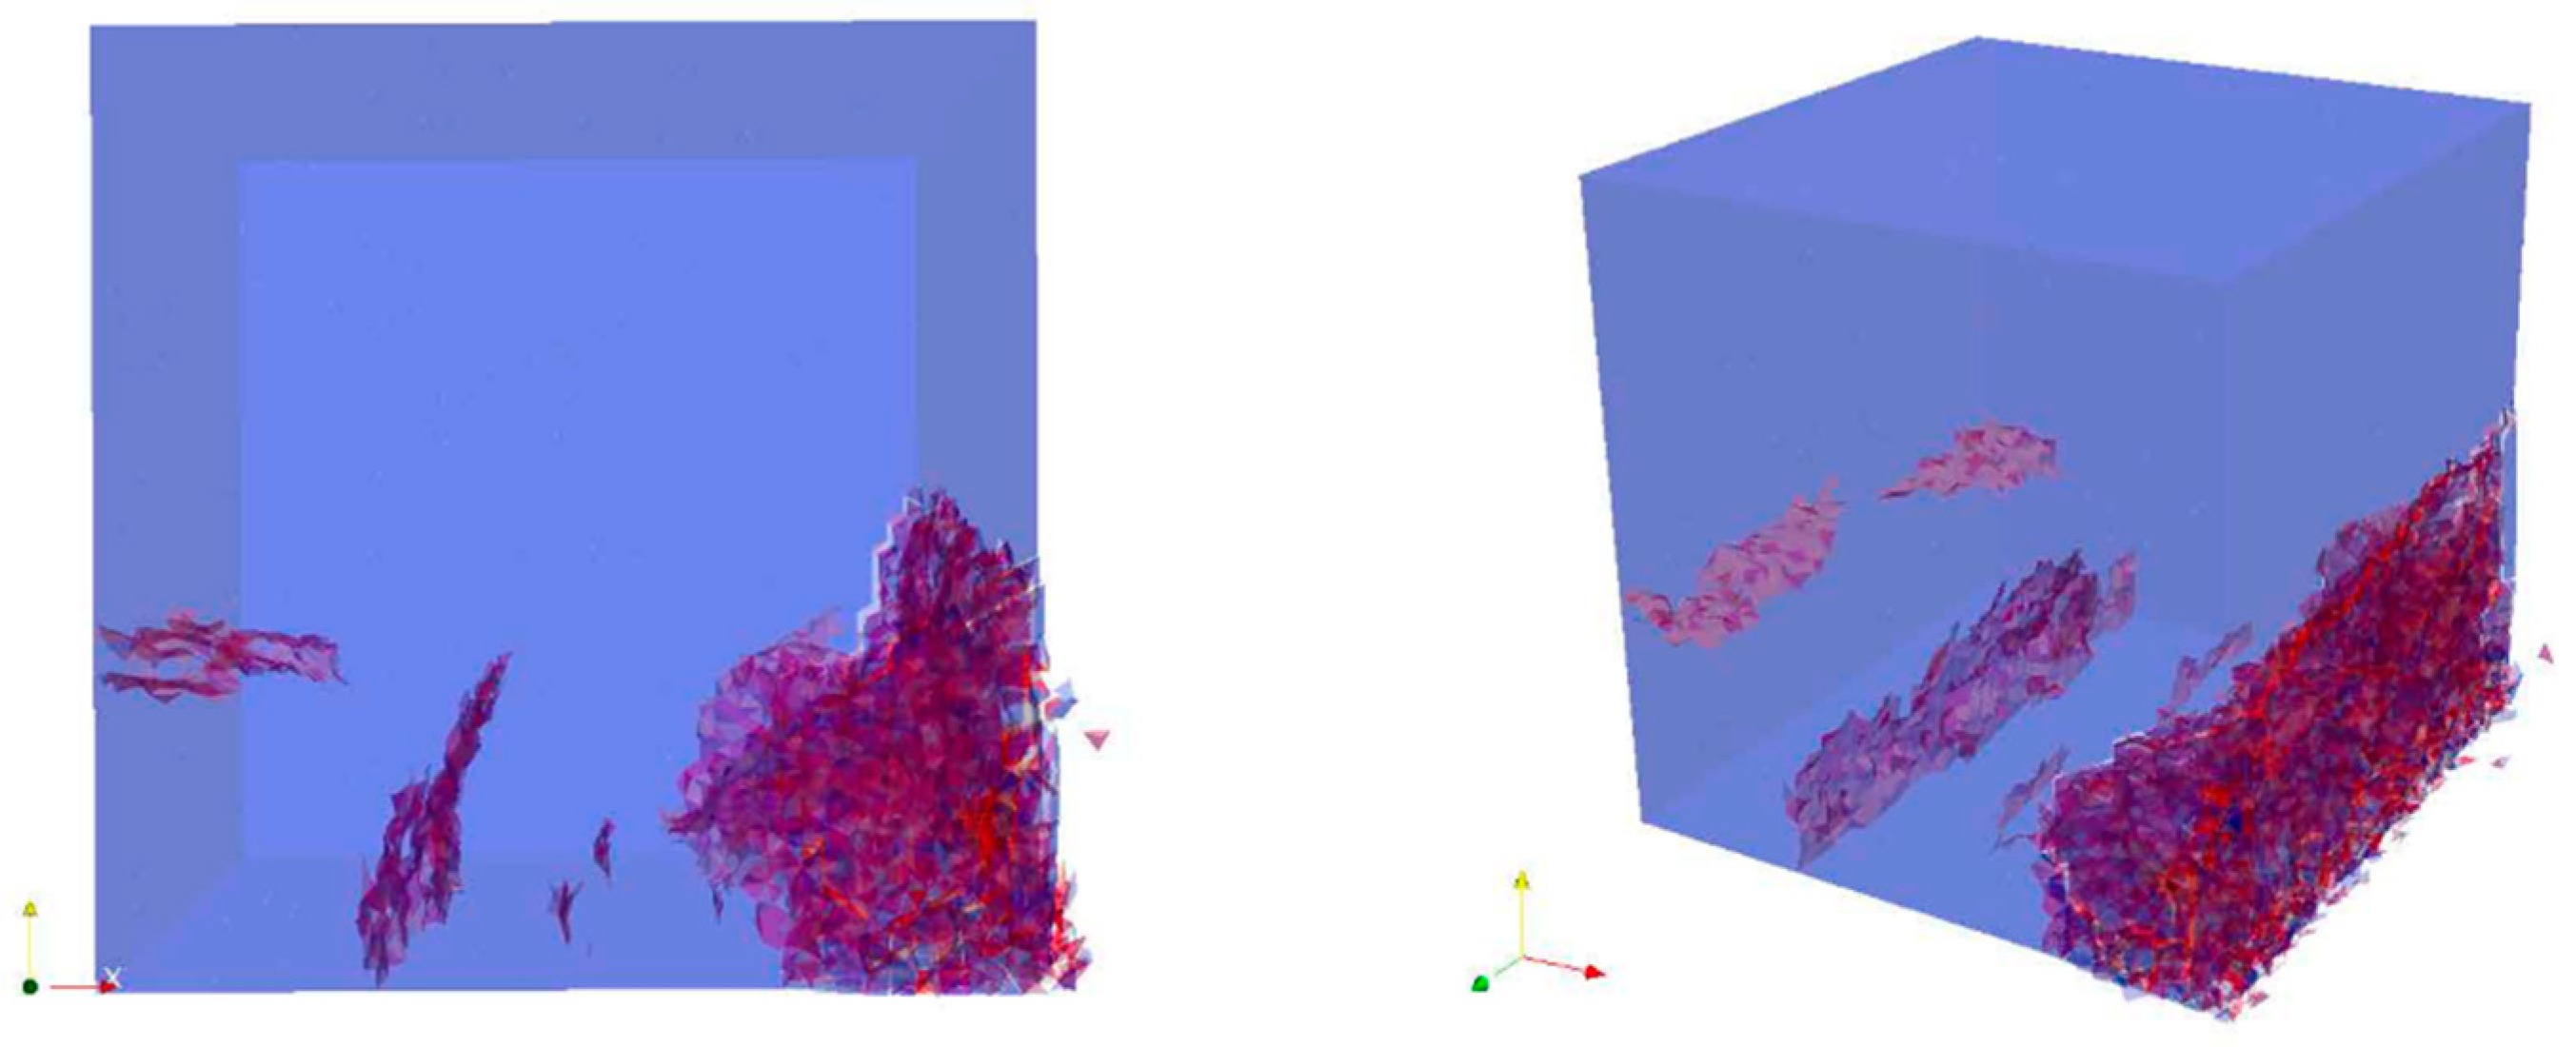
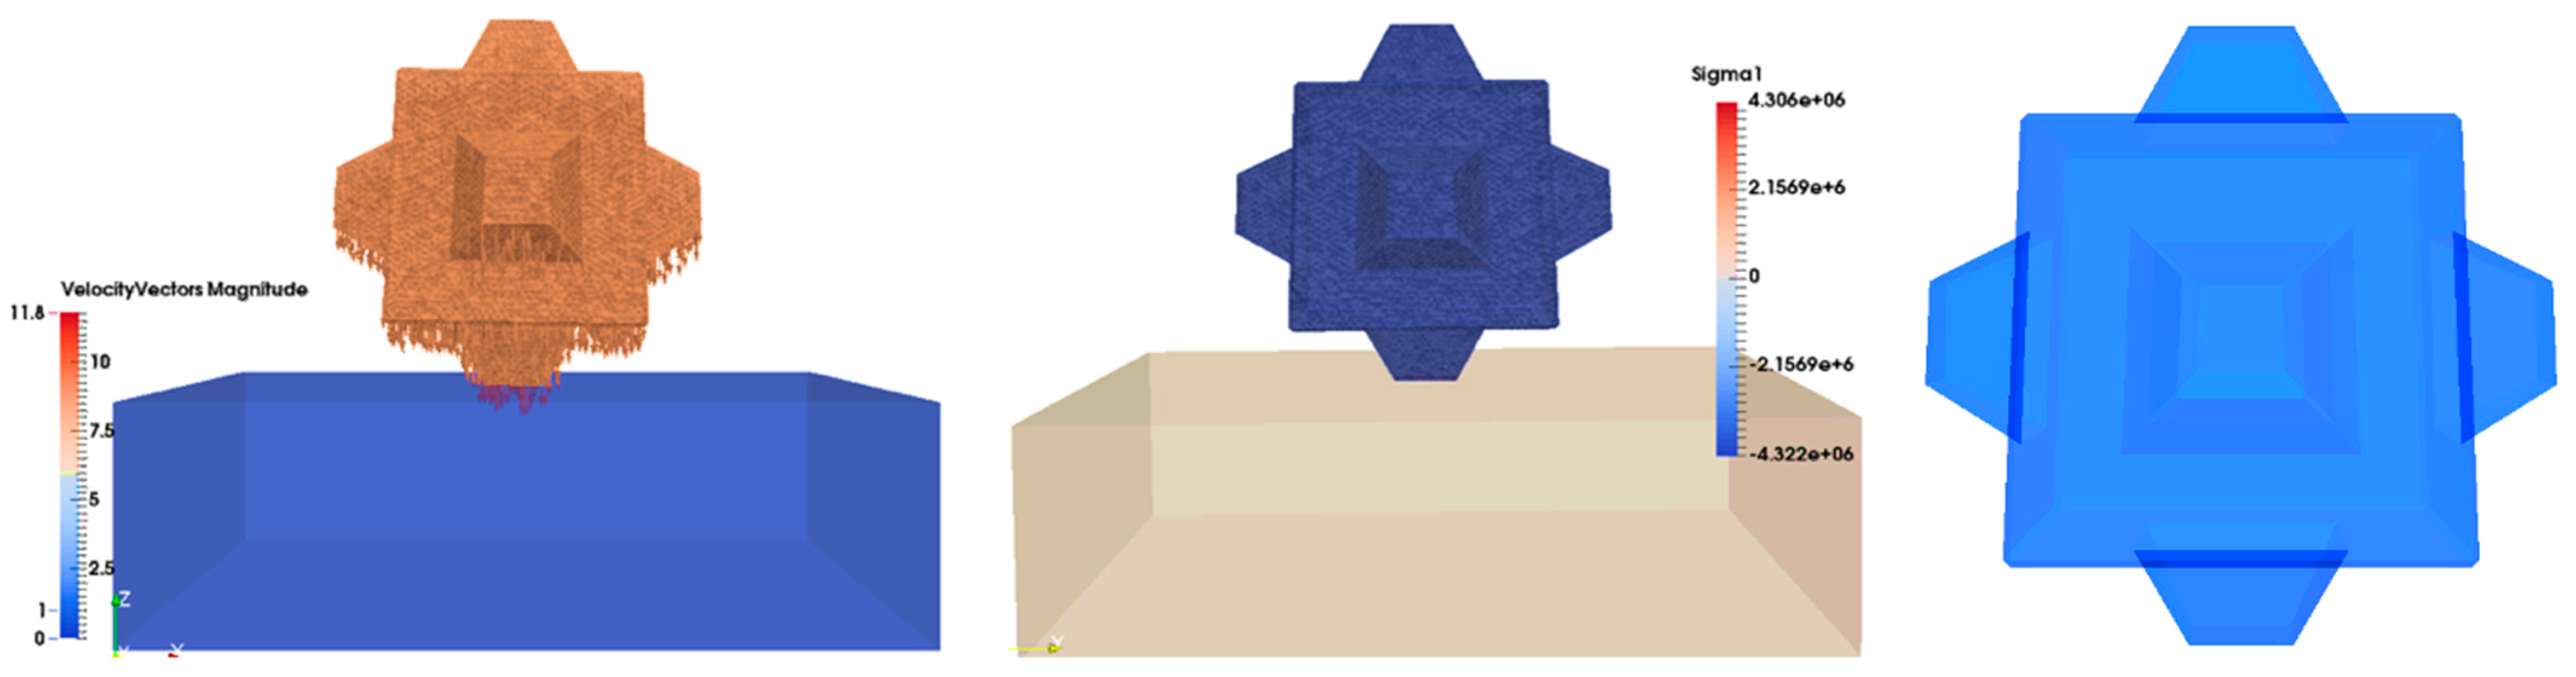
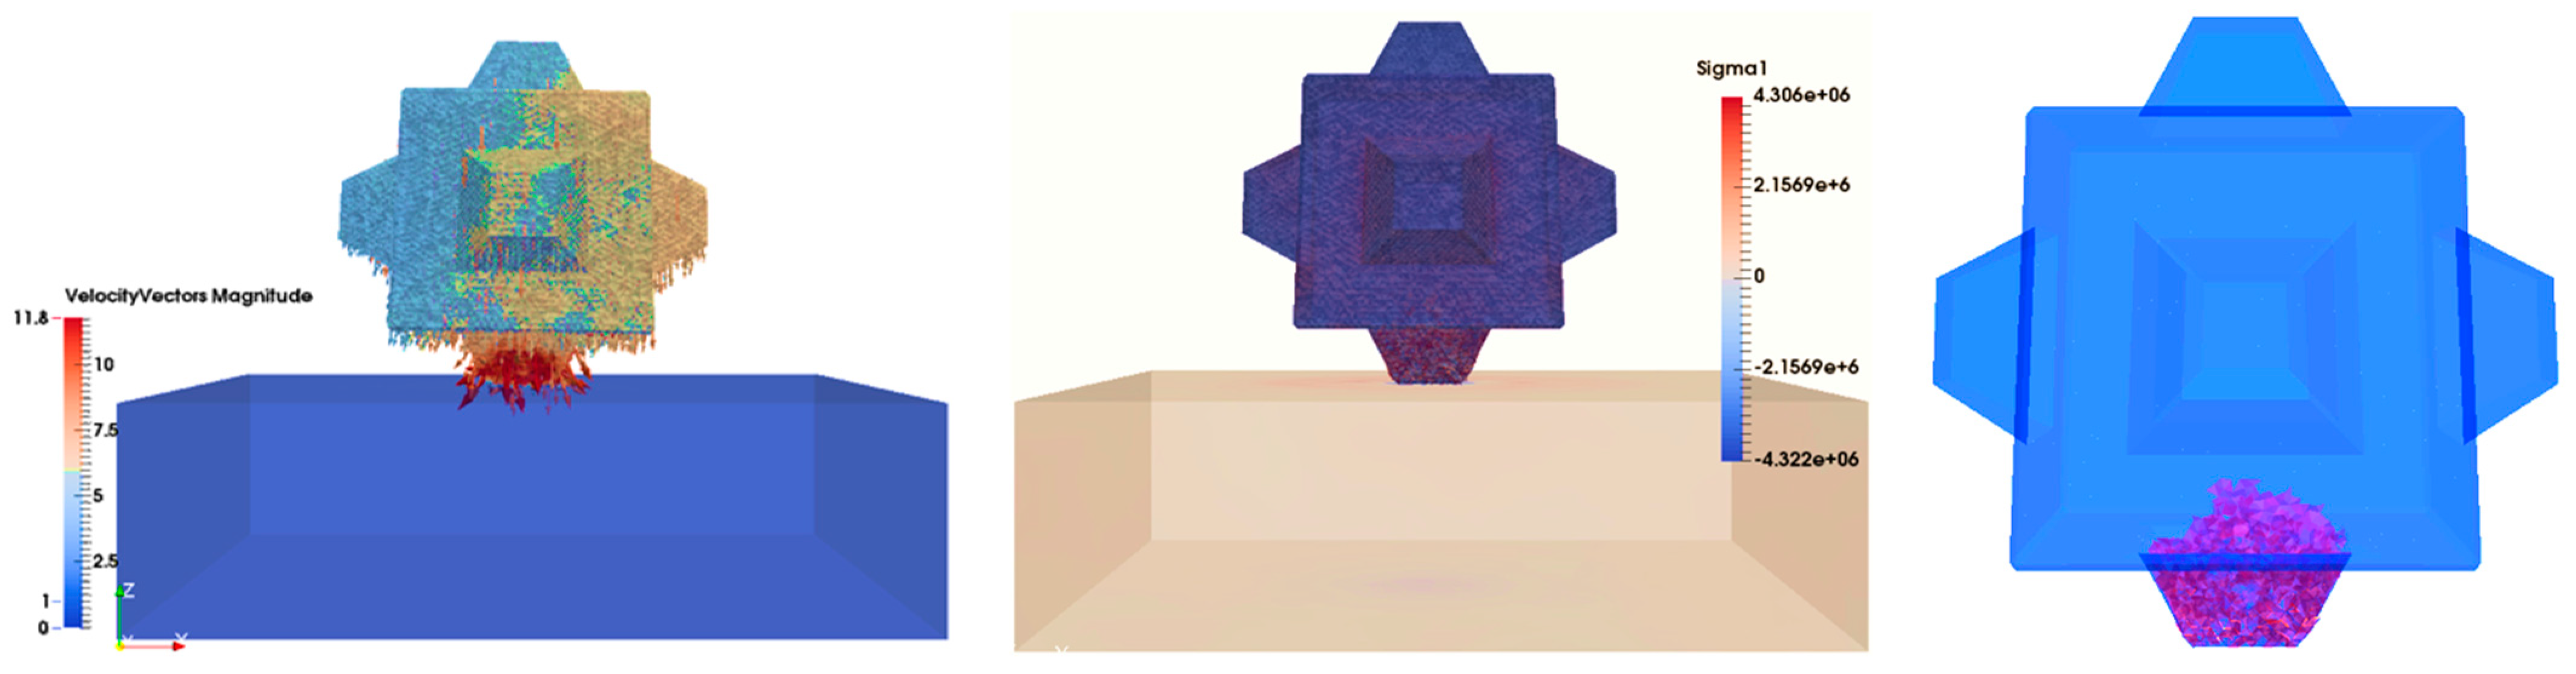
6.2. Cubipod Free-Fall Test Results
To better visualize the fracture paths, internal crack views looking up from the base and the surface cracking view from the side are shown in
Figure 31.
Figure 32 shows a section perpendicular to the
y-direction, a section perpendicular to the
x-direction passing through the center of the unit, and a section perpendicular to the
z-direction, cutting the lowest leg-shaped body of the Cubipod (where there was the highest density of cracks) in the last frame of the simulation.
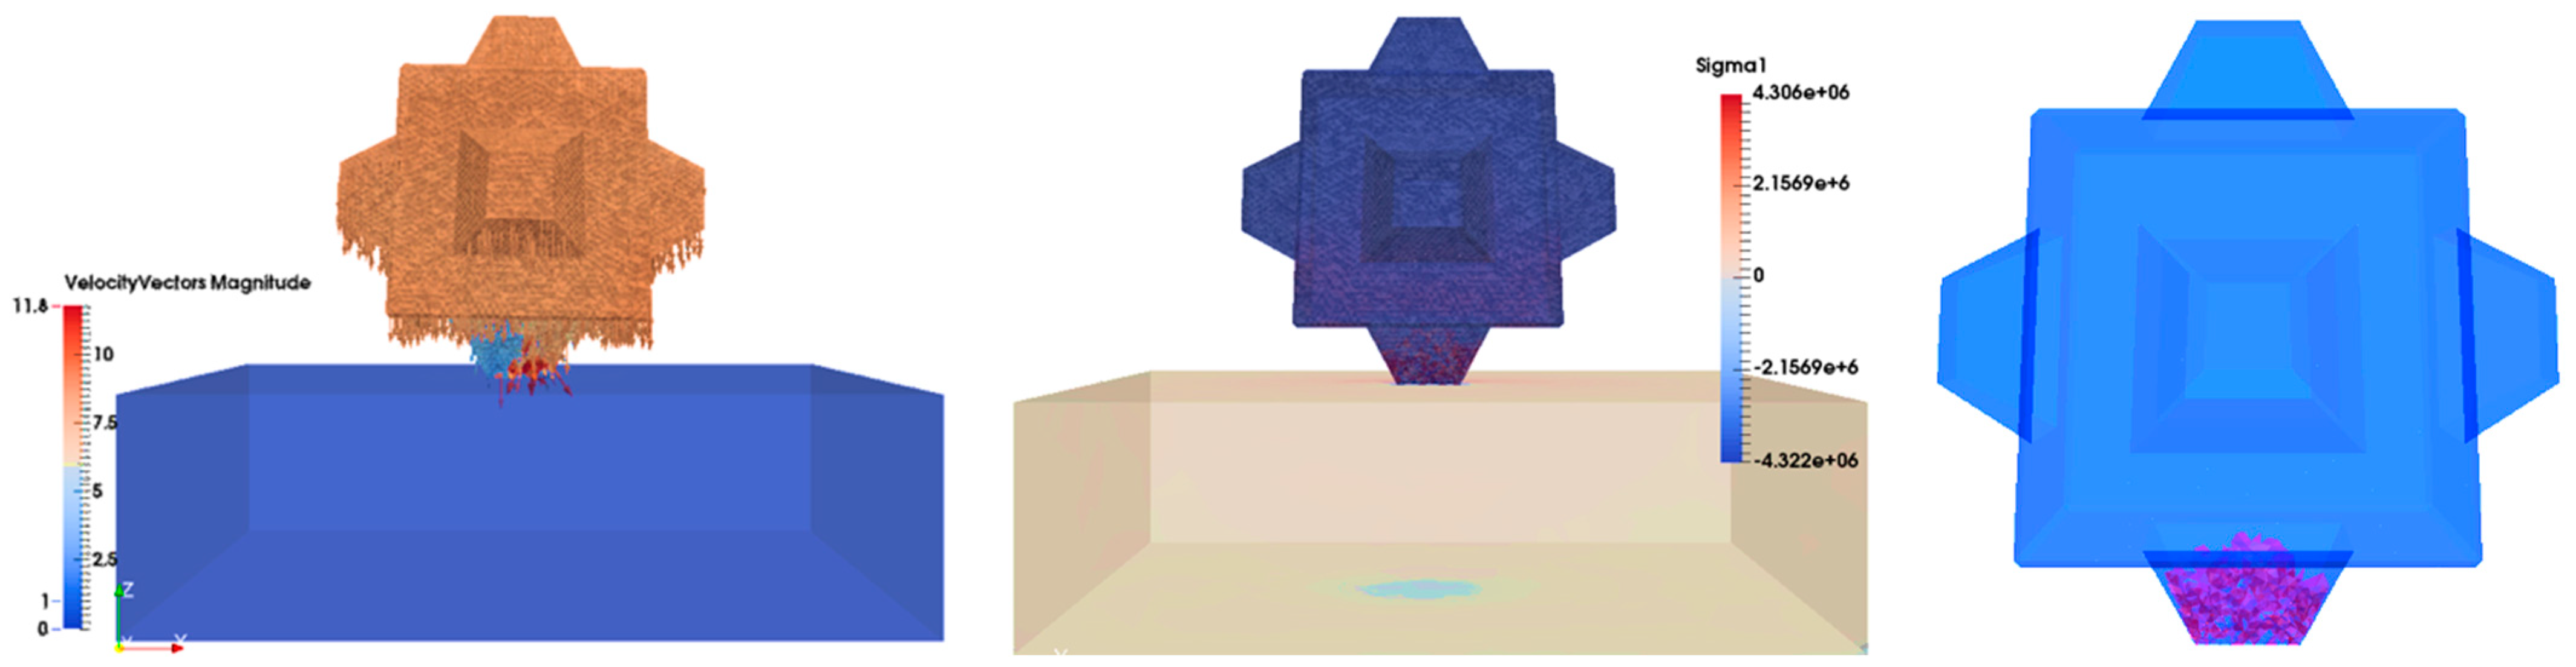
The above results show a clear difference in performance between the Cubipod and the Cube. By providing sacrificial protuberances in the form of cruciform legs that help with interlocking, the Cubipod is stronger for large impacts and is more capable of withstanding major area breakages for the same concrete strength. The Cubipod generates less fracture surface for the higher dynamic loads (as demonstrated when dropped from a higher height than the Cube). Moreover, the fracture patterns are very different.
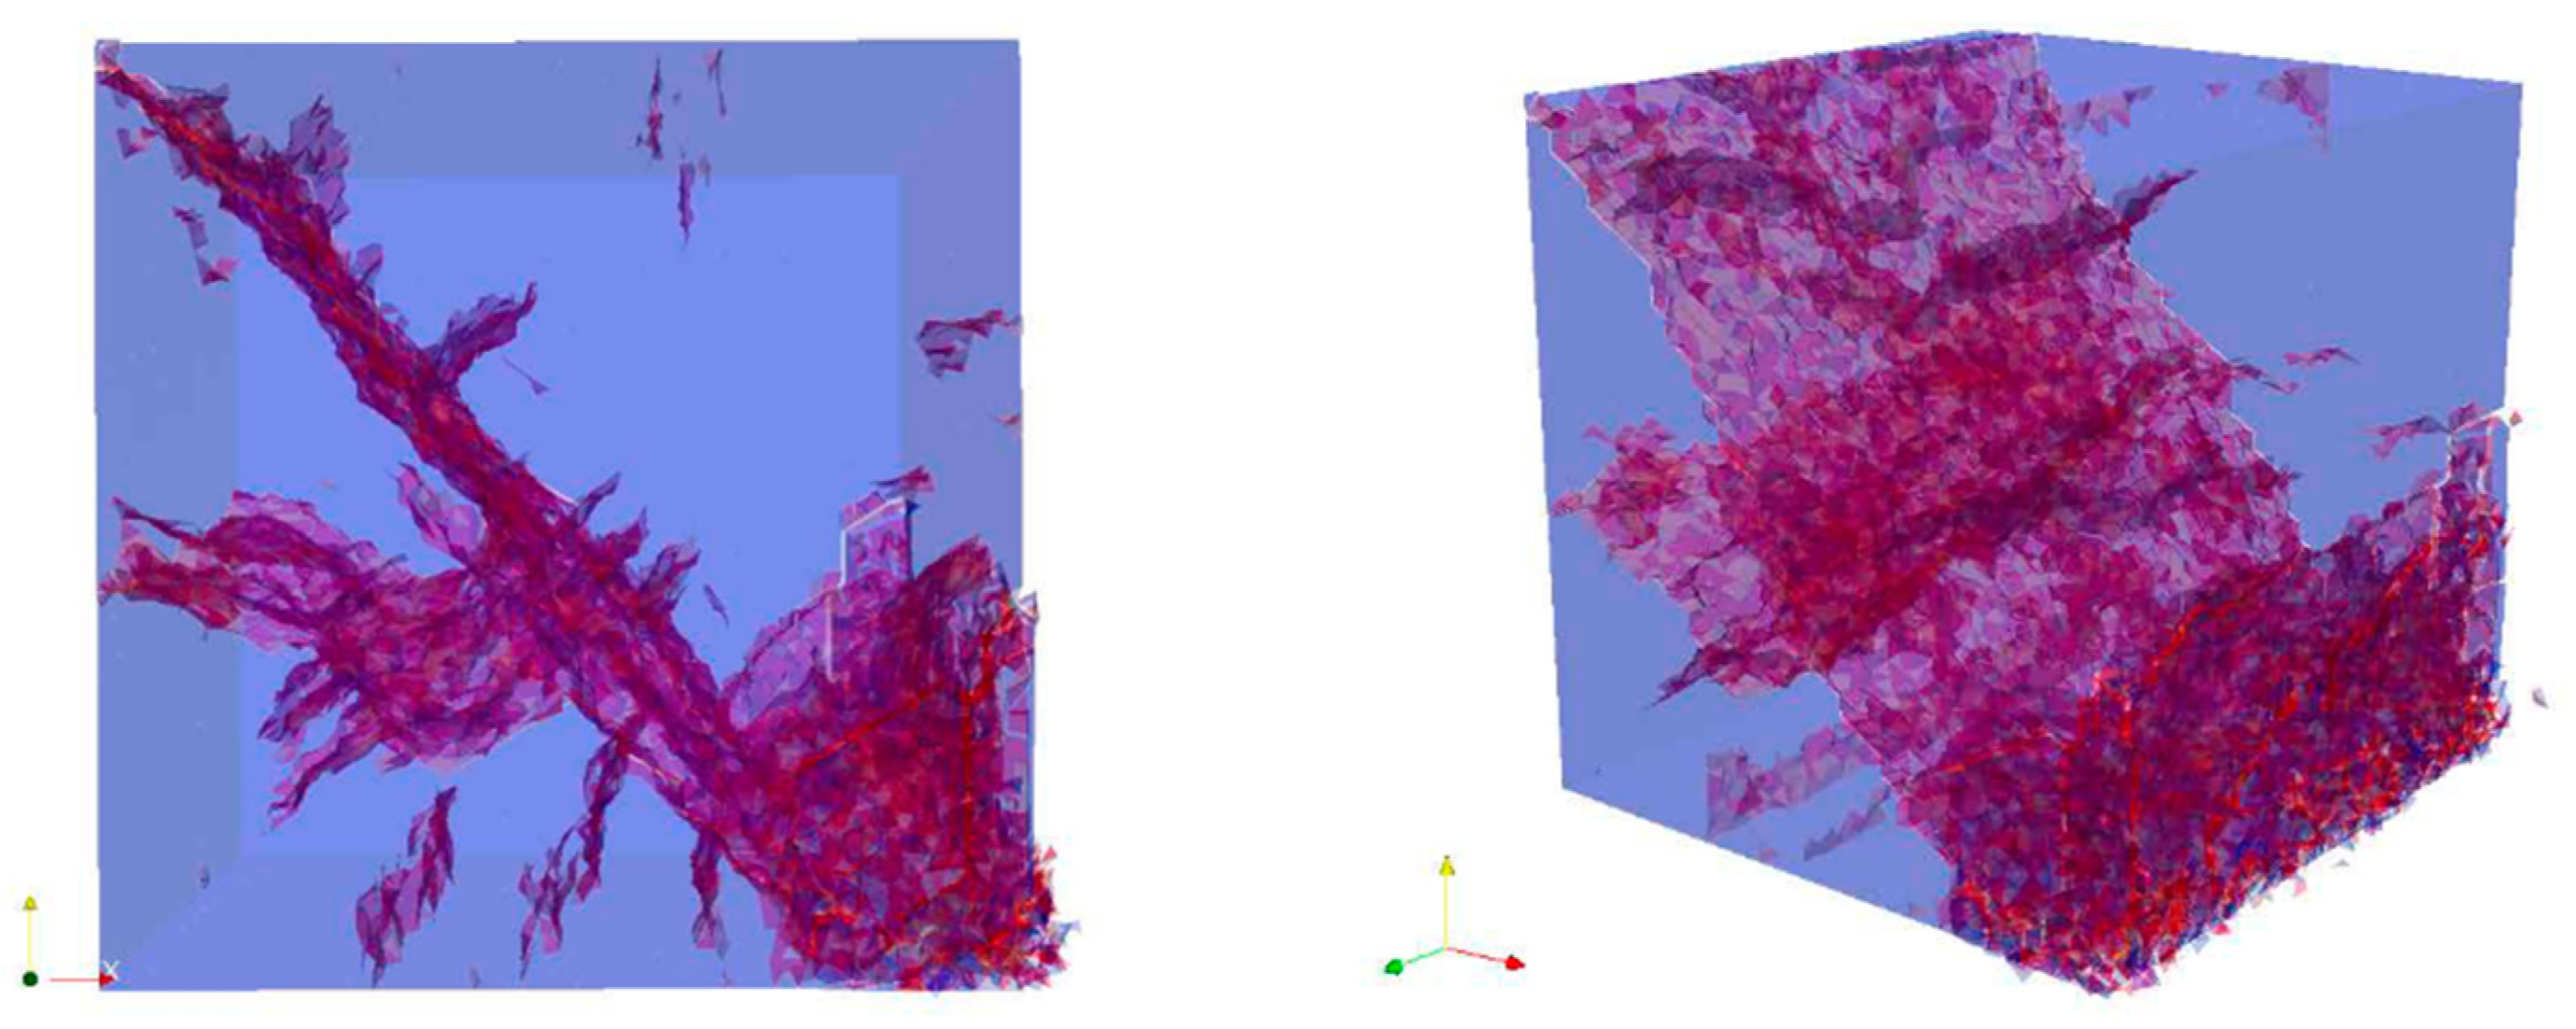
Initially, in frame 1, the Cubipod was only just moving and not registering any stress from the contact (
Figure 23). In frame 40, the stress concentration was increased enough to initiate the first shear and tensile fractures, and the cracks were at the point of propagating beyond the lower part of the unit (
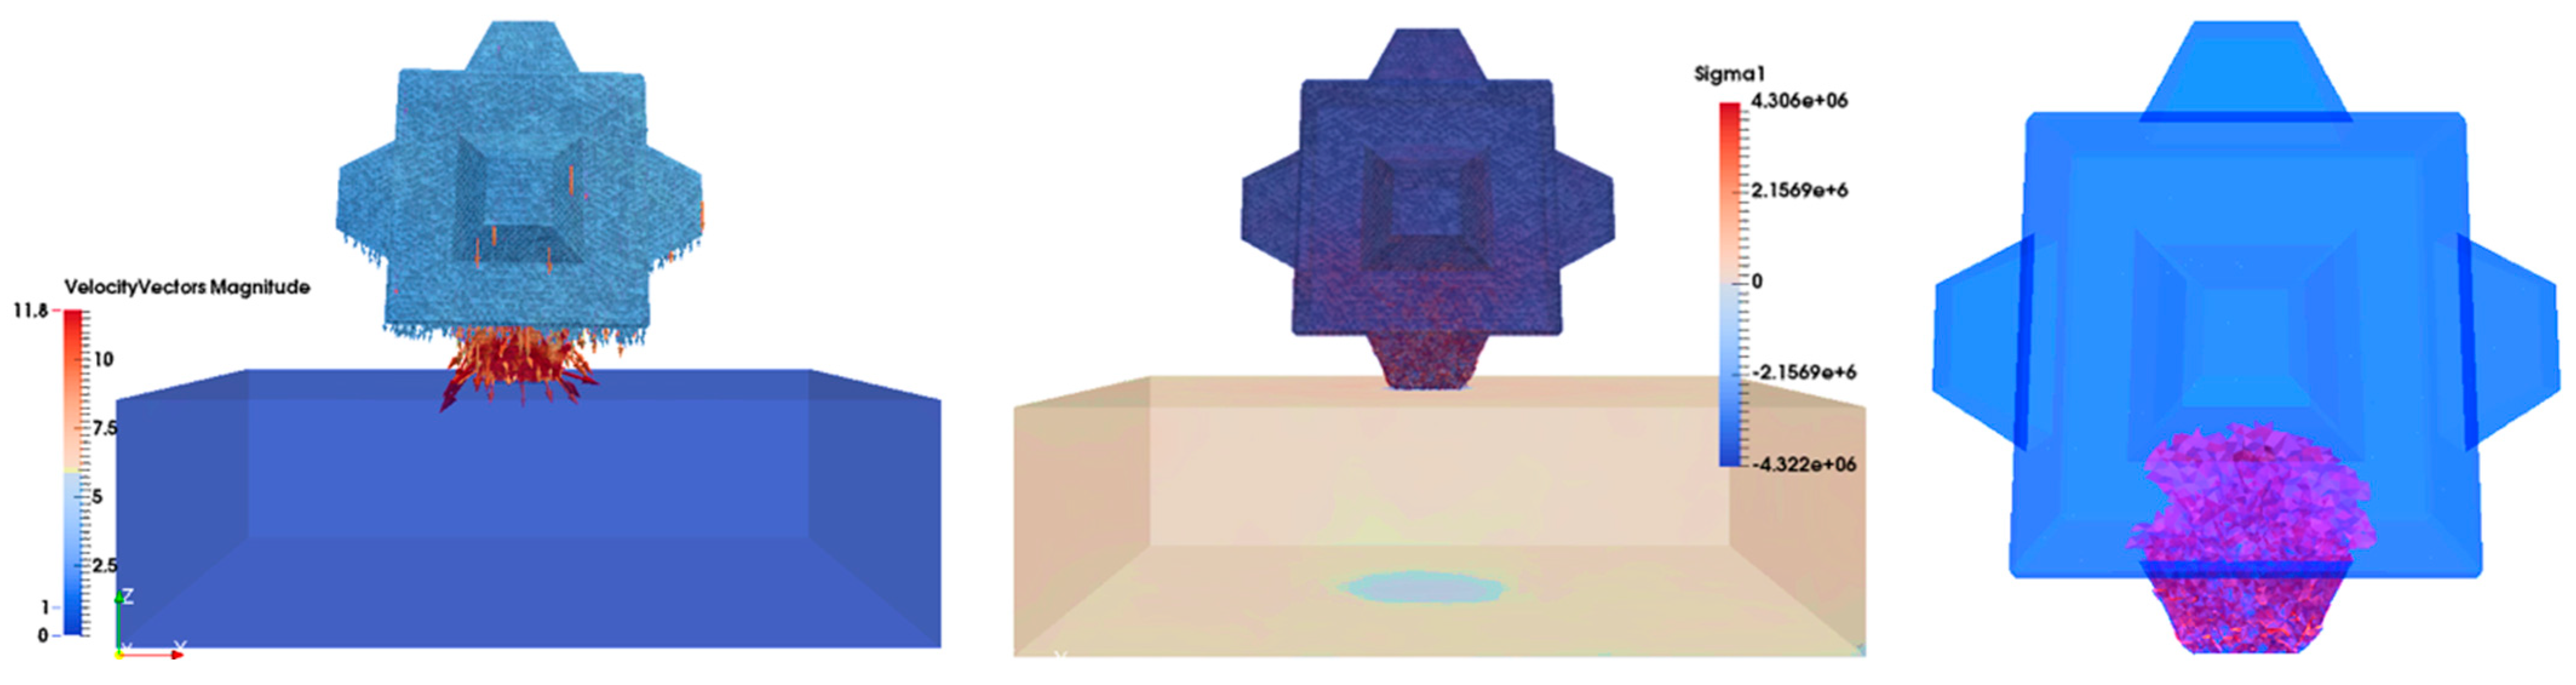
Figure 24). The reflected tensile stress wave spreads from the bottom to the core of the Cubipod, encouraging the propagation of new localized tensile fractures. In frame 110, many fragments mostly from compressive crushing appeared near the area of impact, while major extending single tensile fractures have developed and the cracks are about to spread into the Cubipod’s core (
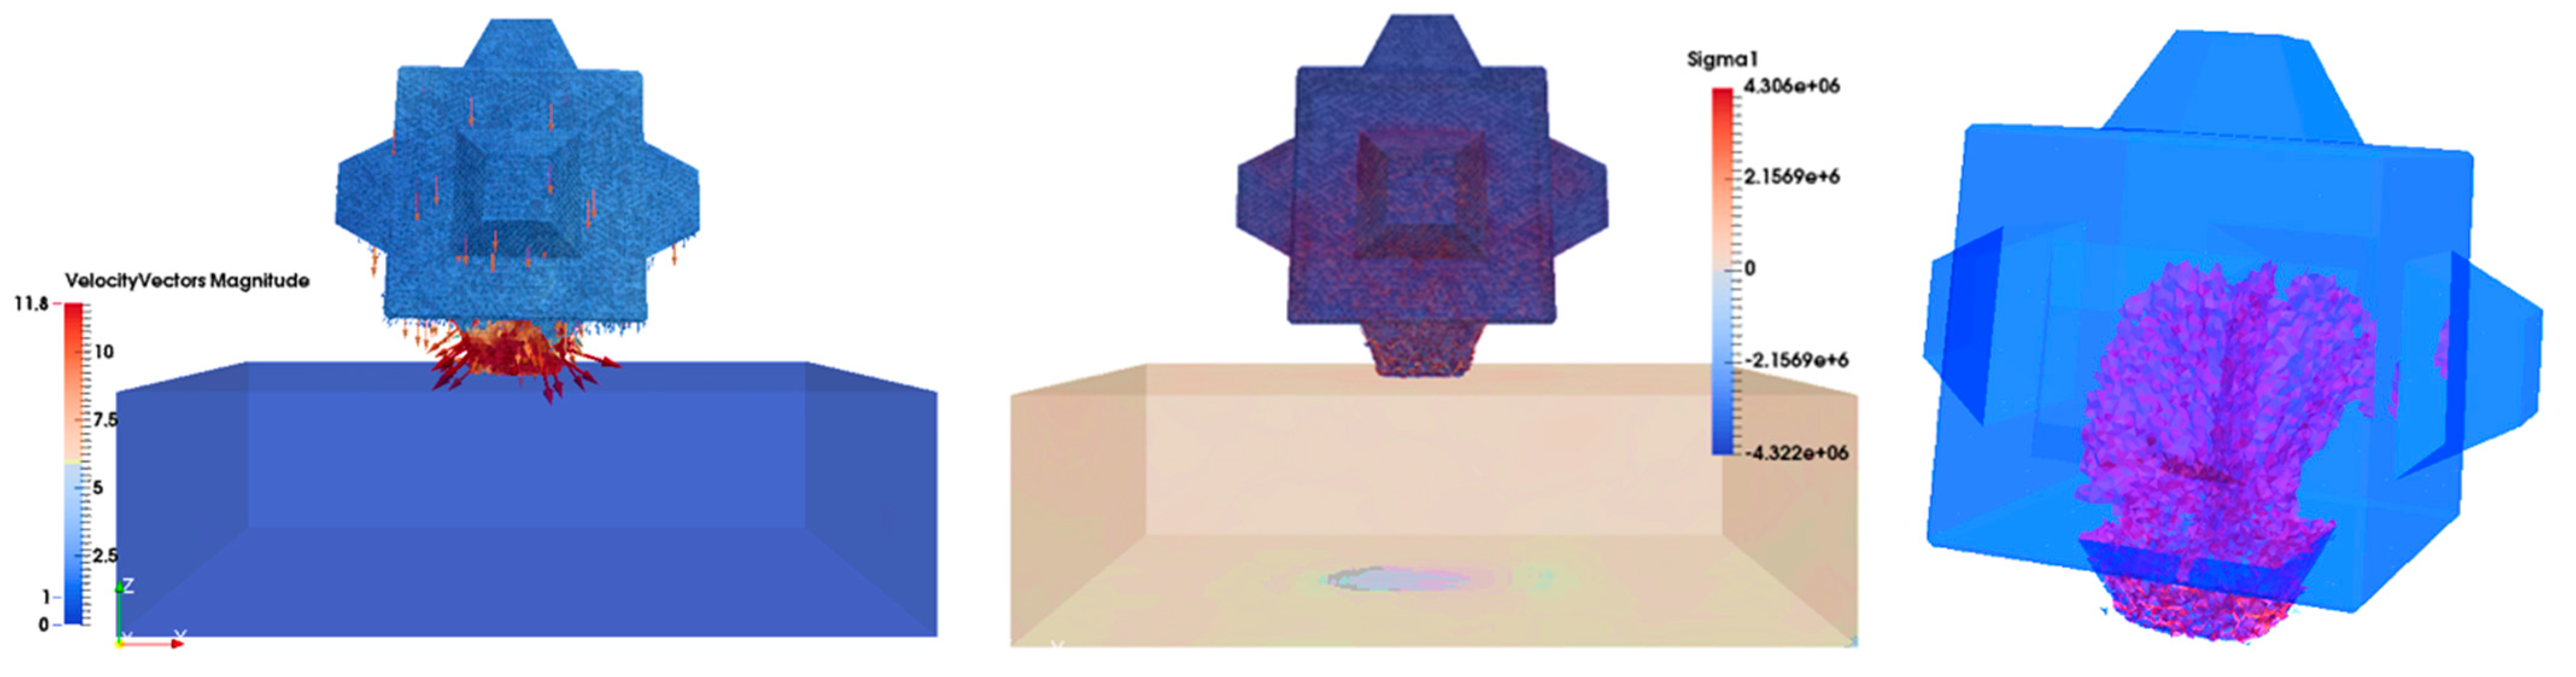
Figure 26). In frame 200, the tensile stress wave has spread all over the Cubipod, and two main directions of fracture were generated, perpendicular to the
x-direction and perpendicular to the
y-direction (
Figure 28 and
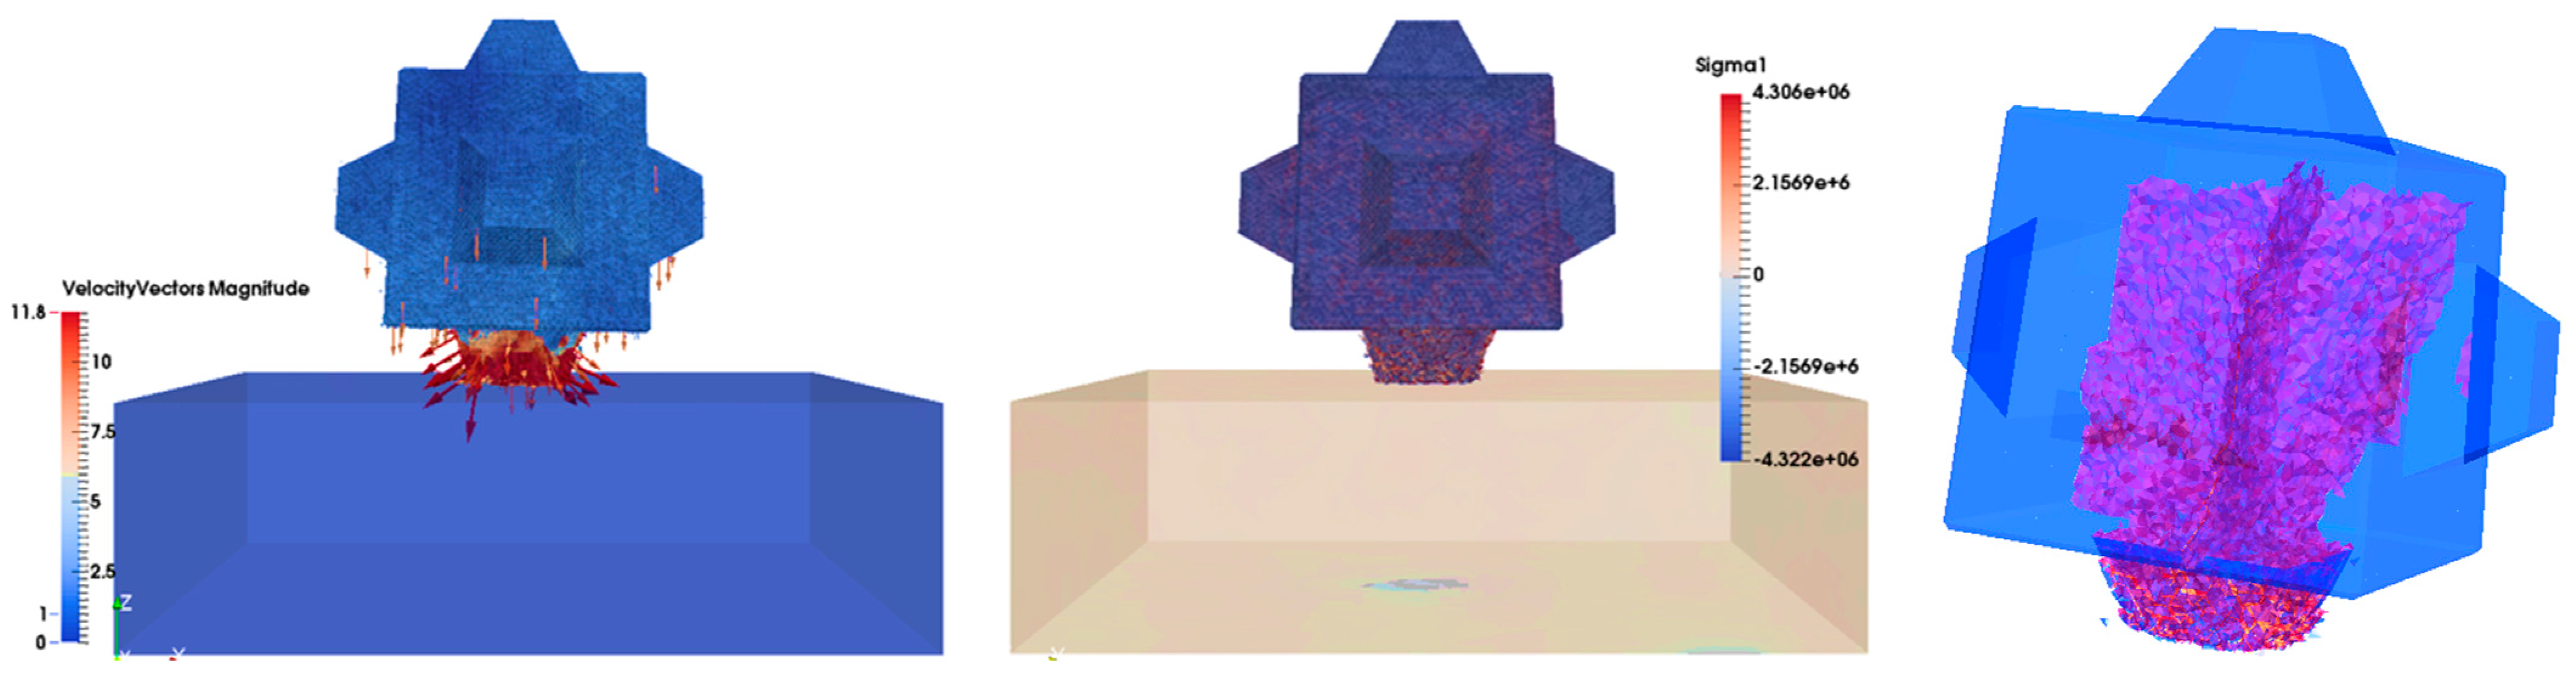
Figure 29). They show the trend of the fractured surfaces of the Cubipod, which at this time had not developed any through-going splits, because a drop height of 3 m was still relatively low for this unit. In the last frame (249), the fractured path was more evident. The bottom part of the Cubipod was entirely broken and fragmented, yet the fractured plane perpendicular to the
y-direction was far more remarkable (
Figure 30). The orientation and style of cracks in the contact crushing area was consistent with the dominantly shear fractures as determined from the failure mode type given by the FDEM model (
Figure 32, right).
7. Validation Discussion
In this section, the numerical simulations of the AD test of the 15 t Cube and 16 t Cubipod units are discussed in a full validation study of the numerical model, by comparing side-by-side the last frame from the post-processing image of the FDEM model and some frames captured from the videos in the
Supplementary Materials. According to Medina et al. (2011), the failures of the 15 t Cube and 16 t Cubipod were fixed at critical heights of 2 m and almost 3.25 m, respectively. Nevertheless, in the numerical simulation, each unit’s failed surface area was on an accelerating trend to become excessively large for heights of 3 m and say, about 6 m, respectively (
Figure 13). Despite the critical drop height for excessive fracture not being the same as for the field tests, the fracture paths observed in the field breakage tests and simulations were very similar and appeared to be captured accurately. However, for numerous reasons the conditions for and results of numerical and field tests cannot be compared directly as a strict validation study.
First of all, the outputs of the two analyses, e.g., in
Figure 1b and
Figure 13, are very different. In field experiments, the damage intensity of the prototype was measured using a parameter called the relative loss of mass, RLM (%). Each unit was weighed before and after each drop to estimate the loss of mass, whereas, in the numerical simulation, an FDEM tool was used to calculate the total fractured surface area for the whole block. Therefore, due to the lack of correspondence of the damage output measures, the numerical results are not fully suitable for comparison. Encouragingly, in recent research, it has become possible to output the fragment size distribution, which would probably facilitate a closer indication of the progressive loss of large pieces of total mass and an earlier onset of rapid damage transition with drop height (as seen in field tests) than the summed area of cracked surface plotted in this work.
Secondly, the boundary conditions of the test were very different. In the field experiments, the prototypes were dropped consecutively on the platform several times. That is another reason why more damage occurred than in this numerical simulation (where the unit dropped just once). The same multi-drop conditions were not simulated numerically because cycling loading and material fatigue are not taken into account in the material constitutive model applied in the FDEM code. Moreover, during the field tests, the plate undertook serious impacts and permanent damage that could have significantly influenced the platform rigidity, and hence crack initiation and progression in the prototypes, whereas, in the numerical test, the platform was modeled as an unbreakable platform of repeatable stiffness. For example, in Medina et al. (2011) [
15], the 16 t Cubipod unit first experienced no damage (sample P-03) for a height of 3 m but then significant breakages (20% of RLM, sample P-05) occurred for approximately a 3.25 m height of drop (see
Figure 1b). However, these field test results may be misleading and could be explained through the poor quality of the platform that reached its critical strength and was already damaged for drop test sample P-03 and through repeated drops for sample P-04 which may be landing on a damaged plate-concrete anvil and therefore a more absorbing platform. Consequently, these tests may not be truly representative of the structural behavior of the unit because unconfirmed changed boundary conditions may have overwhelmingly influenced the results of the test. On the contrary, the numerical model overcame these uncertainty limitations and faithfully reproduced the physical phenomenon, providing a more realistic trend of the fracture path generated from the design height of drop.
Furthermore, the units were dropped not exactly on the center of the platform and the angle of impact of the units (the drop test is supposed to be flat against flat with the platform) was somewhat dispersed about a zero degree angle (as shown in the videos). Moreover, the units, which are expected to be undamaged, may often get damaged during transportation and test preparation. To conclude, it is not certain that the mechanical parameters of the units of the numerical tests are truly representative of those in the field experiments, and this could significantly influence the results. All these reasons make the validation process difficult to carry out.
In spite of these divergences between setup of the numerical and field studies, the location and evolution of fractures were accurately captured using the 3D fracture model. By visually comparing the numerical simulation results of the drop test with the physical experiment results, similar fracture paths could be identified for both units. Specifically, the Cube experienced the same type of catastrophic failure in both the field test and the numerical test. As can be observed in the field test, after impact, the edge of the Cube was completely crushed and fragmented, and the Cube was on the verge of splitting along the main fracture plane (around 45°), which was easily identifiable (red dotted line in
Figure 33a). Similarly, in the last frame of the numerical simulation, the edge of the unit was totally crushed and broken into some significant size fragments, together with visible major fractures with inclination of 45° having developed (yellow dotted line in
Figure 33b).
The Cube did not break catastrophically in the numerical simulation for all the reasons stated above, but it seems to the authors that the numerical model can potentially give more insight into the physical response of AD drop tests than field tests, which faces difficulty in objectively controlling the process. However, further research must be addressed to include cycling load conditions, especially as this will be relevant to rocking collisions.
8. Concluding Remarks
A new three-dimensional fracture model in the context of the FDEM method was applied to the investigation of the structural integrity of concrete armor units under dynamic loading conditions. Cube and Cubipod units were simulated in free-fall anvil drop tests, and the numerical results were compared with physical experiments and observations from site in order to validate the numerical model and lend weight to the significance of the results provided by Medina et al. (2011) [
15]. The geometrical shape of the Cubipod caused crushing damage to the protruding cruciform leg, which took the brunt of the collision. This crushing served to slow down the rate of change of momentum of the central body and to reduce the degree of internal tensile stress and fracturing likely to be the driving factor for overall breakage of concrete units facing large impact loads from rocking or rolling. The conceptual model behind the unit shape effects in these tests was postulated by Corredor et al. (2008) [
32]. This work supports the contention that the risk of a major failure in situ and when handling and placing pieces is lower for Cubipod than for a conventional Cube of nearly the same size and made of the same concrete, for the same type of dynamic collision. The whole structural response of concrete armor units, which comprises multi-body interaction, rigid body motion, continuum deformation, fracture initiation and propagation, and post-fracturing interaction between discrete fracture surfaces and fragmented bodies, was accurately captured by three-dimensional numerical simulations in [
14,
30] and was repeated here to investigate drop test collisions.
The research started with an FDEM model to calibrate the missing mechanical parameters of the prototypes and then continued with the exploitation of these results in order to validate the conclusions drawn from Medina’s physical experimental results (2011). Many parameters had to be calibrated in order to achieve confidence in numerical simulation, e.g., the penalty function, the mass damping coefficient, the energy release rate, the tensile strength, and the angle of impact. At the end of the simulation series, it was possible to observe how the armor units were very sensitive to the tensile strength of the concrete and the angle of the fall, as observed in [
33]. After using the Cube test data to calibrate the model, identical parameter settings were applied for the Cubipod unit simulations. The basic hypothesis, that the Cubipod is more robust to collision impacts than the Cube is supported as the simulation outcome was essentially similar to that reported in
Figure 1b. Nevertheless, while the calibration of the material properties and the validation of the numerical model for the Cube can be considered correct and relatively exhaustive, the validation study relying on comparison between experimental and numerical model results for the Cubipod encountered several problems. This was due to the fact that the results of numerical and experimental tests could not actually be compared directly because, in the field tests, repeat drop tests were also included in the data. Thus, while the simulation results are encouraging, the validation of this model cannot be concluded, even if the results are satisfactory as a first attempt. Having taken one step forward in the validation of structural integrity of the Cubipod, further research into this unit and other unit shapes is recommended. Ideally, this should include better controlled prototype testing e.g., the hammer drop test and pendulum test, and more indestructible platforms if using an anvil drop test. Using a quantitative fragment size distribution tool to compare simulation results directly with the method of weighing the fragments in the field test is likely to be needed to fully validate the FDEM model illustrated in this paper.


