Research on the Wear Characteristics of a Bend Pipe with a Bump Based on the Coupled CFD-DEM


Key Laboratory of Fluid Transmission Technology of Zhejiang Province, School of Mechanical Engineering and Automation, Zhejiang Sci-Tech University, Hangzhou 310018, China
*
Author to whom correspondence should be addressed.
J. Mar. Sci. Eng. 2021, 9(6), 672; https://0-doi-org.brum.beds.ac.uk/10.3390/jmse9060672
Submission received: 12 May 2021
/
Revised: 15 June 2021
/
Accepted: 15 June 2021
/
Published: 18 June 2021
(This article belongs to the Section Ocean Engineering)
Abstract
:In the process of hydraulic lifting of solid mineral particles on the seabed, the two-phase flow in the pipeline causes wall wear, which reduces the reliability of the hydraulic lifting system. In this research, based on the coupled computational fluid dynamics (CFD) and discrete element method (DEM), the numerical simulation of large particle solid–liquid two-phase flow and wall wear in a bend pipe with different wall shapes was conducted to provide solutions for reducing wall wear. By adding bumps to the bend pipe wall to change the shape of its inner wall, under the working conditions of particle concentrations of 1–10% and particle sizes of 1–3 mm, wear experiments and calculations for the bend pipe with bumps at different positions were performed. With comparative analysis, it was found that the location of the bump in the bend pipe had an important influence on the maximum wear rate. When the bump was located near the location where the particles collided with the prototype bend pipe for the first time, the maximum wear rate decreased the most significantly. The particle mass flow rate will also affect the wear reduction effect of the bump on the bend pipe wall.
1. Introduction
As the seabed solid mineral particles are mainly transported by means of hydraulic lifting, the two-phase flow in the pipeline is easy to cause wall wear, and every year a large number of transportation pipelines are scrapped due to wear and perforation, which reduces the reliability of the hydraulic lifting system. Commonly used methods to reduce wear are mainly divided into two categories. One method is to improve the wear resistance of a curved pipe by developing new high-performance alloys or adding a coating on the curved pipe wall. Another method is to achieve active control of the wall wear resistance by changing the two-phase flow field. In this paper, bumps are added in the bend pipe section to change the shape of the wall surface, and then the flow field is changed to achieve the goal of reducing the wear of the bend pipe.
In previous studies, most of the pipelines were used to transport multiphase mixtures containing small particles (Stokes number is less than 1 in this manuscript). Farokhipour et al. [1] used the three-phase computational model (VOF and Lagrangian particle tracking) to analyze the sand corrosion phenomenon in the gas–liquid–solid annular three-phase flow in the bend and studied the effects of liquid film thickness, gas and liquid velocity, and pipe direction on the standard elbow corrosion when the particle size was 300 μm. Kosinska et al. [2] used a standard k-epsilon model to study the corrosion caused by nano and micro particles in pipe elbows. For the micron particles, the corrosion rate increased with the increase of the particle diameter and the flow rate. However, for the nano-sized particles, because the secondary flow in the elbow centrifuged the particles to the wall, the corrosion rate increased with the decrease of the particle size. Duarte et al. [3] used the Reynolds stress turbulence closure model (RSM) to analyze the relative corrosion of a standard elbow, a plugged tee elbow, and an elbow with a swirl chamber for gas-solid multiphase dilute flow in a pneumatic conveying system. It was found that the plugged tee proves to be an interesting option in cases of a low mass loading, and the vortex chamber elbow can reduce erosion in cases of a high mass loading. The average particle size used in this study was 150 microns. Parsi et al. [4] designed a new type of non-invasive ultrasonic device to obtain erosion patterns under different flow conditions in vertical pipes. They mainly studied the influence of surface gas–liquid velocity, particle size, and liquid viscosity on the erosion rate. The selected particle sizes were 20, 150, and 300 microns. Peng et al. [5] used the two-way coupling Euler–Lagrangian method to solve the liquid–solid flow in the elbow. By combining five different erosion models and two particle wall collision rebound models, the wall erosion rate of the curved pipe was predicted and compared with the experimental results.
In the process of mineral pipeline transportation, the particles contained in a mixture are larger (Stokes number is greater than 1 in this manuscript). The physical properties and flow law of a mixture of large particles are very different from those of a mixture of small particles. Zhao et al. [6] pointed out that when the Stokes number was less than 1 and the particles encountered obstacles, the streamline of the particles was similar to that of the liquid phase. The trajectory of the particles was similar to that of a fluid. When the Stokes number was greater than 1, the particles did not follow the streamline of the liquid phase. After encountering an obstacle, the particles continued to move in the same direction as before the obstacle was encountered. Wang et al. [7] pointed out that the change of the particle size directly affected the Stokes number, thus affecting the particle distribution in a riser. From this, it could be determined that the difference of the Stokes number between large particles and small particles would lead to different flow characteristics of particles in a pipe, thus affecting the wear of particles on the pipe wall. Therefore, the research conclusion of small particles cannot be directly applied to large particles. The particle diameters studied in this paper are 1 mm, 2 mm, and 3 mm, and their Stokes numbers are 63, 252, and 566, which are all far greater than 1. Therefore, the law of wall wear during small particle transportation cannot be directly applied.
In the study of large particles, Hu et al. [8] used the coupled computational fluid dynamics (CFD) and discrete element method (DEM) to study the transport of 5 mm particles in a Y-shaped elbow in a deep-sea mining system, and they discussed the behavior of particles and fluids at different transport velocities. It was found that the motion of particles was closely related to the secondary flow of a fluid. Vlasak et al. [9] studied the effects of the mixing speed and the total concentration on the local concentration of water transporting coarse particles in a horizontal tube, and the solid phase was 8–16 mm basalt pebbles. This study confirmed the existence of significant stratification of the studied mixtures and stresses the importance of saltation movement in the transport of coarse particles in a pipe. The difference between measured and predicted chord-averaged concentration profiles decreased with increasing mixture velocity and mean concentration. Generally speaking, there are relatively few studies on the wall wear of bend pipes caused by the mixed transport of large particles of solid and liquid, and the law of wall wear has not been fully revealed. Therefore, this paper uses a combination of numerical simulation and experimental research to study the wall wear of large-particle mixed transport bend pipes in order to obtain some valuable conclusions.
In the aspect of solid–liquid two-phase numerical simulation, DEM model fully considers the interaction between particles and between particles and wall surface, so it is more in line with the actual situation when it is used to simulate solid–liquid two-phase transport of large particles, and the calculation results will be more accurate. Kuang et al. [10] combined periodic boundary conditions with CFD-DEM to simulate the characteristics of slug flow under dense phase conditions. The characteristics of the flows in the start-up section are analyzed in detail and compared with those in the well-developed flow section for different flow regimes. On this basis, two semi-theoretical correlations are formulated to, respectively, predict the start-up section length and the relation between particle number and solid flow rate. Xu et al. [11] adopted a new erosion model, and CFD-DEM simulation was used to predict the elbow erosion with a high particle solid fraction. It is found that the erosion wear at the elbow is very sensitive to the particle concentration. Zeng et al. [12] proposed an erosion prediction model of gas–solid two-phase flow based on CFD-DEM, and they studied the effects of the secondary flow, vortex, and particle trajectory on rare erosion scars with a particle size of 150 µm. Chen et al. [13] proposed a CFD-DEM-based erosion prediction model for pipe elbows and other pipe connections; they numerically simulated 90°, 60°, and 45° bends with a diameter of 40 mm and a diameter of 150 microns, and they predicted the maximum erosion rate and position. Therefore, this paper will study the solid–liquid two-phase numerical simulation of a bend pipe based on the coupled CFD-DEM, and the simulated working conditions are more in line with the reality.
Many researchers have done some work in reducing wear by changing the shape of the wall. Zhu et al. [14] carried out a numerical study by installing trapezoidal ribs at different positions on the outer wall of a 90° bend in order to reduce erosion. By comparing the predicted CFD erosion strength with the current and previous experimental data of standard bends, they verified the correctness of the calculation model. Duarte et al. [15] studied a method to reduce erosion by adding a vortex chamber to the arches of standard elbows. A deflection area formed downstream of the chamber entrance, resulting in a more effective buffering effect. Santos et al. [16] reported that due to the eddy current generated by a bending band, the insertion of a twisted band upstream of a bending elbow could weaken the direct collision with the same point on a curved wall. Recently, Duarte and Souza [17] proposed a novel pipe wall design that reduced the erosion of a bend by twisting the wall along the flow direction upstream of the bend. Such a structure could also generate eddy currents, thus preventing particles from being concentrated at a single point on the elbow wall. Song et al. [18] carried out experimental and computational studies to prove the effect of this method on reducing corrosion. Fan et al. [19,20,21] studied the effect of the rib shape on the particle erosion in square bends. It was observed that an isosceles triangular rib had the best anti-corrosion efficiency among the three considered shapes. At the same time, most of the above-mentioned studies on changing the geometry of the pipeline have focused on the gas–solid two-phase flow of small particles. There are relatively few studies on the solid–liquid two-phase flow of large particles.
Therefore, based on the coupled CFD-DEM, this paper explored the flow conditions of solid–liquid two-phase flow with particle sizes of 1 mm, 2 mm, and 3 mm in the bend pipe with bumps at different locations, and analyzed the wear rules of the outer wall of the bend pipe section under bumps at different locations.
2. Numerical Model
2.1. Numerical Calculation Method
The two-phase flow was simulated using coupled EDEM 2.6 software (17/6/2014) and FLUENT 15.0 software (1/1/2018). The water phase was treated as a continuous medium, while the particles were regarded as discrete units. The Euler–Lagrange approach was used in our numerical simulation. The flow field was solved using FLUENT, and the particle motion was calculated using EDEM. Figure 1 showed the coupling process of FLUENT and EDEM. The specific coupling process was as follows: One time step calculation is carried out in FLUENT, and the flow field information is transferred to EDEM after the calculation converges at current time step; in EDEM, the force and motion of the particle phase are calculated in one time step. After the calculation, the reaction force generated by the solid relative to the liquid phase is transferred to FLUENT. After that, FLUENT carries out next time step calculation, etc., until the end of the set simulation time.
The two-way coupling method was used in this research. The force of particles applied on the fluid was considered in the two-way coupling method. The equation of mass conservation and the equation of momentum conservation for the liquid phase were solved:
In the expression, ρ is the density of the liquid (kg∙m−3), u is the velocity of the liquid (m∙s−1), p is the pressure, is the stress tensor (N∙m−2), g is the gravitational acceleration, and FD, FM, and FL are the drag force (N), Magnus force (N), and lift force (N) acting on the surface of the particle, respectively.
The translational and rotational motions of the particle were obtained with the Newton equations:
In the expressions, mp and Ip are the mass and the moment of inertia of the particle (kg and m4), respectively, vp and ωp are the velocity and the angular velocity of the particle (m∙s−1 and rad∙s−1), respectively, Gp and Fc are the gravity and the contact force (N), respectively, and Tc and Tf are the contact torque and the torque generated by the fluid phase (N∙m), respectively.
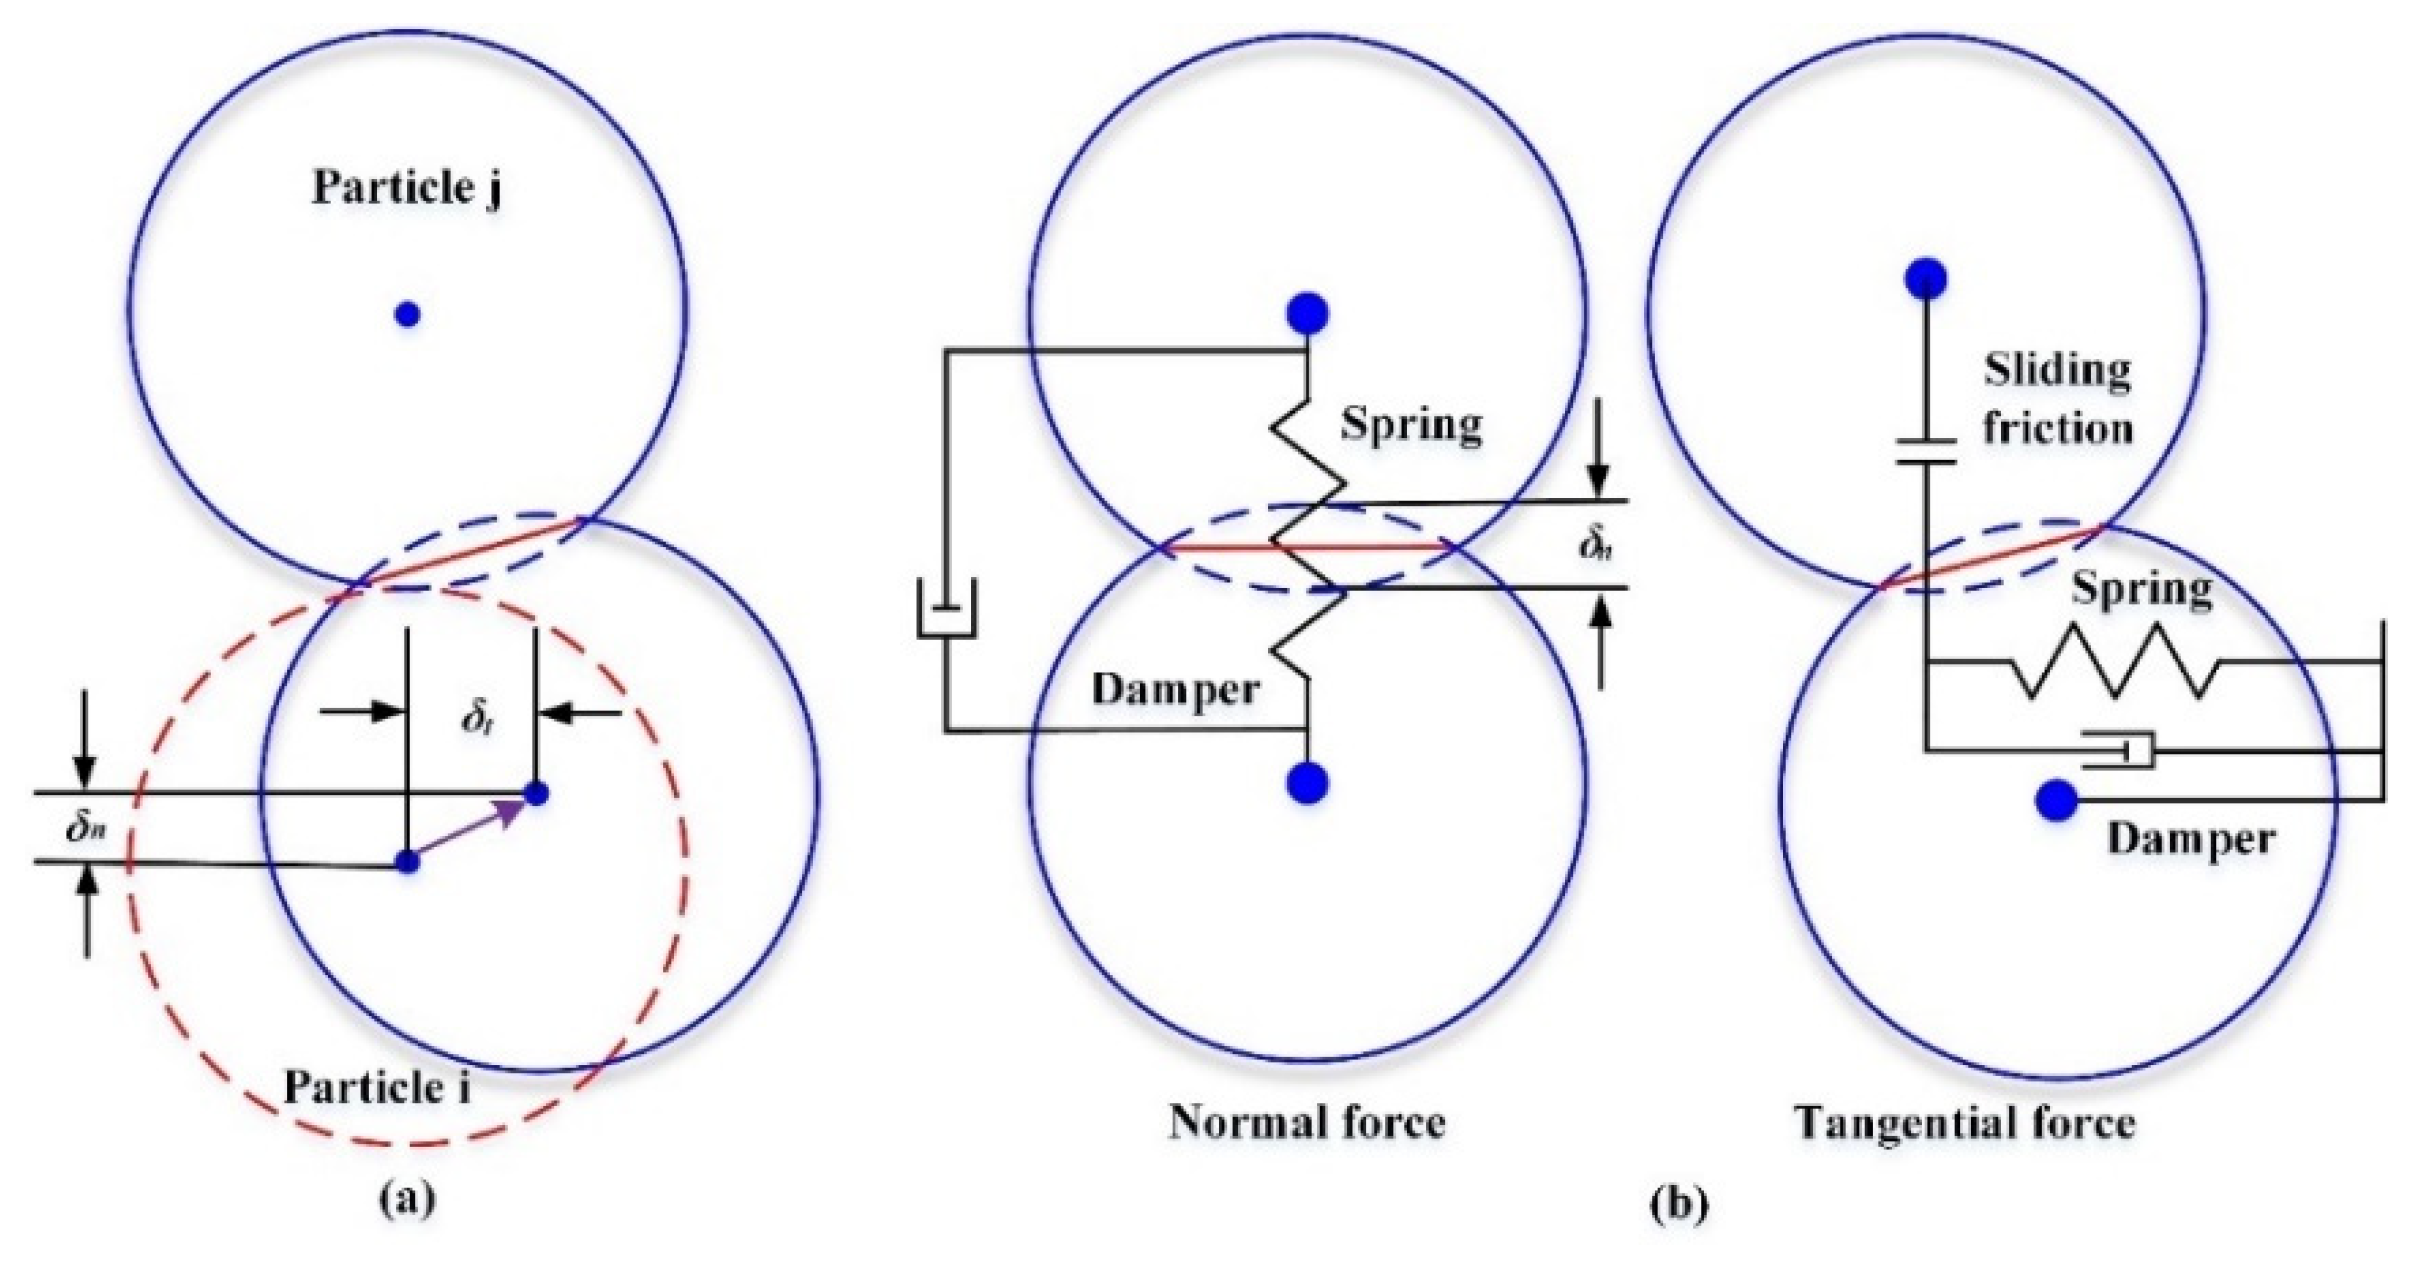
The soft-sphere model of Zeng [12] was used to illustrate collisions between particles and the collisions between a particle and the wall. As shown in Figure 2a, in the soft-sphere model, particle i was affected by fluid contact with particle j at a point. In the subsequent motion, two particles were deformed. Letting and denote the normal displacement and the tangential displacement between particles (m), respectively, Fc,n and Fc,t are the normal contact force and the tangential contact force (N), respectively. Figure 2b shows the constitutive model of the interaction between the two particles. A spring was used to simulate the deformation damping, and a damper was used to simulate the damping effect. When the diameter of one of the particles in the soft-sphere model was infinite, we could think of the particle as a wall; so, we could simulate the collision between the particle and the wall.
The contact force Fc in Equation (3) could be calculated as:
In the expression, Fc,n and Fc,t between two particles could be solved using the linear spring-buffer model proposed by Cundall and Strack [23]:
In the expressions, kn and kt are the normal and tangential stiffnesses of the springs, respectively. and are the normal and tangential damping coefficients, respectively. vn and vt are the normal relative velocity and the tangential relative velocity of the particles, respectively.
We used the Archard wear model to calculate the wear of the wall. The Archard wear model based on contact mechanics is:
In the expression, W is the wear volume (m3), K is the wear constant dependence on the material itself, s is the sliding distance (m), P is the applied load (N), and Pm is the hardness of the wall material (N∙m−2). The value of K is generally obtained with an experiment. We chose the value of K calculated from the data of Prasad [24].
2.2. Model and Grids
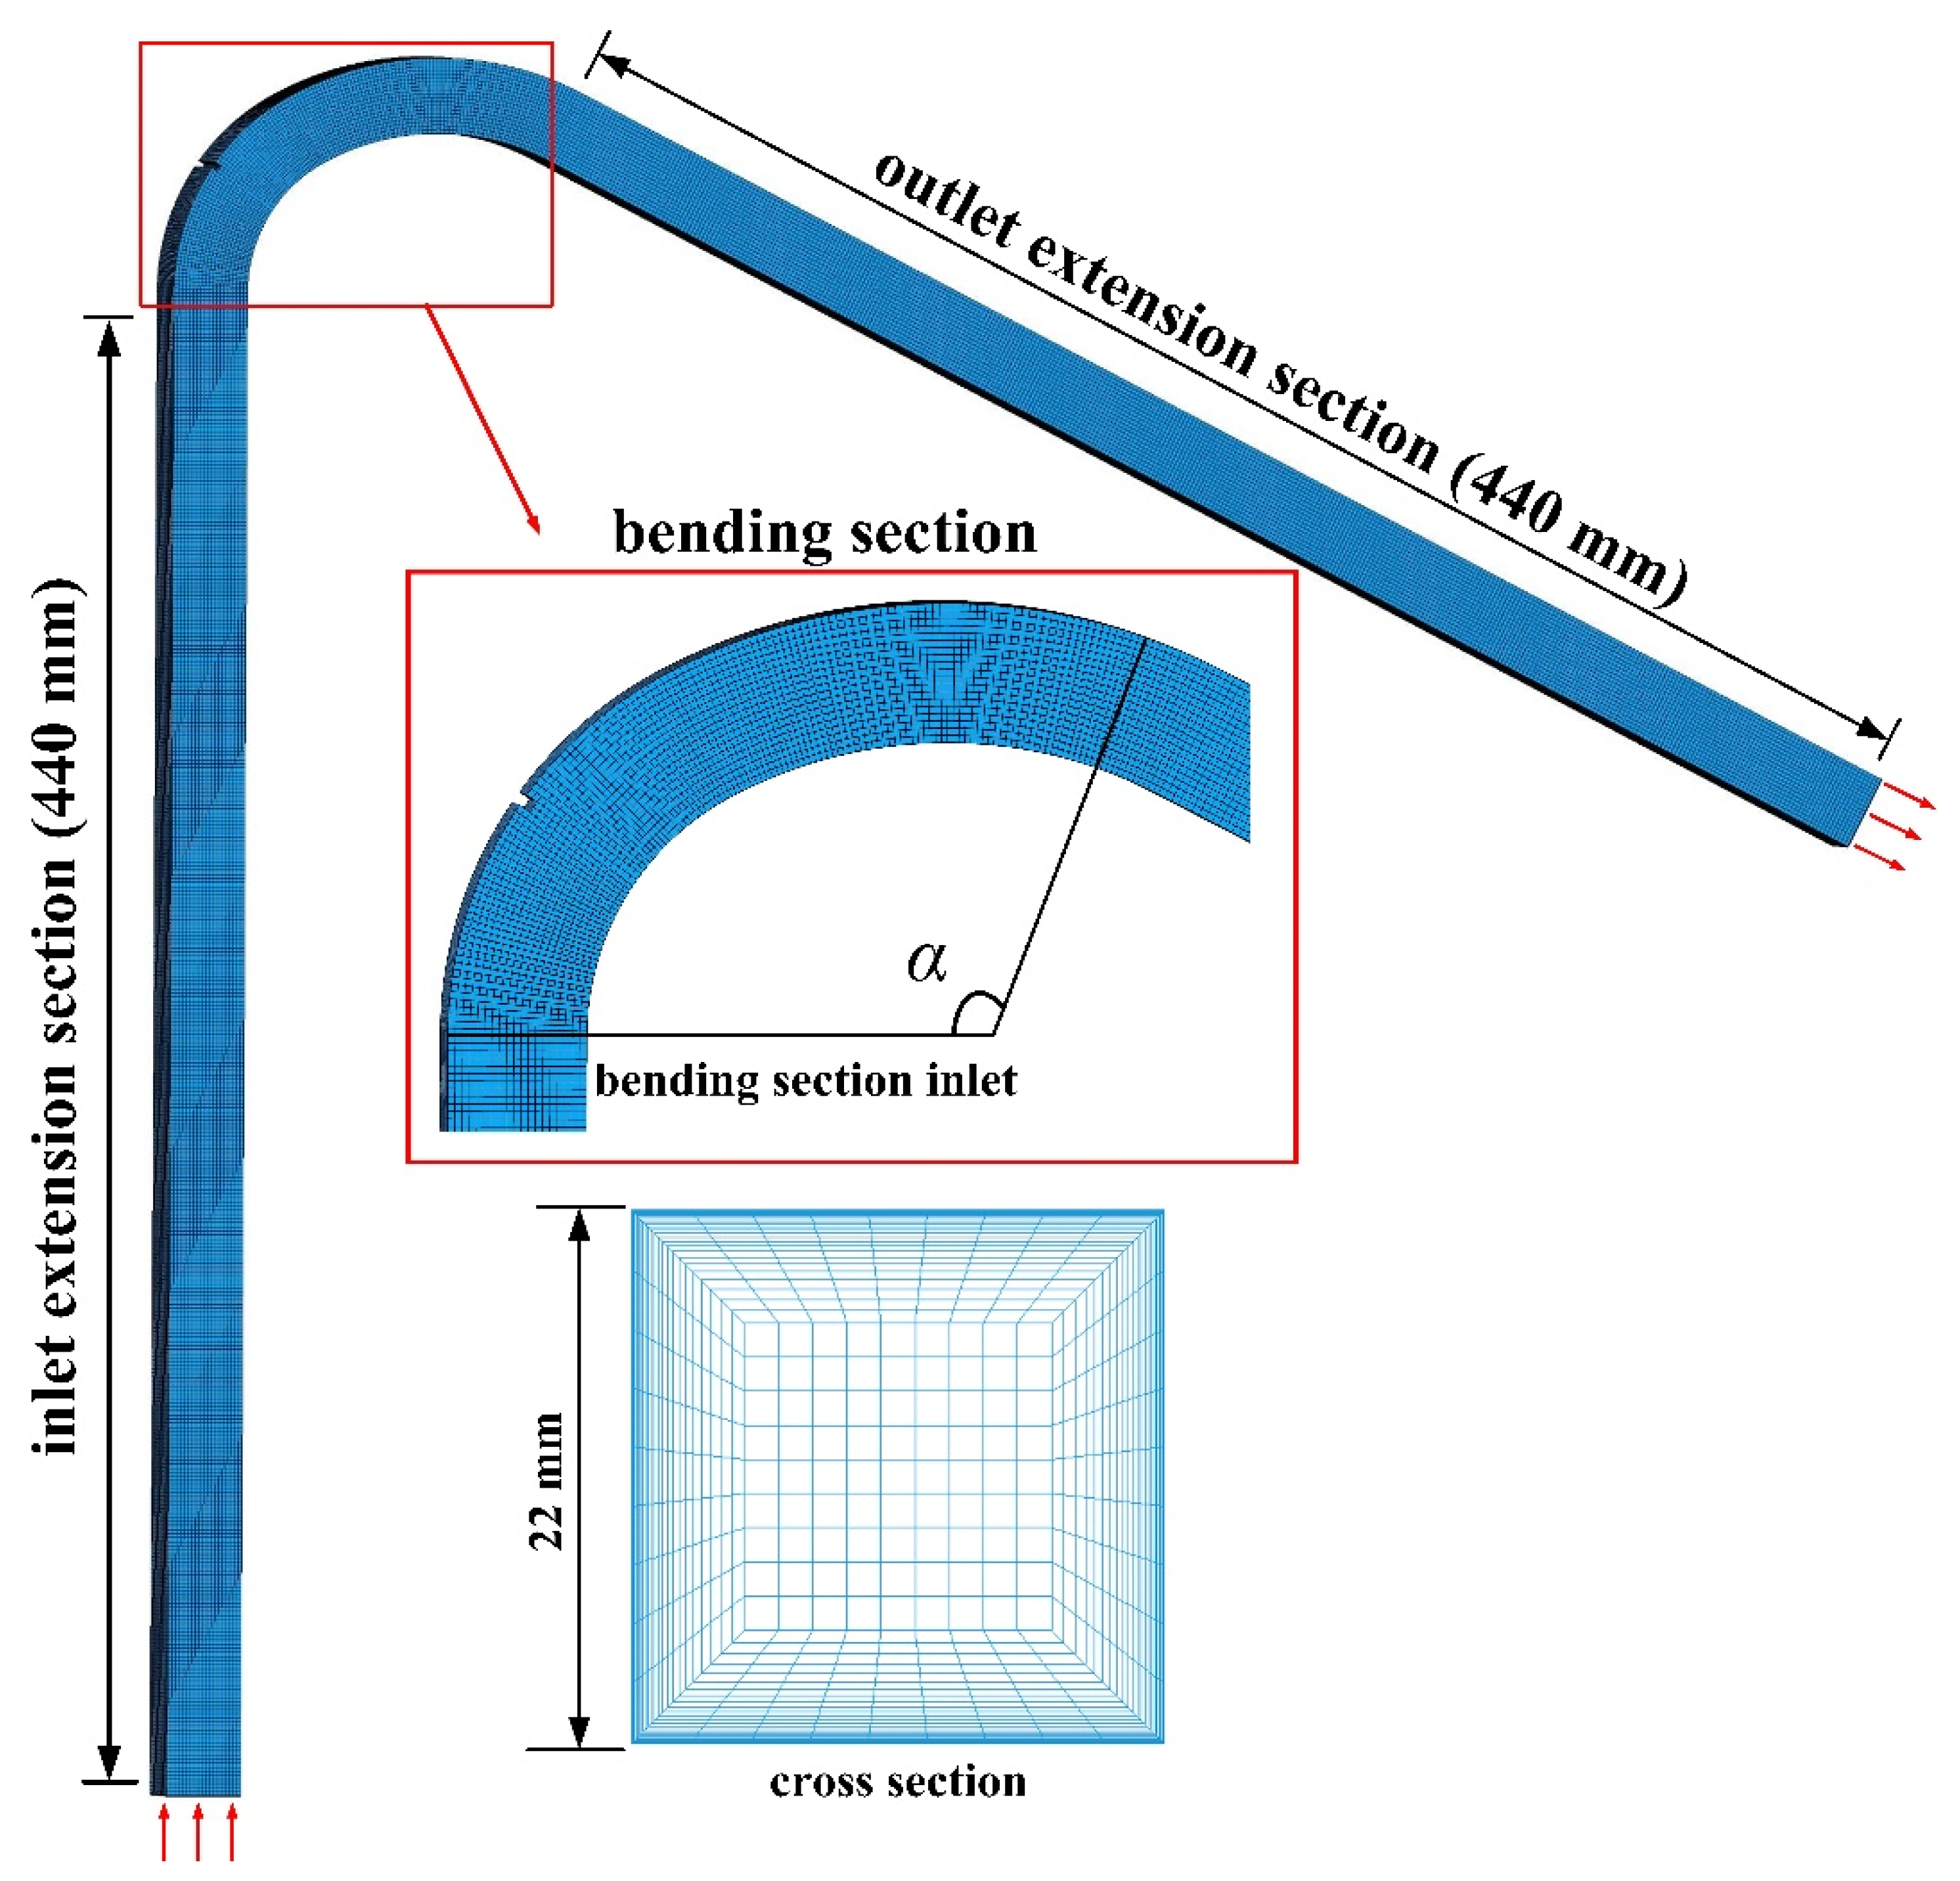
Figure 3 shows the calculation domain used in this study. The 120° bend pipe was the main part. In order to obtain a fully developed flow, we set up an extension section at the inlet and the outlet. The length of extension section is 20 times the side length of the section. In order to study the influence of the bump on the solid–liquid two-phase flow in the bend, the center angle of the bend pipe segment was defined as α. The installation position of the bump was defined by αbump. We established four models with different bump positions as αbump = 30°, 35°, 40°, and 45°. In this study, a structured hexahedral mesh was used to discretize the calculation domain. The boundary layer near the pipe inner wall had 25-layer grids (the height of the first grid layer was 0.05 mm, and the growth factor was 1.2). The grid independence study showed that a greater number of grids would not necessarily influence the accuracy of the cases when the grid quantity achieved a certain number. The grid number used in this case was approximately 380,000.
2.3. Boundary Conditions
In the FLUENT 15.0 software (1 January 2018), the standard K–ε model was used to simulate the liquid flow. The standard wall function was used to dispose of the flow near the walls. The no-slip boundary condition was adopted for the boundary of the wall surface. The SIMPLE algorithm was used to solve the pressure and velocity coupling. The fluid domain entry was set to the “velocity-inlet”, and the outlet was set to the “outflow”. Sub-relaxation was chosen for the iterative calculation of the algebraic equation. The convergence precision was set to 10−5. In the EDEM 2.6 software (17 June 2014), a virtual space was established as a particle factory at the inlet to produce particles. The particle generation type was set to dynamic and unlimited numbers, and the generation rate was controlled by the particle mass flow rate. The specific parameters are given in Table 1 and Table 2.
2.4. Model Verification
The CFD-DEM coupling simulation has been extensively used in the study of gas–solid and liquid–solid two-phase flow. This has proven to be a valid method for liquid–solid two-phase flow. However, the Archard wear model that was used for the calculation of large particle wear had not been previously used. The availability and the effectiveness of the Archard wear model needed to be verified.
To examine the calculation effectiveness of the wear models, the predicted rate of the wall wear was compared with the data for the pipeline wear experiment at different concentrations in our previous study [22]. Figure 4 shows the schematic arrangement of the experiment. Glass particles with sizes of 3 mm were conveyed for the bend pipe erosion experiment, and the mass flow rate of the liquid flow was fixed at 4.84 kg/s by the circulation pump and ball valve. The experimental section was a curved pipe made of 304 stainless steel, and the front of the curved pipe was a removable cover plate. The inner wall and the outer wall of the bend pipe were covered with aluminum sheets. The cross-sectional dimensions of the bend pipe were 22 mm × 22 mm. The concentration of the particles gradually increased from 1% to 10%. To obtain significant wall wear, each set of experiments was run for 15 min. An ultrasonic thickness gauge was used to extract the thickness wear of the aluminum sheet. Figure 5 shows the comparison of the wear results of the CFD-DEM simulation and experiment. The simulation results of the maximum wear agreed well with the experimental results. The maximum wear rate increased with the increase of the particle concentration. However, when the concentration increased to a certain value, the buffer layer effect occurred on the wall of the bend pipe. The maximum wear rate, w, decreased accordingly. Figure 5 indicates that the results obtained by using this simulation method agreed reasonably well with those of the experiment. Figure 6 shows the comparison between the simulated wear results and the wear morphology of the experimental aluminum sheet taken by a super-depth microscope (VHX-2000). Through comparison, we can find that under all working conditions, the wear pattern of the test aluminum sheet surface is the same, but the wear degree is different. When the mass concentration is low, the amplitude of wear streaks is low. The stripe amplitude increases with increasing density. The wear profile in the experiment is consistent with the results presented by the wear cloud map in the simulation, which also proves that this simulation method is effective and usable.
3. Results and Discussion
3.1. Effect of the Location of the Bump
Figure 7 shows the flow field velocity vector diagram of the prototype bend pipe and the bend pipe with different positions of the bump with the condition of the particle mass flow rate of 0.242 kg/s. The solid–liquid two-phase flow accelerated at the inner wall of the bend pipe and decelerated at the outer wall. The circulation area was formed behind the bump, where vector lines were rare and the flow was almost stationary, indicating that the bump provided a shelter for solid–liquid two-phase flow. The addition of the bump caused the acceleration area on the inside of the bend to spread to the bump, and the bump at different positions affected the flow field to form different acceleration areas.
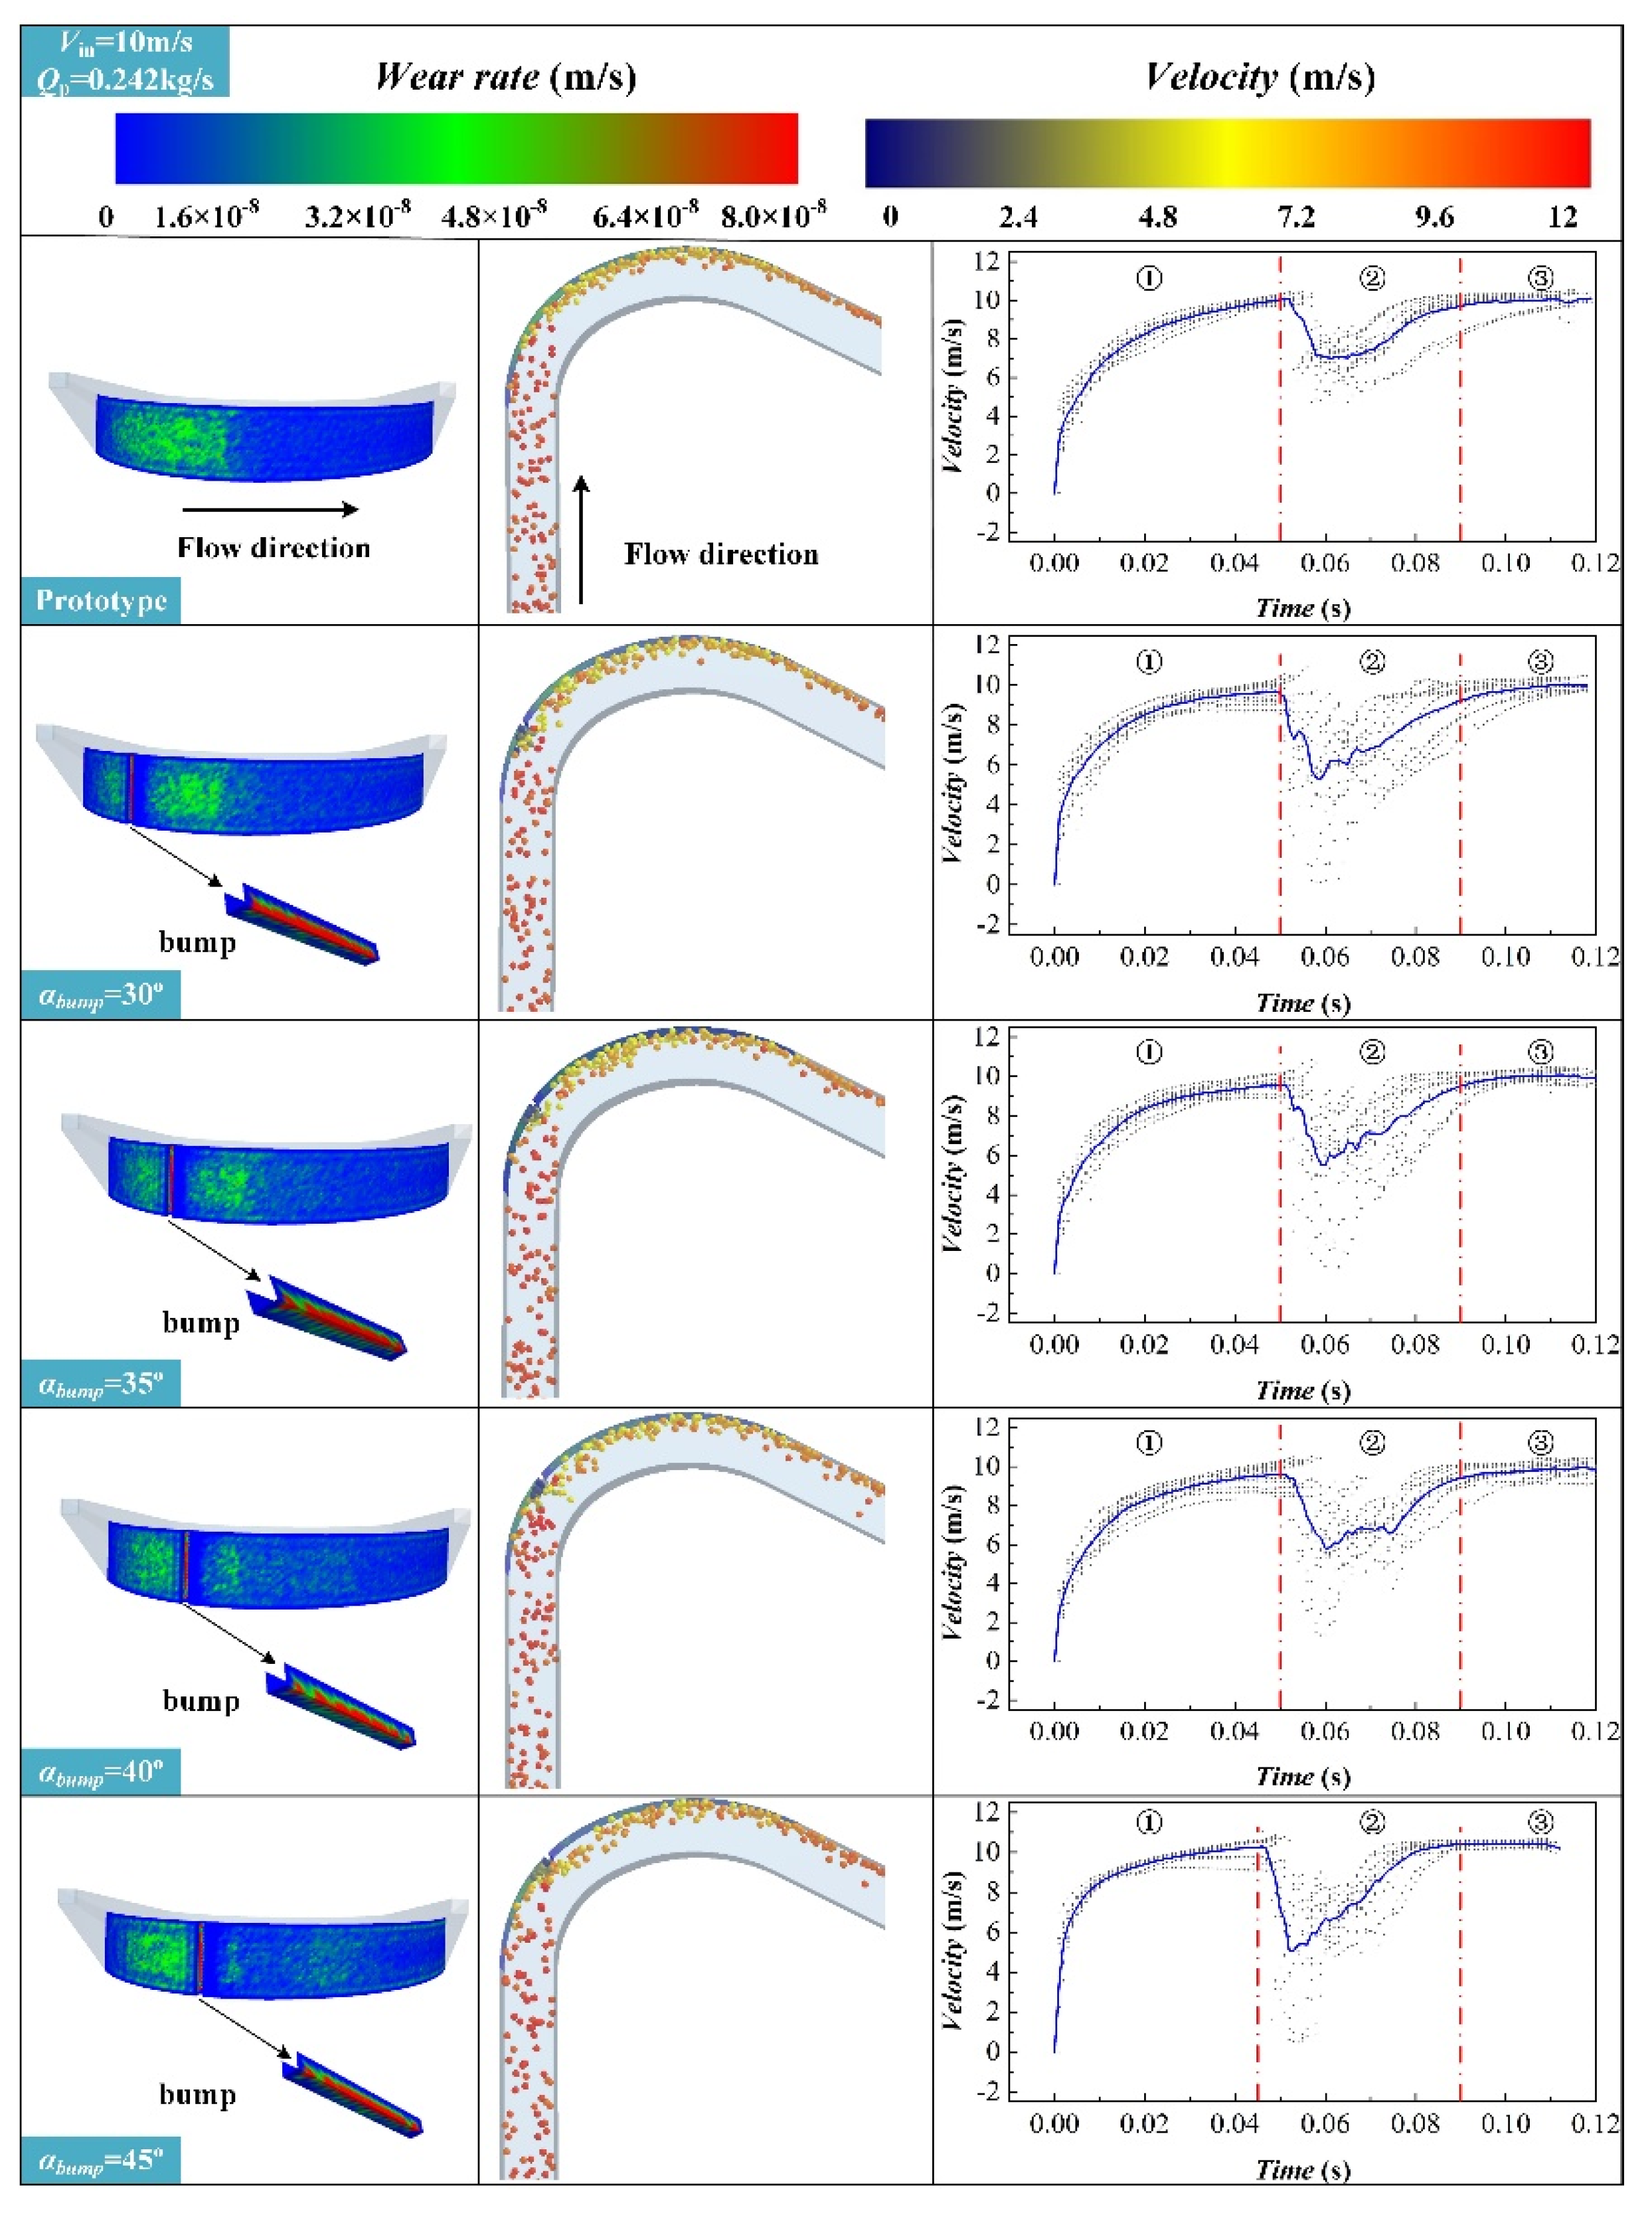
The abrasion on the outer bend wall was caused by the collision and friction between the particles and the wall, which were closely related to the velocity of the particles. The left, middle, and right columns of Figure 8 show the wear cloud diagram on the outer bend wall with different convex positions for the particle mass flow rate of 0.242 kg/s, the particle distribution and velocity diagram inside the flow passage, and the velocity variation diagram of the 12 particles selected to be tracked over time. In Figure 8, the color of the cloud map in the left column represents the wear depth of the wall, the color of the particles in the middle column represents the velocity of the particles at the current position, the black spot in the right column represents the velocity scatter of the 12 particles at each moment, and the blue curve represents the average velocity of the 12 particles at each moment.
The particle movement in the bend pipe could be divided into three stages. The first stage was from 0 s to about 0.05 s, which was a stable accelerated motion cycle. In the extension section of the entrance, the particle’s velocity accelerated from the initial zero velocity to 10 m/s. The second stage was from 0.05 s to 0.09 s after particle formation. At that stage, the velocity of particles plummeted after the collision with the wall. As can be seen from the velocity variation in Figure 8, the average velocity of the particles decreased more sharply after the collision with the wall in the curved pipe with a bump. At the same time, the bump disturbed the flow of water and the movement of particles in the curved pipe. Therefore, the velocity distribution of the particles after the rebound was more dispersed, and the velocity of some particles even decreased to zero. Thus, the particles temporarily accumulated near the bump, and the accumulated particles continued to block subsequent particles, generating a buffer layer effect in advance. An added bump on the outer bend wall could protect the wall from particle impact, thus reducing the wall wear. The third stage was from 0.09 s to 0.12 s after the particle entered the channel. In this phase, the particles followed the fluid in the outlet extension at a constant velocity.
The position of the bump also had a certain influence on wear. When the bump was close to the inlet, that is, when αbump was small, the severe wear area on the outer bend wall mainly occurred after the bump. With the increase of αbump, that is, when the bump moved toward the outlet, the wear area behind the bump decreased, and the maximum wear point on the outer bend wall shifted to the front of the bump. The collision wear was the most severe on the side of the entry direction. This showed that when the particle size was large, the flow field change caused by the wall bump was not enough to affect the movement of the particles. The particle movement was generally affected by the inertia. After entering the curved pipe from the straight pipe section, the centrifugal force caused the particles to interact with the wall surface. The collision position was essentially unchanged; so, the most severely worn parts experienced little change. However, the presence of the bump made the buffer layer effect occur in advance, which was beneficial for reducing the maximum wear value.
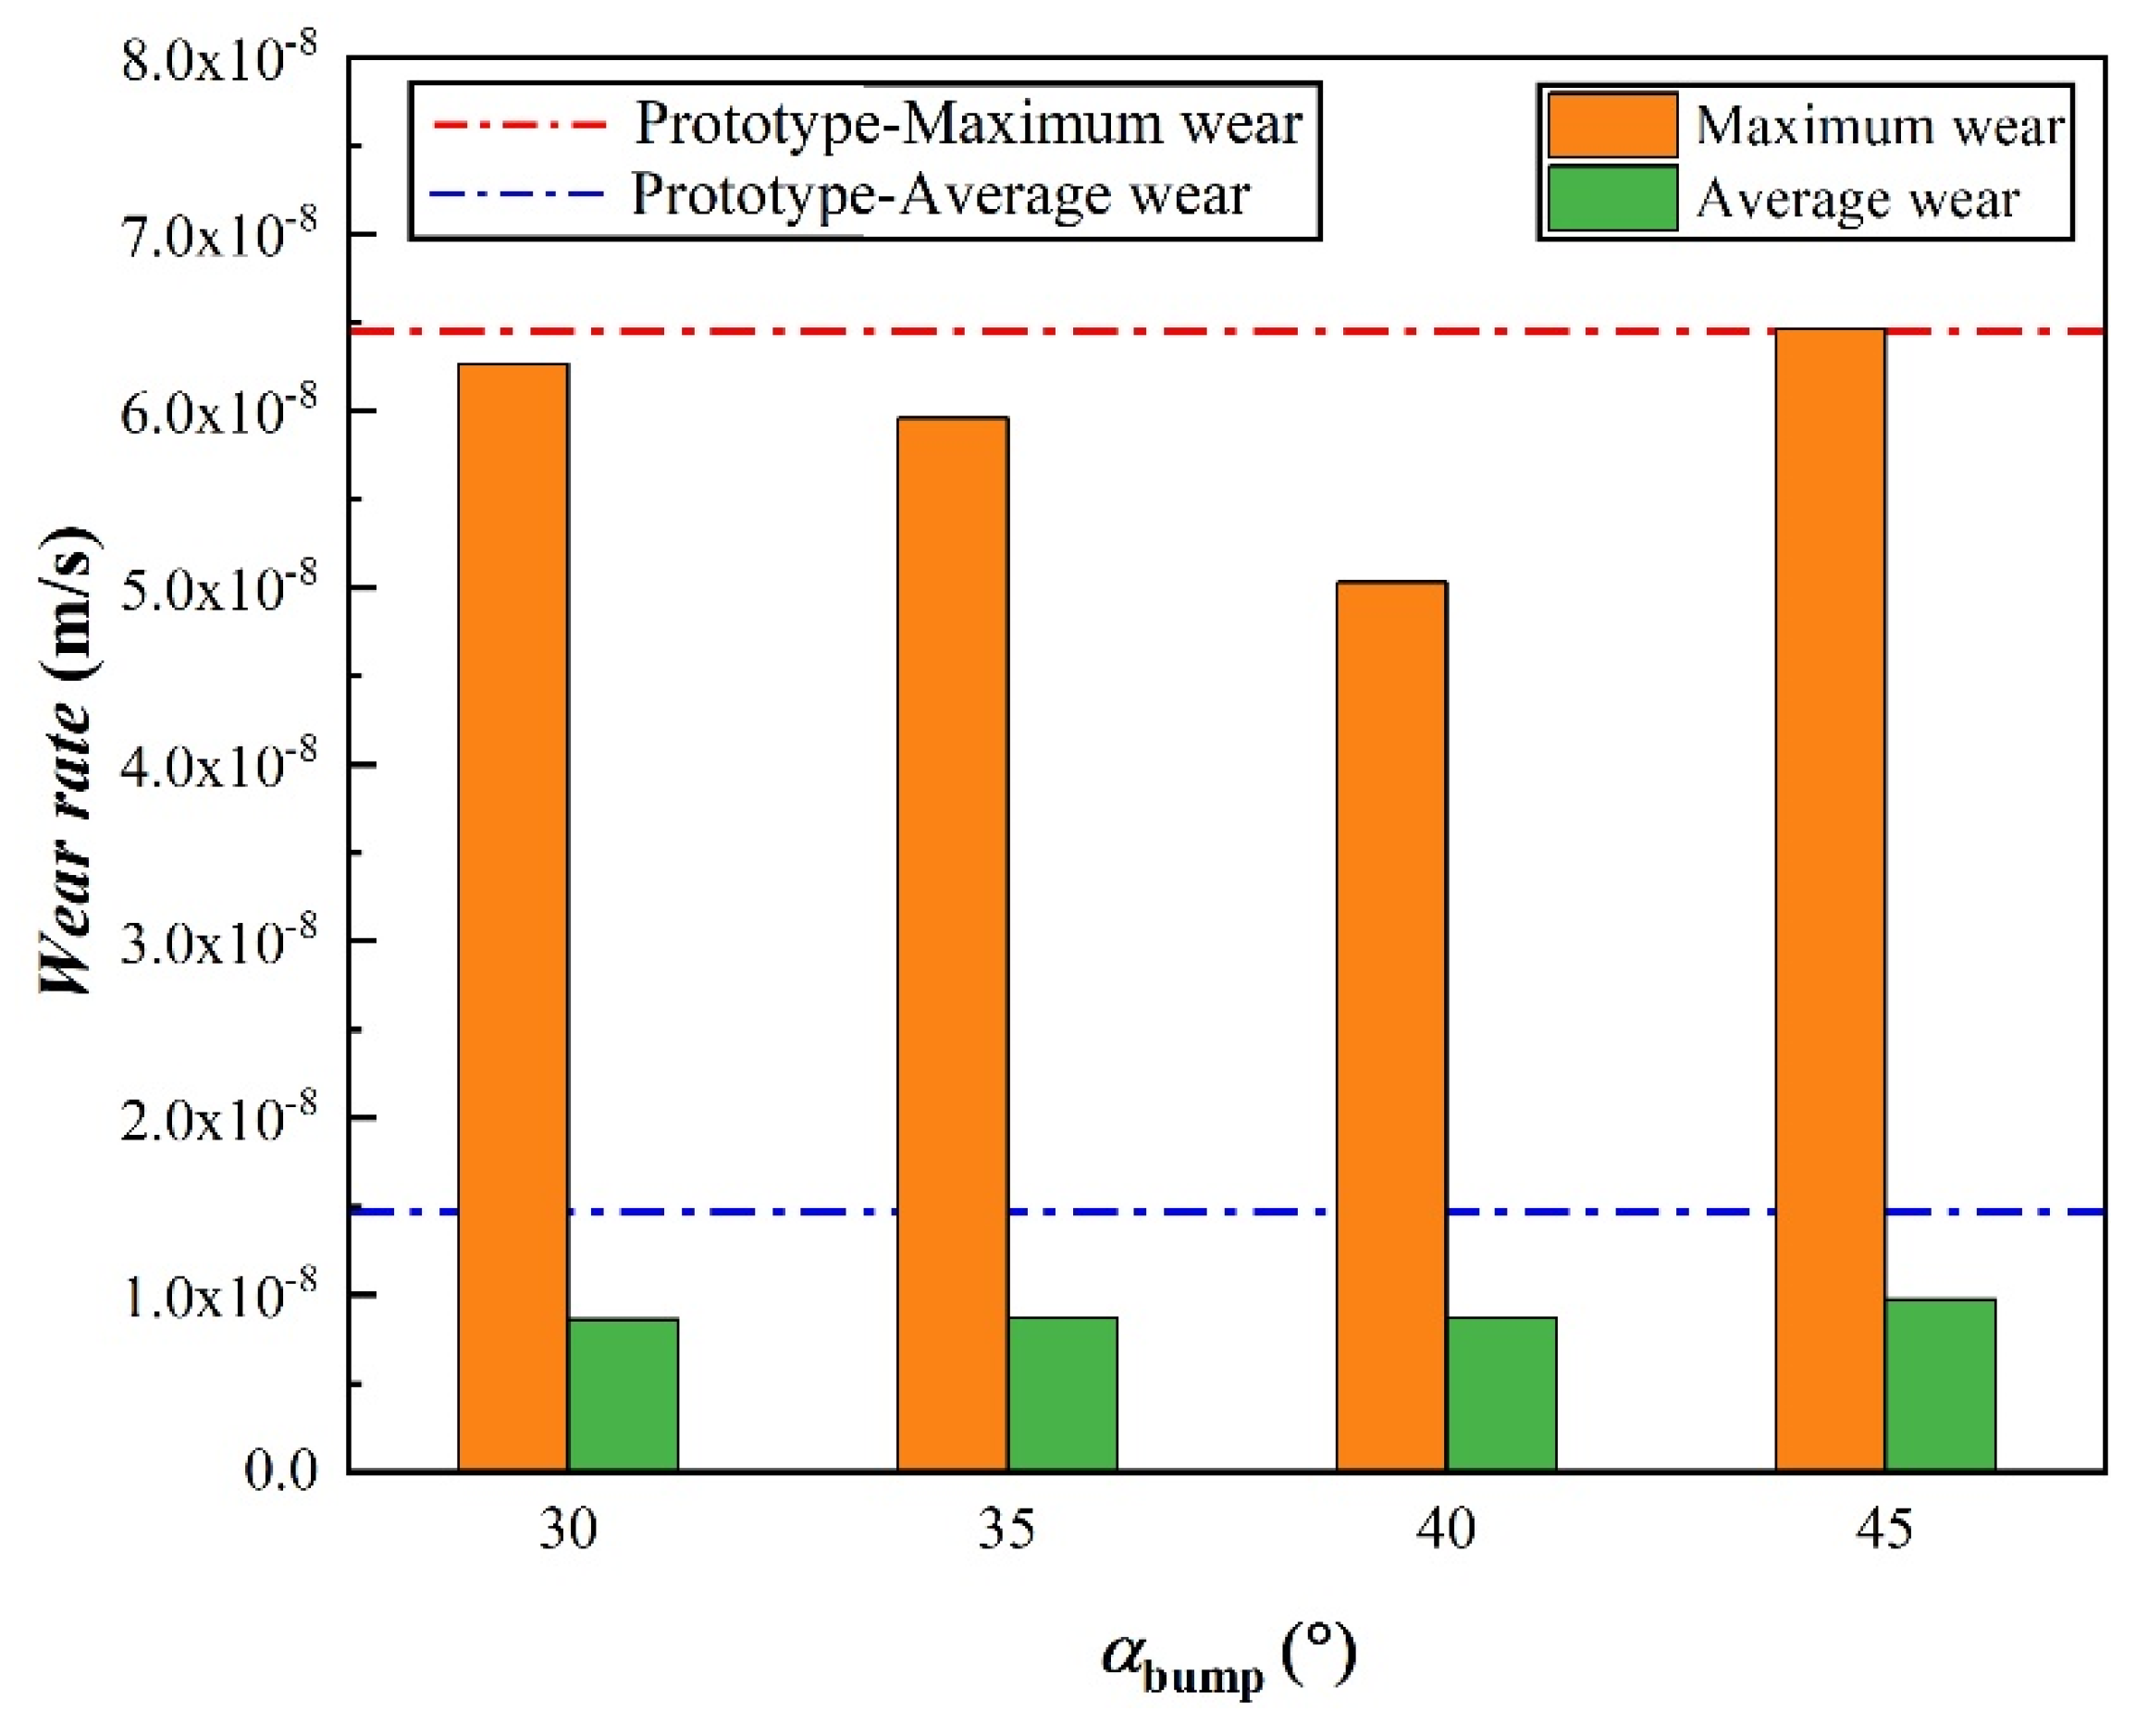
Figure 9 shows the relationship between the wear of the outer bend wall with the bump and the bump position angle α for the condition that the particle mass flow rate was 0.242 kg/s. Combined with Figure 9, it could be found that the most severe wear was at the collision between the particles and the wall surface with different positions of the bump, and the position did not change, but the bump could reduce the wear amount at this position. With the increase of αbump, the maximum wear of the outer bend wall first decreased and then increased. The average wear of the outer bend wall always increased slightly, but it had less than the average wear of the outer bend wall of the prototype bend pipe. When the position of the bump was near the collision position between the particles and the wall surface, the maximum wear amount decreased the most significantly.
Figure 10 shows the number of particles–outer wall surface collisions over time. The number of collisions in the prototype bend was significantly larger than that in the bend with the bump; the difference was about 150. In the bend with a bump, as the αbump became larger, the number of collisions decreased slightly. The existence of the bumps prevented a considerable part of the particles from directly impacting the outer wall surface, and the number of particles blocked by the different positions of the bumps was similar.
3.2. Effect of Particle Mass Flow
Particle mass flow Qp refers to the particle mass passing through the effective cross-section of a pipe per unit time, and it is directly related to the particle concentration. Increasing the particle mass flow will cause more particles to impact the outer wall.
Figure 11 shows the wear cloud diagram of the outer wall surface of each bend pipe for different particle mass flow rates. With the increase of the particle mass flow, the wear area changed from scattered to connected. The severely worn area of the prototype bend pipe was concentrated in the front section of the bend pipe, where the particles first collided with the outer wall. As the αbump became larger, the bump divided the severely worn area and finally shifted the severely worn area toward the bend entrance. The wear area of the outer wall surface of the bend with αbump = 30° was concentrated behind the bump. The wear area of the outer wall surface of the bend with αbump = 45° was concentrated in front of the bump. The maximum wear rate of the outer wall surface of these two bend pipes was close to that of the prototype bend pipe. The wear area of the outer wall surface of the two kinds of bends with αbump = 35° and αbump = 40° appeared larger, but the maximum wear rate was smaller than that of the prototype bend pipe.
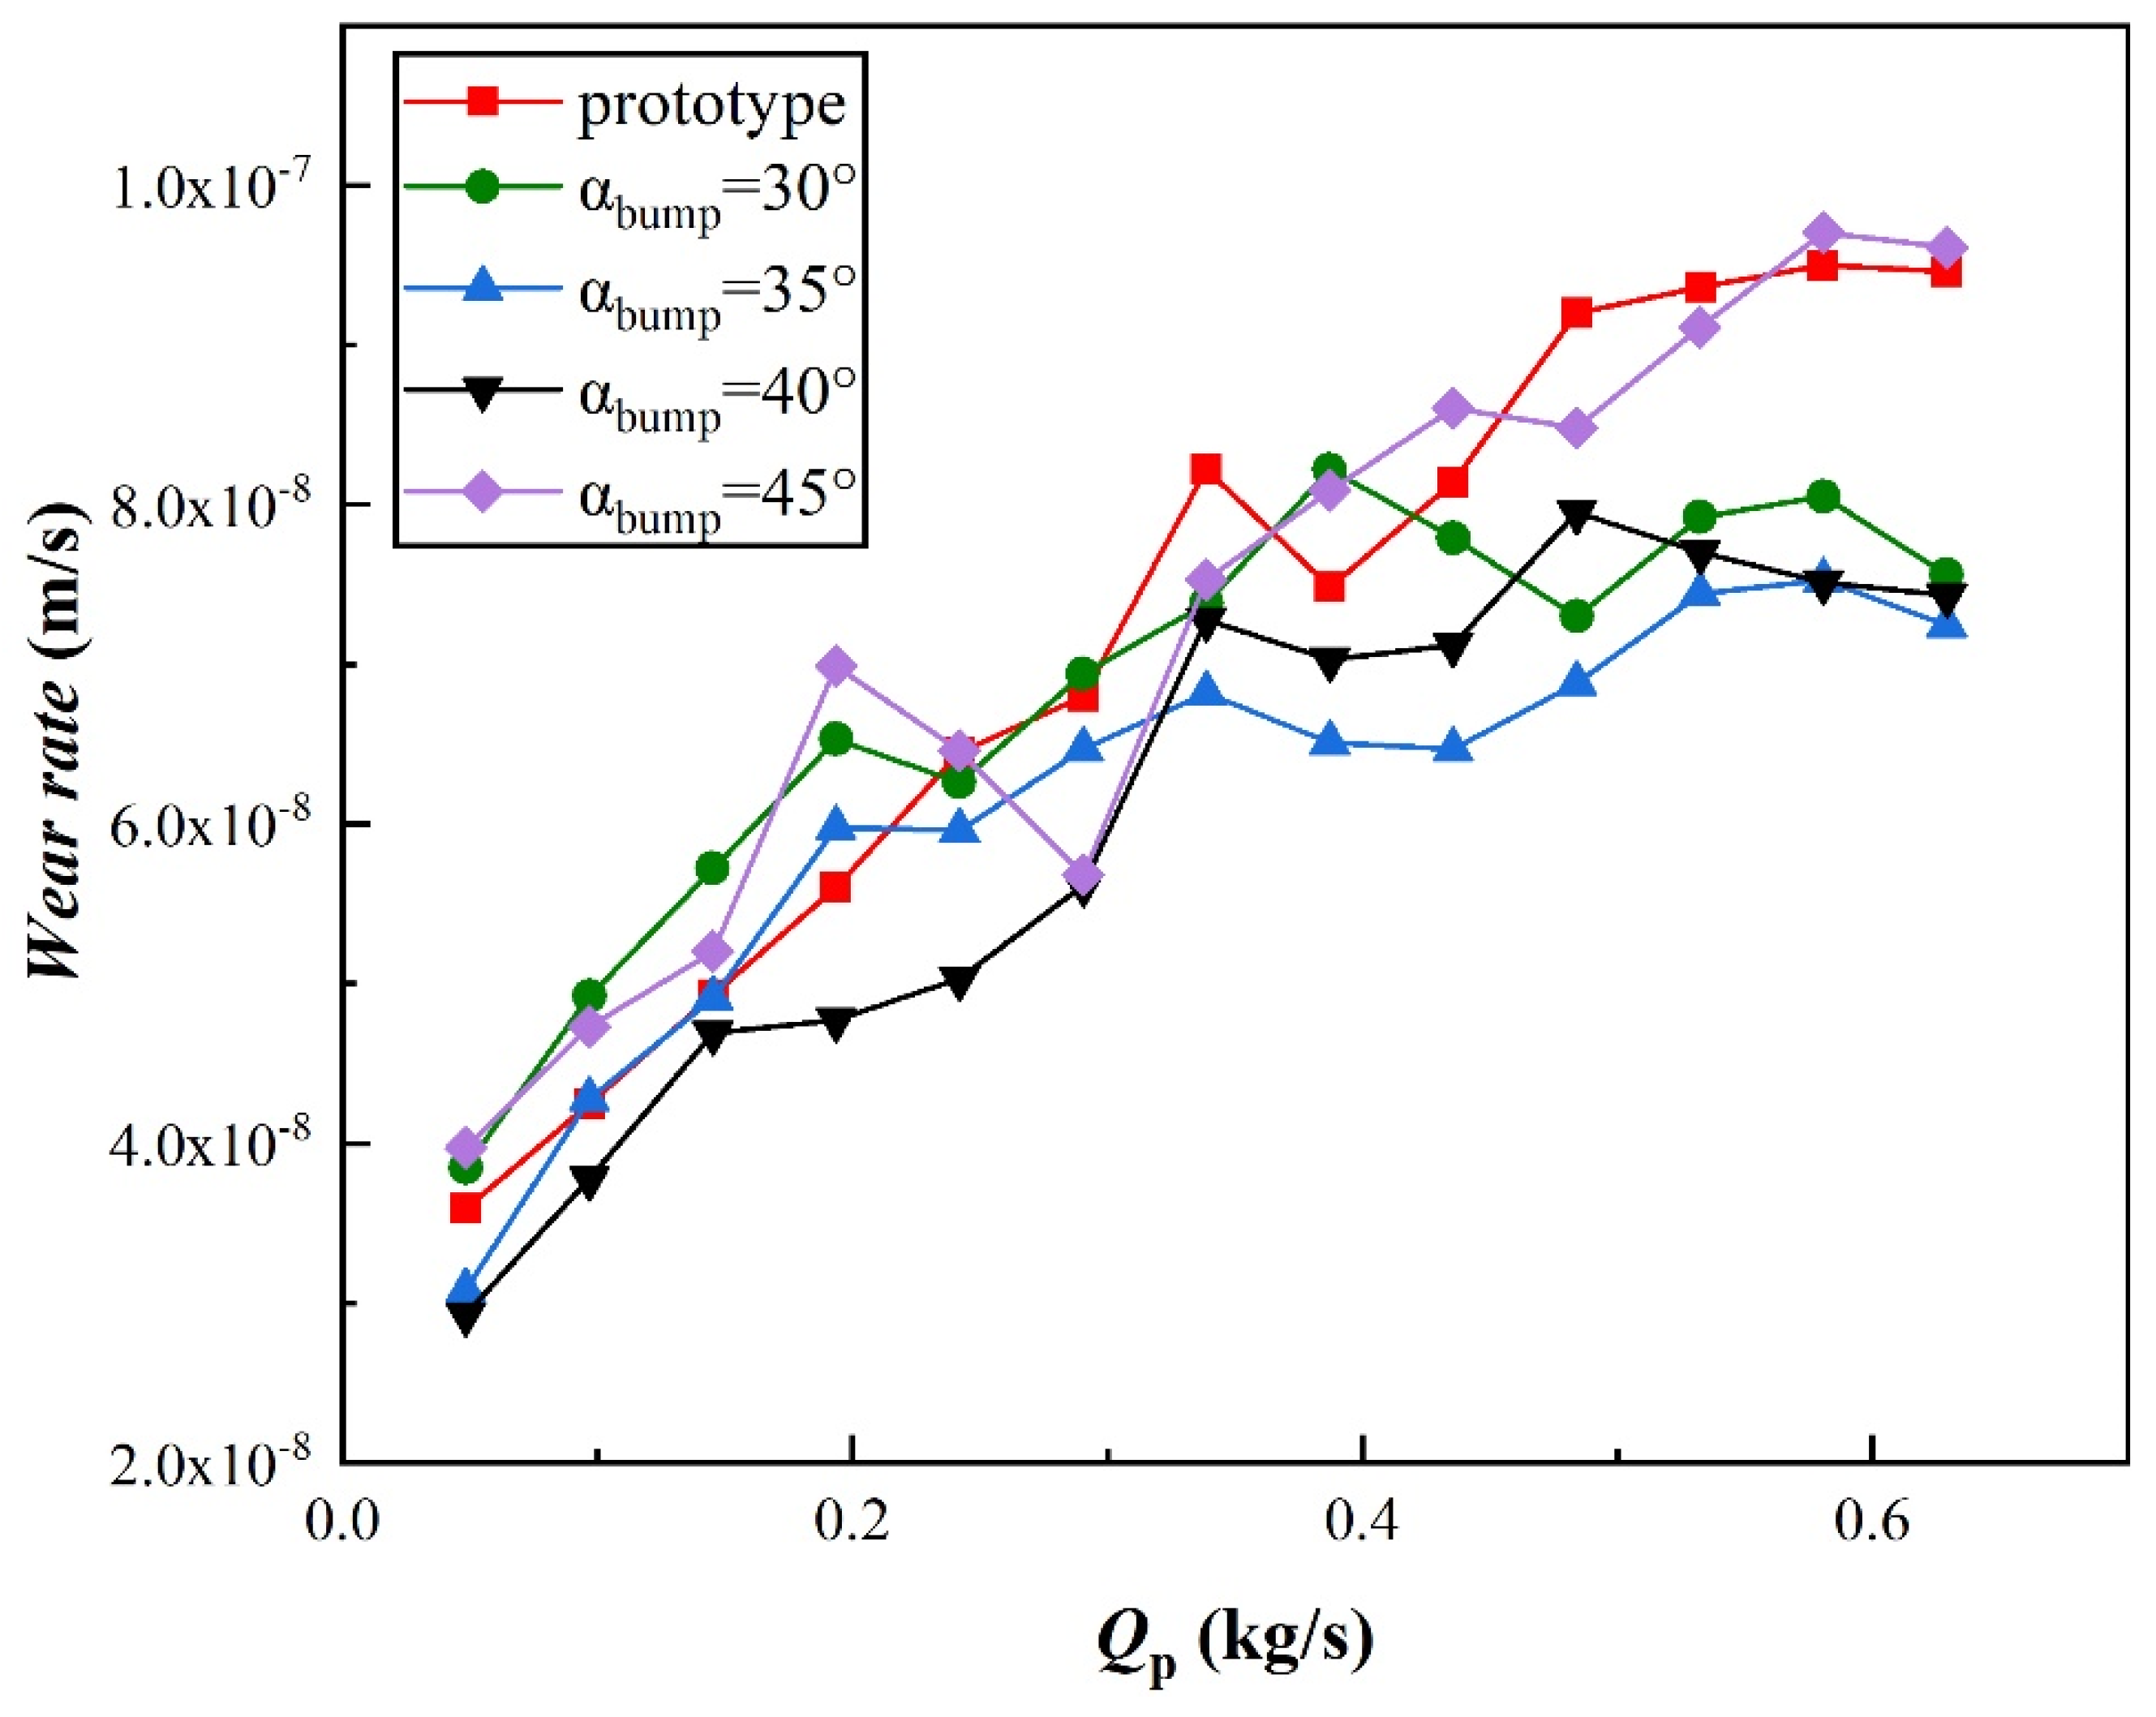
Figure 12 shows the change of the maximum wear rate of the outer wall surface for five kinds of bends with the particle mass flow rates. When the particle mass flow rate was less than 0.2 kg/s, the maximum wear rate increased rapidly. When the particle mass flow rate was further increased from 0.2 kg/s to 0.5 kg/s, the increase in the maximum wear rate slowed down. When the particle mass flow was greater than 0.5 kg/s, the maximum wear rate showed a stable trend. When the particle concentration was higher than a certain level, the particles near the wall surface formed a shield effect, preventing the rear particles from directly impacting the wall surface; so, the number of particles impacting the wall surface did not increase as the particle concentration increased. In the two kinds of bends with αbump = 35° and αbump = 40°, the maximum wear rate of the outer wall surface was generally smaller than that of the prototype bend pipe, which indicated that the bump at these two positions could reduce the wear of the outer wall surface of the bend. When the particle mass flow was less than 0.3 kg/s, the maximum wear rate of the outer wall surface of the bend with αbump = 40° was smaller than that with αbump = 35°. When the particle mass flow rate was greater than 0.3 kg/s, the maximum wear rate of the outer wall surface of the bend with αbump = 40° was larger than that with αbump = 35°. For different particle mass flow conditions, there were different bumps to set the optimal position. In the two kinds of bends with αbump = 30° and αbump = 45°, the maximum wear rate of the outer wall surface was almost the same as that of the prototype bend pipe. For the conditions of large particle mass flow, the maximum wear rate of the outer wall surface of the bend with αbump = 30° was smaller. The bump of αbump = 30° could block the rolling cutting abrasion caused by particles along the outer wall surface for the large particle concentration. The larger the particle mass flow was, the smaller the αbump had to be when setting the bump position.
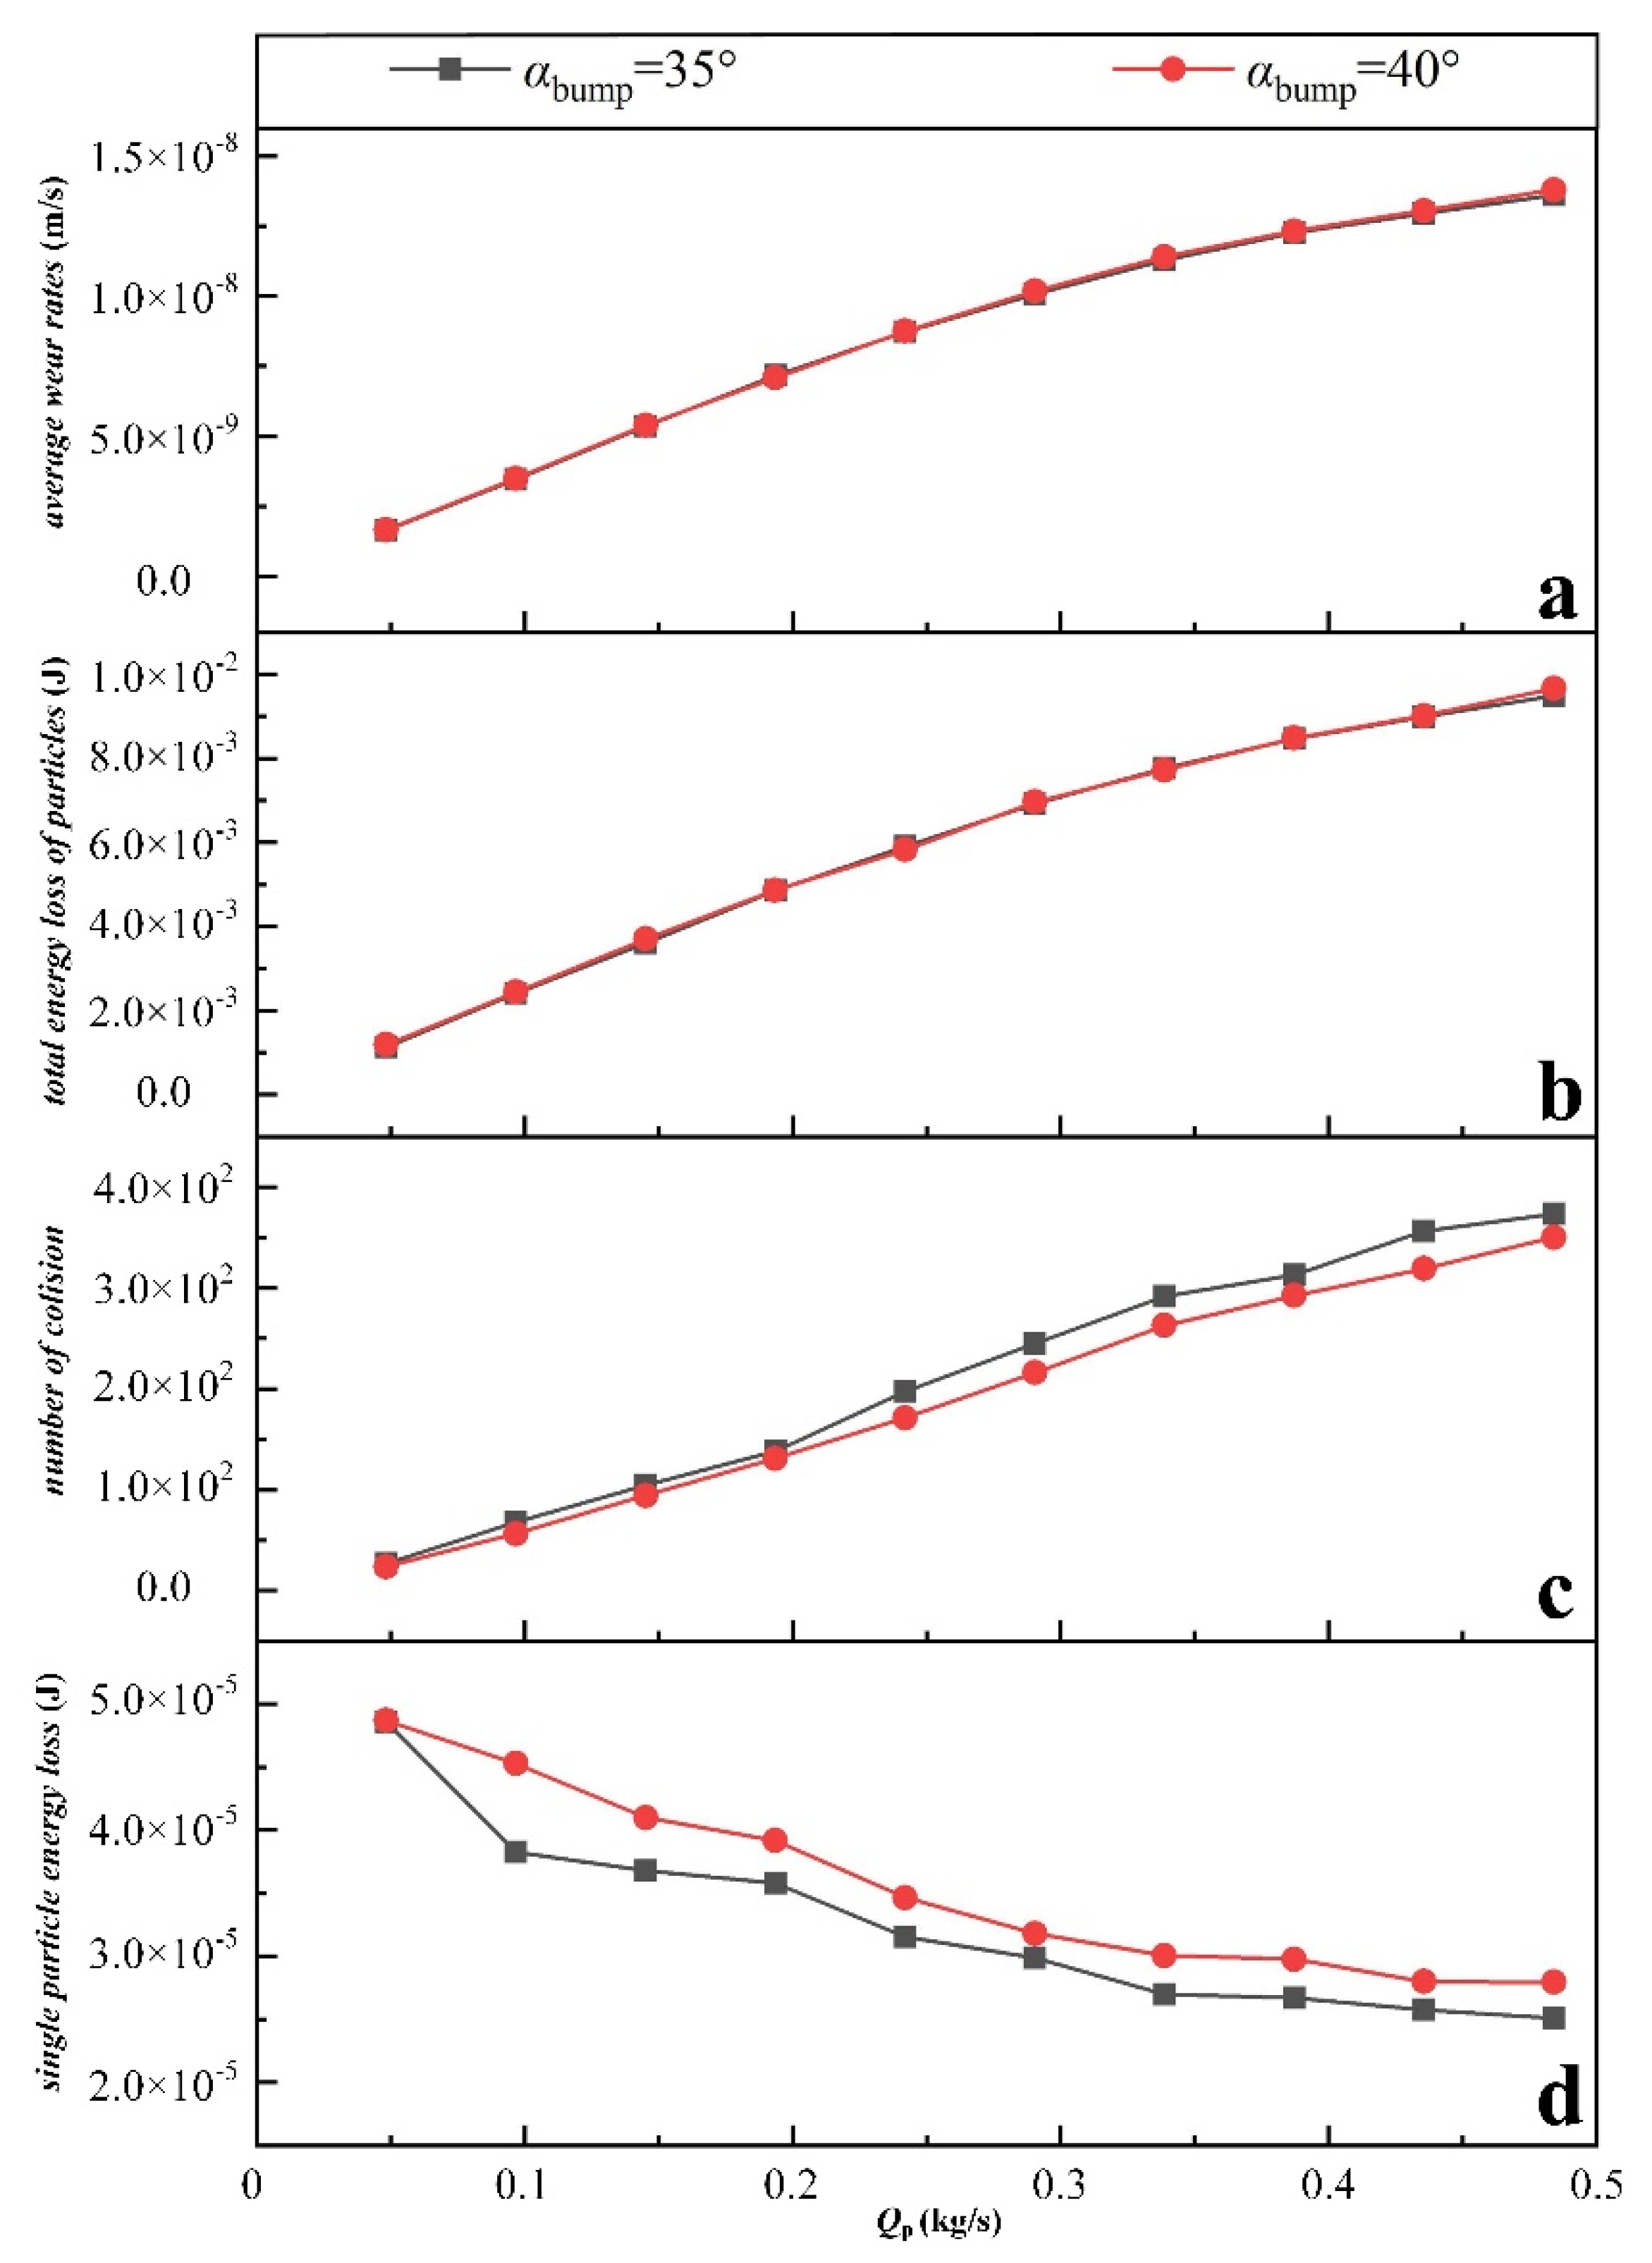
Figure 13a–d show the changes of the average wear on the inner wall of the curved tube, the total energy loss of the particles in the flow passage, the number of collisions, and the energy loss of the particles in a single collision with the particle mass flow at each time step (0.001 s), when the bump was located at αbump = 35° and αbump = 40°. The total energy loss of the particles in the two kinds of bend pipe tubes increased with the increase of the particle mass flow rate, but the increasing trend became more and more gentle, and the two curves almost coincided, which was also the reason why the average wear amount of the outer wall surface of the two angles in Figure 13a was almost the same. The number of particle collisions with the wall surface increased with the linear increase of the particle mass flow. The number of collisions with the αbump = 35° bend pipe was always greater than that with the αbump = 40° bend pipe. The energy loss of the particles in a single collision decreased with the increase of the particle mass flow, and the downward trend became more and more gentle. In comparison with the prototype bend pipe, the bump at both positions had the effect of reducing the maximum wear rate. The αbump = 35° bend pipe had a smaller energy loss from single impact particles and a smaller maximum wear rate when the particle mass flow rate was large.
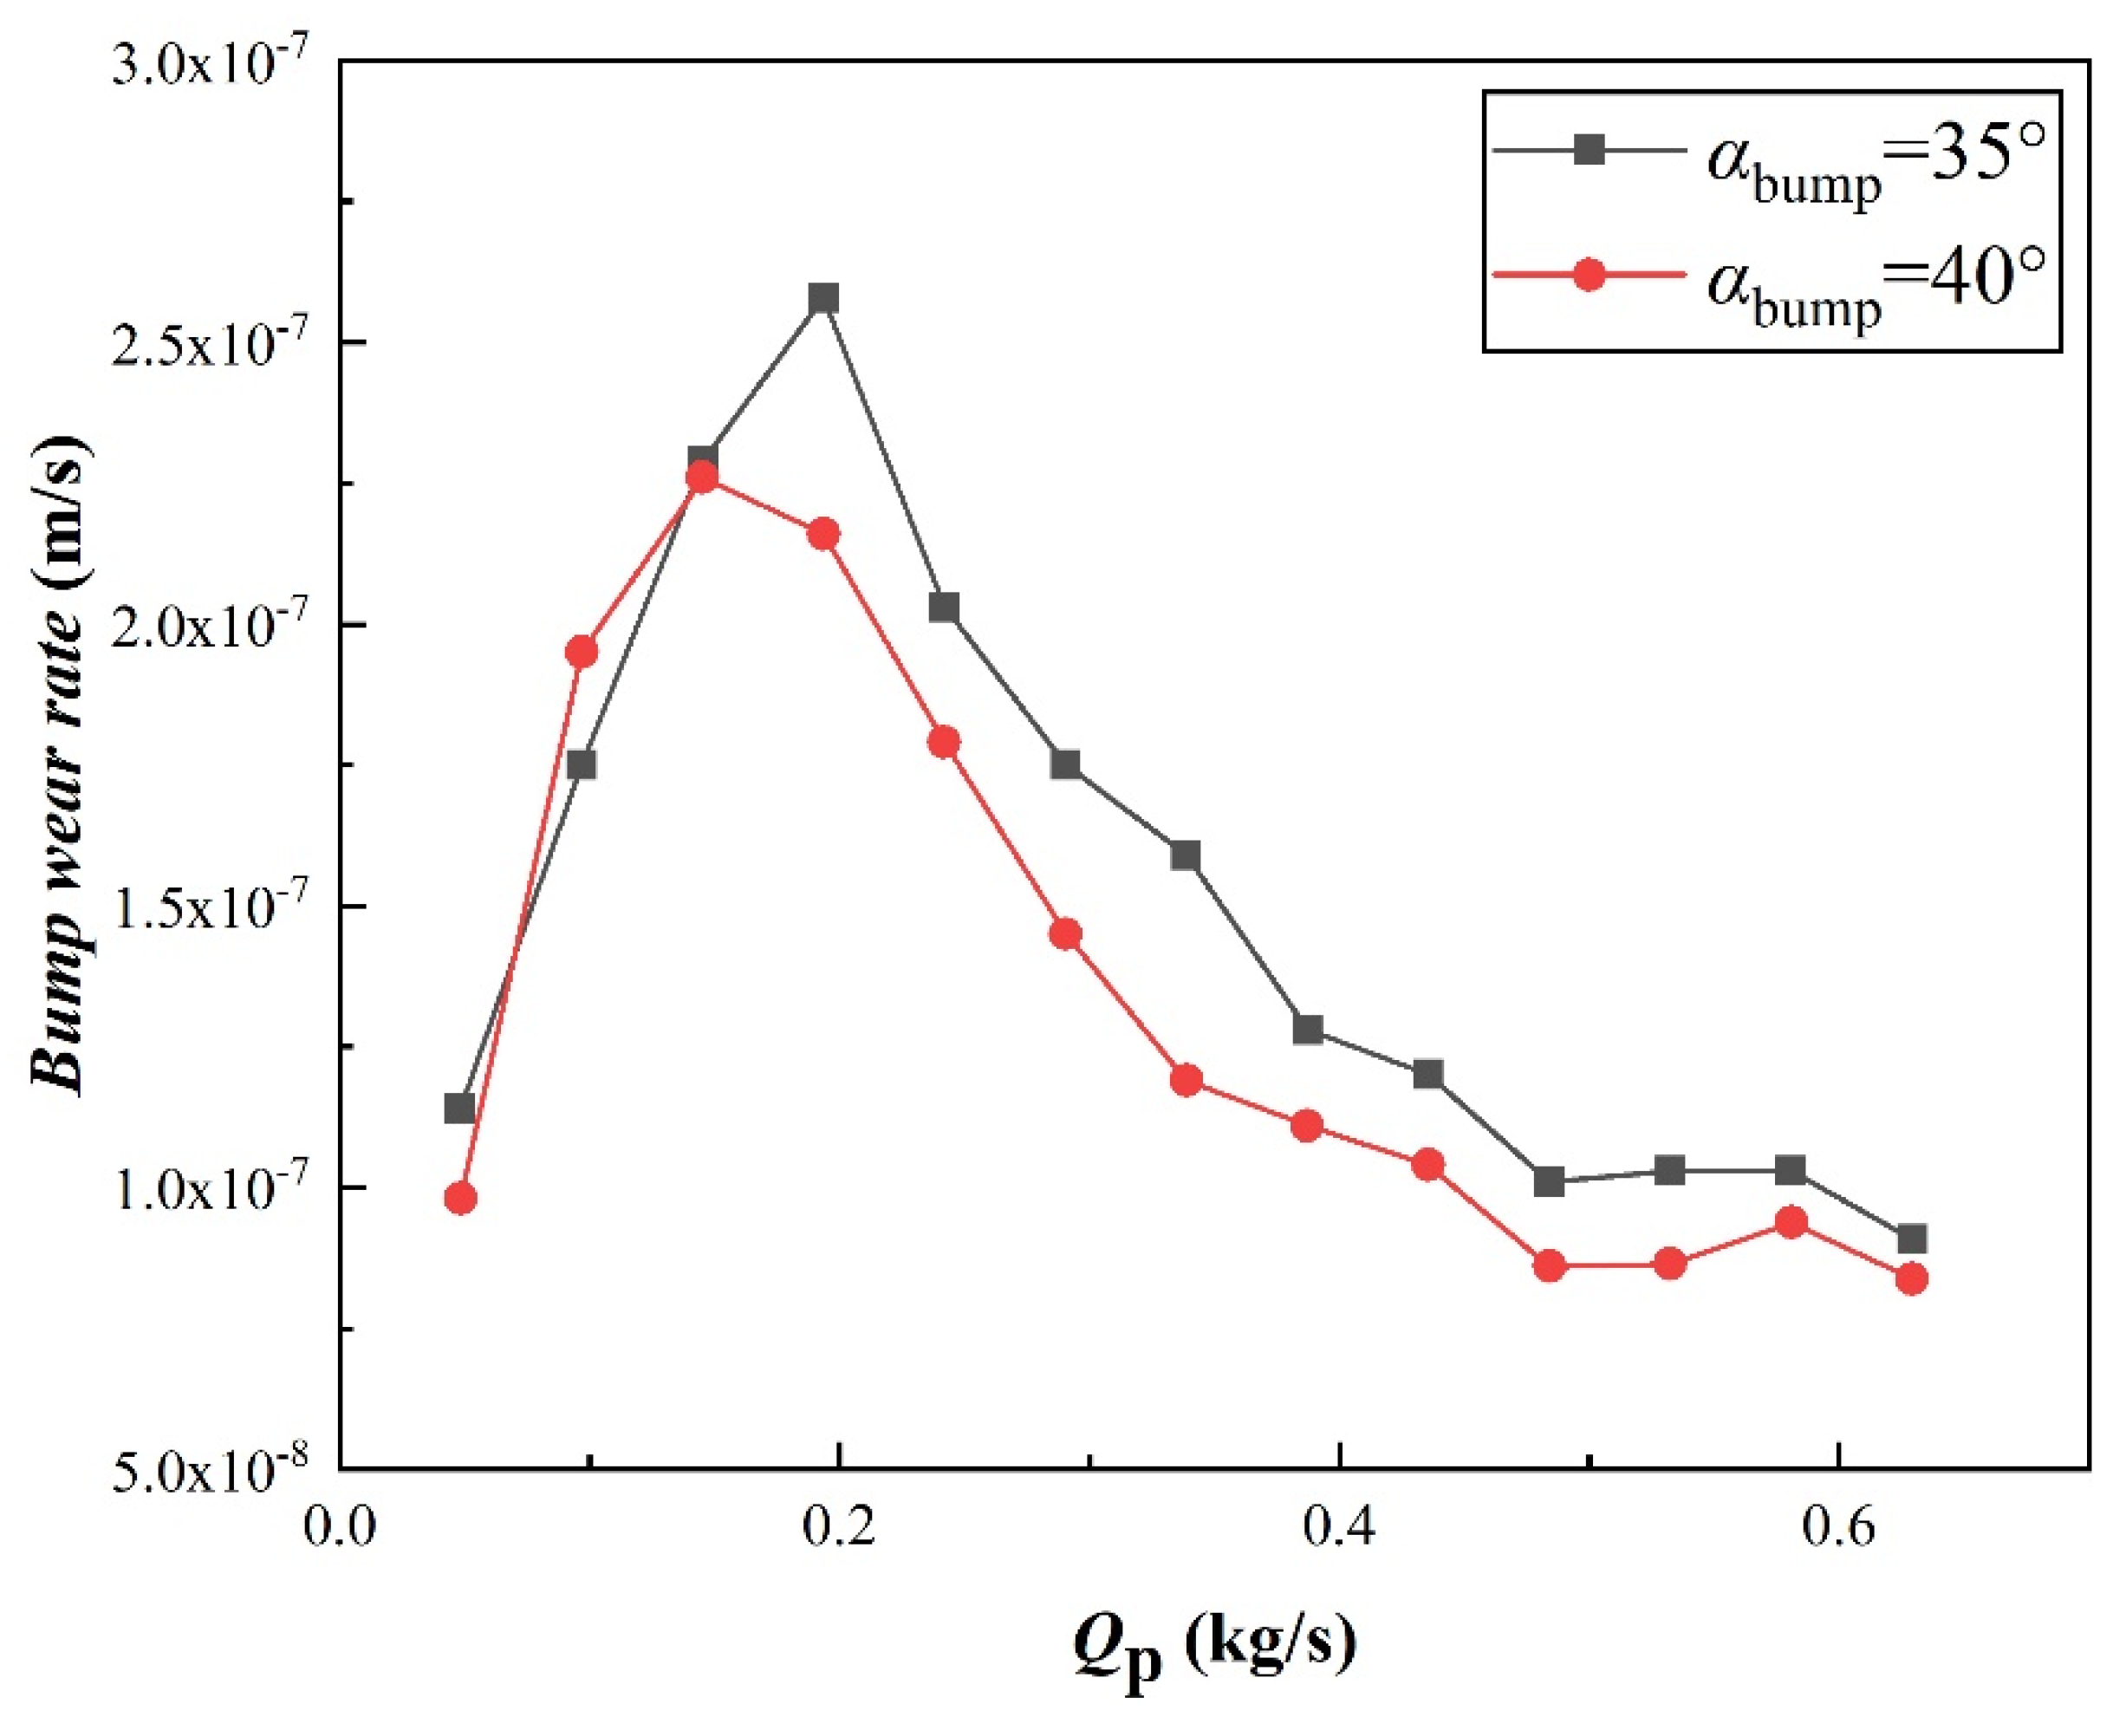
Figure 14 shows the relationship between the wear rate at the bump and the particle mass flow rate. When the particle mass flow rate was less than 0.2 kg/s, the wear rate at the bump increased rapidly. When the particle mass flow rate continued to increase, the wear rate at the bump gradually decreased. The increase of the particle mass flow rate led to an increase in the number of particles impacting the bump. However, when the particle mass flow rate was greater than a certain critical value, the particles stayed in the vicinity of the bump. These stagnation particles protected the bump from the direct impact of subsequent particles; so, the wear rate at the bump dropped to a minimum value. This showed that under the condition of large particle mass flow, adding a bump to the bend could reduce the maximum wear value of the outer wall surface of the bend, and the wear of the bump itself was relatively small.
3.3. Effect of Particle Size
This section describes how the change in the particle size affected the wear morphology and wear rate at various locations at the outer wall for the same particle mass flow rate. For convenience, the particle size was defined as D.
Figure 15 shows the wear cloud image of the outer wall of the prototype bend pipe, the bend with αbump = 35°, and the bend with αbump = 40° for different particle size conditions. In the prototype bend pipe, when the particle size increased, the wear zone moved towards the entrance of the bend. In the bends with αbump = 35° and αbump = 40°, at D = 1 mm and D = 2 mm, there was almost no wear on the area behind the bump, and the location of the largest wear point was far behind the bump. At D = 3 mm, the outer wall wear around the bump became serious, and the maximum wear point was close to the bump or even appeared in front of the bump. This was because when the particle size was small, the particles followed better. According to the conclusion shown in Figure 7, there was a circulation area behind the bump with a lower speed. The particles directly followed the fluid and bypassed the circulation area directly to the outlet.
Under the condition that the particle mass flow rate was determined, the smaller the particle size was, the more likely it was that corrugated wear would occur on the outer wall surface of the bend. As shown in Figure 15, the wear cloud images of the outer wall surfaces of the bend with D = 1 mm and D = 2 mm all showed obvious corrugations, but for D = 3 mm, the corrugations were not obvious. Karimi et al. [25] pointed out that when a fluid moved near the wall surface, friction occurred with the wall surface, while the fluid velocity was smaller than the fluid velocity at the center of the bend. Due to the influence of inertia, the particle concentration near the outer wall surface was much larger than the particle concentration in the central area. The combined effect of the above two factors enhanced the periodic flow disturbance around the particles. Due to the flow disturbance around the particles, the particles near the wall surface repeated the rebound and impact movement on the wall surface. Each small impact created pits on the outer wall surface, and the pits generated by a large number of particles eventually formed corrugations. The smaller the particle diameter, the smaller the Stokes number, and the better the following of the particles. At the same particle concentration, the number of particles was larger. Therefore, the corrugated wear was more obvious.
Figure 16 shows the maximum wear rate of the outer wall surface of the three bends at different angles under different particle size conditions. The maximum wear point of the outer wall surface of the prototype bend pipe appeared at α = 45° (D = 1 mm), α = 55° (D = 2 mm), and α = 45° (D = 3 mm). The maximum wear point of the outer wall surface of the bend with αbump = 35° appeared at α = 65° (D = 1 mm), α = 60° (D = 2 mm), and α = 55° (D = 3 mm). The maximum wear point of the outer wall surface of the bend with αbump = 40° appeared at α = 65° (D = 1 mm), α = 60° (D = 2 mm), and α = 30° (D = 3 mm). The maximum wear point of the outer wall surface of the prototype bend pipe changed within a range with the change of the particle size, and the angle of the maximum wear point of the outer wall surface of the bend with αbump = 35° and αbump = 40° changed as the particle size increases became smaller. By comparing the maximum wear of the three pipes with the same particle size, it could be found that when D = 1 mm and D = 2 mm, the maximum wear rate of the outer wall surface of the prototype bend pipe was less than the bend with αbump = 40°, at D = 3 mm, and the maximum wear rate of the outer wall surface of the prototype bend pipe was greater than the bend with αbump = 35° and αbump = 40°. This showed that the existence of a bump was less effective in reducing the maximum wear caused by small particles than that caused by large particles.
Figure 17 shows the change of the average wear rate of the outer wall surface of the three bends with the particle size. The bump reduced the average wear of the outer wall surface of the three types of bends, especially when the particle size was small. Under the condition of small particles, the number of particles was large, and the collision energy loss of the single particles was not very different. The previous study showed that the number of particles–outer wall collisions in bends with bumps was much smaller than that in the prototype bend pipe, which resulted in the average wear rate of the outer wall of bends with a bump being much smaller than that of the prototype bend pipe. In the prototype bend pipe, the average wear rate was only slightly affected by the particle size. The particle size increased by 1 mm, and the average wear rate increased by less than 5%, but the maximum wear rate increased by 50%. Therefore, the change of the particle size mainly affected the maximum wear rate of the outer wall surface.
3.4. Discussion
As wall wear is directly related to particle movement, and bumps have two effects on particle movement. One is direct influence, that is, particles collide with the bump, the speed drops sharply, and the movement trajectory changes, which in turn affects the movement of other particles. The other is the indirect effect, that is, the bump will affect the flow field, and the changed flow field will cause the particle motion to change accordingly. Therefore, the changes of flow field and particle motion after adding a bump in the bend pipe section are studied in this paper.
From the results of numerical simulation and experimental research, adding bumps on the wall of bend pipe may not necessarily achieve the effect of reducing wear, which is related to factors such as installation location, mass concentration and particle size (Stokes number). The bump at different positions in the bend pipe will cause the flow field to form different acceleration areas, where the force on the particles changes and the law of motion also changes. At the same time, the speed of the particles will drop sharply after they hit the bump, causing agglomeration near the bump, which makes the buffer layer effect occur in advance. The aggregated particles will prevent other particles from hitting the wall, thereby reducing the wear near the bump. Therefore, installing bumps at reasonable locations will effectively reduce the maximum wear of the bend pipe.
In general, the increase in particle mass flow and particle size will cause the largest wear part to move to the inlet side of the bend pipe, so as the concentration and particle size increase, the bump should be installed in the direction of the inlet side of the bend pipe, which is more conducive to reducing wear, which is the reason why the maximum wear rate of the wall of the bend pipe with αbump = 35° is lower than that of the wall with αbump = 40° when the particle mass flow is above 0.3388 kg/s.
4. Conclusions
The change of bend wall shape will affect the wear law of the wall surface. Therefore, based on the CFD-DEM coupling method, this paper studies the change of flow field and particle movement after the installation of bump in the bending section, and the research results can provide reference for the reduction of wear and the improvement of life of the pipe. From the calculation results and the discussion presented above, the following conclusions could be drawn:
- (1)
- The addition of a bump affected the solid–liquid two-phase flow field so that the acceleration area expanded to the bump. The bump had a blocking effect on the particles, and the addition of the bump could reduce the number of times the particles directly collided with the outer wall surface and reduce the average speed of the particles in the bend pipe.
- (2)
- As the mass flow rate of the particles increased, the severely worn area of the prototype bend pipe moved toward the entrance of the bend, and αbump = 35° and αbump = 40° were the best bump setting positions to reduce the maximum wear of the outer wall surface. When the particle mass flow rate was small, the wear reduction effect of the αbump = 40° bump was better than that of the αbump = 35° bump, and the opposite was true when the particle mass flow was large.
- (3)
- The change of the particle size mainly affected the maximum wear of the outer wall surface. When the particle size was small, corrugated wear occurred. For the condition of small particles, the reduction effect of adding the bump on the maximum wear of the outer wall of the bend was not as obvious as that for the conditions of large particles.
In general, bump in the bend pipe does not certainly reduce wall wear. The wear of the wall of the bend pipe is determined by the installation position of the bump, the mass flow rate of the particles and the particle size. Installing bumps in the most worn area of the prototype bend pipe will effectively reduce its maximum wear. With the increase of concentration and particle size, the most worn part moves to the inlet side of the bend pipe, the installation part of the bump should be installed on the inlet side at this time, and the offset is related to the concentration and particle size.
Author Contributions
Conceptualization, Y.L. and C.X.; methodology, J.C.; software, J.C.; validation, J.C. and C.X.; formal analysis, Y.L.; investigation, C.X.; resources, Y.L.; data curation, J.C.; writing—original draft preparation, J.C.; writing—review and editing, Y.L.; visualization, C.X.; supervision, Y.L.; project administration, Y.L.; funding acquisition, Y.L. All authors have read and agreed to the published version of the manuscript.
Funding
This research was funded by the National Natural Science Foundation of China (No. 51976197), and Key Research and Development Program of Zhejiang Province (No. 2020C03099).
Data Availability Statement
The data presented in this study are available on request from the corresponding author. Due to the huge amount of data, it is not convenient to save at publicly archived datasets.
Conflicts of Interest
The authors declare no conflict of interest.
References
- Farokhipour, A.; Mansoori, Z.; Saffar-Avval, M.; Ahmadi, G. 3D computational modeling of sand erosion in gas-liquid-particle multiphase annular flows in bends. Wear 2020, 450–451. [Google Scholar] [CrossRef]
- Kosinska, A.; Balakin, B.V.; Kosinski, P. Theoretical analysis of erosion in elbows due to flows with nano- and micro-size particles. Powder Technol. 2020, 364, 484–493. [Google Scholar] [CrossRef]
- Duarte, C.A.R.; Souza, F.J.D.; Venturi, D.N.; Sommerfeld, M. A numerical assessment of two geometries for reducing elbow erosion. Particuology 2020, 49, 117–133. [Google Scholar] [CrossRef]
- Parsi, M.; Vieira, R.E.; Kesana, N.; McLaury, B.S.; Shirazi, S.A. Ultrasonic measurements of sand particle erosion in gas dominant multiphase churn flow in vertical pipes. Wear 2015, 328, 401–413. [Google Scholar] [CrossRef]
- Peng, W.; Cao, X. Numerical simulation of solid particle erosion in pipe bends for liquid-solid flow. Powder Technol. 2016, 294, 266–279. [Google Scholar] [CrossRef]
- Zhao, T.; Takei, M.; Liu, K.; Cui, Y. Stokes effect on particle distribution in a circulating fluidized bed under swing motion. In Proceedings of the 7th World Congress in Industrial Process Tomography, Krakow, Poland, 2–5 September 2014; pp. 852–858. [Google Scholar]
- Wang, P.; Zhao, T.; Liu, K.; Wang, Z. Influence of Stokes number on the particle phase distribution behaviors in a rolling circulating fluidized beds (RCFB). J. Vis. 2021. [Google Scholar] [CrossRef]
- Hu, Q.; Zou, L.; Lv, T.; Guan, Y.; Sun, T. Experimental and Numerical Investigation on the Transport Characteristics of Particle-Fluid Mixture in Y-Shaped Elbow. J. Mar. Sci. Eng. 2020, 8, 675. [Google Scholar] [CrossRef]
- Vlasak, P.; Chara, Z.; Konfrst, J.; Krupicka, J. Distribution of concentration of coarse particle-water mixture in horizontal smooth pipe. Can. J. Chem. Eng. 2016, 94, 1040–1047. [Google Scholar] [CrossRef]
- Kuang, S.B.; Li, K.; Zou, R.P.; Pan, R.; Yu, A. Application of periodic boundary conditions to CFD-DEM simulation of gas-solid flow in pneumatic conveying. Chem. Eng. Sci. 2013, 93, 214–228. [Google Scholar] [CrossRef]
- Xu, L.; Zhang, Q.; Zheng, J.; Zhao, Y. Numerical prediction of erosion in elbow based on CFD-DEM simulation. Powder Technol. 2016, 302, 236–246. [Google Scholar] [CrossRef]
- Zeng, D.Z.; Zhang, E.B.; Ding, Y.Y.; Yi, Y.; Xian, Q.; Yao, G.; Zhu, H.; Shi, T. Investigation of erosion behaviors of sulfur-particle-laden gas flow in an elbow via a CFD-DEM coupling method. Powder Technol. 2018, 329, 115–128. [Google Scholar] [CrossRef]
- Chen, J.; Wang, Y.; Li, X.; He, R.; Han, S.; Chen, Y. Reprint of “Erosion prediction of liquid-particle two-phase flow in pipeline elbows via CFD-DEM coupling method”. Powder Technol. 2015, 282, 25–31. [Google Scholar] [CrossRef]
- Zhu, H.J.; Li, S. Numerical analysis of mitigating elbow erosion with a rib. Powder Technol. 2018, 330, 445–460. [Google Scholar] [CrossRef]
- Duarte, C.A.R.; Souza, F.J.D.; Santos, V.F.D. Mitigating elbow erosion with a vortex chamber. Powder Technol. 2016, 288, 6–25. [Google Scholar] [CrossRef]
- Santos, V.F.D.; Souza, F.J.D.; Duarte, C.A.R. Reducing bend erosion with a twisted tape insert. Powder Technol. 2016, 301, 889–910. [Google Scholar] [CrossRef]
- Duarte, C.A.R.; Souza, F.J.D. Innovative pipe wall design to mitigate elbow erosion: A CFD analysis. Wear 2017, 380–381, 176–190. [Google Scholar] [CrossRef]
- Song, X.Q.; Lin, J.Z.; Zhao, J.F.; Shen, T. Research on reducing erosion by adding ribs on the wall in particulate two-phase flows. Wear 1996, 193, 1–7. [Google Scholar] [CrossRef]
- Fan, J.; Yao, J.; Zhang, X.; Cen, K. Experimental and numerical investigation of a new method for protecting bends from erosion in gas-particle flows. Wear 2001, 251, 853–860. [Google Scholar] [CrossRef]
- Fan, J.R.; Luo, K.; Zhang, X.Y.; Cen, K.C. Large Eddy Simulation of the Anti-Erosion Characteristics of the Ribbed-Bend in Gas-Solid Flows. J. Eng. Gas Turbines Power 2004, 126, 672–679. [Google Scholar] [CrossRef]
- Fan, J.R.; Yao, J.; Cen, K.F.J.A.J. Antierosion in a 90° bend by particle impaction. AIChE J. 2002, 48, 1401–1412. [Google Scholar] [CrossRef]
- Li, Y.; Zhang, H.B.; Lin, Z.; He, Z.; Xiang, J.; Su, X. Relationship between wear formation and large-particle motion in a pipe bend. Roy Soc. Open Sci. 2019, 6. [Google Scholar] [CrossRef] [PubMed] [Green Version]
- Cundall, P.A.; Strack, O.D.L. Modeling of Microscopic Mechanisms in Granular Material. Stud. Appl. Mech. 1983, 7, 137–149. [Google Scholar] [CrossRef]
- Prasad, B.K.; Prasad, S.V.; Das, A.A. Mechanisms of material removal and subsurface work hardening during low-stress abrasion of a squeeze-cast aluminium alloy-Al2O3 fibre composite. Mater. Sci. Eng. A 1992, 156, 205–209. [Google Scholar] [CrossRef]
- Karimi, A.; Schmid, R.K. Ripple formation in solid-liquid erosion. Wear 1992, 156, 33–47. [Google Scholar] [CrossRef]
Figure 1.
EDEM–FLUENT coupling process diagram.

Figure 2.
(a) Normal displacement δn and tangential displacement δt of particle collision; (b) constitutive model of the interaction between two particles. (adapted from [22], with permission from THE ROYAL SOCIETY, 2019.)
Figure 2.
(a) Normal displacement δn and tangential displacement δt of particle collision; (b) constitutive model of the interaction between two particles. (adapted from [22], with permission from THE ROYAL SOCIETY, 2019.)

Figure 3.
Schematic diagram of grid model.

Figure 4.
Schematic diagram of the experimental device.

Figure 5.
Comparison of the experimental and simulated results of aluminum sheet wear rate.

Figure 6.
Wear topography (experiment), wear cloud picture (simulation) in the flow field (simulation) at 8 cm for mass concentrations of 1%, 5%, and 10%.
Figure 6.
Wear topography (experiment), wear cloud picture (simulation) in the flow field (simulation) at 8 cm for mass concentrations of 1%, 5%, and 10%.

Figure 7.
Flow field velocity vector diagram of the prototype bend pipe and the bend pipe with different positions of the bump.
Figure 7.
Flow field velocity vector diagram of the prototype bend pipe and the bend pipe with different positions of the bump.

Figure 8.
The relationship between the wear rate and the fluid and particle movement left column: the wear cloud diagram on the outer bend wall with different convex positions, middle column: the particle distribution and the velocity diagram inside the flow passage, right column: the velocity variation diagram of the 12 particles selected to be tracked over time.

Figure 9.
Schematic diagram of the relationship between the bump position and the wear rate.

Figure 10.
Schematic diagram of the number of particle collisions with the wall.

Figure 11.
Wall surface wear rate for different particle mass flow rates.

Figure 12.
Schematic diagram of the wear rate of five convex bends for different particle mass flow rates.
Figure 12.
Schematic diagram of the wear rate of five convex bends for different particle mass flow rates.

Figure 13.
Correlation analysis of average wear rates, particle collision numbers, and energy losses.
Figure 13.
Correlation analysis of average wear rates, particle collision numbers, and energy losses.

Figure 14.
The variation of the maximum wear rate of the bump with the particle mass flow rate.

Figure 15.
Contours of outer wall surface wear for different particle sizes.

Figure 16.
The maximum wear rate of each angle of the outer wall surface for different particle sizes.
Figure 16.
The maximum wear rate of each angle of the outer wall surface for different particle sizes.

Figure 17.
The average wear rate of the outer wall surface of the three bend pipes for different particle sizes.
Figure 17.
The average wear rate of the outer wall surface of the three bend pipes for different particle sizes.


Table 1.
Parameters of the solid phase in simulation.
| Parameters | Values |
|---|---|
| Material (Particles) | Soda-lime glass |
| Shape (Particles) | Sphere |
| Poisson’s ratio (Particles) | 0.25 |
| Shear modulus (Particles) (GPa) | 1.96 |
| Density (Particles) (kg/m3) | 2500 |
| Material (Wall) | Al alloy 6061 |
| Poisson’s ratio (Wall) | 0.3 |
| Shear modulus (Wall) (GPa) | 26.5 |
| Density (Wall) (kg/m3) | 2700 |
| Radius (Particles) (mm) | 1.5 |
| Initial velocity (Particles) (m/s) | 0 |
| Particle Reynolds number | 1400 (dp = 1 mm) 2800 (dp = 2 mm) 4200 (dp = 3 mm) |
| Time step (s) | 1 × 10⁻⁶ |
Table 2.
Parameters of the liquid phase in simulation.
| Parameters | Values |
|---|---|
| Material | Water |
| Viscosity (kg/(m·s)) | 0.001003 |
| Density (kg/m3) | 998.2 |
| Initial average velocity (m/s) | 10 |
| Reynolds number | 2.189 × 10⁵ |
| Time step (s) | 5 × 10⁻⁵ |
Publisher’s Note: MDPI stays neutral with regard to jurisdictional claims in published maps and institutional affiliations. |
© 2021 by the authors. Licensee MDPI, Basel, Switzerland. This article is an open access article distributed under the terms and conditions of the Creative Commons Attribution (CC BY) license (https://creativecommons.org/licenses/by/4.0/).
Share and Cite
MDPI and ACS Style
Li, Y.; Cao, J.; Xie, C. Research on the Wear Characteristics of a Bend Pipe with a Bump Based on the Coupled CFD-DEM. J. Mar. Sci. Eng. 2021, 9, 672. https://0-doi-org.brum.beds.ac.uk/10.3390/jmse9060672
AMA Style
Li Y, Cao J, Xie C. Research on the Wear Characteristics of a Bend Pipe with a Bump Based on the Coupled CFD-DEM. Journal of Marine Science and Engineering. 2021; 9(6):672. https://0-doi-org.brum.beds.ac.uk/10.3390/jmse9060672
Chicago/Turabian StyleLi, Yi, Jianpeng Cao, and Chaojie Xie. 2021. "Research on the Wear Characteristics of a Bend Pipe with a Bump Based on the Coupled CFD-DEM" Journal of Marine Science and Engineering 9, no. 6: 672. https://0-doi-org.brum.beds.ac.uk/10.3390/jmse9060672
Note that from the first issue of 2016, this journal uses article numbers instead of page numbers. See further details here.