
Thixotropy of a Transparent Clay Manufactured Using Carbopol to Simulate Marine Soil

Key Laboratory of Geomechanics and Embankment Engineering in Ministry of Education, Hohai University, Nanjing 210024, China
*
Author to whom correspondence should be addressed.
J. Mar. Sci. Eng. 2021, 9(7), 738; https://0-doi-org.brum.beds.ac.uk/10.3390/jmse9070738
Submission received: 2 May 2021
/
Revised: 27 June 2021
/
Accepted: 29 June 2021
/
Published: 4 July 2021
(This article belongs to the Section Geological Oceanography)
Abstract
:A transparent clay manufactured using Carbopol® UltrezTM 10 (simplified as U10) was introduced, and its manufacturing processes were briefly described. Both relative transparency (RT) and modulation transfer function (MTF) methods were used to quantify the optical character variation via soil thickness. The transparency of this new transparent clay was analyzed and compared with four traditional transparent materials. The thixotropic properties of this synthetic transparent clay were measured in detail through the laboratory vane test. An exponential function was used to describe the thixotropy and sensitivity of the clay. The results showed that the new transparent clay has a relatively higher optical transparency than the majority of previous materials. Good-fitting results showed a similar development trend in thixotropy for the synthetic transparent clay and the natural ones. Furthermore, the sensitivity of the transparent clay was low to medium, which can simulate marine soil. With higher optical transparency than and similar thixotropy and sensitivity as natural clays, Carbopol® UltrezTM 10 shows great potential as a substitute for natural clay and is expected to be widely used in model tests.
1. Introduction
Several innovative transparent materials whose geotechnical properties are similar to natural soils (sand and clay) are used in model tests to study internal displacement and flow problems [1,2]. Transparent sand and clay are manufactured using granular particles and pore fluid with the same refractive index values. Crushed Pyrex glass, silica gel, and fused quartz are used to simulate natural sand [3,4,5]. Amorphous silica (fumed silica aggregate), Aquabeads, Laponite RD, and Gelita are used to simulate natural clay [6,7,8,9,10,11]. These transparent materials are mainly used in model tests to study structure penetration, shallow foundation, plant rhizosphere growth, multiphase flow, grout permeation, and soil–geosynthetic interaction problems. Transparent soil models can be sliced optically using laser sheets, and two-dimensional images of the deformed shape within each slice are obtained by digital image correlation of successive images before and after movement. Multiple slices can be used to construct a complete spatial picture of the deformed mass.
Normally, large-scaled models using these transparent materials are usually limited by their poor transparency. Hence, selecting a suitable transparent material that has higher transparency than and closer geotechnical properties to natural sand or clay will still be one of the most important tasks in the near future. The objective of this paper was to develop a new transparent clay using Carbopol® UltrezTM 10 (simplified as U10) and analyze the transparency of this new material compared with four traditional transparent materials (two transparent sands and two transparent clays).
For natural clay, sensitivity is an important property when the strength of the clay changes due to external disturbances. The index of sensitivity (St) is used to evaluate the structural strength of soft clay. Thixotropy is one of the important factors that make saturated soft clay sensitive. Thixotropy is the phenomenon of the structure strength of soil decreasing sharply when an external force acts on it and then gradually recovering with the increase in time after cessation. Comparison and analysis of the thixotropy and sensitivity of the synthetic transparent clay manufactured using U10 and several natural clays was performed in this paper.
2. Materials and Methods
2.1. Materials
Carbopol® Ultrez™ 10 is a cross-linked polyacrylic acid polymer that provides efficient rheology modification with encased self-wetting for ease of use [12]. U10 has many typical features and benefits, such as short floe properties, high viscosity, and high suspending ability. The particle size, specific gravity, and specific surface area of U10 used in this paper were 50~100 mm, 1.4543, and 0.21 m2/g, respectively. The photos of U10 powder materials and SEM images of 1 × 10⁴ and 5 × 10⁴ magnification are shown in Figure 1a,b. U10 polymer powder shrinks in contact with water. When the powder disperses in water, the cross-linked acrylic resin chain begins to spread. After neutralization with an alkaline substance, the polymer structure expands. From dry to gelled polymers, the volume may increase by 1000 times.
NaOH powder of fused white particles was chosen as the neutralized material, the purity of which is greater than 98% for the analytical reagent (AR). The solution of NaOH is strongly alkaline.
The photos of the synthetic transparent clay manufactured using U10 are shown in Figure 1c. A speckle field was usually used in transparent soil to investigate internal deformation problems [13]. Nanomaterials (carbon nanotubes) were incorporated into the synthetic transparent clay as tracking particles. The amount of nanomaterials was about 1‰ by mass, which can be negligible in the mix design. Nanotubes were multiwalled (outside and inside diameters were equal to 8~15 and 3~5 mm, respectively) materials with the appearance of a black powder. The specific surface area and density of the materials were 233 m2/g and 0.15 g/cm3, respectively. A distinctive speckle pattern under laser sheets was obtained by a camera, as shown in Figure 1d. This indicated that the new synthetic transparent clay is suitable for the physical model test in deformation investigations.
2.2. Manufacturing Processes
The synthetic transparent clay was manufactured using U10 powder, NaOH powder, and distilled water. The synthetic transparent clay was prepared with a 0.75% initial mixture of U10 powder by weight, calculated as follows:
The manufacturing processes of the synthetic transparent clay used in this paper included the following steps (a 0.75% mixture was taken as an example):
- (1)
- Safety measures: Before the manufacturing operation, protective equipment was needed to prevent adverse effects of fine particulate materials on human health.
- (2)
- Material preparation: The amounts of U10 powder, NaOH powder, and distilled water were weighed according to Equation (1): 0.15 kg of U10 powder, 0.35 kg of NaOH powder, and 19 L of distilled water were chosen in this paper.
- (3)
- Mixture of U10 powder: The distilled water was heated to 60~70 °C for 3~4 h first. Then, the U10 powder was poured into the heated water, mixed for 30~40 min by a low-power agitator, and kept for 3~4 h under airproof conditions at room temperature.
- (4)
- Mixture of NaOH and water: NaOH powder was dissolved in 0.5 L of distilled water first. Then, NaOH–water solution was poured into the U10–water mixed liquor and mixed for 30~40 min by a high-power agitator. Mixing was stopped when the mixture became a smooth paste.
- (5)
- Air bubble removal: If a speckle field was necessary, carbon nanotubes were sprinkled into the transparent clay served as tracer particles. The air bubbles mixed in the sample were removed through vacuuming the sample. The synthetic transparent clay sample was manufactured at last.
3. Results and Analysis
3.1. Transparency Analysis
To quantify the optical characteristics of transparent materials, a relative transparency (RT) method was introduced in this paper. Target tests with a black background, viewed through transparent materials of different thicknesses (24 mm intervals), were carried out. The test target sign viewed through air and liquid can be seen in Figure 2. A camera (Canon 550D) with 18 million effective pixels within a 50 cm distance was used to photograph the figures through the target layout with transparent materials of different thickness. Pixel intensities (I, grayscale intensity values for black and white, = 0 and 255, respectively) could be obtained for each photo and each window of one photo. The figure at 0 distance was used as a reference map, and the transparency of the test target was analyzed, thus reflecting the transparency level of transparent materials. As shown in Figure 3, the RT values of transparent materials can be calculated as
where RT is the relative transparency, Ii (i ≥ 0) is the pixel intensity of the test target at various depths of transparent materials, I0 is the first pixel intensity of the test target placed in air (0 mm depth in transparent materials), and A0 is the pixel intensity of transparent soil.
To confirm the superior transparency of the new transparent clay, a comparative test was performed based on the MTF method [6]. The target was defined by the spatial frequency (number of black-and-white areas) referred to as line pairs per millimeter (lp/mm) (Figure 3). The MTF was defined as follows:
where Imax(I) and Imin(I) are the maximum and minimum intensity of an actual object with a repeating structure having a maximum and minimum intensity Imax(o) and Imin(o), respectively. At low spatial frequencies, the modulation is close to 1 and generally decreases as the spatial frequency increases until it reaches zero.
The pixel intensity distribution for the test target at a 50 mm depth in different transparent materials is shown in Figure 4. It shows that the black test target in this new transparent clay (manufactured using Carbopol® UltrezTM 10) was closer to the test target pixel intensity in air (I0) than other transparent materials, which indicates better optical transparency properties.
The thickness of transparent soil has a significant effect on the transparency. Therefore, thicknesses of 50, 100, 150, and 200 mm for a 0.75% mixture of U10 powder were used to calibrate the transparency, The RT values of five different transparent materials versus soil thickness are shown in Figure 5, in which the signs viewed through 50 mm thickness of different transparent materials are shown on the right of the figure. The results indicated that the transparent clay manufactured using U10 has superior transparency compared with other materials and has slightly higher transparency than the fumed silica aggregate, which is a good material used to simulate natural sand. The comparative MTF values versus soil thickness and spatial frequency for the new transparent clay are shown in Figure 6. Targets of 0.02, 0.04, 0.25, and 0.50 lp/mm were used in the transparency calibration. The results indicated that the MTF values of U10 show a linear decrease versus the soil thickness, which means a linear decrease in transparency with an increasing in the sample thickness. The transparency decreased by 17% with each increase of 50 mm measured by the MTF method.
3.2. Thixotropy Analysis
A series of laboratory vane shear tests were performed to investigate the following properties of the transparent clay: the increase in strength with time (thixotropy), sensitivity, and measured strength with consolidation after vane insertion. The laboratory vane shear device used in this paper was a portable (PS-VST-P) four-blade, 50.8 × 101.6 mm2 vane with a rod diameter of 10 mm. The measurement range of the vane shear apparatus was approximately 0~8.125 kPa.
Synthetic transparent clay with a 0.75% initial U10 mixture was manufactured in a 100 × 100 × 150 mm3 cube and allowed to set or self-weight-consolidate for 6~336 h. Laboratory vane tests were conducted, where the top of the vane was at a depth of 25 mm below the surface. The onset of static holding was defined as the moment when the specimen was taken out of the vacuum environment [14]. The sample with a 0.75% initial U10 mixture exhibited an increase in the peak undrained shear strength, which was measured by the laboratory vane, Su,peak, with increasing time, as shown in Figure 7, which is similar to the strength growth law of natural clay [15]. The average peak shear strength of samples undergoing self-weight consolidation for 7 days was 0.28 kPa for the 0.75% mixture. The shear strength of transparent clay was close to that of Harbod mud at liquid consistency [14]. This observation indicates that with self-consolidation alone, the transparent clay remains soft for an approximate 120 mm high sample size. The average peak strength of samples undergoing self-weight consolidation for 14 days was 0.3 kPa. Therefore, a 7-day setting time was used for testing due to the relatively small increase in the undrained shear strength during a further 7 days, similar to the transparent clay manufactured using Laponite RD [9].
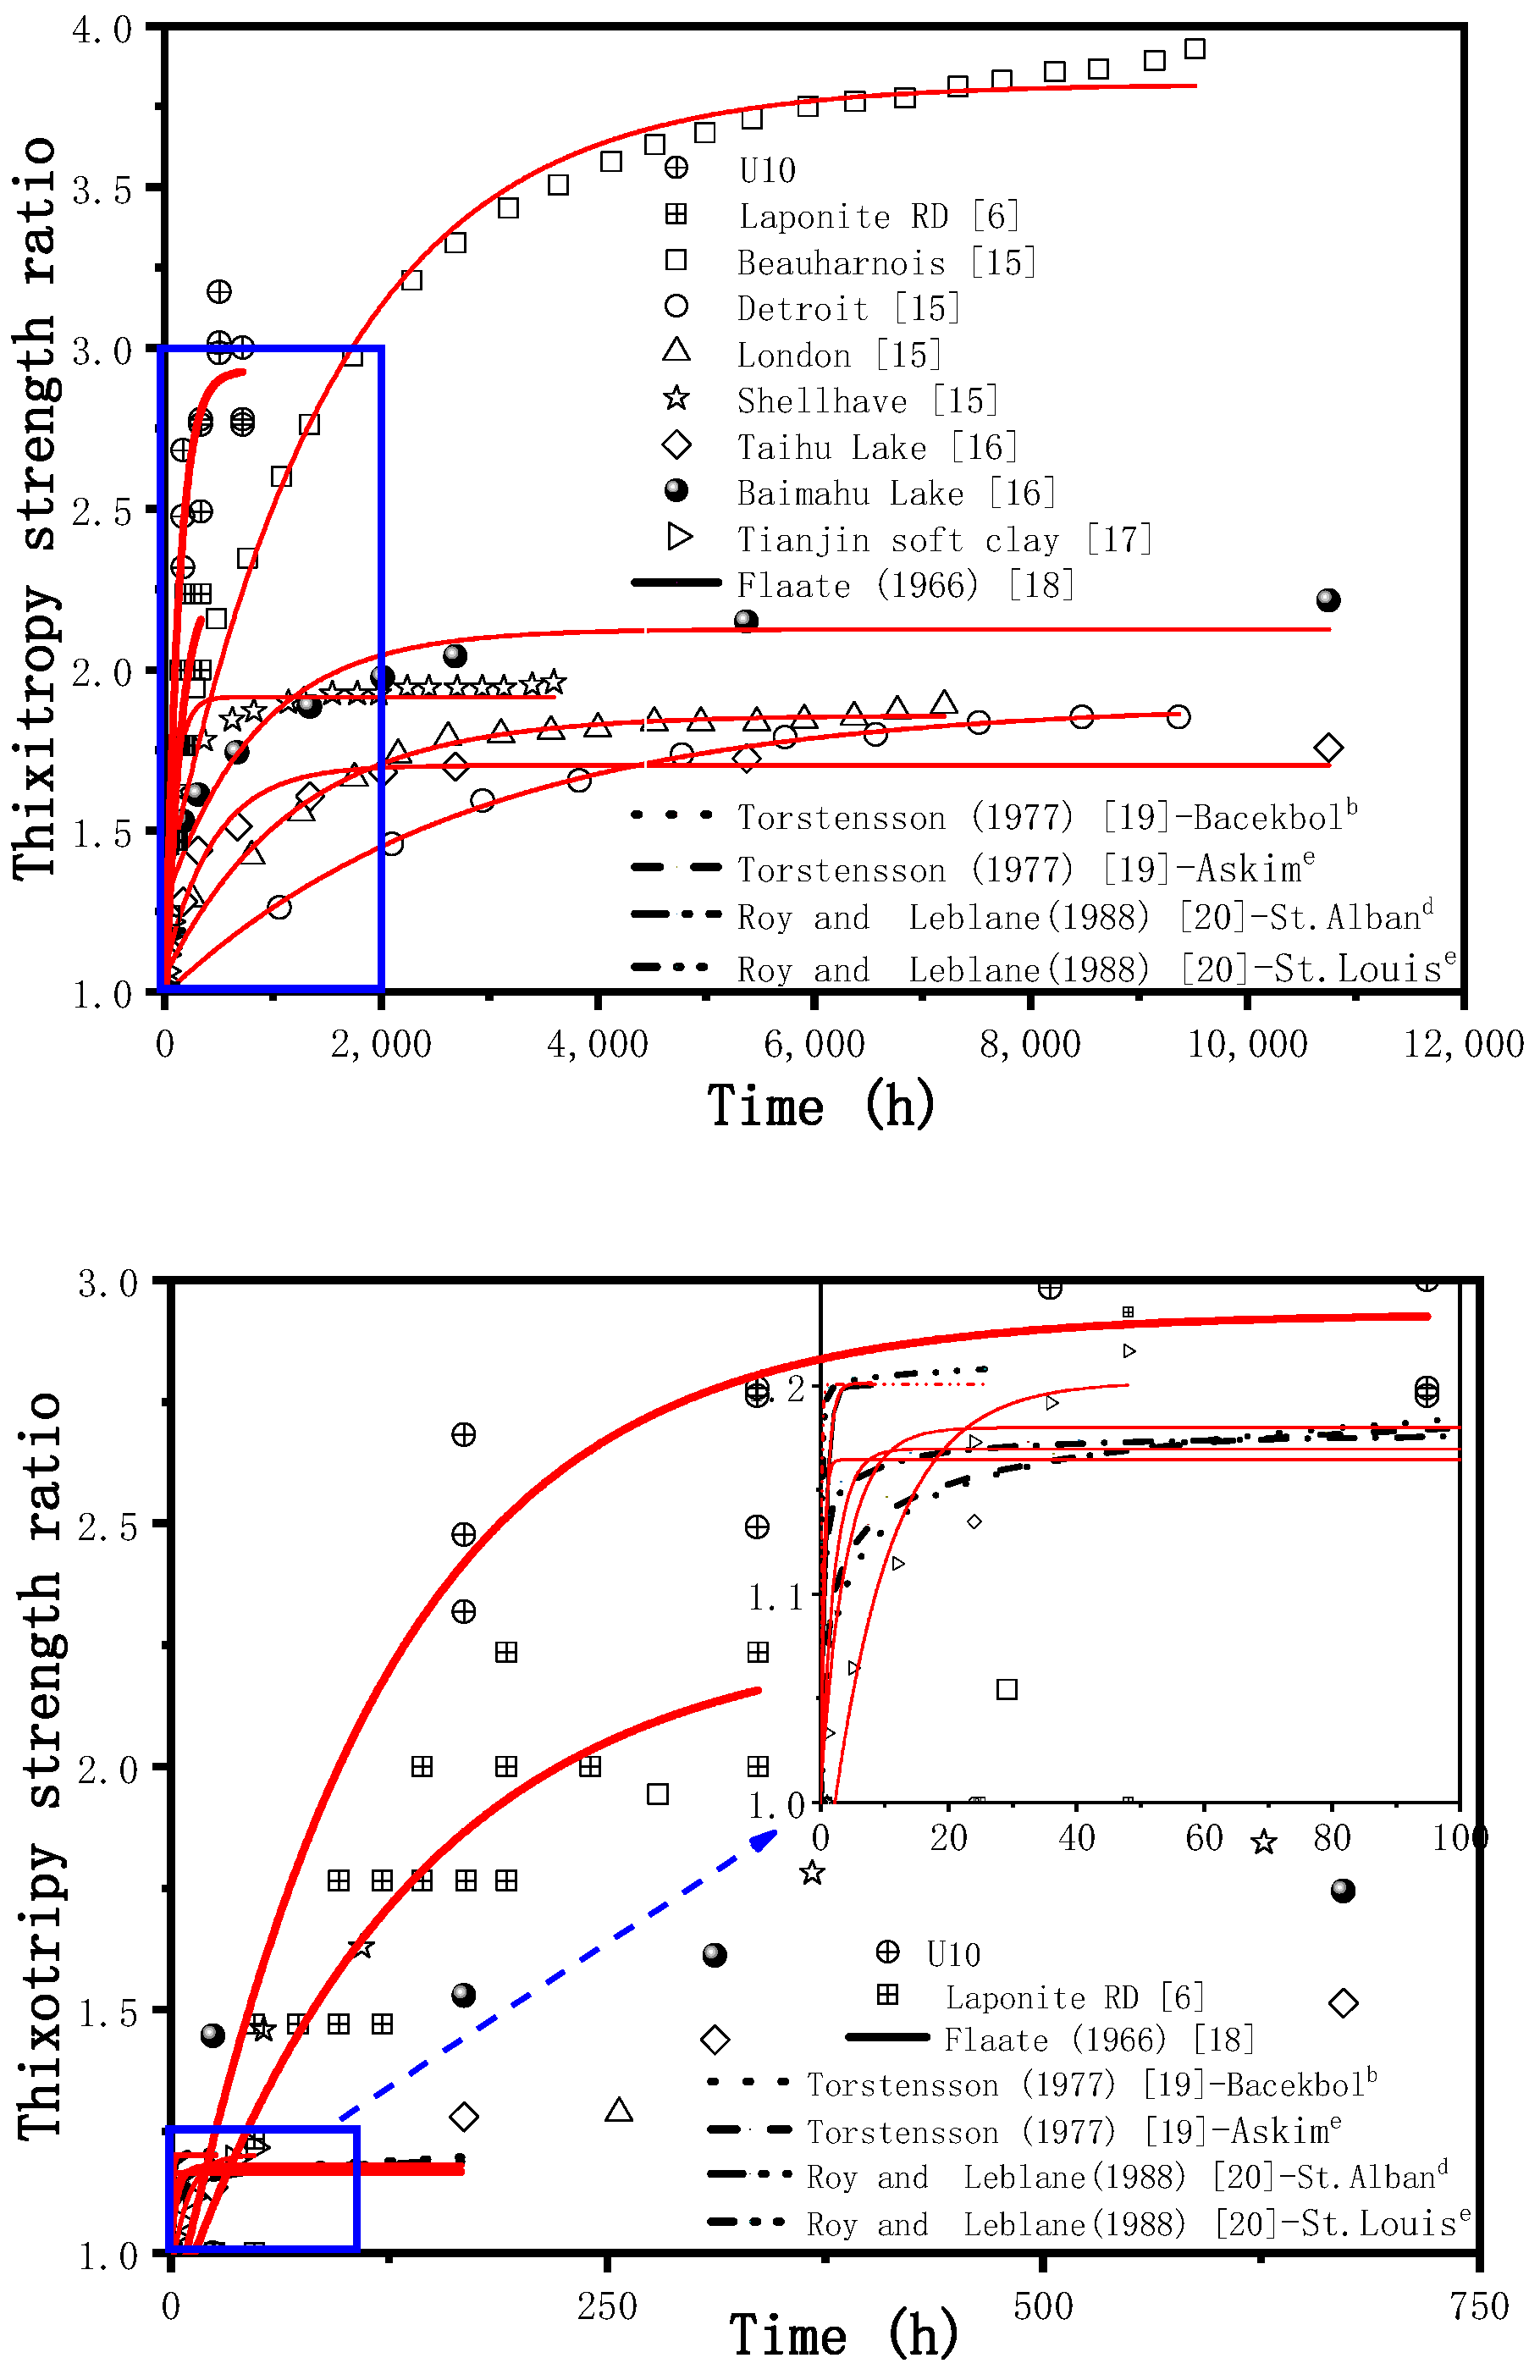
The thixotropy strength ratio of the synthetic clay (0.75% mixture), Su,peak/Suo (original undrained shear strength, Suo), in comparison with other natural clays, is shown in Figure 8 and Figure 9. Figure 8 shows the thixotropy strength ratio change versus logarithmic time. The thixotropy strength ratio changes for U10 and natural clay present the characteristics of a function curve. Results indicated a similar strength-increasing trend between the synthetic clay (made using U10) and natural ones. The change trend in thixotropy versus time can be described by a first-order exponential function for clay, as shown in Figure 9, in comparison with several natural clays, including Beauharnnois, Detroit, London, and Shellhave clays [15]; Taihu Lake- and BaiMahu Lake-dredged slurries [16]; Tianjin soft clay [17]; and other clays [18,19,20]. The fitting results are shown in Table 1, which indicates that the transparent clay manufactured using U10 has similar thixotropic properties.
The sensitivity of soil is an indication of the reduction in shear strength of the soil when disturbed, e.g., when it is remolded or when it is subjected to monotonic or cyclic loading. Soil sensitivity is defined as the ratio of the undrained shear strength of undisturbed soil to the undrained shear strength of the remolded soil at the same water content, i.e., St = Su/Sur (where Su and Sur are the undisturbed and remolded undrained shear strengths, respectively). The ratio of the peak undisturbed strength to the remolded strength, as determined by the unconfined compression test, was used initially by Terzaghi as a quantitative assessment of sensitivity. However, the strength of some clays is so low that unconfined compression test specimens cannot be used. Therefore, the laboratory vane shear test was used in this work. The remolded shear strength was measured by manual rotation after obtaining the peak shear strength and performing an additional laboratory test. Figure 10 shows the peak strength and residual strength change versus time, while the corresponding change in sensitivity with time is shown below. The peak strength increased first and then decreased versus time, and the residual strength change versus time was steady. The sensitivity versus time of the synthetic transparent clay could also be fitted by an exponential function, similar to the natural clays (e.g., layer no. 4 soft clay in Shanghai). The sensitivity of the synthetic transparent clay ranged from low to medium. Nevertheless, synthetic clay belongs to the low-sensitivity category in other classification standards [21], as shown in Figure 11.
4. Conclusions
One new transparent clay manufactured using Carbopol® Ultrez™ 10 (referred to as U10) and its manufacturing processes were introduced. The main conclusions drawn from this paper are as follows:
- (1)
- The transparency of the new transparent clay manufactured using U10 was quantified by RT and MTF methods. The transparency of this new transparent clay was measured and compared with four traditional transparent materials (fumed silica aggregate, Aquabeads, fused quartz, and crushed Pyrex glass). The transparency of the transparent clay introduced in this paper was obviously better than the majority of natural clays in RT analysis. Furthermore, the transparency decreased by 17% with each increase of 50 mm measured by the MTF method.
- (2)
- The peak strength of the synthetic transparent clay (0.75% U10 mixture) by the laboratory vane shear test during 7 days measured 0.26 to 0.30 kPa, which is within the range of that of Harbor mud at liquid consistency (0.25~0.43 kPa, after [16]).
- (3)
- The obvious thixotropy occurrence is quite consistent with natural clay. The exponential function was used to describe the change trend in thixotropy with time for the transparent clay and other natural clays. Results indicated a similar development trend between the synthetic clay and the natural ones. In addition, the synthetic transparent clay could be categorized into low–middle-sensitivity clay with a sensitivity of 2.8~3.4. The results indicated that with higher optical transparency and similarity of thixotropy and sensitivity between U10 and natural clays, Carbopol® UltrezTM 10 shows good potential for future development for transparent clay.
Author Contributions
Data curation, Y.Z.; Formal analysis, Z.S.; Methodology, Y.Z.; Resources, H.X.; Validation, Y.S.; Writing—original draft, Z.S.; Writing—review & editing, G.K. All authors have read and agreed to the published version of the manuscript.
Funding
This research received no external funding.
Institutional Review Board Statement
Not applicable.
Informed Consent Statement
Not applicable.
Data Availability Statement
Not applicable.
Conflicts of Interest
The authors declare no conflict of interest.
References
- Iskander, M.; Bathurst, R.J.; Omidvar, M. Past, present, and future of transparent soils. Geotech. Test. J. 2015, 38, 557–573. [Google Scholar] [CrossRef]
- Ganiyu, A.A.; Rashid, A.S.A.; Osman, M.H. Utilisation of transparent synthetic soil surrogates in geotechnical physical models: A review. J. Rock Mech. Geotech. Eng. 2016, 8, 568–576. [Google Scholar] [CrossRef] [Green Version]
- Zhao, H.; Ge, L. Investigation on the shear moduli and damping ratios of silica gel. Granular Matter 2014, 16, 449–456. [Google Scholar] [CrossRef]
- Guzman, I.L.; Iskander, M.; Suescun-Florez, E.; Omidvar, M.A. Transparent aqueous-saturated sand surrogate for use in physical modeling. Acta Geotech. 2014, 9, 187–206. [Google Scholar] [CrossRef]
- Kong, G.Q.; Zhou, L.D.; Wang, Z.T.; Yang, G.; LI, H. Shear modulus and damping ratios of transparent soil manufactured by fused quartz. Mater. Lett. 2016, 182, 257–259. [Google Scholar] [CrossRef] [Green Version]
- Black, J.A.; Take, W.A. Quantification of optical clarity of transparent soil using the modulation transfer function. Geotech. Test. J. 2015, 38, 588–602. [Google Scholar] [CrossRef]
- Chini, C.M.; Wallace, J.F.; Rutherford, C.J.; Peschel, J.M. Shearing failure visualization via particle tracking in soft clay using a transparent soil. Geotech. Test. J. 2015, 38, 708–724. [Google Scholar] [CrossRef]
- Ding, X.H.; Zhou, W.; Lu, X.; Gao, Y. Physical simulation test of soil-rock mixture from synthetic transparent soil. J. Cent. South Univ. 2018, 25, 3085–3097. [Google Scholar] [CrossRef]
- Wallce, J.F.; Rutherford, C.J. Geotechnical properties of Laponite RD. Geotech. Test. J. 2015, 38, 574–587. [Google Scholar] [CrossRef]
- Cao, Z.H.; Liu, H.L.; Kong, G.Q.; Zhou, H. Physical modeling of pipe piles under oblique pullout loads using transparent soil and particle image velocimetry. J. Cent. South Univ. 2015, 22, 4329–4336. [Google Scholar] [CrossRef]
- Lei, H.Y.; Liu, Y.N.; Zhai, S.B.; Tu, C.K.; Liu, M. Visibility and mechanical properties of transparent clay. Chin. J. Geotech. Eng. 2019, 41, 53–56. (In Chinese) [Google Scholar]
- Fresno, M.J.C.; Ramirez, A.D.; Jimenez, M.M. Systematic study of the flow behaviour and mechanical properties of Carbopol® Ultrez™ 10 hydroalcoholic gels. Eur. J. Pharm. Biopharm. 2002, 54, 329–335. [Google Scholar] [CrossRef]
- Kong, G.Q.; Cao, Z.H.; Zhou, H.; Sun, X.J. Analysis of piles under oblique pullout load using transparent soil models. Geotech. Test. J. 2015, 38, 725–738. [Google Scholar] [CrossRef]
- Schlue, B.F.; Moerz, T.; Kreiter, S. Influence of shear rate on undrained vane shear strength of organic harbor mud. J. Geotech. Geoenviron. Eng. 2010, 136, 1437–1447. [Google Scholar] [CrossRef] [Green Version]
- Moretto, O. Effect of natural hardening on the unconfined compression strength of remoulded clays. In Proceedings of the 2nd International Conference on Soil Mechanics and Foundation Engineering, Rotterdam, The Netherlands, 21–30 June 1948; Volume 1, pp. 137–144. [Google Scholar]
- Wang, L.; Cao, L.L.; Li, L. Vane shear tests on thixotropy of Taihu lake and BaiMahu lake dredged slurries. J. Eng. Geol. 2015, 23, 548–553. (In Chinese) [Google Scholar]
- Huo, H.F.; Qi, L.; Lei, H.Y.; Yu, G. Analysis and experimental study on thixotropy of Tianjin soft clay. Chin. J. Rock Mech. Eng. 2016, 35, 631–637. [Google Scholar]
- Flaate, K. Factors influencing the results of vane tests. Can. Geotechn. J. 1966, 3, 18–31. [Google Scholar] [CrossRef]
- Torstensson, B.A. Time-dependent effects in the field vane test. In Proceedings of the International Symposium on Soft Clay, Bangkok, Thailand, 5–6 July1977; Asian Institute of Technology: Bangkok, Thailand, 1977; pp. 387–397. [Google Scholar]
- Roy, M.; Leblanc, A. Factors affecting the measurements and interpretation of the vane strength in soft sensitive clays. In Vane Shear Strength Testing in Soils: Field and Laboratory Studies; ASTM International: West Conshohocken, PA, USA, 1988. [Google Scholar]
- Abuhajar, O.; El-Naggar, M.H.; Newson, T. Review of available methods for evaluation of soil sensitivity for seismic design. In Proceedings of the Fifth International Conference on Recent Advances in Geotechnical Earthquake Engineering and Soil Dynamics, San Diego, CA, USA, 1 January 2010. [Google Scholar]
Figure 1.
Photos of Carbopol® Ultrez 10 polymer material: (a) powder, (b) SEM images, (c) 17-cm-thick transparent clay, and (d) speckle pattern.
Figure 1.
Photos of Carbopol® Ultrez 10 polymer material: (a) powder, (b) SEM images, (c) 17-cm-thick transparent clay, and (d) speckle pattern.

Figure 2.
Sign viewed through different thicknesses of transparent material (e.g., fused quartz).

Figure 3.
Calculation diagram: a-RT and MTF methods.

Figure 4.
Pixel intensity frequency of the test target in a transparent medium of 50 mm thickness.

Figure 5.
Transparency of materials versus soil thickness by the RT method.

Figure 6.
Transparency of materials versus soil thickness and spatial frequency by the MTF method.

Figure 7.
Peak undrained shear strength measured by the laboratory vane shear test for a 0.75% initial mixture.
Figure 7.
Peak undrained shear strength measured by the laboratory vane shear test for a 0.75% initial mixture.

Figure 8.
Thixotropy strength ratio for the synthetic transparent clay of a 0.75% initial mixture.

Figure 9.
Thixotropy strength ratio for the synthetic transparent clay compared with natural clays.

Figure 10.
Sensitivity measured by the laboratory vane shear test: peak and residual strength, and sensitivity versus time.
Figure 10.
Sensitivity measured by the laboratory vane shear test: peak and residual strength, and sensitivity versus time.

Figure 11.
Classification of sensitivity.


Table 1.
Summary of relationships between thixotropic ratio and time.
| Clay | Time/h | su/suo = Ae(−t/t1) + B | R2 |
|---|---|---|---|
| Beauharnois [15] | 0–10,000 | =−2.51 e(−t/1547.77) + 3.82 | 0.981 |
| Detroit [15] | 0–10,000 | =−0.90 e(−t/2825.81) + 1.90 | 0.998 |
| London [15] | 0–7200 | =−0.81 e(−t/1190.08) + 1.86 | 0.985 |
| Shellhave [15] | 0–3600 | =−0.90 e(−t/90.37) + 1.91 | 0.964 |
| Taihu Lake [16] | 0–10,000 | =−0.64 e(−t/450.16) + 1.70 | 0.962 |
| Baima Lake [16] | 0–10,000 | =−0.86 e(−t/849.02) + 2.12 | 0.862 |
| Tianjin coastal clay [17] | 0–48 | =−0.26 e(−t/9.30) + 1.20 | 0.900 |
| Flaate [18] | 0–8 | =−0.21 e(−t/0.80) + 1.20 | 0.998 |
| Bacebol [19] | 0–167 | =−0.173 e(−t/2.20) + 1.18 | 0.957 |
| Askim [19] | 0–167 | =−0.165 e(−t/2.20) + 1.17 | 0.966 |
| St. Alban [20] | 0–167 | =−0.156 e(−t/0.45) + 1.16 | 0.970 |
| St. Louis [20] | 0–26 | =−0.200 e(−t/0.17) + 1.20 | 0.993 |
| Laponite RD [6] | 0–320 | =−0.409 e(−t/136.66) + 2.27 | 0.815 |
| U10 (this paper) | 0–720 | =−2.080 e(−t/119.78) + 2.93 | 0.920 |
Publisher’s Note: MDPI stays neutral with regard to jurisdictional claims in published maps and institutional affiliations. |
© 2021 by the authors. Licensee MDPI, Basel, Switzerland. This article is an open access article distributed under the terms and conditions of the Creative Commons Attribution (CC BY) license (https://creativecommons.org/licenses/by/4.0/).
Share and Cite
MDPI and ACS Style
Sun, Z.; Kong, G.; Zhou, Y.; Shen, Y.; Xiao, H. Thixotropy of a Transparent Clay Manufactured Using Carbopol to Simulate Marine Soil. J. Mar. Sci. Eng. 2021, 9, 738. https://0-doi-org.brum.beds.ac.uk/10.3390/jmse9070738
AMA Style
Sun Z, Kong G, Zhou Y, Shen Y, Xiao H. Thixotropy of a Transparent Clay Manufactured Using Carbopol to Simulate Marine Soil. Journal of Marine Science and Engineering. 2021; 9(7):738. https://0-doi-org.brum.beds.ac.uk/10.3390/jmse9070738
Chicago/Turabian StyleSun, Zhiwen, Gangqiang Kong, Yang Zhou, Yang Shen, and Hanyu Xiao. 2021. "Thixotropy of a Transparent Clay Manufactured Using Carbopol to Simulate Marine Soil" Journal of Marine Science and Engineering 9, no. 7: 738. https://0-doi-org.brum.beds.ac.uk/10.3390/jmse9070738
Note that from the first issue of 2016, this journal uses article numbers instead of page numbers. See further details here.