1. Introduction
Monitoring the marine environment plays a key role to understand the complex eco-systems that directly impact climate and human activities. The development of innovative, compact, and low-power sensors, coupled with the need for understanding the impact of climate changes that have characterized the past few decades, has modified the way oceans are monitored. Great efforts have been made to deploy fixed or mobile platforms that can ensure simultaneous measurements of multiple parameters (atmospheric, physical, chemical, and biological) on long-term with high temporal resolution and quality [
1,
2,
3,
4].
Although all over the world more than 1300 observing systems and 1400 floats are currently operational at sea, oceans are still under-sampled [
5]. At the European level, several recent initiatives carried out by intergovernmental bodies put emphasis on the risks and losses linked with insufficient and not sustained ocean observations and data collection [
6].
Nowadays, the common priority for all existing networks of observing systems, monitoring strategies, and development of innovative sensors is therefore to create mechanisms and technologies such that data has greater societal and scientific value, and the overall life cycle cost of sensors and observing systems is reduced [
7,
8,
9].
In this context, one of the most demanding challenges is the high cost of data transmission from sea platforms to shore conducted through the use of either high-power consuming traditional satellite communication or short-range local base stations. The former approach is not viable for battery-powered devices, whereas the latter is costly as it requires physically connecting to the local base station for data transmission [
10]. Both radio systems and cellular terrestrial networks have been widely used to build and support networks of remote marine sensors: for example, Worldwide Interoperability for Microwave Access (WiMAX) is used for areas not under satellite coverage [
11,
12]. A combination of WiMAX, Long-Term Evolution (LTE), and Very High Frequency (VHF) have been proposed to build Wireless Coastal Area Networks (WiCAN). GSM and GPRS-based systems have been used to facilitate the monitoring of vessels and their surrounding environment. However, most of these technologies are costly and power-consuming solutions, hence not suitable for power-limited devices [
13].
One of the most attractive technologies relying on radio coverage over open areas and requiring very low energy consumption is the so-called Low-Power Wide Area (LPWA) network. This is gaining momentum as a good solution to provide machine-to-machine connectivity in rural and urban contexts [
14,
15].
LPWA networks were designed to allow long-range communications for the Internet of Things (IoT) [
16] based on the interaction and the exchange of data between heterogeneous objects through a layered architecture. The development of an ICT platform compliant with the concept of IoT to be applied in the marine environment involves the design of a two-way communication supporting the use of adaptive network topologies able to modify their operation in terms of sampling strategy or extension of the area to be controlled, depending on changes in the environment. Indeed, in marine applications, IoT systems have to be conceived by exploiting heterogeneous sensors equipped with intelligence and interconnected with each other through LPWA, able to widely distribute information [
17,
18].
In the last decade, different LPWA solutions have been proposed, and, in some cases, they have been applied to the marine domain for specific in-situ experiments [
10,
19,
20,
21]. For particularly remote areas or harsh environments, such as the polar basins, the use of satellite IoT communications is promising, and there is a growing trend of integrating IoT devices with low cost and low power consumption satellite technologies [
22,
23]. Satellite IoT technologies can overcome the limited coverage of terrestrial LPWANs: they are not affected by terrain conformation and show destruction resistance, but require specific antennas and proprietary protocols, although a strong effort is put in including innovative specifications for LPWANs suitable also for satellites in terms of multiple access to the channel, latency, collision avoidance, and, more in general, of throughput and service quality.
One of the key factors for the use of LPWA networks for marine purposes is to extend their capacity to provide new technological solutions, including hardware, software, and middleware parts, to be applied to platforms and sensors for broad-spectrum marine monitoring. This can support a rapid use of information, and provide innovative services on a basin scale, such as the assessment of water quality or the control of vessels in delimited areas with particular restrictions to navigation (i.e., marine protected areas and off-limits zone). To this aim, some tests have been carried out exploiting the intrinsic capability of Long Range (LoRa) technology to provide reliable communication over the sea for a few miles [
24,
25,
26,
27].
A complete LPWA network infrastructure exploiting LoRa transmission technology is presented for the remote monitoring of the sea at a large scale. It was set up to fulfill the objectives of the project entitled “IoT Technologies for the marine environment”, a strategic research and development action, funded by the Liguria Region, Italy. This network, has been developed with three specific aims: (1) to track pleasure and lightweight boats not equipped with the Automatic Identification System (AIS) in coastal areas with particular restriction to navigation by means of LoRa compliant GPS; (2) to exploit the possibility to use autonomous IoT environmental sensors for monitoring purposes onboard vessels or stand-alone; (3) to verify the use of LoRa for data transmission from existing marine observatories moored offshore in the open ocean.
The network performance has been evaluated in operational condition tracking the path of a passenger vessel on which IoT end-nodes have been installed and during a research cruise that took place in the Northwestern Mediterranean Sea in October 2020. Using the developed LoRa network it was possible to track the path of a boat equipped with GPS-IoT end-nodes close to the coast using multiple gateways operating simultaneously on land and to demonstrate the feasibility to transmit meteorological and oceanographic data by means of IoT end-nodes deployed at sea and installed on an existing observatory up to 100 km far from the coast.
In
Section 2 methods and experimental setup are presented, in
Section 3 the results and the discussion are provided, whereas
Section 4 summarizes the main findings.
2. Material and Methods
2.1. LoRa and LoRaWAN
Among the operational LPWA network technologies, the LoRa solution provides the best technology for the implementation of private IoT networks that can be implemented ad-hoc without the need for using proprietary licenses, with the possibility of using three classes of devices to guarantee efficient energy management depending on the area of application and to allow resilience to interference [
28].
LoRa technology uses frequencies of the sub-GHz band (nominally 868 MHz for Europe), minimizing the attenuation due to obstacles, and employs a robust modulation that allows the use of receivers with very low sensitivity (
Rxsens) of the order of −140 dBm. This value represents the known minimum power to obtain a reliable transmission, and it can be calculated through the following equation:
where
BW is the bandwidth (kHz),
NF is the noise factor (dB), and
SNR is the signal to noise ratio (dB).
Under the hypothesis of free space, the simplest model to estimate the power of the LoRa packet received at the gateway is based on the following Friis transmission equation:
where
Txpower is the transmitted power (dB),
Pathloss is the free space power loss due to the channel (dB), and
GTx and
GRx are the antenna gain in transmission and reception (dBi), respectively. Often, the received power at the gateway is indicated as Received Strength Signal Indicator (
RSSI), also.
The simplest model to estimate the
Pathloss term in free space is the log-distance path model through the following equation:
where
d represents the distance between the transmitter and the receiver (meters), and
f is the frequency effectively used for transmission (Hz).
A more accurate model that can be applied to the wireless communication system for microwave radio links in the frequency band up to 1500 MHz and for distance up to 100 km is the Hata model [
29]. For environments without obstacles the
Pathloss can be estimated using the following approximation:
where
hB is the altitude of the base station antenna (meters) and
CH represents the antenna height correction factor. An approximation of the value of
CH for a semi-urban environment, such as the one in which the experiment was performed, can be expressed by the following equation:
where
hM is the altitude of the node antenna (meters).
In presence of radio path over semi-urban environment the expression of
Pathloss for the Hata model changes as shown in the following equation:
The European Conference of Postal and Telecommunications through the recommendation ERC-REC-70-3E establishes a maximum transmission power of 25 mW (14 dBm) for uplink message and of 0.5 W (27 dBm) for downlink, and a maximum allowed antenna gain of 2.15 dBi. Furthermore, the proportion of time during which an IoT device can be operated, commonly defined as duty cycle, has to be limited to 0.1% and 1% per day depending on the channel used [
30].
The physical layer of a LoRa transmission is based on the Chirp Spread Spectrum (CSS) modulation, which is also used for radar applications, and it is characterized by a signal that varies its frequency by increasing (up-chirp) or decreasing (down-chirp) in the time taking the whole band to transmit the signal. The parameters that characterize CSS modulation are the band used (
BW, kHz), the Spreading Factor (
SF, variable from 6 to 12) that is the number of bits encoded per chirp, and the encoding network (
CR, variable from 1 to 4 depending on the code rate chosen among 4/5, 4/6, 4/7 and 4/8) that indicates the redundancy applied to the data. These factors affect the bit rate (
BR) of the LoRa transmission through the following equation:
Depending on the specific application, it is necessary to choose the best combination of the various parameters considering that an increase in the data rate corresponds to a reduction in SF and that an increase in reliability leads to an increase in SF and a consequent higher SNR.
The format of a LoRa transmission is encoded in the following parts: (1) preamble, consisting of 8 up-chirps covering the entire band, the last two of which represent the synchronization word (sync word) necessary to distinguish the different network nodes using the channel as a shared resource; (2) synchronization symbols, including two down-chirps and a quarter of down-chirps for a duration of about 2.25 symbols that allow time synchronization; (3) header (
H), that is an optional field and it is transmitted with a code rate of 4/8 and comprises the size of the payload, the code rate used and if the 16-bit Cyclic Redundancy Check (
CRC) control code is enabled; (4) payload (
PL), consisting of a maximum of 255 bytes. The number of symbols (
Rns) that make up the payload can be quantified through the following equation:
where
H is equal to 20 if present or 0 otherwise,
DE is equal to 2 if the data rate optimization algorithm is enabled with
SF greater than 11 or 0 otherwise.
The media access control (MAC) layer communication protocol, defined as LoRaWAN (LoRa Wide Area Network), introduces in the LoRa technology an upper-level layer necessary for the application of geolocation based on the power of the same signal received (RSSI) from multiple gateways or on the measurement of the time difference arrival of the same signal to multiple gateways (TDOA). Specifically, LoRaWAN is an open standard that defines the communication protocol for the LPWA network based on a LoRa chip, that rules the MAC in the link layer based on a pure ALOHA type algorithm.
The use of the LoRaWAN protocol implies that there is no return channel, the access time to the channel is divided into intervals, the first packet at the head of the queue is the one transmitted, and in case of need for a confirmation message (ACK) the end-node can retransmit the data after a random time interval.
The most used topology for LoRaWAN is the star or the star-of-star in which the messages from a single end-node are routed to a central server via a gateway, without multiple hops. Point-to-point communication between the end-node and the gateway is not allowed since the end-nodes transmit regardless of the number of gateways that may receive the packet.
Each gateway that detects a LoRaWAN message forwards the data to the network server associated with it. The management of redundancy detection, security checks, and message scheduling are tasks left to the server. The nodes of the network can communicate simultaneously on the channel as long as they use different frequencies or SFs. This topology makes it possible to facilitate the tracking of resources since the end-node sends data directly to multiple gateways. Hence, there is no need for managing the communication between two gateways, and, moreover, it is possible to manage the problems related to any collisions directly on the central server. Each end-node that is part of the LoRaWAN network is uniquely identified by a 64-bit code (DevEUI) and it is associated with an application also defined by a 64-bit identification code (AppEUI). As soon as an end-node wants to join the LoRaWAN network, it receives from the server a unique 32-bit address shared with the network and the server where the application resides. Moreover, it receives a security key (NwkSKey) consisting of an “Advanced Encryption standard” encryption code (AES) of 128 bits which is shared between the node and the server and guarantees the integrity of messages on the network. Before an effective communication is established between the end-node and the network, the end-node must be activated by means of a key (AppSKey), consisting of 128 AES encrypted bits as well. This is functional to the encryption and decryption of the information content of the node and guarantees the confidentiality of the information.
The request for joining the network from the end-node takes place with SF equals 12, thus implying minimum data transmission speed and higher transmission time interval of the same amount of information. As soon as the acknowledgement that identifies the end-node as belonging to the network is received from the LoRaWAN server, the transmission of information takes place with reduced SFs depending on the noise over the channel and the distance between gateway and node estimated by the server.
The end-node can register to the network using two different methods, called “Over The Air Activation” (OTAA) or “Activation By Personalization” (ABP). The activation via OTAA requires that the end-node transmits a join request to the server containing its DevEUI, the AppEUI, and the AppKey and receives a response from the server containing the address of the sensor (DevAddr), the security network (NwkSKey), and the application security key (AppSkey) required to be part of the network. The activation via ABP does not involve the negotiation phase of the address through join request, since the values of the keys (DevEUI, AppEUI, and AppKey) are previously coded within the end-node itself. This procedure is far less secure than the OTAA method.
2.2. Experimental Set-Up
The layered architecture which has been designed for the specific marine application is constituted of (1) end-nodes, embedded systems, and electronics devoted to collecting and processing the information, and to support the communication; (2) multiple gateways responsible for data handling, message routing, and management of communication between platforms; (3) a server whose duty is data aggregation; (4) a web application that delivers services to end-users.
In-situ tests were carried out using two types of end-nodes: some commercially available sensors such as the Field Test by Adeunis, the LT I/O Controller by Dragino, and some nodes that were developed on purpose. The latter includes three nodes (TIAMO 1, TIAMO 2, TIAMO 3, hereafter) which were developed on the basis of a ST microcontroller belonging to the STM32L4X family and a spectrometric sensor (spectrometer, hereafter) which, combined with advanced dedicated machine learning techniques and supervised identification and regression algorithms [
31,
32], allows the extraction of information for monitoring the quality of marine waters, such as color and the presence of oil on the surface.
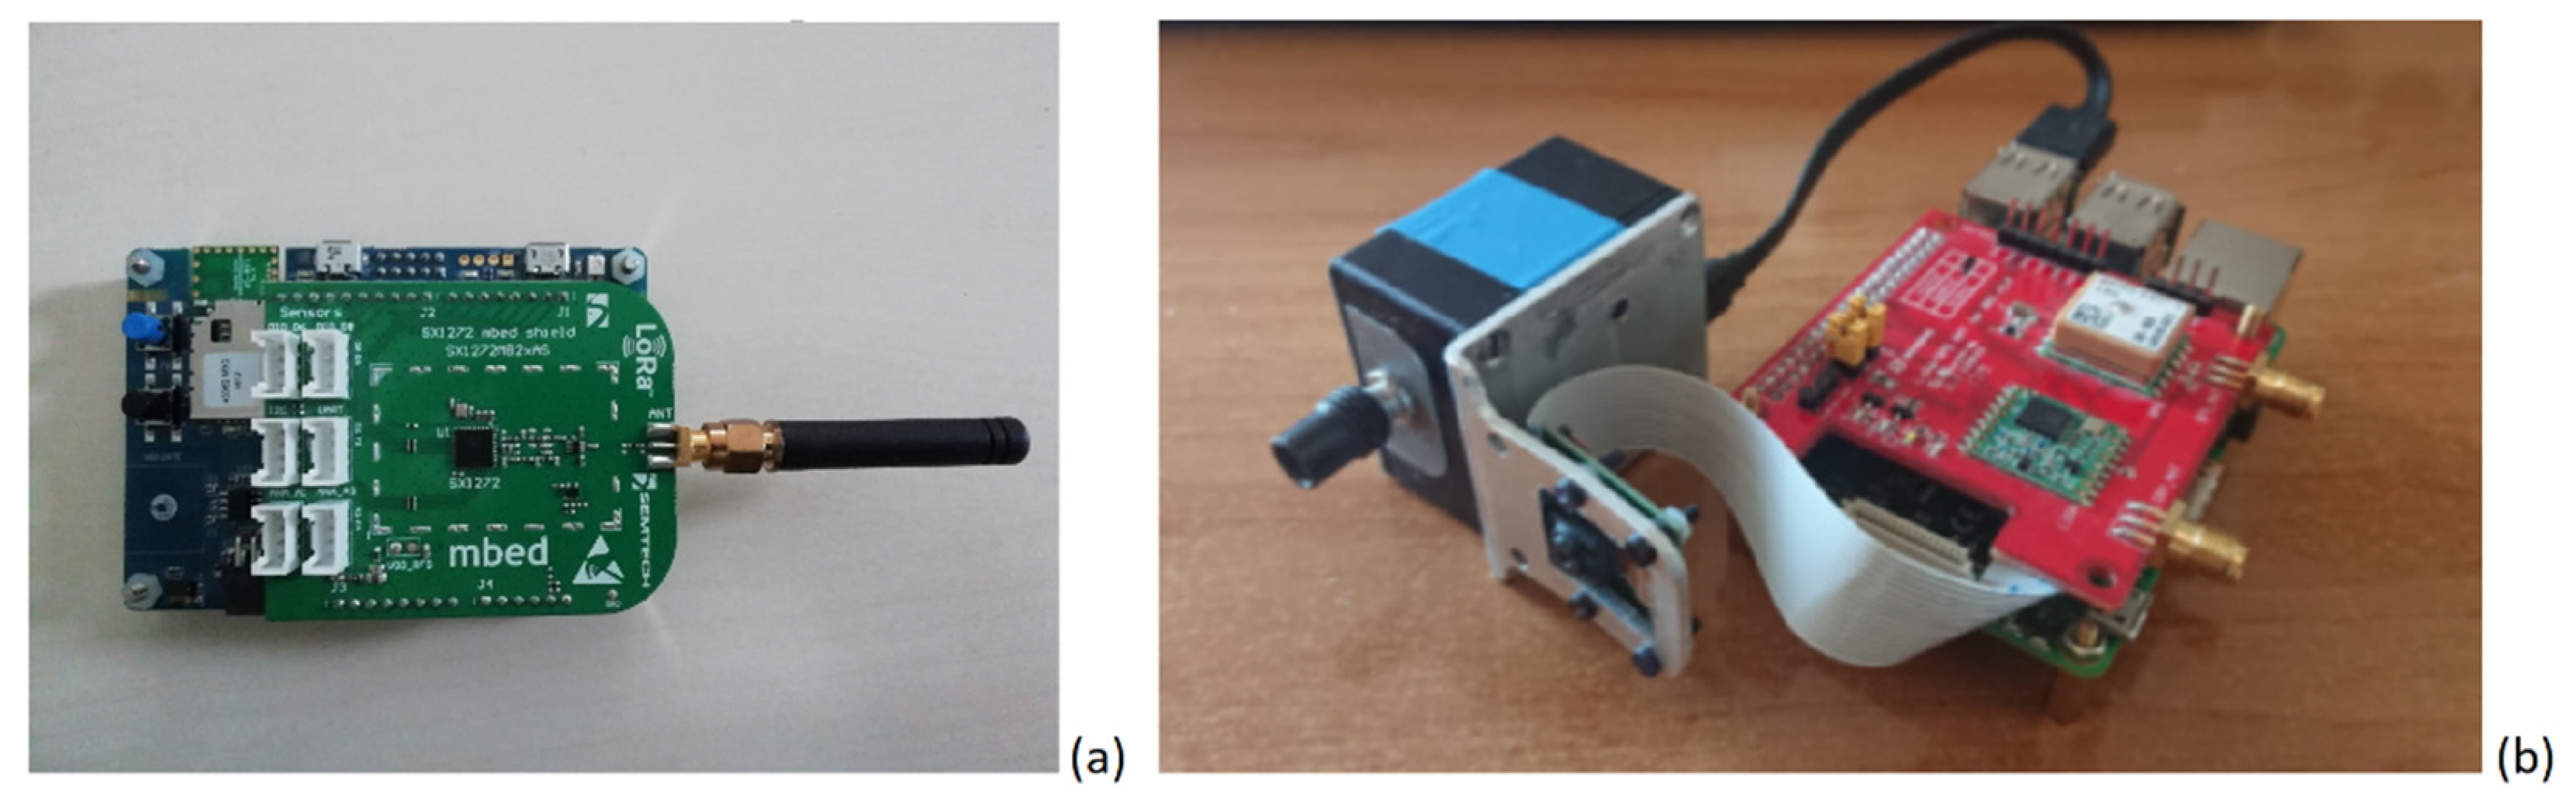
The three TIAMO end-nodes (
Figure 1a) were developed using the STM32CubeMX-Win software v. 5.4.0 by STMicroelectronics (Geneva, Switzerland) for low-level management and the Atollic TrueSTUDIO STM32 v. 9.3.0 by STMicroelectronics (Geneva, Switzerland) for high-level programming. More in detail, the firmware generation takes place through a first definition of the hardware, in which STM32CubeMX manages the definition of the peripherals by generating the low-level code that is imported into Atollic TrueSTUDIO allowing for the development of the board’s operating logic using high-level programming languages (i.e., C, C ++) for the purpose. The three end-nodes were equipped with miniaturized meteorological sensors for collecting temperature, humidity, and atmospheric pressure.
The spectrometer (
Figure 1b) was designed using as sensing element a spectrometer type STS-VIS produced by OceanInsight, working in the visible range (350–800 nm) and thus suitable for the estimation of the concentration of chlorophyll-
a and of suspended sediment even if limited to medium-low concentration levels. The processing unit was constituted of a Raspberry Pi 3B type equipped with a Sony IMX219 8-megapixel CMOS capable of producing static images up to 3280 × 2464 pixels and supporting some video formats (e.g., 1080p30, 720p60, 640 × 480p90). The overall spectrometer includes also a Dragino SX127X GPS HAT board, which is an expansion module for the Raspberry that includes the Semtech SX1276/1278 transceiver and the Quectel L80-M39 GPS receiver. The board connects via the GPIO connector, and it is directly powered by the Raspberry.
Five commercially available gateways (LG308 by Dragino) equipped with GPS and with GSM capability were used to forward the packets via Ethernet to an ad-hoc private LoRaWAN server connected to a backend component which was responsible for processing and storing the data, allowing their monitoring and analysis through the information system. Specifically, the open-source Chirpstack LoRaWAN Network server was configured, and the open-source project Swagger was chosen as the backend.
A web service was implemented for the visualization of the real-time tracks of the vessel equipped with IoT end-nodes to be used as a control center to detect the presence of vessels in a delimited coastal area, such as that belonging to protected marine areas. A data dashboard was implemented for the real-time visualization of marine environmental data and for providing information about the state of sea waters.
During the tests, the LoRaWAN protocol with data rate optimization enabled was used: all the end-nodes were set up to register to the network using OTAA, and all parameters related to the LoRa transmission were available from the employed gateways were archived.
Each node had a different payload size: specifically, for the three TIAMO nodes the length was 12 bytes, for the Field Test it varied from 8 to 24 bytes depending on the presence of the GPS data and if the transmission has been triggered by pressing a pushbutton or not, whereas for LT I/O Controllers and the spectrometer the payload size was fixed to 12 and 21 bytes, respectively.
The evaluation of the LoRa connectivity was performed in two different scenarios: the first one in the coastal area close to the harbor of Genoa; the second one in the Northwestern Mediterranean Sea, a semi-enclosed basin with a peculiar orography, characterized by steep mountains close to the coast. These geographic constraints allow the investigation of the connectivity from the open ocean towards the coast, thus exploiting the feasibility to install gateways on the hills behind the sea in line of sight (LOS), complying with the limit imposed by the Fresnel zone.
During the first test, the passenger vessel for public transport service navigating close to the coast during two crossings from Porto Antico to Pegli and back was used (
Figure 2a). The end-node TIAMO 3 (
Figure 2b), the Field Test, and two LT I/O Controllers (
Figure 2c) were installed on the upper deck of the vessel at about 4 m above the sea level, while the spectrometer (
Figure 2d) was clamped on a pole and put the outboard on the lower deck to monitor sea color from about 2 m above the sea level.
All available gateways were simultaneously operating from 12:30 UTC to 15:30 UTC on land (
Table 1), and the two passages from Porto Antico to Pegli and back had departure time at 13:15 UTC from Porto Antico and at 13:40 UTC from Pegli, respectively.
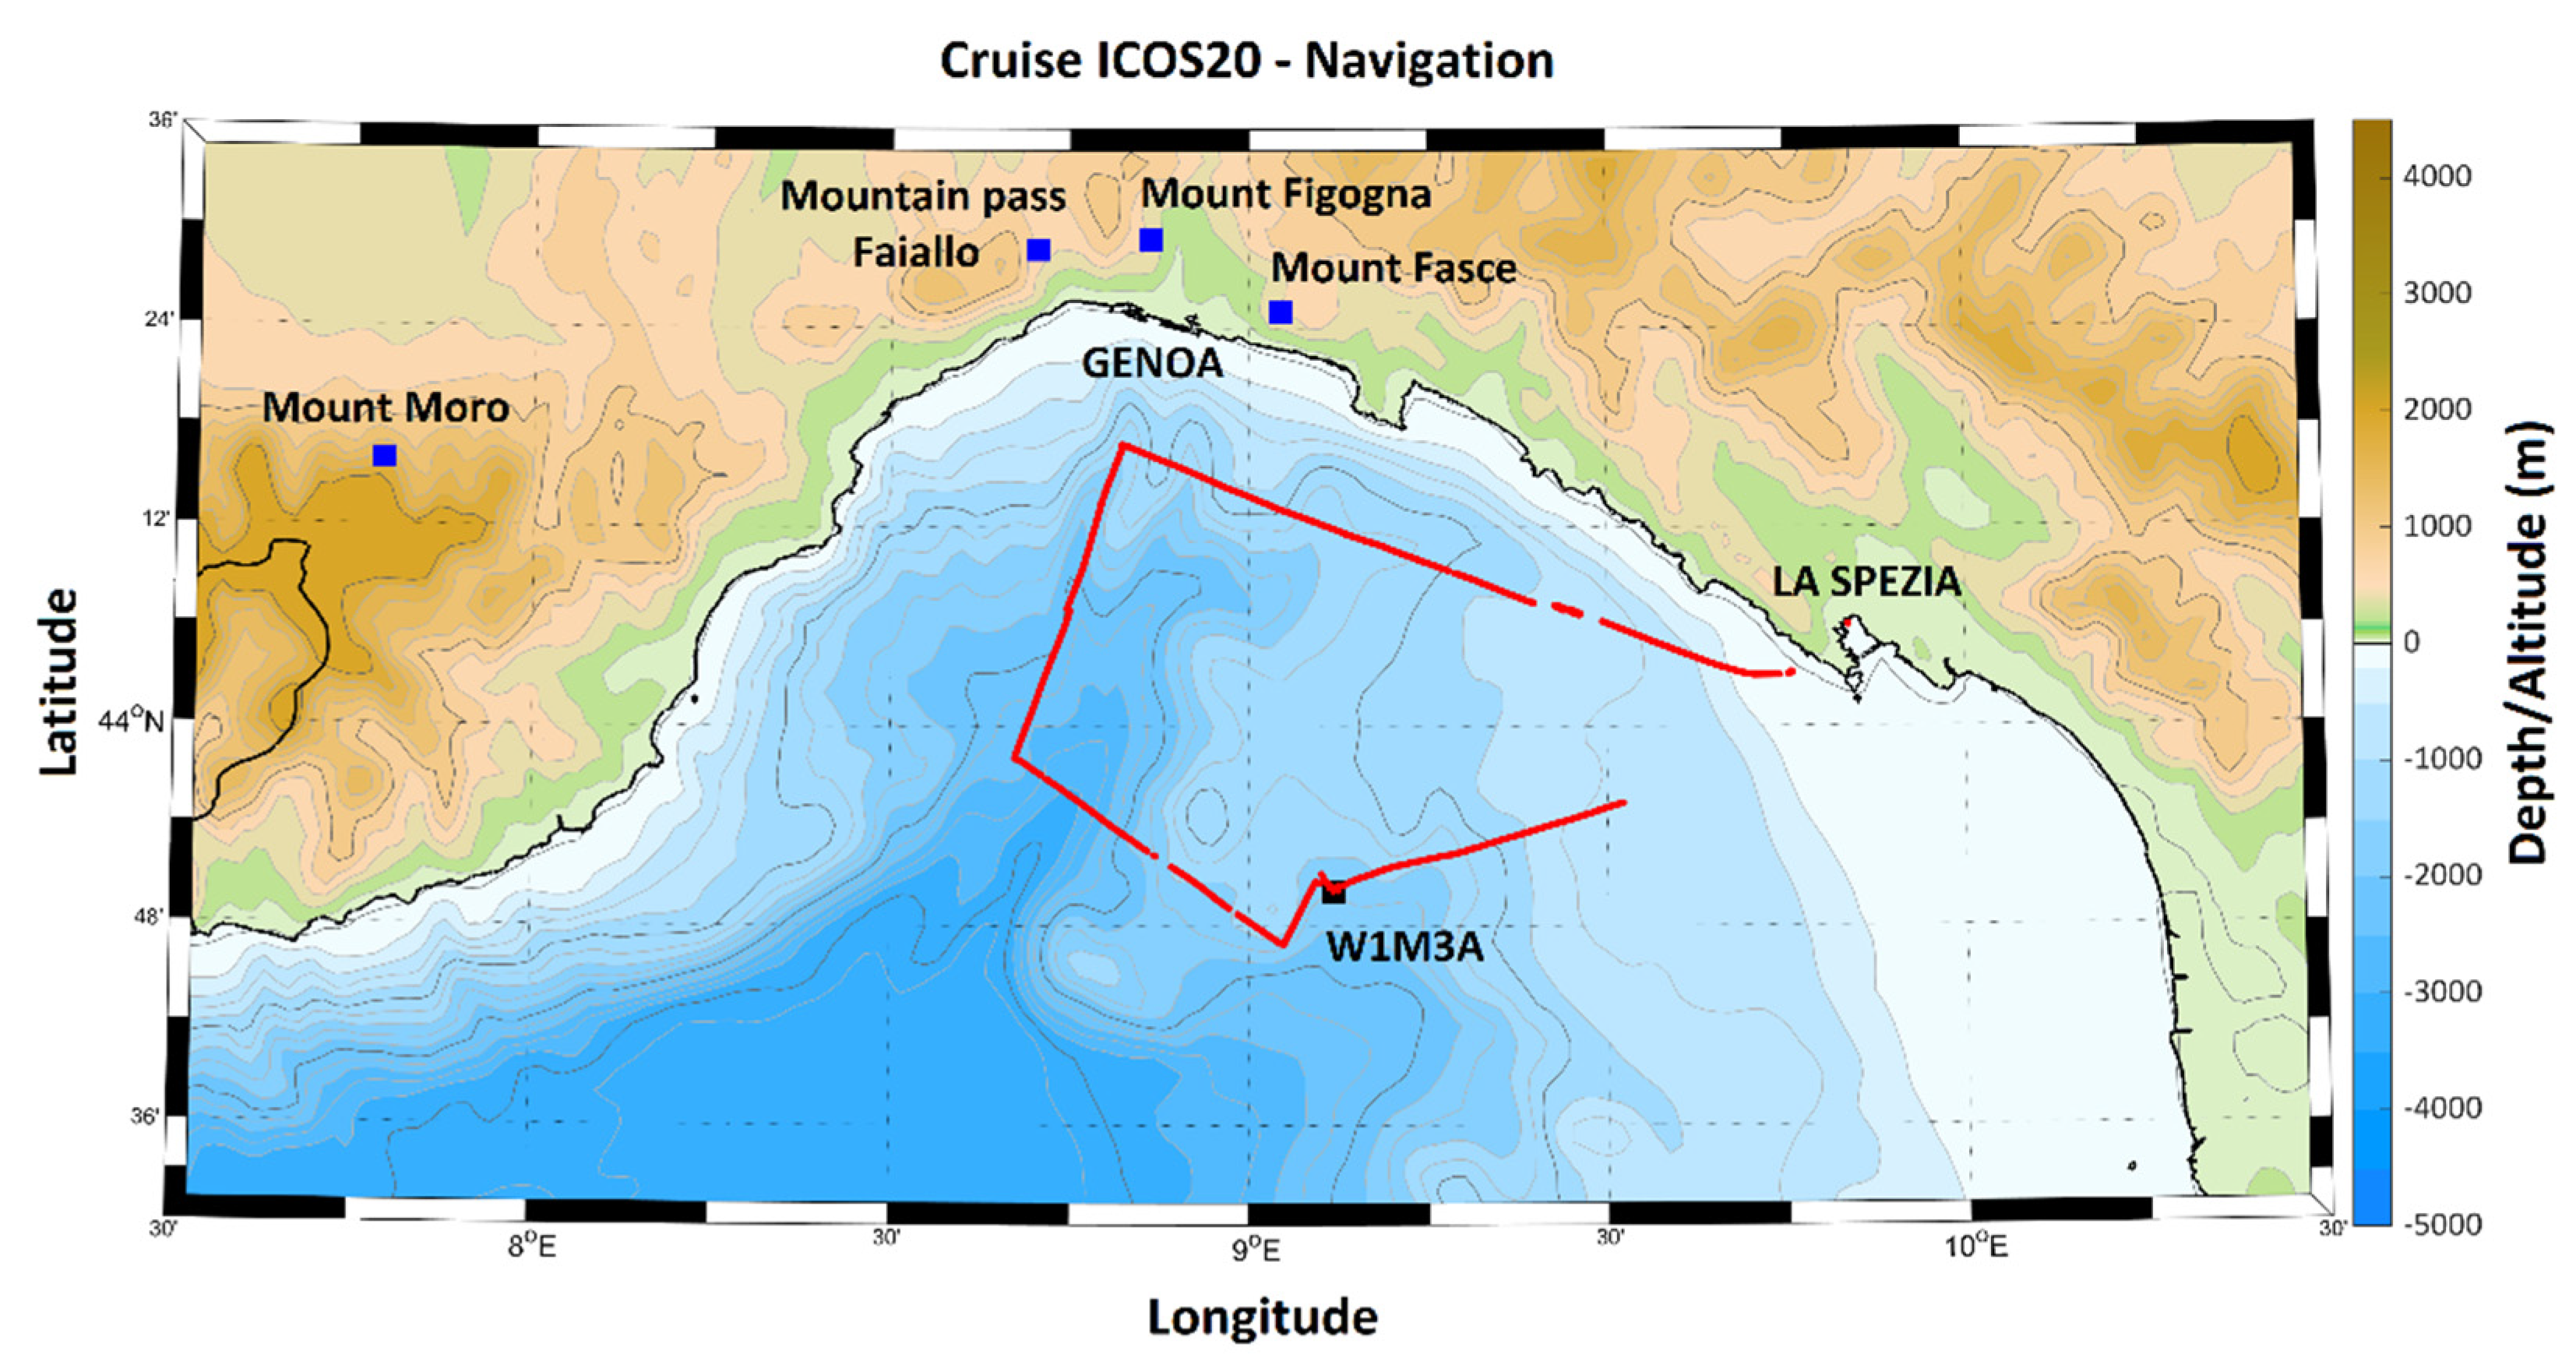
The second test was performed during the research cruise ICOS20 from 19 October up to 21 October 2020 with the R/V Dallaporta operated by the National Research Council of Italy. The research cruise started and ended in La Spezia, and, during the three days of navigation, the route depended on the need for performing standard oceanographic measurements (i.e., Conductivity Temperature Depth (CTD) casts and water sampling with the on-board rosette) in the basin and around the W1M3A observatory [
33,
34,
35], one of the oldest infrastructures of the National Research Council of Italy, part of ERIC EMSO and of the marine component of ERIC ICOS (
Figure 3).
The end-node TIAMO 3 and one LT I/O Controller were installed on the bow of the R/V Dallaporta during the entire navigation. The Field Test end-node was positioned on the bow of the vessel during the navigation except during the late afternoon of 19 October 2020, when it was temporarily installed on the W1M3A observatory during the inspection to the platform. On the vessel, the gateway LG308 3 was installed close to the nodes during the navigation, but it forwarded LoRaWAN packets to the server only under GSM coverage.
Three gateways operated on the coast on the evening of 19 October and on the morning of 20 October 2020 to test the connectivity from the open ocean to the coast: two LG308 gateways were installed on the hills behind Genoa, whereas another wireless gateway operated by ISILINE s.r.l. on Mount Moro was fully operational during the tests. One gateway (LG308 1) changed its position during the two days.
Table 2 summarizes the location of the three gateways during the two days of testing.
The following metrics have been considered to assess the performance of the transmission: packet loss ratio, packet reception rate (PRR), Expected Signal Power (ESP), RSSI and SNR values as available from gateways.
The packet loss ratio, the
ESP and
PRR have been defined through the following equations:
where
BER is the bit error rate, and
Ps is the probability of successful preamble reception. The term
Ps considers that the channel is not a constant additive white Gaussian noise channel but behaves like a slow fading Rayleigh channel, and it is calculated as in [
36].
BER is calculated as proposed in [
37] through the following set of equations:
3. Results and Discussion
During the tests, all end-nodes operated with a bandwidth equal to 125 kHz and a coding speed of 4/5. Therefore, by modifying the value of the scale factor from 7 to 12, the transmission speed values varied from 5.47 Kbit s−1 down to 0.29 Kbit s−1, as there is an inverse relationship between the transmission speed and the scale factor.
The Adaptive Data Rate algorithm was used in all tests, which automatically allowed to maximize communication efficiency by reducing the energy consumption of the end-nodes. The sampling period of the end-nodes was set to 30 s for the two LT I/O Controllers and the Field Test, 60 s for the end-nodes TIAMO, and 20 s for the spectrometer.
In the case of short distances between gateways and end-nodes a high link budget is not necessary as the time-of-flight of the transmitted packet is reduced, whereas it is necessary in the case of longer distances (i.e., in wide-area marine applications). For this reason, the transmissions were made in the maximum sensitivity scenario that, in turn, yields the highest packet loss due to a time-of-flight between 1.4 and 1.9 s. The nominal frequency band was 868 MHz.
During the two crossings of the passenger vessel, the performance of the developed LoRAWAN was evaluated in a mixed line of sight and not line of sight (NLOS) scenario. In fact, as the vessel departed from Porto Antico the LOS was guaranteed only for the gateways located at Righi, Mount Fasce and partly for those positioned on Mount Gazzo, Scarpino, and Crevari, whereas as the vessel started the back route from Pegli all gateways were in LOS except Righi (
Figure 4).
Table 3 summarizes the results of the test performed in coastal waters in terms of packet loss ratio for each pair of end-node and gateway. The total amount of packets transmitted by the Field Test end-node, both automatically and triggered by the operator on board the vessel, was 180. The other employed end-nodes transmitted automatically, and the number of packets sent was 97 for the spectrometer, 45 for the LT I/O Controller 1, and 71 for the end-node TIAMO 3. The LT I/O Controller 2 was not operating due to a battery fault. At the arrival and departure terminal in Pegli, conditions of the sea did not allow the operator to maintain the spectrometer operational, therefore it had to be switched off: this explains the high packet loss ratio for the spectrometer with respect to the gateways located at Crevari and Scarpino, although they were both in LOS condition. LT I/O Controller 1 was operating only for the back passage from Pegli to Porto Antico, and this is the reason why it was experienced an elevated number of missed received packets again for LG308 1 whose sight was partially occluded during the track of the vessel turning back to Porto Antico.
The best results were obtained in LOS independently of the distance between the end-nodes and the gateways: this demonstrates that in LOS conditions it is possible to obtain reliable transmission over large portions of the sea, even in the case of proximity to the coast using gateways on elevated positions, thus able to observe the marine area of interest without obstacles.
PRR estimates reveal a quite constant value close to 1, indicating that the transmissions occurred in the connected region [
38]. The reaching of the upper limit for
PRR was expected since our setup was conceived to obtain the highest sensitivity at the expense of a higher percentage of potentially missed packets.
In order to analyze the presence of multipath propagation effects on the channel, the
RSSI and
SNR values were archived for each gateway and for each received LoRaWAN packet depending on the position of the vessel. With the exception of LT I/O Controller 1, for which the received power for the LoRa packet was at the limit of the technology (i.e., close to −120 dBm), all the employed gateways detected comparable
RSSI values with respect to the transmitting end-nodes (
Figure 5). These results support that the multipath propagation effect was not dominant during the experiment and that the main component of the signal was that of the LOS path. Results still highlight how the LOS condition is fundamental to obtaining a reliable LoRa transmission. Furthermore, it is noteworthy that the two non-commercial end-nodes developed on purpose for the specific marine application show performances very similar to the commercial Field Test in terms of
RSSI.
In the case of free LOS,
SNR values assume positive values close to the threshold of 10 dB, which is considered almost optimal for LoRaWAN transmission, regardless of the distance between the end-nodes and the receiving gateway (
Figure 6). Unlike the other end-nodes, the transmissions by LT I/O Controller 1 seemed to be strongly limited by the presence of a noise floor signal, probably due to the noise of the front-end circuit, such as to invalidate the transmission, and this agrees with the observed high packet loss ratio.
The same type of analysis has been carried out during the test performed in October 2020 taking advantage of the availability of the R/V Dallaporta during the oceanographic campaign ICOS20.
Table 4 shows the results in terms of packet loss ratio for three gateways operating on land and the two days of tests. The overall dataset comprises 23 and 67 packets transmitted by Field Test for the 19 October and 20 October, respectively; 55 (on 19 October) and 67 (on 20 October) for the LT I/O Controller 1 and 8 on the first day and 59 in the second day for the TIAMO 3 end-node. On 20 October, LT I/O Controller 1 was operating onboard outside the period during which gateways LG308 1 and LG308 3 were active on land, thus no packets were received ashore from this end-node.
During the first day of the test, the end-node Field Test was temporarily installed onboard the W1M3A observatory at about 8 m above the sea level, while the other end-nodes were positioned on the upper deck of the vessel, which was nearby the observatory to assist the researchers involved in the operation at sea. Whereas the W1M3A is a relatively stable platform, and it can be assumed that during the intervention heading and trim of the platform, it was almost constant, not the same holds for the vessel, which was moving and turning around the observatory, thus the masts of the ship could mask the coast for the end-nodes. On the second day, the vessel was in navigation towards the coast. This could partially explain the difference in the performance observed during the two days of the campaign. LOS was guaranteed between the R/V Dallaporta and the position of the gateways both days provided that the locations of the gateways were chosen considering the constraints due to the first Fresnel zone (
Figure 7).
The values of
SNR and
RSSI acquired during the navigation of the R/V Dallaporta from the open ocean toward the coast are shown in
Figure 8 and
Figure 9.
RSSI values are very close to the limit of −120 dB, and for most of the packets received by the gateway on Mount Moro, they are even lower, but this is consistent with the peculiar high sensitivity of the LoRa technology. The SNR values are representatives of a not noisy channel, with values within the limits of LoRa transmission. The best results were obtained for the gateway positioned on Mount Fasce, which, although positioned at almost the same altitude as the gateways on Mount Figogna and Mountain pass Faiallo, is more open to the sea without natural or urban obstacles. This is more evident considering that the SNR values measured at the same distance between end-nodes and gateways do not exceed approximately −17 dB for the position at Mount Figogna, whereas for the position at Mount Fasce the values reach even −11 dB. The calculated PRR values clearly reproduce a channel without multipath, as expected considering the transmission over the ocean without any major obstacles.
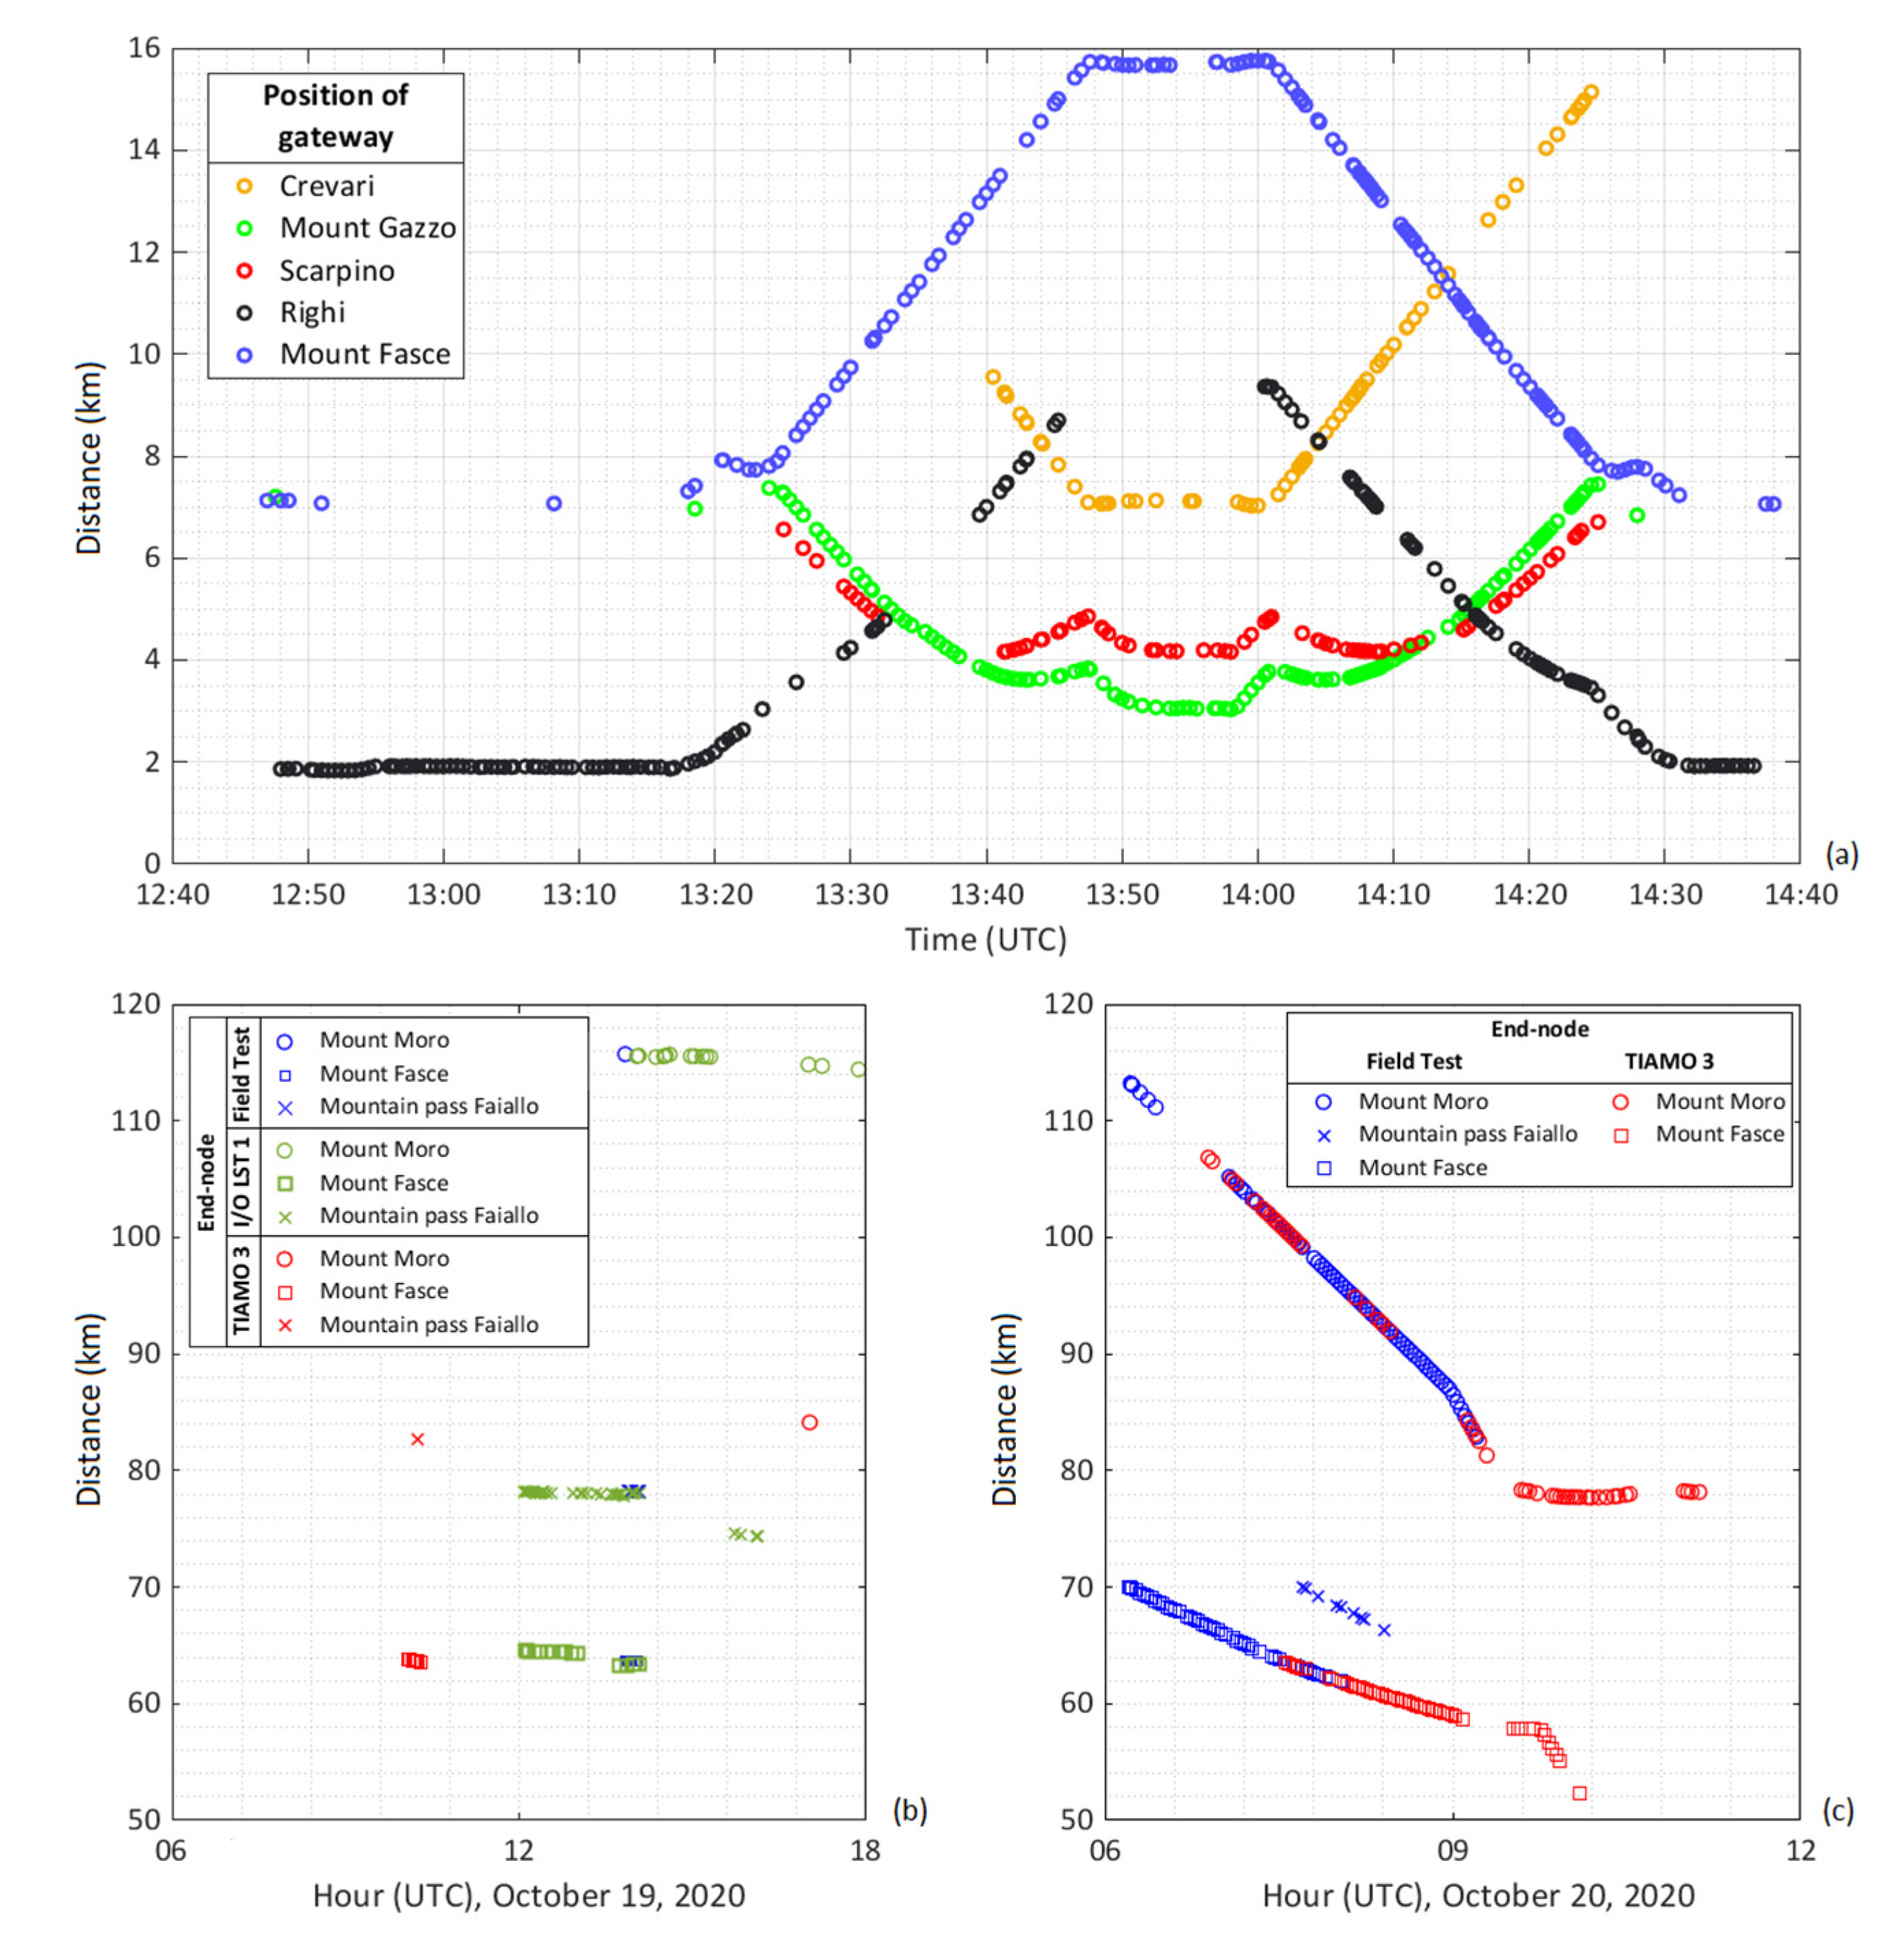
In order to estimate the range of LoRaWAN for marine applications, both in coastal areas and on wider basin scale, the GPS position of both vessels used during the tests was recorded simultaneously to the other data: this allowed the calculation of the precise distance between the end-nodes installed on the vessels and the gateways on land for each packet sent (
Figure 10).
Figure 10a shows the estimated distance for the Field Test end-node during the test in coastal waters, whereas
Figure 10b,c also show the results for the TIAMO 3 and the LT I/O Controller 1 end-nodes for the days of 19 October and 20 October, respectively.
Results evidence the feasibility to obtain reliable IoT transmission considering end-nodes installed on mobile platforms moving at sea, both in coastal and in offshore scenarios. Successful transmissions were obtained with a distance between gateways and end-nodes of more than 100 km in free LOS, and this achievement demonstrates the high sensitivity of the LoRa transmission up to −140 dBm in an operational marine scenario. It is worth noting that the same results in terms of range are achieved by commercial end-nodes (i.e., Field Test and LT I/O Controller 1) and the developed ones (i.e., TIAMO 3 end-node).
The maximum estimated distance is summarized in
Table 5.
The approximations of the received power obtained applying Friis and Hata models (Equations (3)–(6)) in the coastal scenario, with gateways on hills close by the city and end-nodes installed on the passenger vessel, slightly overestimate the effective received power measured by
RSSI and
SNR through Equation (9). All received messages show values falling below the Hata model using the expression for the free space, but the received power is quite consistent with the formulation of the Hata model on the hypothesis of the semi-urban environment: this condition can be assumed correct for the performed tests due to the particular orography of the coast close to Genoa and a high degree of urbanization of the coast. In a few exceptions, the received packets present a power higher than expected on the basis of the Friis model (
Figure 11a).
In the open ocean scenario, results demonstrate that the Friis model represents better than the Hata model the condition of path loss in a free space hypothesis and when the presence of buildings is negligible along the LOS independently of the distance. Power estimates are comparable for the three sites despite the difference of about 70 km between Mount Fasce and Mount Figogna with respect to Mount Moro. Among the three tested models (Friis, Hata free space, Hata semi-urban), the Friis curve has better performance, and the Hata semi-urban model approximates better the real data with respect to the Hata model for free space (
Figure 11b). This conclusion may also be consistent considering the presence of obstacles (buildings, hills, and mounts) along the terminal part of the radio path from the off-shore end-nodes to the gateways on the mountains. As the distance between end-nodes and gateways increases, the curves based on the equations by Friis and by Hata (with semi-urban conditions) tend to be similar for the gateway located at an altitude of about 700 m (Mount Fasce, Mountain pass Faiallo, Mount Figogna) whereas, when the altitude is greater than 1700 m (i.e., Mount Moro) the difference between the two models is of about 20 dBm.
Results demonstrate that a distance between gateways and end-nodes of more than 110 km can be reached in a marine scenario under the hypothesis of LOS and that although considerable, the obtained maximum distance of 113.22 km cannot be considered the upper limit of reliable LoRa transmission towards the sea, since the lowest received power detectable for LoRa transmission is considered −140 dB and, in the test, it was about −128 dB.


 ,
, 


