Clinical and Laboratory Associations with Methotrexate Metabolism Gene Polymorphisms in Rheumatoid Arthritis

 , ,
, ,
Abstract
:1. Introduction
2. Materials and Methods
2.1. Participant Recruitment
2.2. Whole Blood and Dried Blood Spot Sample Collection
2.3. Nucleic Acid Isolation from Peripheral Blood
2.4. Mass-Spectrometry Analysis
2.5. Endpoint-Genotyping Using Taqman Assay
2.6. Taqman Probes Used for Single-Nucleotide Polymorphism Genotyping
2.7. Validation of Polymorphisms by Pyrosequencing
2.8. Statistics and Sample Size Calculations
3. Results
3.1. Study Population
3.2. Single-Nucleotide Polymorphisms Analysed in this Study
3.3. Methotrexate and Sulfasalazine Metabolite Polymorphism Associations
3.4. Clinical and Laboratory Feature Polymorphism Associations
4. Discussion
Supplementary Materials
Author Contributions
Funding
Conflicts of Interest
References
- Firestein, G.S.; Budd, R.C.; Gabriel, S.E.; McInnes, I.B.; O’Dell, J.R.; Kelley, W.N. Kelley’s Textbook of Rheumatology, 11th ed.; Koretzky, G., Ed.; Elsevier/Saunders: Philadelphia, PA, USA, 2020. [Google Scholar]
- World Health Organisation. Chronic Diseases and Health Promotion: Chronic Rheumatic Conditions. Available online: https://www.who.int/chp/topics/rheumatic/en/ (accessed on 17 August 2020).
- Rea, I.M.; Gibson, D.S.; McGilligan, V.; McNerlan, S.E.; Alexander, H.D.; Ross, O.A. Age and Age-Related Diseases: Role of Inflammation Triggers and Cytokines. Front. Immunol. 2018, 9, 586. [Google Scholar] [CrossRef] [PubMed]
- Noack, M.; Miossec, P. Selected cytokine pathways in rheumatoid arthritis. Semin. Immunopathol. 2017, 39, 365–383. [Google Scholar] [CrossRef] [PubMed]
- Aletaha, D.; Smolen, J.S. Diagnosis and Management of Rheumatoid Arthritis: A Review. JAMA 2018, 320, 1360–1372. [Google Scholar] [CrossRef] [PubMed]
- Gibson, D.S.; Bustard, M.J.; McGeough, C.M.; Murray, H.A.; Crockard, M.A.; McDowell, A.; Blayney, J.K.; Gardiner, P.V.; Bjourson, A.J. Current and future trends in biomarker discovery and development of companion diagnostics for arthritis. Expert Rev. Mol. Diagn. 2015, 15, 219–234. [Google Scholar] [CrossRef]
- Barrera, P.; van der Maas, A.; van Ede, A.E.; Kiemeney, B.A.; Laan, R.F.; van de Putte, L.B.; van Riel, P.L.C.M. Drug survival, efficacy and toxicity of monotherapy with a fully human anti-tumour necrosis factor-alpha antibody compared with methotrexate in long-standing rheumatoid arthritis. Rheumatology 2002, 41, 430–439. [Google Scholar] [CrossRef] [Green Version]
- Eektimmerman, F.; Swen, J.J.; Madhar, M.B.; Allaart, C.F.; Guchelaar, H.J. Predictive genetic biomarkers for the efficacy of methotrexate in rheumatoid arthritis: A systematic review. Pharm. J. 2019, 20, 159–168. [Google Scholar] [CrossRef]
- Eleff, M.; Franks, P.E.; Wampler, G.L.; Collins, J.M.; Goldman, I.D. Analysis of “early” thymidine/inosine protection as an adjunct to methotrexate therapy. Cancer Treat Rep. 1985, 69, 867–874. [Google Scholar]
- Inoue, K.; Yuasa, H. Molecular basis for pharmacokinetics and pharmacodynamics of methotrexate in rheumatoid arthritis therapy. Drug Metab. Pharmacokinet. 2013, 29, 12–19. [Google Scholar] [CrossRef] [Green Version]
- Bannwarth, B.; Labat, L.; Moride, Y.; Schaeverbeke, T. Methotrexate in rheumatoid arthritis. An update. Drugs 1994, 47, 25–50. [Google Scholar] [CrossRef]
- Cairns, A.P.; Patton, J.; Gardiner, P.V.; Liggett, N.; McKane, R.; Rooney, M.; Whitehead, E.; Taggart, A.J. The use of biological agents for severe inflammatory arthritis in Northern Ireland. Rheumatology 2002, 41, 92. [Google Scholar]
- Lai, J.H.; Ling, X.C.; Ho, L.J. Useful message in choosing optimal biological agents for patients with autoimmune arthritis. Biochem. Pharmacol. 2019, 165, 99–111. [Google Scholar] [CrossRef] [PubMed]
- Eichelbaum, M.; Ingelman-Sundberg, M.; Evans, W.E. Pharmacogenomics and individualized drug therapy. Annu. Rev. Med. 2006, 57, 119–137. [Google Scholar] [CrossRef] [PubMed]
- Pang, G.S.; Wang, J.; Wang, Z.; Lee, C.G. Predicting potentially functional SNPs in drug-response genes. Pharmacogenomics 2009, 10, 639–653. [Google Scholar] [CrossRef] [PubMed]
- Aletaha, D.; Neogi, T.; Silman, A.J.; Funovits, J.; Felson, D.T.; Bingham, C.O., 3rd; Birnbaum, N.S.; Burmester, G.R.; Bykerk, V.P.; Cohen, M.D.; et al. Rheumatoid arthritis classification criteria: An American College of Rheumatology/European League Against Rheumatism collaborative initiative. Arthritis Rheum. 2010, 62, 2569–2581. [Google Scholar] [CrossRef]
- Edelbroek, P.M.; van der Heijden, J.; Stolk, L.M. Dried blood spot methods in therapeutic drug monitoring: Methods, assays, and pitfalls. Ther. Drug Monit. 2009, 31, 327–336. [Google Scholar] [CrossRef]
- International Council for Harmonisation (ICH) of Technical Requirements for Pharmaceuticals for Human Use, Guideline M10 on Bioanalytical Method Validation. 2019. Available online: https://www.ema.europa.eu/en/documents/scientific-guideline/draft-ich-guideline-m10-bioanalytical-method-validation-step-2b_en.pdf (accessed on 18 August 2020).
- Royo, J.L.; Hidalgo, M.; Ruiz, A. Pyrosequencing protocol using a universal biotinylated primer for mutation detection and SNP genotyping. Nat. Protoc. 2007, 2, 1734–1739. [Google Scholar] [CrossRef]
- Moore, C.M.; Jacobson, S.A.; Fingerlin, T.E. Power and Sample size calculation for genetic association studies in the presence of genetic model misspecification. Hum. Hered. 2020, 28, 1–16. [Google Scholar] [CrossRef]
- Mikkelsen, T.S.; Thorn, C.F.; Yang, J.J.; Ulrich, C.M.; French, D.; Zaza, G.; Dunnenberger, H.M.; Marsh, S.; McLeod, H.L.; Giacomini, K.; et al. PharmGKB summary: Methotrexate pathway. Pharmacogenet. Genom. 2011, 21, 679–686. [Google Scholar] [CrossRef]
- Thorn, C.F.; Klein, T.E.; Altman, R.B. PharmGKB: The Pharmacogenomics Knowledge Base. Methods Mol. Biol. 2014, 1015, 311–320. [Google Scholar]
- Eektimmerman, F.; Allaart, C.F.; Hazes, J.M.; Broeder, A.D.; Fransen, J.; Swen, J.J.; Guchelaar, H.-J. Validation of a clinical pharmacogenetic model to predict methotrexate nonresponse in rheumatoid arthritis patients. Pharmacogenomics 2019, 20, 85–93. [Google Scholar] [CrossRef]
- Salazar, J.; Moya, P.; Altes, A.; Díaz-Torné, C.; Casademont, J.; Cerdà-Gabaroi, D.; Corominas, H.; Baiget, M. Polymorphisms in genes involved in the mechanism of action of methotrexate: Are they associated with outcome in rheumatoid arthritis patients? Pharmacogenomics 2014, 15, 1079–1090. [Google Scholar] [CrossRef] [PubMed]
- Kumar, P.; Banik, S. Pharmacotherapy options in rheumatoid arthritis. Clin. Med. Insights Arthritis Musculoskelet. Disord. 2013, 6, 35–43. [Google Scholar] [CrossRef]
- Conway, R.; Carey, J.J. Risk of liver disease in methotrexate treated patients. World J. Hepatol. 2017, 9, 1092–1100. [Google Scholar] [CrossRef] [PubMed]
- Kremer, J.M. Toward a better understanding of methotrexate. Arthritis Rheum. 2004, 50, 1370–1382. [Google Scholar] [CrossRef] [PubMed]
- Jolivet, J.; Schilsky, R.L.; Bailey, B.D.; Drake, J.C.; Chabner, B.A. Synthesis, retention, and biological activity of methotrexate polyglutamates in cultured human breast cancer cells. J. Clin. Investig. 1982, 70, 351–360. [Google Scholar] [CrossRef]
- Kurkó, J.; Besenyei, T.; Laki, J.; Glant, T.T.; Mikecz, K.; Szekanecz, Z. Genetics of rheumatoid arthritis—A comprehensive review. Clin. Rev. Allergy Immunol. 2013, 45, 170–179. [Google Scholar] [CrossRef] [Green Version]
- Dervieux, T.; Fürst, D.; Lein, D.O.; Capps, R.; Smith, K.; Walsh, M.; Kremer, J.M. Polyglutamation of methotrexate with common polymorphisms in reduced folate carrier, aminoimidazole carboxamide ribonucleotide transformylase, and thymidylate synthase are associated with methotrexate effects in rheumatoid arthritis. Arthritis Rheum. 2004, 50, 2766–2774. [Google Scholar] [CrossRef]
- Tian, H.; Cronstein, B.N. Understanding the mechanisms of action of methotrexate: Implications for the treatment of rheumatoid arthritis. Bull. NYU Hosp. Jt. Dis. 2007, 65, 168–173. [Google Scholar]
- Chan, E.S.L.; Cronstein, B.N. Molecular action of methotrexate in inflammatory diseases. Arthritis Res. 2002, 4, 266–273. [Google Scholar] [CrossRef] [Green Version]
- Winograd, B.; Lippens, R.J.; Oosterbaan, M.J.; Dirks, M.J.; Vree, T.B.; van der Kleijn, E. Renal excretion and pharmacokinetics of methotrexate and 7-hydroxy-methotrexate following a 24-h high dose infusion of methotrexate in children. Eur. J. Clin. Pharmacol. 1986, 30, 231–238. [Google Scholar] [CrossRef]
- Baggott, J.E.; Morgan, S.L. Methotrexate catabolism to 7-hydroxymethotrexate in rheumatoid arthritis alters drug efficacy and retention and is reduced by folic acid supplementation. Arthritis Rheum. 2009, 60, 2257–2261. [Google Scholar] [CrossRef] [PubMed]
- Bird, H.A. Sulphasalazine, sulphapyridine or 5-aminosalicylic acid—Which is the active moiety in rheumatoid arthritis? Br. J. Rheumatol. 1995, 34 (Suppl. 2), 16–19. [Google Scholar] [CrossRef] [PubMed]
- Box, S.A.; Pullar, T. Sulphasalazine in the treatment of rheumatoid arthritis. Br. J. Rheumatol. 1997, 36, 382–386. [Google Scholar] [CrossRef] [PubMed] [Green Version]
- Kumar, P.J.; Clark, M.L. Kumar & Clark Clinical Medicine, 6th ed.; Saunders: Edinburgh, UK, 2002. [Google Scholar]


| Mean | SD | |
|---|---|---|
| Gender, male/female | 32/68 | - |
| Age, yr | 59.5 | 12.6 |
| Disease duration, yr | 6.0 | 3.9 |
| C-reactive protein, mg/L | 7.9 | 11 |
| Rheumatoid factor, n positive | 63 | - |
| Anti-CCP, n positive | 53 | - |
| ESR (mm/h) | 15 | 15 |
| DAS-28 ESR | 3.6 | 1.5 |
| RBC (cells/mL) | 4.5 | 1.2 |
| Hb (g/100 mL) | 134 | 13 |
| WBC (cells/mL) | 6.8 | 2.3 |
| Neutrophils (cells/mL) | 4.4 | 1.9 |
| Lymphocytes (cells/mL) | 1.7 | 1.4 |
| Platelets (cells/mL) | 254 | 68 |
| ALT (u/L) | 23 | 11 |
| AST (u/L) | 24 | 9.4 |
| ALP (u/L) | 80 | 22 |
| Bilirubin mg/L | 8.2 | 5.6 |
| Minor Allele Frequency (European; dbGAP Sample Size) | Genotype Frequency | |||||||
|---|---|---|---|---|---|---|---|---|
| SNP | Variant Locale | Gene | Clinical Consequences | Alleles (Ref > Alt) | −/− | +/− | +/+ | |
| rs10280623 | Intron | ABCB1 | Associated with MTX toxicity | T > C | C = 0.1933 (n = 5,216) | 64 | 21 | 14 |
| rs246240 | Intron | ABCC1 | Low response to MTX | A > G | G = 0.153169 (n = 131,156) | 6 | 25 | 69 |
| rs717620 | Non-coding Transcript | ABCC2 | Increased time needed to reach therapeutic level | C > T | T = 0.198186 (n = 137,144) | 11 | 24 | 65 |
| rs3740065 | Intron | ABCC2 | Increased risk of MTX toxicity | A > G | G = 0.108811 (n = 128,976) | 1 | 10 | 87 |
| rs2231142 | Intron Missense | ABCG2 | SNP causes higher toxicity with combination treatments | G > T | T = 0.10454 (n = 88,504) | 8 | 21 | 71 |
| rs16853826 | Intron | ATIC | ATIC rs16853826 variant associated with toxicity | G > A | A = 0.12231 (n = 10,972) | 72 | 20 | 8 |
| rs4846051 | Codon Synonymous | MTHFR | Increased risk of MTX toxicity | A > G | G = 0.023185 (n = 117,404) | 0 | 0 | 100 |
| rs17421511 | Intron | MTHFR | Positive response to MTX treatment (GG) | G > A | A = 0.1674 (n = 5990) | 36 | 46 | 16 |
| rs1476413 | Intron | MTHFR | Positive response to MTX treatment (CC) | C > T | T = 0.270570 (n = 131,256) | 15 | 24 | 61 |
| rs4149081 | Intron | SLC081 | Increased risk of MTX toxicity | G > A | A = 0.168487 (n = 136,218) | 51 | 22 | 27 |
| SNP | Feature (Time pt.) | Units | Mean | ±SD | Mean | ±SD | Mean | ±SD | ANOVA p Value | Genotype Comparison | Bonferroni p Value | Summary |
|---|---|---|---|---|---|---|---|---|---|---|---|---|
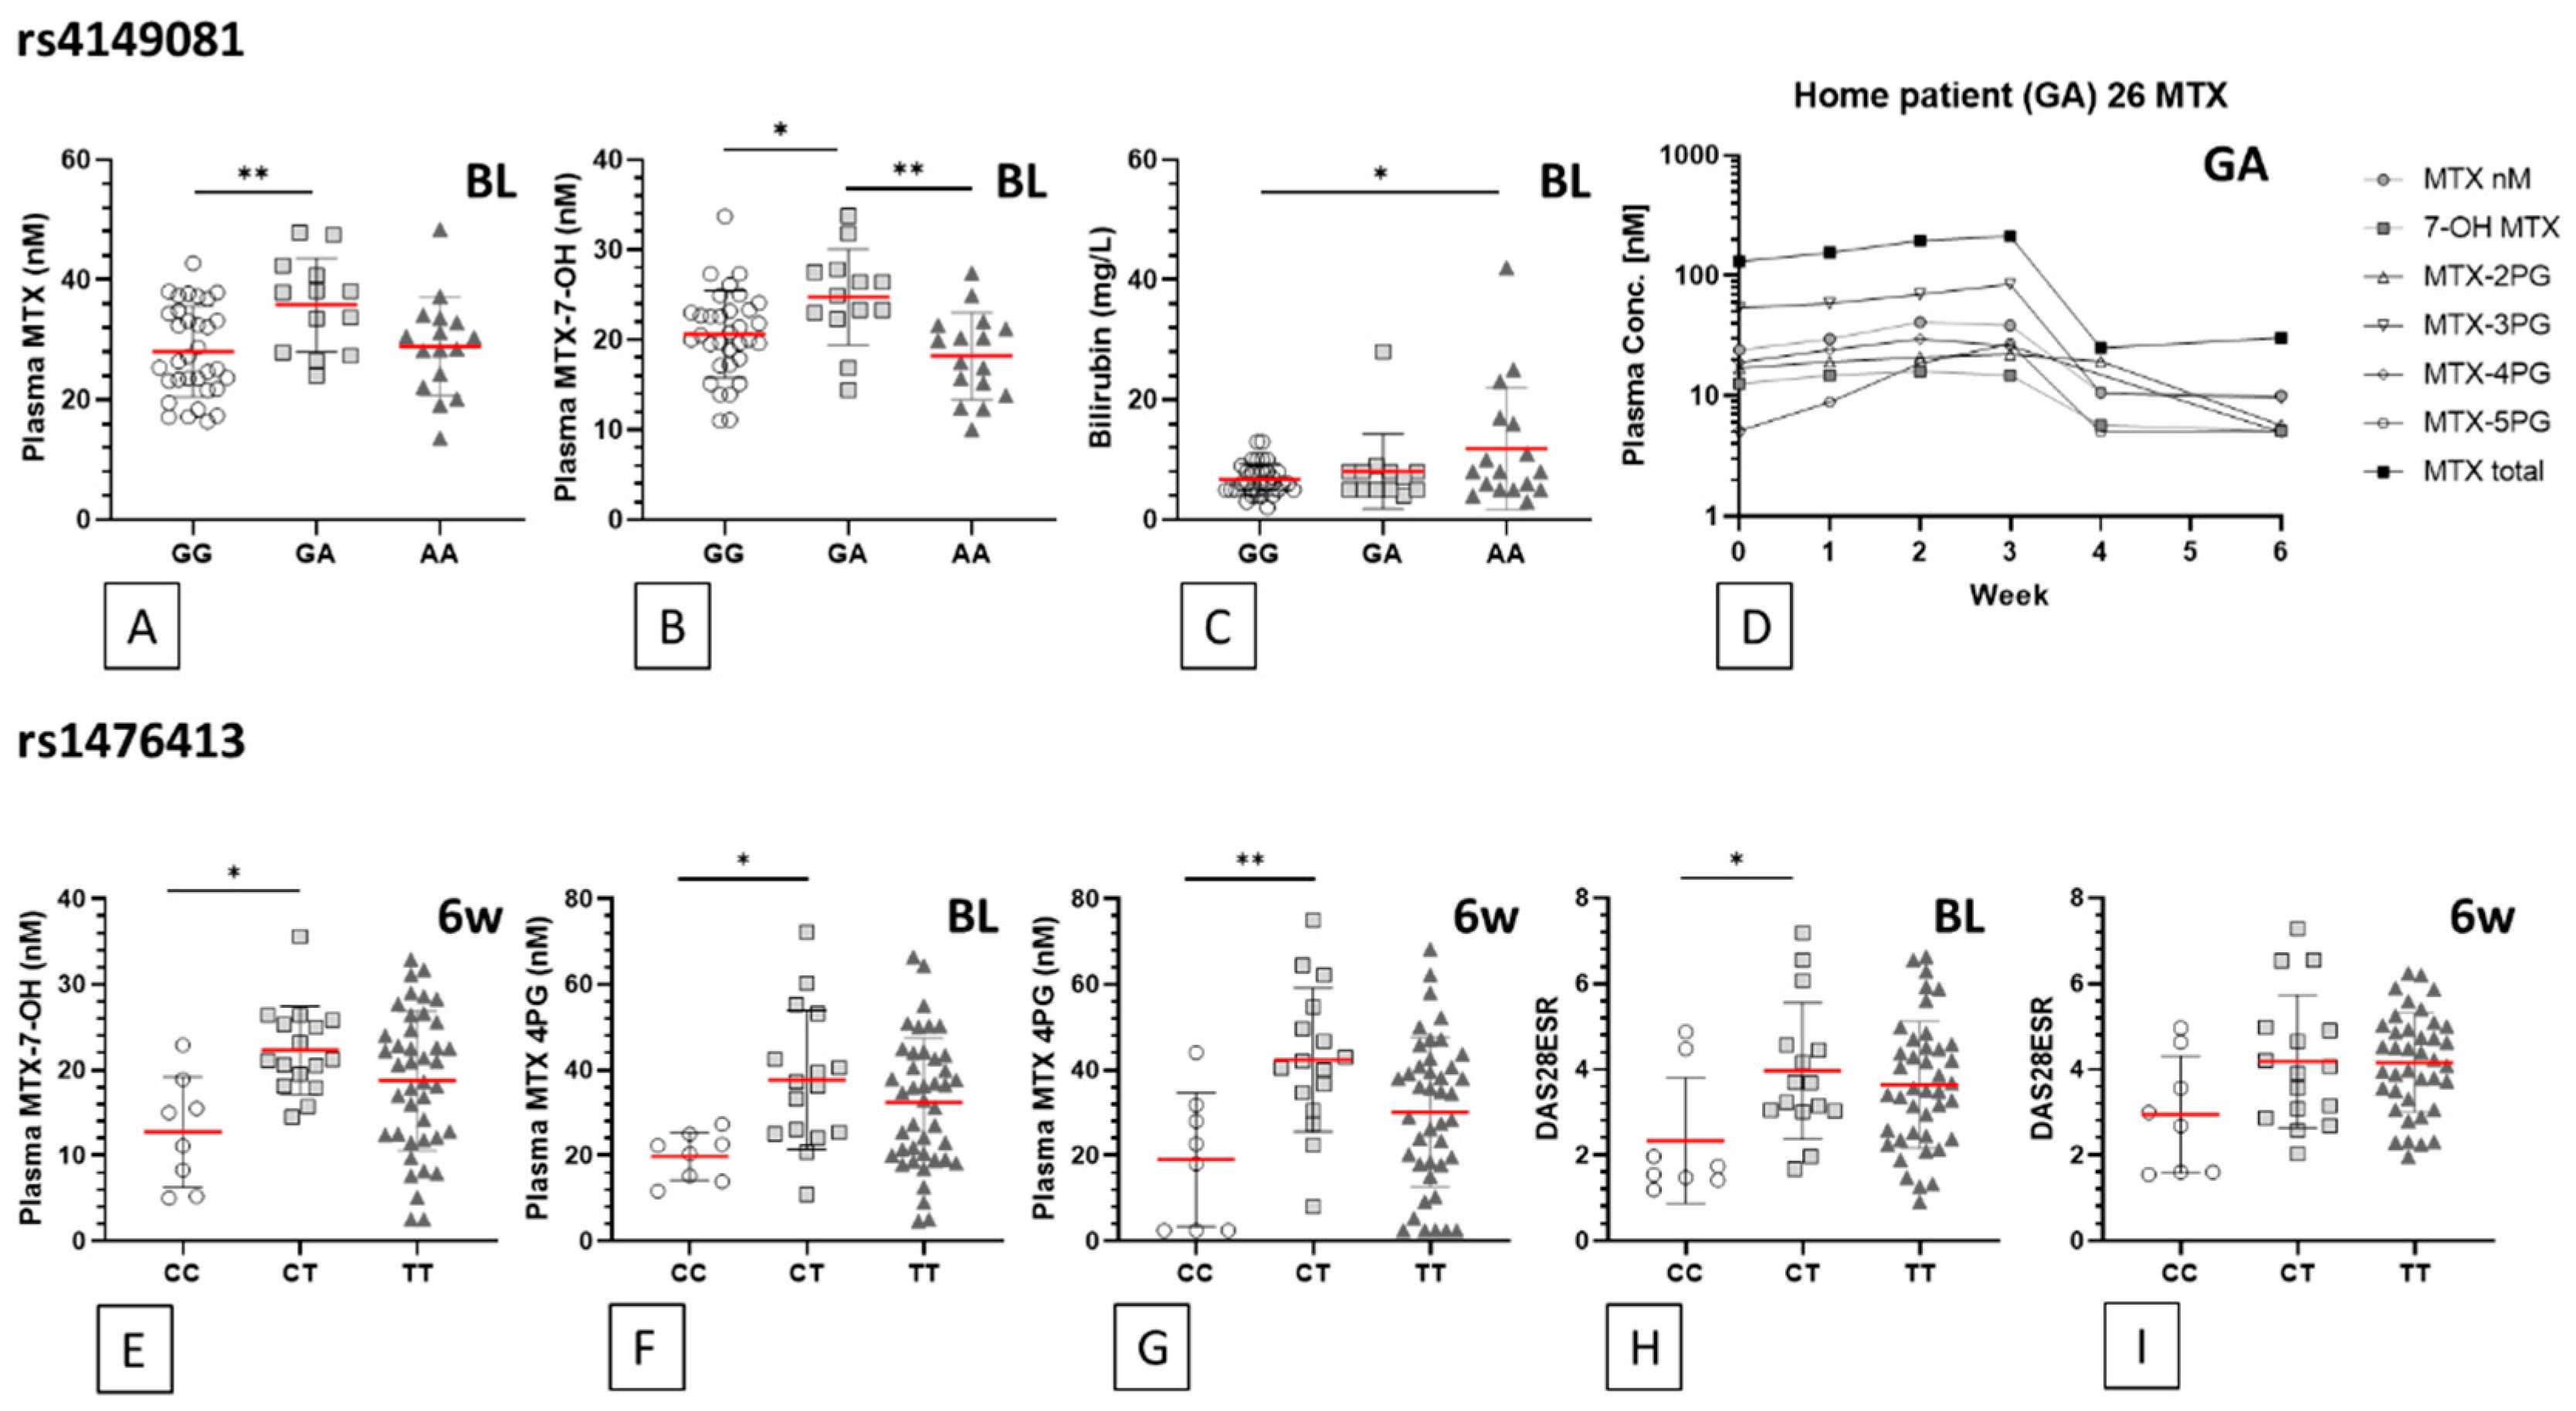
| rs4149081 | GG (n = 25/36) | GA (n = 11/13) | AA (n = 10/17) | |||||||||
| MTX (BL) | nM | 28.0 | 7.5 | 35.8 | 7.8 | 28.9 | 8.2 | 0.011 | GG vs. GA | 0.010 | ** | |
| MTX (6wk) | nM | 26.0 | 10.6 | 34.1 | 11.5 | 25.9 | 10.2 | 0.058 | GG vs. GA | 0.071 | ns | |
| MTX-7-OH (BL) | nM | 20.6 | 4.8 | 24.8 | 5.3 | 18.2 | 4.8 | 0.003 | GG vs. GA | 0.038 | * | |
| GA vs. AA | 0.002 | ** | ||||||||||
| MTX-7-OH (6wk) | nM | 19.1 | 6.8 | 23.3 | 7.2 | 17.3 | 7.6 | 0.079 | GG vs. GA | 0.239 | ns | |
| GA vs. AA | 0.084 | ns | ||||||||||
| Bilirubin (BL) | mg/L | 6.7 | 2.623 | 8.1 | 6.211 | 11.9 | 10.15 | 0.024 | GG vs. AA | 0.020 | * | |
| Bilirubin (6wk) | mg/L | 6.6 | 2.392 | 7.8 | 3.76 | 10.2 | 8.64 | 0.059 | GG vs. AA | 0.054 | ns | |
| rs1476413 | CC (n = 6/8) | CT (n = 13/16) | TT (n = 26/42) | |||||||||
| MTX-7-OH (BL) | nM | 19.8 | 5.6 | 21.2 | 5.7 | 20.1 | 5.9 | 0.791 | CC vs. CT | >0.999 | ns | |
| MTX-7-OH (6wk) | nM | 12.7 | 6.5 | 22.3 | 5.2 | 18.7 | 8.2 | 0.015 | CC vs. CT | 0.012 | * | |
| MTX 4PG (BL) | nM | 19.8 | 5.6 | 37.7 | 16.2 | 32.4 | 15.1 | 0.024 | CC vs. CT | 0.020 | * | |
| MTX 4PG (6wk) | nM | 19.0 | 15.6 | 42.4 | 16.8 | 30.2 | 17.5 | 0.007 | CC vs. CT | 0.008 | ** | |
| DAS28ESR (BL) | 2.3 | 1.5 | 4.0 | 1.6 | 3.6 | 1.5 | 0.047 | CC vs. CT | 0.049 | * | ||
| DAS28ESR (6wk) | 3.0 | 1.4 | 4.2 | 1.6 | 4.2 | 1.2 | 0.051 | CC vs. CT | 0.090 | ns | ||
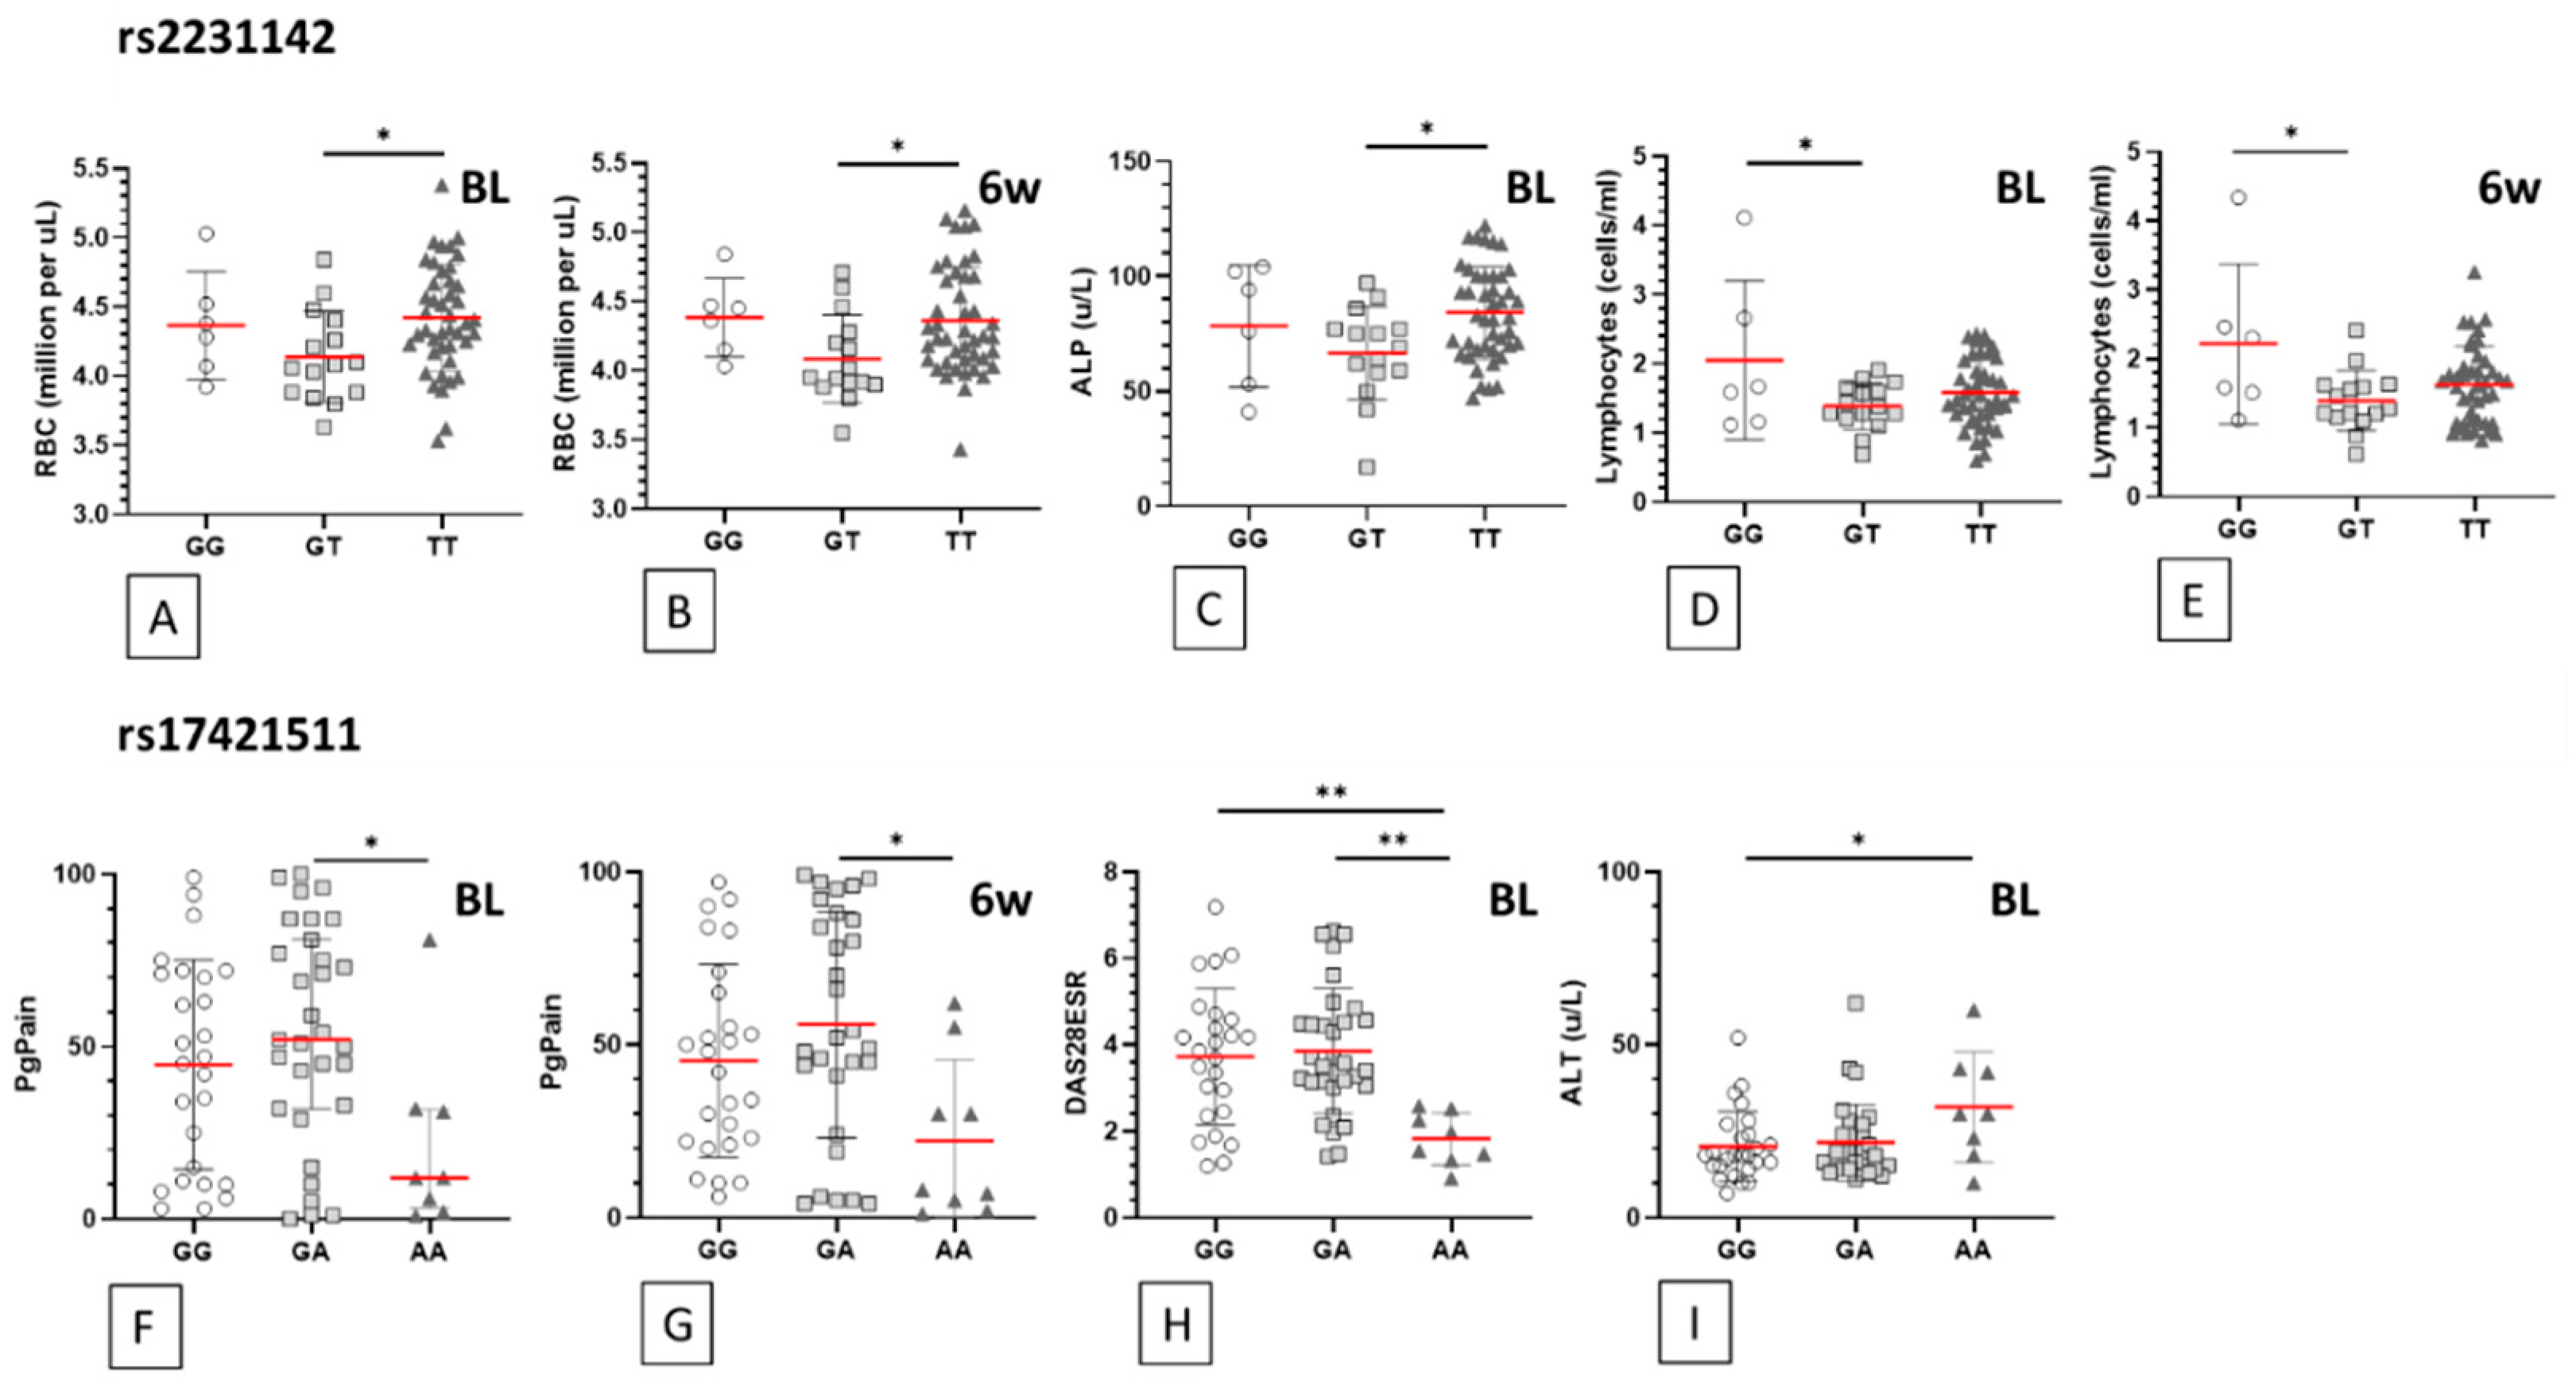
| rs2231142 | GG (n = 3/6) | GT (n = 12/15) | TT (n = 30/45) | |||||||||
| RBC (BL) | mill./uL | 4.4 | 0.4 | 4.1 | 0.3 | 4.4 | 0.4 | 0.050 | GT vs. TT | 0.044 | * | |
| RBC (6wk) | mill./uL | 4.4 | 0.3 | 4.1 | 0.3 | 4.4 | 0.4 | 0.042 | GT vs. TT | 0.044 | * | |
| ALP (BL) | u/L | 78.3 | 26.5 | 66.6 | 20.3 | 84.2 | 20.2 | 0.023 | GT vs. TT | 0.019 | * | |
| ALP (6wk) | u/L | 84.3 | 31.4 | 72.7 | 15.2 | 85.1 | 23.0 | 0.184 | GT vs. TT | 0.208 | ns | |
| Lymphocytes (BL) | (cells/ml) | 2.1 | 1.2 | 1.4 | 0.3 | 1.6 | 0.5 | 0.048 | GG vs. GT | 0.043 | * | |
| Lymphocytes (6wk) | (cells/ml) | 2.2 | 1.2 | 1.4 | 0.4 | 1.6 | 0.6 | 0.023 | GG vs. GT | 0.019 | * | |
| rs17421511 | GG (n = 18/26) | GA (n = 24/31) | AA (n = 4/9) | |||||||||
| PgPain (BL) | % | 44.8 | 30.4 | 53.8 | 31.5 | 22.1 | 26.6 | 0.037 | GA vs. AA | 0.033 | * | |
| PgPain (6wk) | % | 45.4 | 27.9 | 55.9 | 32.8 | 22.2 | 23.4 | 0.016 | GA vs. AA | 0.013 | * | |
| DAS28ESR (BL) | 3.7 | 1.6 | 3.9 | 1.5 | 1.8 | 0.6 | 0.002 | GA vs. AA | 0.002 | ** | ||
| GG vs. AA | 0.005 | ** | ||||||||||
| DAS28ESR (6wk) | 4.1 | 1.1 | 4.2 | 1.4 | 3.1 | 1.5 | 0.088 | GA vs. AA | 0.097 | ns | ||
| GG vs. AA | 0.159 | ns | ||||||||||
| ALT (BL) | u/L | 20.6 | 10.1 | 21.8 | 11.1 | 32.0 | 15.9 | 0.047 | GG vs. AA | 0.048 | * | |
| ALT (6wk) | u/L | 21.7 | 10.7 | 20.5 | 9.3 | 27.1 | 12.4 | 0.252 | GG vs. AA | 0.534 | ns |
© 2020 by the authors. Licensee MDPI, Basel, Switzerland. This article is an open access article distributed under the terms and conditions of the Creative Commons Attribution (CC BY) license (http://creativecommons.org/licenses/by/4.0/).
Share and Cite
D’Cruz, L.G.; McEleney, K.G.; Tan, K.B.C.; Shukla, P.; Gardiner, P.V.; Connolly, P.; Conway, C.; Cobice, D.; Gibson, D.S. Clinical and Laboratory Associations with Methotrexate Metabolism Gene Polymorphisms in Rheumatoid Arthritis. J. Pers. Med. 2020, 10, 149. https://0-doi-org.brum.beds.ac.uk/10.3390/jpm10040149
D’Cruz LG, McEleney KG, Tan KBC, Shukla P, Gardiner PV, Connolly P, Conway C, Cobice D, Gibson DS. Clinical and Laboratory Associations with Methotrexate Metabolism Gene Polymorphisms in Rheumatoid Arthritis. Journal of Personalized Medicine. 2020; 10(4):149. https://0-doi-org.brum.beds.ac.uk/10.3390/jpm10040149
Chicago/Turabian StyleD’Cruz, Leon G., Kevin G. McEleney, Kyle B. C. Tan, Priyank Shukla, Philip V. Gardiner, Patricia Connolly, Caroline Conway, Diego Cobice, and David S. Gibson. 2020. "Clinical and Laboratory Associations with Methotrexate Metabolism Gene Polymorphisms in Rheumatoid Arthritis" Journal of Personalized Medicine 10, no. 4: 149. https://0-doi-org.brum.beds.ac.uk/10.3390/jpm10040149