
Characteristics of the Third COVID-19 Pandemic Wave with Special Focus on Socioeconomic Inequalities in Morbidity, Mortality and the Uptake of COVID-19 Vaccination in Hungary


 , , ,
, , , 
Abstract
:1. Introduction
2. Methods
2.1. Data Collection
2.2. Deprivation Index
2.3. Statistical Analysis
2.4. Shared Component Model
2.5. Ecological Regression
3. Results
4. Discussion
Author Contributions
Funding
Institutional Review Board Statement
Informed Consent Statement
Data Availability Statement
Acknowledgments
Conflicts of Interest
References
- Davies, N.G.; Kucharski, A.J.; Eggo, R.M.; Gimma, A.; Edmunds, W.J. Centre for the Mathematical Modelling of Infectious Diseases COVID-19 working group Effects of Non-Pharmaceutical Interventions on COVID-19 Cases, Deaths, and Demand for Hospital Services in the UK: A Modelling Study. Lancet Public Health 2020, 5, e375–e385. [Google Scholar] [CrossRef]
- ECDC. Guidelines for the Implementation of Non-Pharmaceutical Interventions against COVID-19. Available online: https://www.ecdc.europa.eu/en/publications-data/covid-19-guidelines-non-pharmaceutical-interventions (accessed on 19 January 2022).
- Hall, V.J.; Foulkes, S.; Saei, A.; Andrews, N.; Oguti, B.; Charlett, A.; Wellington, E.; Stowe, J.; Gillson, N.; Atti, A.; et al. COVID-19 Vaccine Coverage in Health-Care Workers in England and Effectiveness of BNT162b2 MRNA Vaccine against Infection (SIREN): A Prospective, Multicentre, Cohort Study. Lancet 2021, 397, 1725–1735. [Google Scholar] [CrossRef]
- Lopez Bernal, J.; Andrews, N.; Gower, C.; Robertson, C.; Stowe, J.; Tessier, E.; Simmons, R.; Cottrell, S.; Roberts, R.; O’Doherty, M.; et al. Effectiveness of the Pfizer-BioNTech and Oxford-AstraZeneca Vaccines on COVID-19 Related Symptoms, Hospital Admissions, and Mortality in Older Adults in England: Test Negative Case-Control Study. BMJ 2021, 373, n1088. [Google Scholar] [CrossRef]
- Haas, E.J.; Angulo, F.J.; McLaughlin, J.M.; Anis, E.; Singer, S.R.; Khan, F.; Brooks, N.; Smaja, M.; Mircus, G.; Pan, K.; et al. Impact and Effectiveness of MRNA BNT162b2 Vaccine against SARS-CoV-2 Infections and COVID-19 Cases, Hospitalisations, and Deaths Following a Nationwide Vaccination Campaign in Israel: An Observational Study Using National Surveillance Data. Lancet 2021, 397, 1819–1829. [Google Scholar] [CrossRef]
- Tartof, S.Y.; Slezak, J.M.; Fischer, H.; Hong, V.; Ackerson, B.K.; Ranasinghe, O.N.; Frankland, T.B.; Ogun, O.A.; Zamparo, J.M.; Gray, S.; et al. Effectiveness of MRNA BNT162b2 COVID-19 Vaccine up to 6 Months in a Large Integrated Health System in the USA: A Retrospective Cohort Study. Lancet 2021, 398, 1407–1416. [Google Scholar] [CrossRef]
- Moore, S.; Hill, E.M.; Tildesley, M.J.; Dyson, L.; Keeling, M.J. Vaccination and Non-Pharmaceutical Interventions for COVID-19: A Mathematical Modelling Study. Lancet Infect. Dis. 2021, 21, 793–802. [Google Scholar] [CrossRef]
- Pung, R.; Firth, J.A.; Spurgin, L.G. Singapore CruiseSafe working group; CMMID COVID-19 working group; Vernon J Lee; Adam J Kucharski Using High-Resolution Contact Networks to Evaluate SARS-CoV-2 Transmission and Control in Large-Scale Multi-Day Events. medRxiv 2021. [Google Scholar] [CrossRef]
- Sonabend, R.; Whittles, L.K.; Imai, N.; Perez-Guzman, P.N.; Knock, E.S.; Rawson, T.; Gaythorpe, K.A.M.; Djaafara, B.A.; Hinsley, W.; FitzJohn, R.G.; et al. Non-Pharmaceutical Interventions, Vaccination, and the SARS-CoV-2 Delta Variant in England: A Mathematical Modelling Study. Lancet 2021, 398, 1825–1835. [Google Scholar] [CrossRef]
- Betti, M.; Bragazzi, N.L.; Heffernan, J.M.; Kong, J.; Raad, A. Integrated Vaccination and Non-Pharmaceutical Interventions Based Strategies in Ontario, Canada, as a Case Study: A Mathematical Modelling Study. J. R. Soc. Interface 2021, 18, 20210009. [Google Scholar] [CrossRef]
- Douglas, M.; Katikireddi, S.V.; Taulbut, M.; McKee, M.; McCartney, G. Mitigating the Wider Health Effects of COVID-19 Pandemic Response. BMJ 2020, 369, m1557. [Google Scholar] [CrossRef]
- Perry, M.; Akbari, A.; Cottrell, S.; Gravenor, M.B.; Roberts, R.; Lyons, R.A.; Bedston, S.; Torabi, F.; Griffiths, L. Inequalities in Coverage of COVID-19 Vaccination: A Population Register Based Cross-Sectional Study in Wales, UK. Vaccine 2021, 39, 6256–6261. [Google Scholar] [CrossRef] [PubMed]
- Gaddis, S.M.; Carey, C.M.; DiRago, N.V. Changes Over Time in COVID-19 Vaccination Inequalities in Eight Large U.S. Cities. medRxiv 2021. [Google Scholar] [CrossRef]
- Boehm, E.; Kronig, I.; Neher, R.A.; Eckerle, I.; Vetter, P.; Kaiser, L.; Geneva Centre for Emerging Viral Diseases. Novel SARS-CoV-2 Variants: The Pandemics within the Pandemic. Clin. Microbiol Infect. 2021, 27, 1109–1117. [Google Scholar] [CrossRef] [PubMed]
- Tallon, J.M.; Gomes, P.; Bacelar-Nicolau, L.; Bacelar, S. A Three-Way Multivariate Data Analysis: Comparison of EU Countries’ COVID-19 Incidence Trajectories from May 2020 to February 2021. Biom. Biostat. Int. J. 2021, 10, 98–114. [Google Scholar] [CrossRef]
- ECDC. COVID-19 Data Explorer. Available online: https://www.ecdc.europa.eu/en/publications-data/data-covid-19-vaccination-eu-eea (accessed on 31 January 2022).
- COVID-19 Data Explorer. Available online: https://ourworldindata.org/coronavirus-data-explorer (accessed on 3 February 2022).
- Oroszi, B.; Juhász, A.; Nagy, C.; Horváth, J.K.; McKee, M.; Ádány, R. Unequal Burden of COVID-19 in Hungary: A Geographical and Socioeconomic Analysis of the Second Wave of the Pandemic. BMJ Glob. Health 2021, 6, e006427. [Google Scholar] [CrossRef] [PubMed]
- National Public Health Center Procedures for the New Coronavirus Disease Identified in 2020. 2021. Available online: https://koronavirus.gov.hu/sites/default/files/sites/default/files/imce/nnk_eljarasrend_2021_oktober.pdf (accessed on 21 November 2021).
- Juhász, A.; Nagy, C.; Páldy, A.; Beale, L. Development of a Deprivation Index and Its Relation to Premature Mortality Due to Diseases of the Circulatory System in Hungary, 1998–2004. Soc. Sci. Med. 2010, 70, 1342–1349. [Google Scholar] [CrossRef] [PubMed]
- Juhász, A.; Nagy, C.; Varga, O.; Boruzs, K.; Csernoch, M.; Szabó, Z.; Ádány, R. Antithrombotic Preventive Medication Prescription Redemption and Socioeconomic Status in Hungary in 2016: A Cross-Sectional Study. Int. J. Environ. Res. Public Health 2020, 17, 6855. [Google Scholar] [CrossRef]
- Nagy, C.; Juhász, A.; Beale, L.; Páldy, A. Mortality Amenable to Health Care and Its Relation to Socio-Economic Status in Hungary, 2004–2008. Eur. J. Public Health 2012, 22, 620–624. [Google Scholar] [CrossRef] [Green Version]
- Nagy, C.; Juhász, A.; Pikó, P.; Diószegi, J.; Paragh, G.; Szabó, Z.; Varga, O.; Ádány, R. Preventive Metformin Monotherapy Medication Prescription, Redemption and Socioeconomic Status in Hungary in 2018–2019: A Cross-Sectional Study. Int. J. Environ. Res. Public Health 2021, 18, 2206. [Google Scholar] [CrossRef]
- Boruzs, K.; Juhász, A.; Nagy, C.; Ádány, R.; Bíró, K. Relationship between Statin Utilization and Socioeconomic Deprivation in Hungary. Front. Pharmacol. 2016, 7, 66. [Google Scholar] [CrossRef] [Green Version]
- Jakab, Z.; Juhasz, A.; Nagy, C.; Schuler, D.; Garami, M.; Hungarian Paediatric Haemato-Oncology Network. Trends and Territorial Inequalities of Incidence and Survival of Childhood Leukaemia and Their Relations to Socioeconomic Status in Hungary, 1971–2015. Eur. J. Cancer Prev. 2017, 26, S183–S190. [Google Scholar] [CrossRef] [PubMed]
- Papp, M.; Kőrösi, L.; Sándor, J.; Nagy, C.; Juhász, A.; Ádány, R. Workforce Crisis in Primary Healthcare Worldwide: Hungarian Example in a Longitudinal Follow-up Study. BMJ Open 2019, 9, e024957. [Google Scholar] [CrossRef] [PubMed] [Green Version]
- Beale, L.; Hodgson, S.; Abellan, J.J.; LeFevre, S.; Jarup, L. Evaluation of Spatial Relationships between Health and the Environment: The Rapid Inquiry Facility. Environ. Health Perspect. 2010, 118, 1306–1312. [Google Scholar] [CrossRef]
- Besag, J.; York, J.; Mollié, A. Bayesian Image Restoration, with Two Applications in Spatial Statistics. Ann. Inst. Stat. Math. 1991, 43, 1–20. [Google Scholar] [CrossRef]
- Rue, H.; Martino, S.; Chopin, N. Approximate Bayesian Inference for Latent Gaussian Models by Using Integrated Nested Laplace Approximations. J. R. Stat. Soc. 2009, 71, 319–392. [Google Scholar] [CrossRef]
- Richardson, S.; Thomson, A.; Best, N.; Elliott, P. Interpreting Posterior Relative Risk Estimates in Disease-Mapping Studies. Env. Health Perspect. 2004, 112, 1016–1025. [Google Scholar] [CrossRef]
- Kulldorff, M.; Nagarwalla, N. Spatial Disease Clusters: Detection and Inference. Stat. Med. 1995, 14, 799–810. [Google Scholar] [CrossRef]
- Pénzes, J.; Pásztor, I.Z.; Tátrai, P.; Kóti, T. Roma Population in Hungary—Spatial Distribution and Its Temporal Changes. Deturope Cent. Eur. J. Tour. Reg. Dev. 2019, 11, 138–159. [Google Scholar] [CrossRef]
- Pénzes, J.; Tátrai, P.; Pásztor, I.Z. Changes in the Spatial Distribution of the Roma Population in Hungary during the Last Decades. Területi. Stat. 2018, 58, 3–26. [Google Scholar]
- Knorr-Held, L.; Best, N.G. A Shared Component Model for Detecting Joint and Selective Clustering of Two Diseases. J. R. Stat. Society. Ser. A 2001, 164, 73–85. [Google Scholar] [CrossRef]
- Best, N.; Hansell, A.L. Geographic Variations in Risk: Adjusting for Unmeasured Confounders through Joint Modeling of Multiple Diseases. Epidemiology 2009, 20, 400–410. [Google Scholar] [CrossRef] [PubMed] [Green Version]
- Lunn, D.J.; Thomas, A.; Best, N.; Spiegelhalter, D. WinBUGS—A Bayesian Modelling Framework: Concepts, Structure, and Extensibility. Stat. Comput. 2000, 10, 325–337. [Google Scholar] [CrossRef]
- Brooks, S.P.; Gelman, A. General Methods for Monitoring Convergence of Iterative Simulations. J. Comput. Graph. Stat. 1998, 7, 434–455. [Google Scholar]
- Schabenberger, O.; Gotway, C.A. Statistical Methods for Spatial Data Analysis; CRC Press: Boca Raton, FL, USA, 2004; ISBN 978-0-203-49198-0. [Google Scholar]
- Belsley, D.A.; Kuh, E.; Welsch, R.E. Regression Diagnostics: Identifying Influential Data and Sources of Collinearity; John Wiley & Sons: New York, NY, USA, 2005. [Google Scholar]
- Spiegelhalter, D.J.; Best, N.G.; Carlin, B.P. Bayesian Measures of Model Complexity and Fit. J. R. Stat. Soc. Ser. B 2002, 64, 583–639. [Google Scholar] [CrossRef] [Green Version]
- Gelman, A.; Hwang, J.; Vehtari, A. Understanding Predictive Information Criteria for Bayesian Models. Stat. Comput. 2014, 24, 997–1016. [Google Scholar] [CrossRef]
- ECDC. Risk of Spread of New SARS-CoV-2 Variants of Concern in the EU/EEA—First Update 2021. Available online: https://www.ecdc.europa.eu/sites/default/files/documents/COVID-19-risk-related-to-spread-of-new-SARS-CoV-2-variants-EU-EEA-first-update.pdf (accessed on 21 November 2021).
- Grint, D.J.; Wing, K.; Houlihan, C.; Gibbs, H.P.; Evans, S.J.W.; Williamson, E.; McDonald, H.I.; Bhaskaran, K.; Evans, D.; Walker, A.J.; et al. Severity of SARS-CoV-2 Alpha Variant (B.1.1.7) in England. Clin. Infect. Dis. 2021. [Google Scholar] [CrossRef]
- Barry, V.; Dasgupta, S.; Weller, D.L.; Kriss, J.L.; Cadwell, B.L.; Rose, C.; Pingali, C.; Musial, T.; Sharpe, J.D.; Flores, S.A.; et al. Patterns in COVID-19 Vaccination Coverage, by Social Vulnerability and Urbanicity—United States, December 14, 2020–May 1, 2021. MMWR Morb. Mortal. Wkly. Rep. 2021, 70, 818–824. [Google Scholar] [CrossRef]
- Hughes, M.M.; Wang, A.; Grossman, M.K. County-Level COVID-19 Vaccination Coverage and Social Vulnerability—United States, December 14, 2020–March 1, 2021. MMWR Morb. Mortal. Wkly. Rep. 2021, 70, 818–824. [Google Scholar] [CrossRef]
- Vokó, Z.; Kiss, Z.; Surján, G.; Surján, O.; Barcza, Z.; Pályi, B.; Formanek-Balku, E.; Molnár, G.A.; Herczeg, R.; Gyenesei, A.; et al. Nationwide Effectiveness of Five SARS-CoV-2 Vaccines in Hungary—the HUN-VE Study. Clin. Microbiol. Infect. 2021. [Google Scholar] [CrossRef]
- Ismail AlHosani, F.; Eduardo Stanciole, A.; Aden, B.; Timoshkin, A.; Najim, O.; Abbas Zaher, W.; AlSayedsaleh AlDhaheri, F.; Al Mazrouie, S.; Rizvi, T.A.; Mustafa, F. Impact of the Sinopharm’s BBIBP-CorV Vaccine in Preventing Hospital Admissions and Death in Infected Vaccinees: Results from a Retrospective Study in the Emirate of Abu Dhabi, United Arab Emirates (UAE). Vaccine 2022. [Google Scholar] [CrossRef]
- Fiolet, T.; Kherabi, Y.; MacDonald, C.-J.; Ghosn, J.; Peiffer-Smadja, N. Comparing COVID-19 Vaccines for Their Characteristics, Efficacy and Effectiveness against SARS-CoV-2 and Variants of Concern: A Narrative Review. Clin. Microbiol. Infect. 2022, 28, 202–221. [Google Scholar] [CrossRef] [PubMed]
- Kessels, R.; Luyten, J.; Tubeuf, S. Willingness to Get Vaccinated against COVID-19 and Attitudes toward Vaccination in General. Vaccine 2021, 39, 4716–4722. [Google Scholar] [CrossRef] [PubMed]
- Nehal, K.R.; Steendam, L.M.; Campos Ponce, M.; van der Hoeven, M.; Smit, G.S.A. Worldwide Vaccination Willingness for COVID-19: A Systematic Review and Meta-Analysis. Vaccines 2021, 9, 1071. [Google Scholar] [CrossRef] [PubMed]
- Rodríguez-Blanco, N.; Montero-Navarro, S.; Botella-Rico, J.M.; Felipe-Gómez, A.J.; Sánchez-Más, J.; Tuells, J. Willingness to Be Vaccinated against COVID-19 in Spain before the Start of Vaccination: A Cross-Sectional Study. Int. J. Environ. Res. Public Health 2021, 18, 5272. [Google Scholar] [CrossRef]
- Syan, S.K.; Gohari, M.R.; Levitt, E.E.; Belisario, K.; Gillard, J.; DeJesus, J.; MacKillop, J. COVID-19 Vaccine Perceptions and Differences by Sex, Age, and Education in 1367 Community Adults in Ontario. Front. Public Health 2021. [Google Scholar] [CrossRef]
- Wang, B.; Nolan, R.; Marshall, H. COVID-19 Immunisation, Willingness to Be Vaccinated and Vaccination Strategies to Improve Vaccine Uptake in Australia. Vaccines 2021, 9, 1467. [Google Scholar] [CrossRef]
- Szaszi, B.; Hajdu, N.; Szecsi, P.; Tipton, E.; Aczel, B. A Machine Learning Analysis of the Relationship of Demographics and Social Gathering Attendance from 41 Countries during Pandemic. Sci. Rep. 2022, 12, 724. [Google Scholar] [CrossRef]


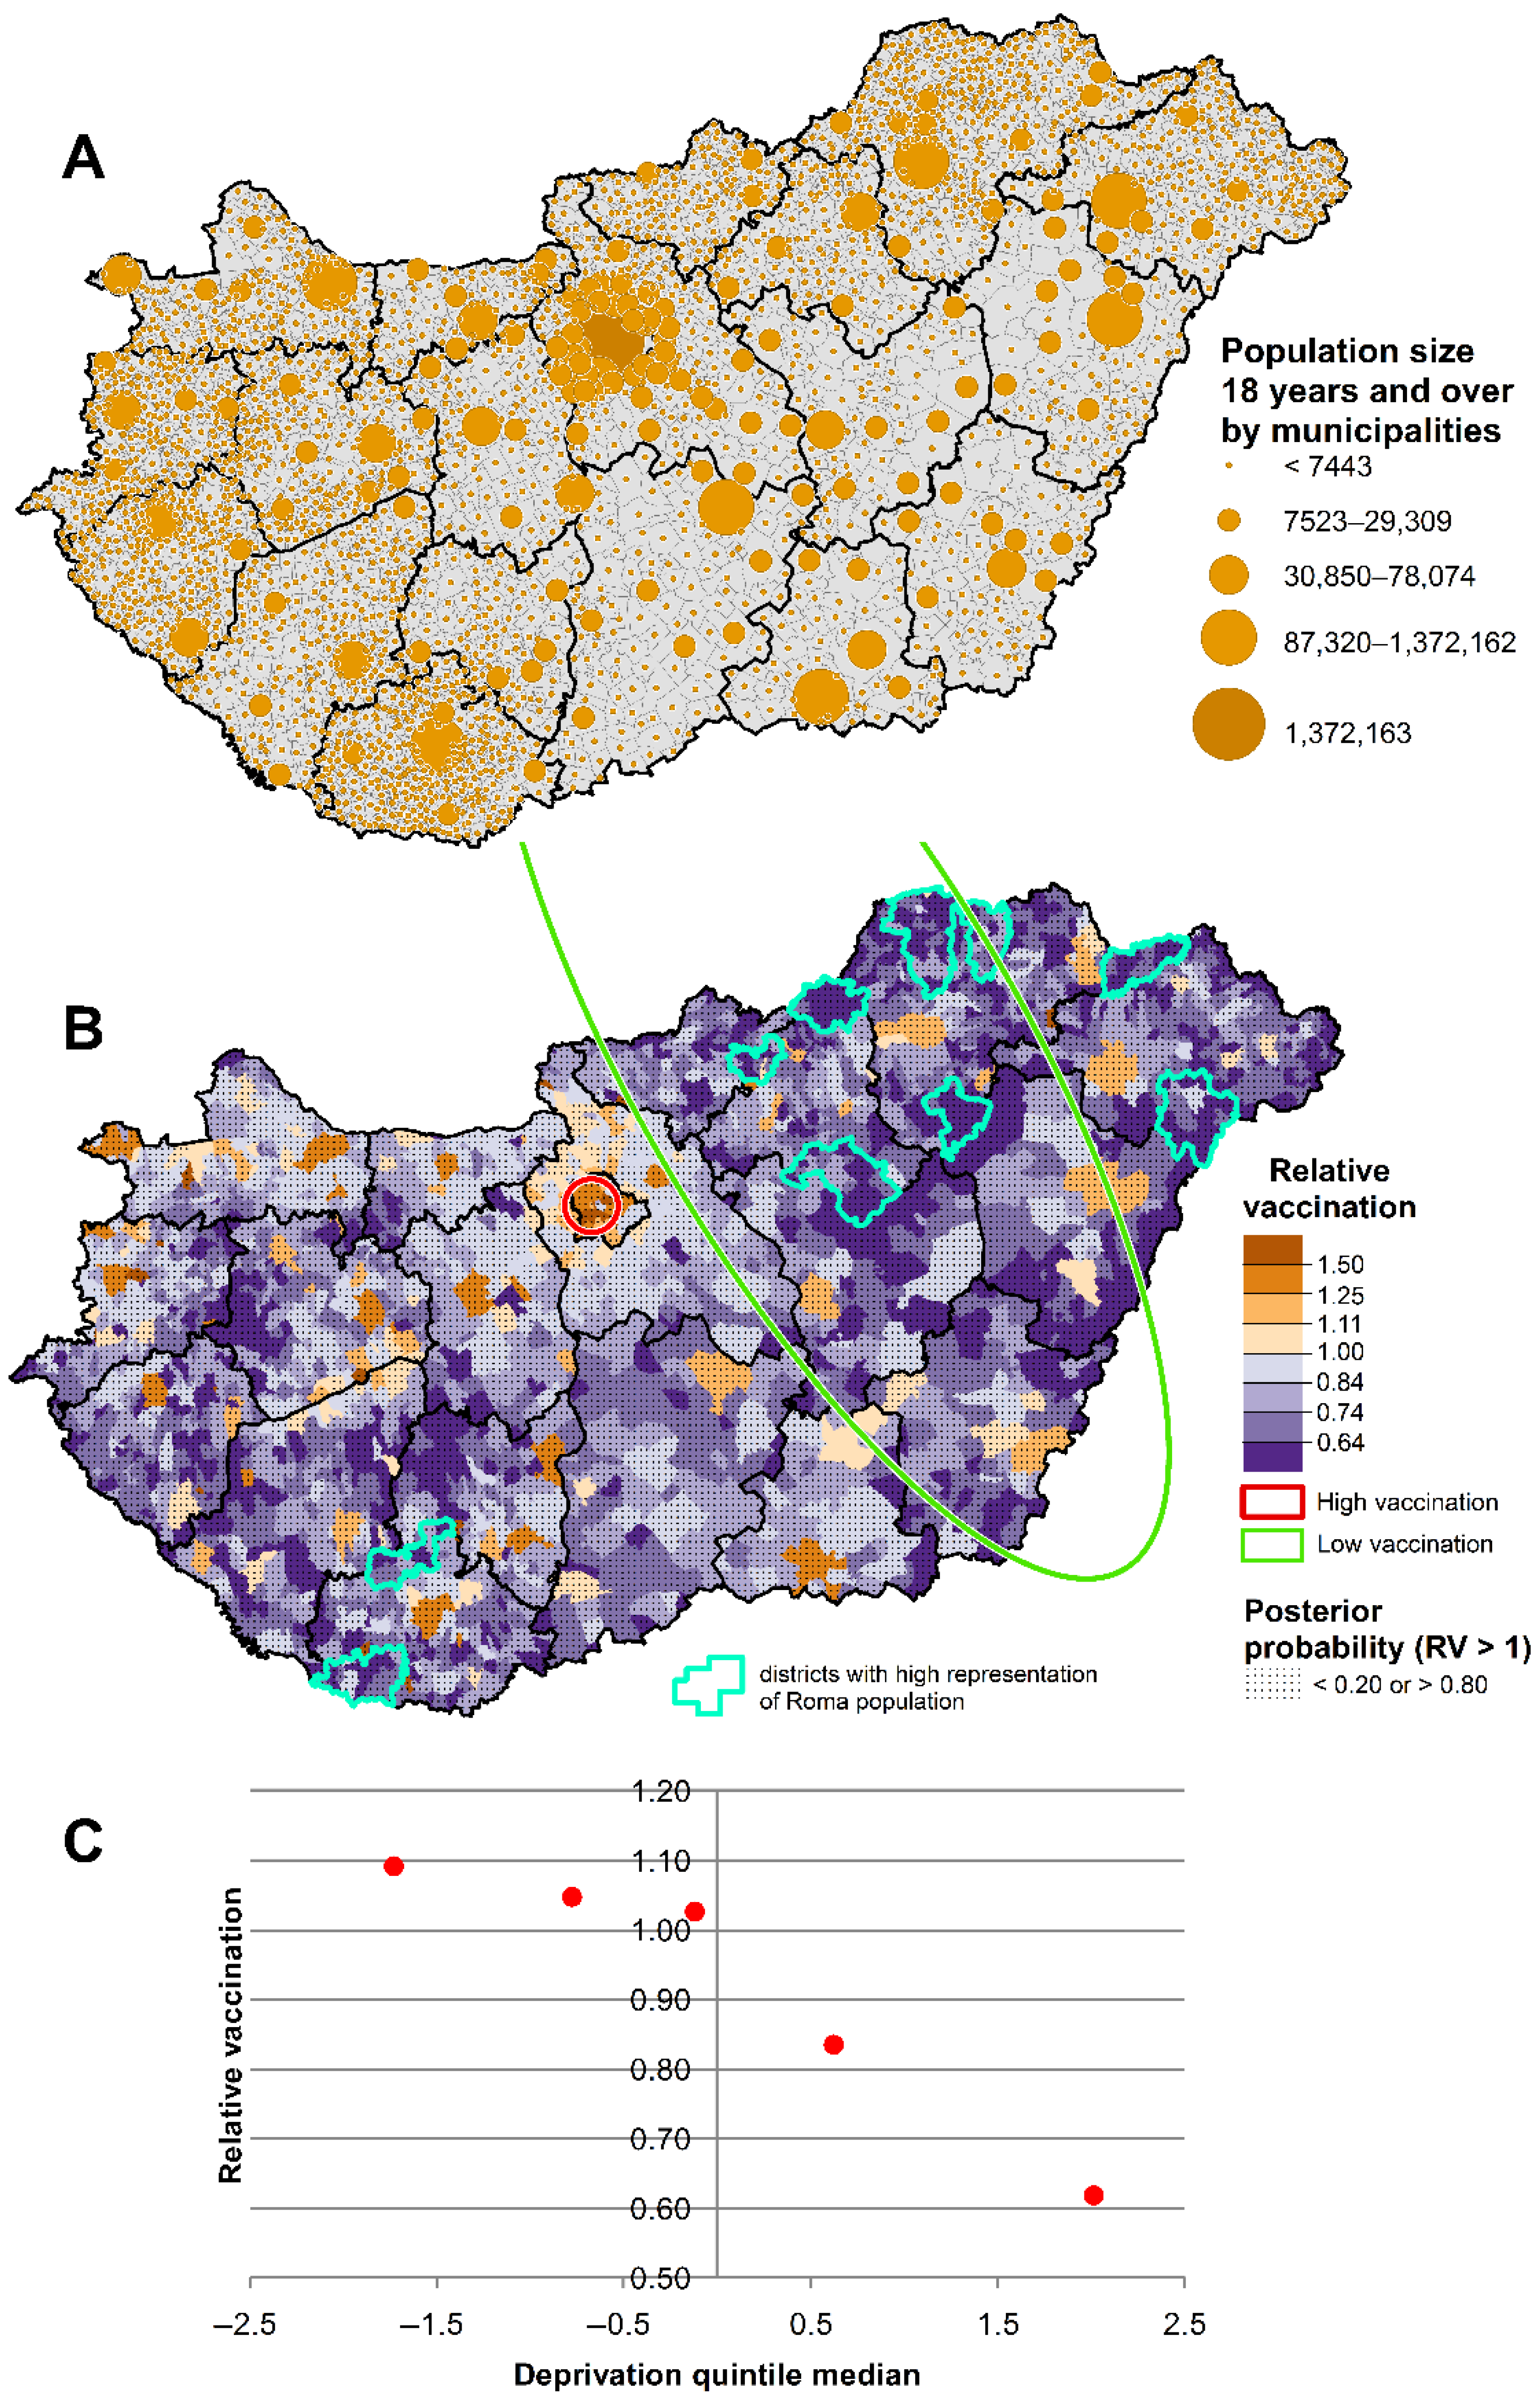
| DI Quintiles | Relative Vaccination Coverage Ratio |
|---|---|
| I. (least deprived) | 1.092 [1.090–1.095] |
| II. | 1.047 [1.045–1.049] |
| III. | 1.026 [1.024–1.028] |
| IV. | 0.834 [0.833–0.836] |
| V. (most deprived) | 0.618 [0.616–0.620] |
| Districts with highest representation of Roma population | 0.550 [0.560–0.640] |
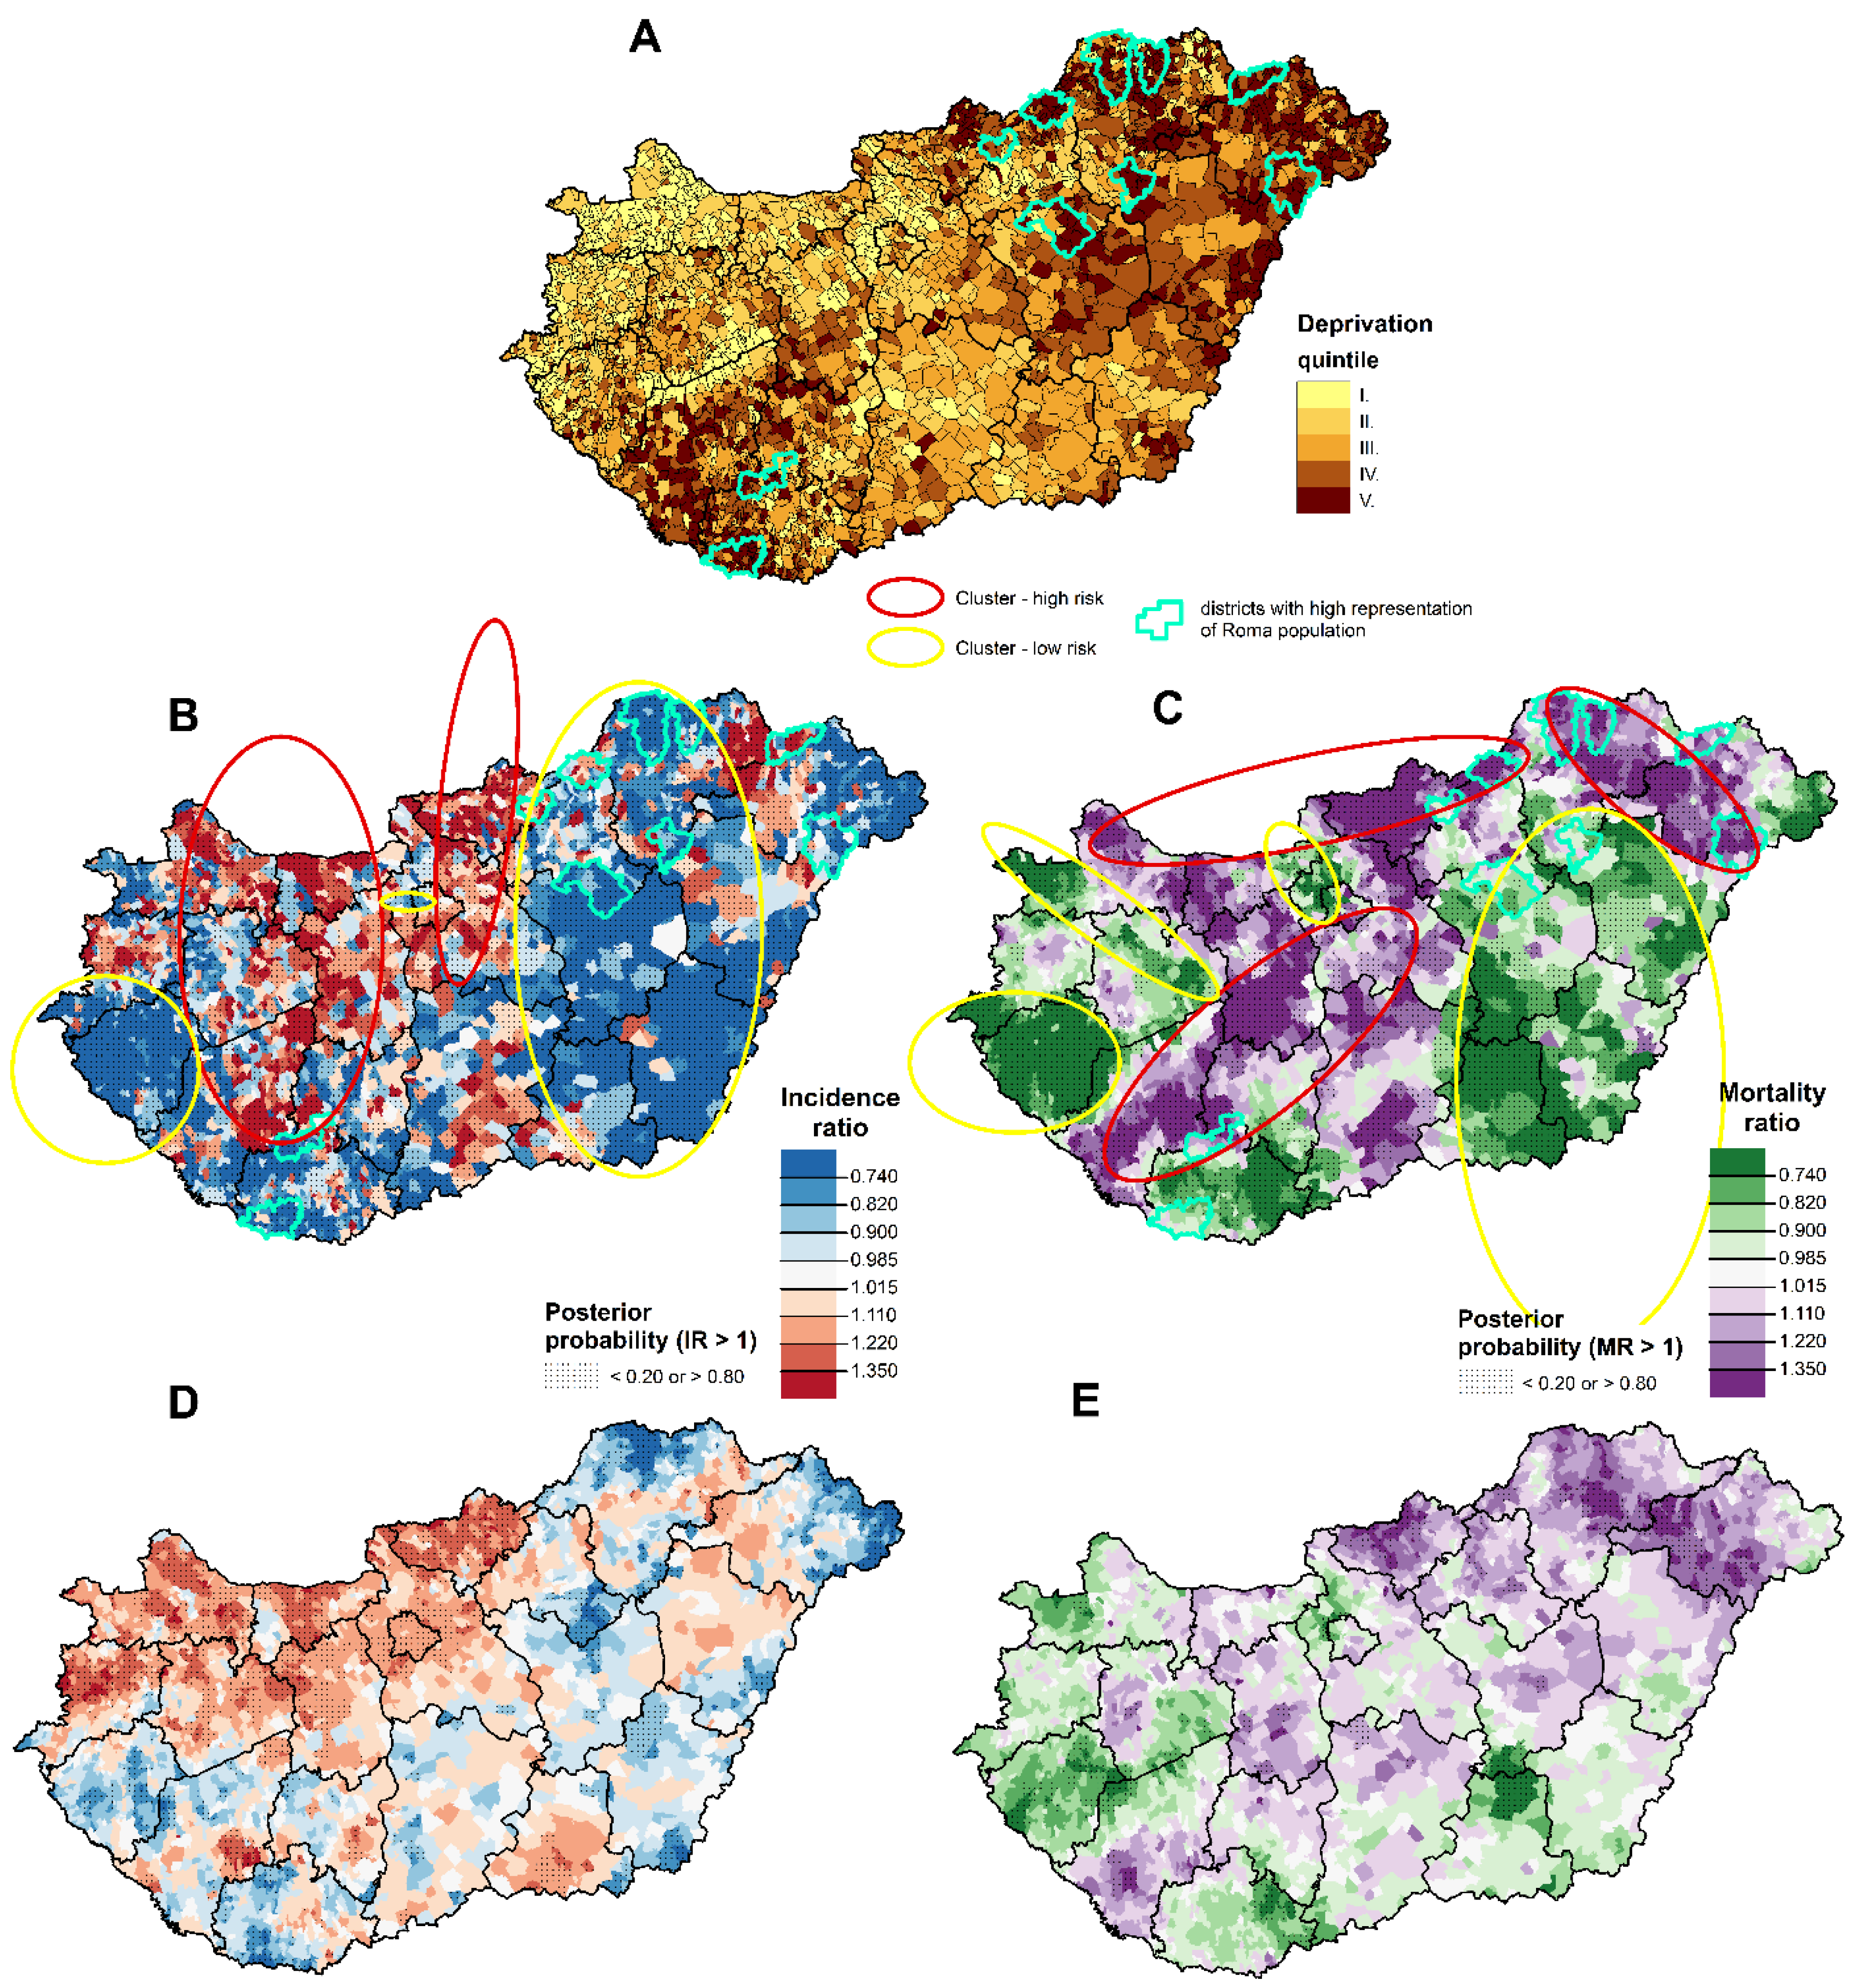
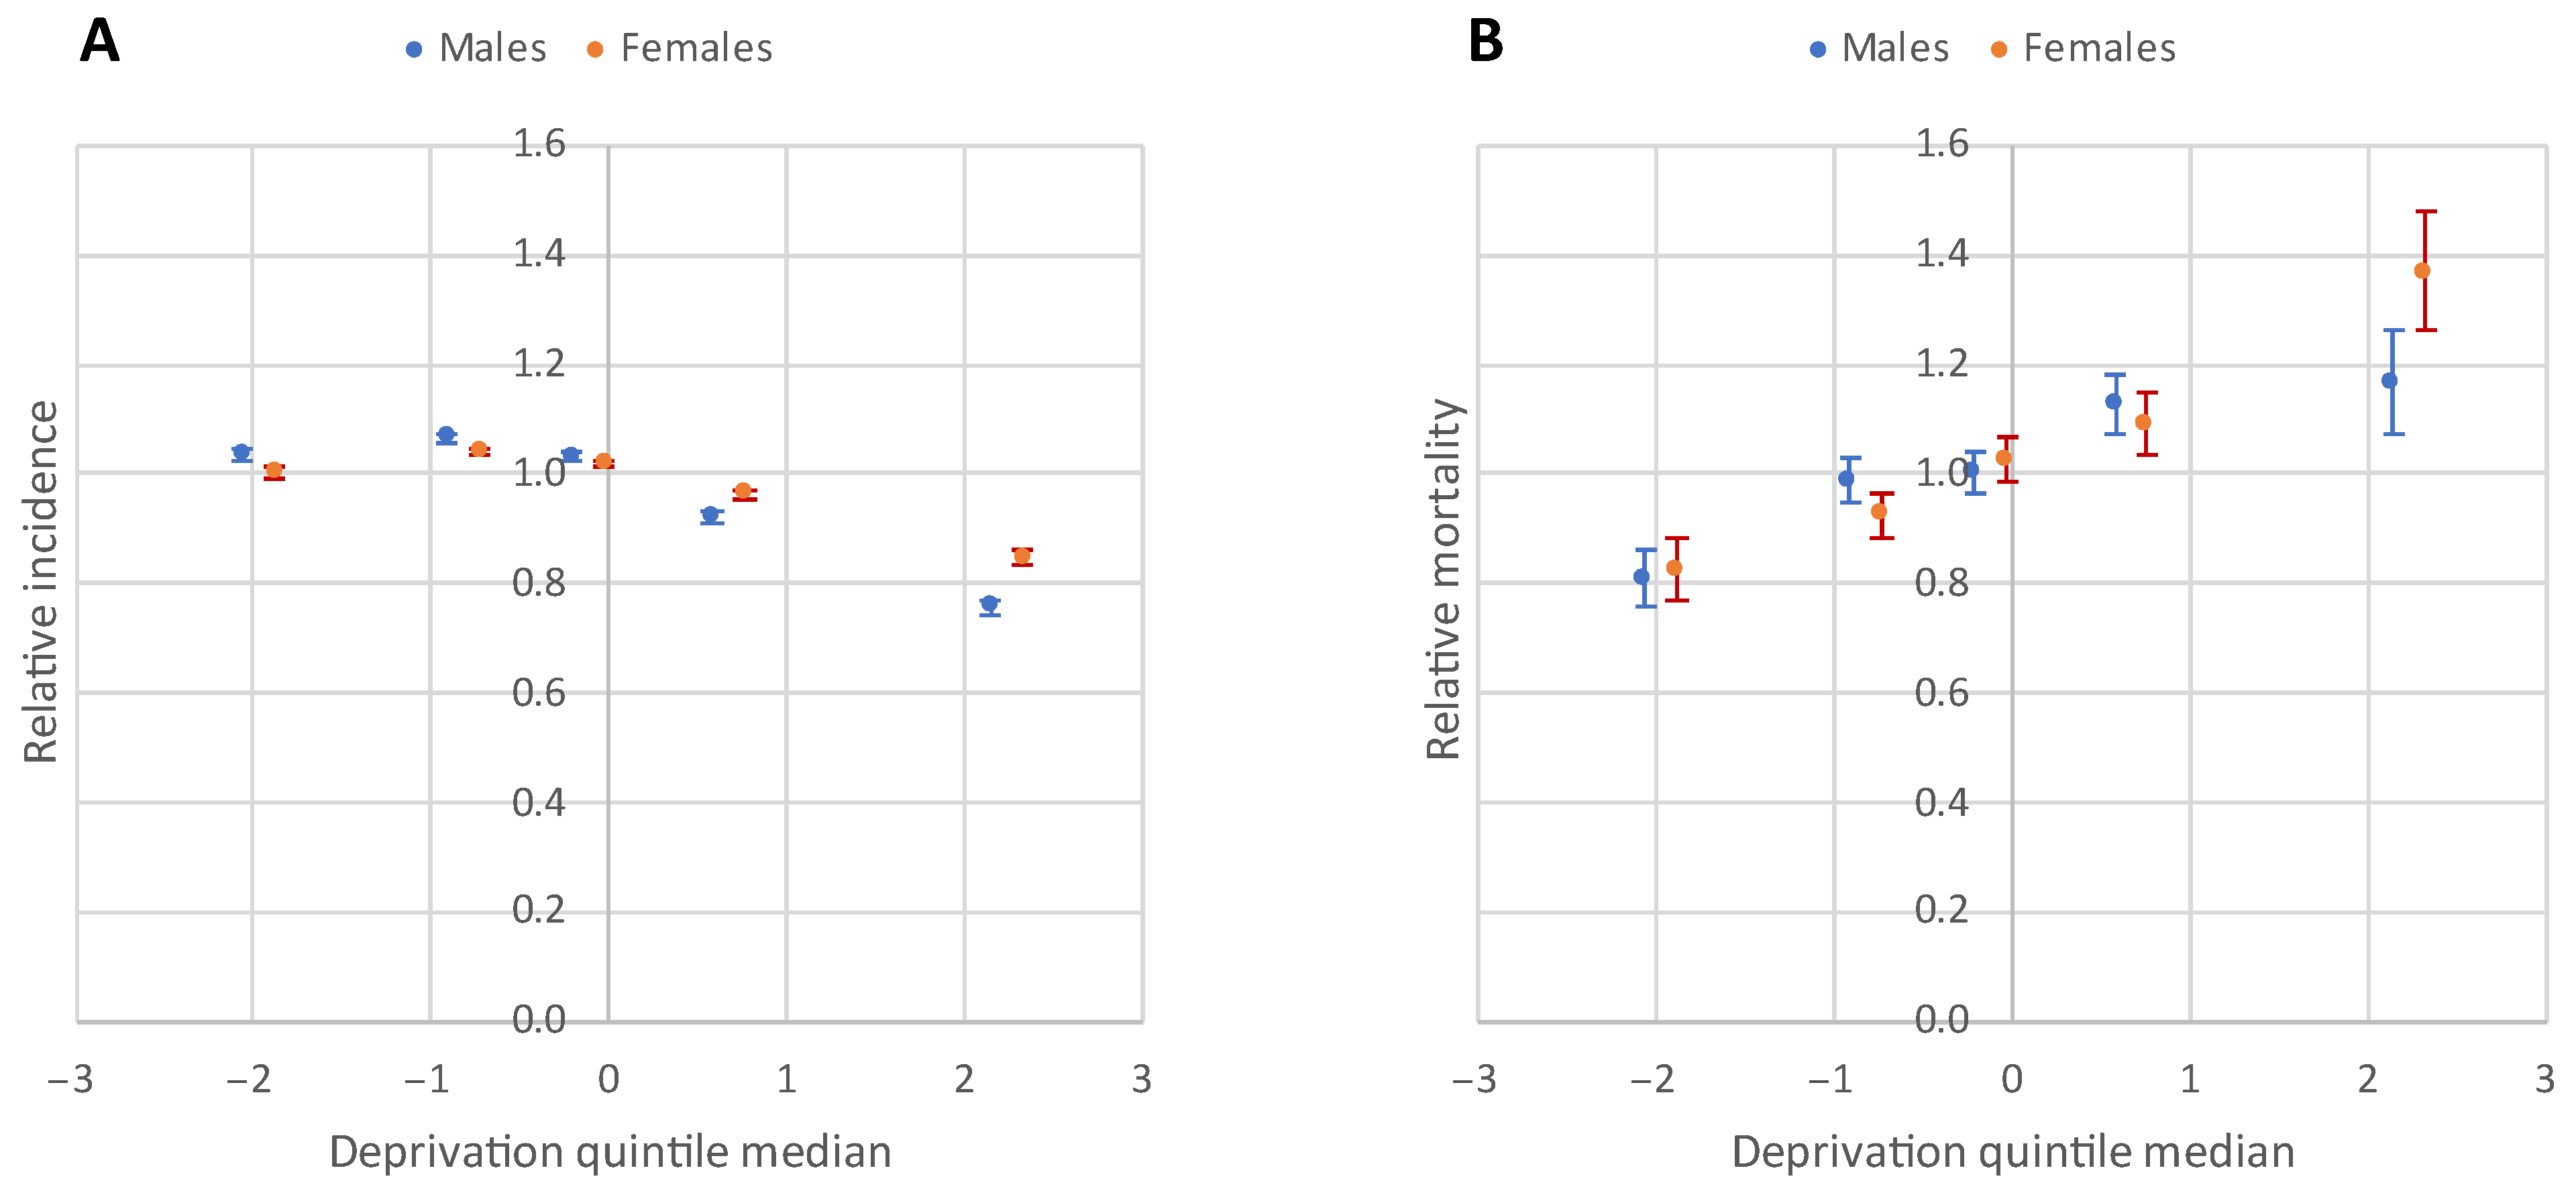
| DI Quintiles | Confirmed Cases | Relative Incidence Ratio | Death Cases | Relative Mortality Ratio |
|---|---|---|---|---|
| Males | ||||
| I. (least deprived) | 31,150 | 1.03 [1.02–1.05] | 1003 | 0.81 [0.76–0.86] |
| II. | 63,455 | 1.07 [1.06–1.08] | 2365 | 0.99 [0.95–1.03] |
| III. | 68,449 | 1.03 [1.02–1.04] | 2581 | 1.00 [0.96–1.04] |
| IV. | 35,831 | 0.92 [0.91–0.93] | 1618 | 1.13 [1.07–1.18] |
| V. (most deprived) | 12,284 | 0.76 [0.74–0.77] | 587 | 1.17 [1.07–1.26] |
| Districts with highest representation of Roma population | 4526 | 0.81 [0.79–0.83] | 230 | 1.27 [1.12–1.45] |
| Females | ||||
| I. (least deprived) | 33,719 | 1.00 [0.99–1.01] | 852 | 0.82 [0.77–0.88] |
| II. | 70,667 | 1.04 [1.03–1.05] | 2013 | 0.93 [0.89–0.97] |
| III. | 76,691 | 1.02 [1.01–1.03] | 2422 | 1.03 [0.99–1.07] |
| IV. | 41,243 | 0.96 [0.95–0.97] | 1440 | 1.09 [1.04–1.15] |
| V. (most deprived) | 14,477 | 0.85 [0.83–0.86] | 613 | 1.37 [1.26–1.48] |
| Districts with highest representation of Roma population | 5550 | 0.92 [0.90–0.95] | 255 | 1.53 [1.35–1.73] |
Publisher’s Note: MDPI stays neutral with regard to jurisdictional claims in published maps and institutional affiliations. |
© 2022 by the authors. Licensee MDPI, Basel, Switzerland. This article is an open access article distributed under the terms and conditions of the Creative Commons Attribution (CC BY) license (https://creativecommons.org/licenses/by/4.0/).
Share and Cite
Oroszi, B.; Juhász, A.; Nagy, C.; Horváth, J.K.; Komlós, K.E.; Túri, G.; McKee, M.; Ádány, R. Characteristics of the Third COVID-19 Pandemic Wave with Special Focus on Socioeconomic Inequalities in Morbidity, Mortality and the Uptake of COVID-19 Vaccination in Hungary. J. Pers. Med. 2022, 12, 388. https://0-doi-org.brum.beds.ac.uk/10.3390/jpm12030388
Oroszi B, Juhász A, Nagy C, Horváth JK, Komlós KE, Túri G, McKee M, Ádány R. Characteristics of the Third COVID-19 Pandemic Wave with Special Focus on Socioeconomic Inequalities in Morbidity, Mortality and the Uptake of COVID-19 Vaccination in Hungary. Journal of Personalized Medicine. 2022; 12(3):388. https://0-doi-org.brum.beds.ac.uk/10.3390/jpm12030388
Chicago/Turabian StyleOroszi, Beatrix, Attila Juhász, Csilla Nagy, Judit Krisztina Horváth, Krisztina Eszter Komlós, Gergő Túri, Martin McKee, and Róza Ádány. 2022. "Characteristics of the Third COVID-19 Pandemic Wave with Special Focus on Socioeconomic Inequalities in Morbidity, Mortality and the Uptake of COVID-19 Vaccination in Hungary" Journal of Personalized Medicine 12, no. 3: 388. https://0-doi-org.brum.beds.ac.uk/10.3390/jpm12030388