1. Introduction
Every year, the share of services production is increasing in the structure of the economy of developed countries of the world. Studying the problem of the financial stability assessment of the respective service enterprises is an important aspect of the industry’s development. The market conditions of the economy and the problems of financial support for the activity of the service sector enterprises (SSE) necessitate the change of the financial and economic policy and the qualified assessment of the financial state with a view to the functioning of SSEs in crisis situations and their further economic growth.
Over the past decades, the service sector (SS) has become a significant source of innovation and economic growth. In the member countries of the Organization for Economic Cooperation and Development (OECD), SS covers about 3/4 of total employment and gross output (
National Accounts—Analysis of Main Aggregates 2019). Hence, that SS is the largest sector of the economy, there is a need, on one hand, to explain the mechanism of the transition to a post-industrial economy and, on the other hand, to study the factors that cause structural changes.
These stylized facts are well traced in the example of the US economy. In 1810, the share of people employed in the US agricultural sector was about 80%. Two hundred years later, this share was already 1.5%. The share of those employed in SS in 1810 was about 10%, and in 2010—about 80% of total employment (
National Accounts—Analysis of Main Aggregates 2019).
Assessment of financial condition is an integral part of the economic analysis of the enterprise, without which it is impossible to rationally manage the economy of any entity.
Acharya et al. (
2017),
Liu and Arunkumar (
2018),
Wagner (
2017) have made a major contribution to the development and solution of the problem of financial stability. However, it is not enough to have only retrospective information on the financial state of an enterprise to study the financial stability of the SSE. The basis of the assessment is estimated figures of the financial stability, which can be obtained primarily through its modeling.
The following studies are devoted to the implementation of models, methods, and information technologies for financial analysis of enterprises’ activities:
Adrian et al. (
2018),
Fazio et al. (
2018),
Nyman et al. (
2018), who have developed methods of calculation and analysis of indicators of the enterprise’s financial condition.
Despite its difficulty of creating, the financial stability calculation system on the basis of mathematical models using modern information technologies is a powerful tool for solving the above problems, which determines the objective need for further development of the basic theoretical approaches and practical ways of ensuring sustainable financial development of the SSE. However, the problems of managing the financial stability of SSEs, which have significant specificity of activity, have not been sufficiently addressed in the works of these scientists. Thus, the development of models for assessing the financial stability of the SSE is an urgent scientific task, defining the topic of the work, its goals, and objectives.
Coefficient analysis is one of the methodological approaches to assessing the financial condition of enterprises. The essence of the analysis of financial position by the coefficient method is the calculation of relative indicators as the ratio of absolute indicators of assets and liabilities of the balance (
Leva et al. 2017).
The analysis of financial coefficients is to compare their values with the baseline values, as well as to study their dynamics over the reporting period and over several years. The values of indicators of the enterprise for the past year, industry average values of indicators, and values of indicators of the most promising enterprises can be used as the base values (
Afonso et al. 2018). In addition, as bases of comparison can be theoretically substantiated or obtained as a result of expert assessments of the value characterizing optimal or critical (limit) values of indicators in terms of stability of financial conditions.
There is a large number of works (
Singh et al. 2018;
Almasi et al. 2017) on the coefficient analysis of the financial condition of enterprises. They propose the calculation of a certain number of financial coefficients for a given period of operation of the enterprise, followed by a comparison of the values of these coefficients with similar coefficients of other enterprises or with the critical values of these coefficients. However, analytical methods that have been tested and proved to be of practical value at the micro level may not always be feasible or appropriate for the analysis of generalized information (
Agénor and da Silva 2017).
If it is sufficient for the researcher to know how the financial state of the enterprise changed by a train of a certain period or in comparison with its competitors, then the tasks for the analysis of the financial state of the enterprises at the regional level are much more complicated and wider in the state (
Culpeper 2018;
Kryshtal 2019).
For this purpose, it is necessary, first of all, to have a small complex number of indicators that reflect the main characteristics of the financial condition of the enterprise and allow performing timely identification of changes in the general development trends (
Chang et al. 2018) and, second, to develop a methodology for determining the baseline values of these indicators, which can be used to compare certain sets of enterprises combined by certain criteria (the type of activity, region, ownership, etc.) (
Nasreen et al. 2017).
The analysis of scientific literature (
Lin et al. 2018) shows that there are different views on the construction of the system of financial coefficient, its structure, and typology. Depending on the purpose of the financial analysis, the authors use different approaches to grouping and classifying coefficients.
Financial stability is a reflection of a stable excess of income over expenses, provides free maneuvering of the organization’s funds, and, through their effective use, contributes to the uninterrupted process of production and sales of products (
Anton 2018).
Consequently, financial stability is the main element of the overall stability of enterprises and is considered as the stability of the financial condition, the ability to fulfill obligations to creditors, the budget and owners by balancing their own financial resources and loans. At the same time, there are four types of financial stability: internal, external, “inherited”, and general.
Financial stability is the most important characteristic of the financial and economic activity of an enterprise in a market economy. If an enterprise is financially stable, then it has an advantage over other enterprises of the same profile and attraction of investments, in obtaining loans, in choosing suppliers, and in the selection of qualified personnel. Finally, it does not come into conflict with the state and society since it pays timely taxes to the budget, contributions to social funds, and wages—to workers and employees, dividends—to shareholders, and guarantees to banks the loss of loans and payment of interest on them.
The higher the stability of an enterprise, the bigger it is, regardless of an unexpected change in market conditions and the less the risk of being on the verge of bankruptcy.
The purpose of the work is to develop models for assessing the financial stability of a service enterprise to objectively analyze its financial status and make effective management decisions to ensure sustainable development.
The scientific novelty of the study lies in solving a new, important for the economy, the task of modeling the processes of assessing the financial stability of enterprises in the service sector, which provides for an increase in their overall efficiency.
The assessment of financial condition is an integral part of the economic analysis of the enterprise, without which it is impossible to rationally manage any business entity.
The main areas of crisis management at the level of the business entity are constant monitoring of the financial and economic condition of the enterprise, development of new management, financial and marketing strategies, reduction of fixed and variable costs, increasing productivity, attracting funds of founders, and strengthening staff motivation.
The study of the concept of financial stability has been conducted by many scientists, but there is no single view on the solution and study of this concept, The issue of the essence of financial stability of the enterprise, the factors that provide it, and the assessment of financial stability through mathematical modeling remains open.
2. Materials and Methods
In order to understand what methods are used in the article, we first consider the general methodology of the study.
The following research methods were used to solve the purpose of the work: conceptual and categorical analysis—for studying the concept of “financial stability of the service sector enterprise”; analytical method—for theoretical generalization of scientific concepts of financial analysis; expert assessments method; economic and mathematical methods—for constructing an integral indicator of the financial stability assessment of the service sector enterprise and determining the optimal form of change for the coefficients of the integral indicator; induction and deduction method—when studying the theoretical and methodological foundations, based on the principles of economic theory on one hand, and on the conceptual bases of economic and mathematical modeling on the other; comparison method—for studying the coefficients of influence on the financial condition of the enterprise and assessing their significance; economic and mathematical modeling method—for development of models of the financial stability assessment of the service sector enterprise; methods of random variables and fuzzy sets—for the numerical expression of the seasonality coefficient as a linguistic variable and the factors of influence on the regional location of the service sector enterprise.
The information base of the research consists of materials of scientific-practical conferences, scientific works of scientists, monographs, collections, periodicals of domestic and international organizations, resources of the Internet, financial statements of enterprises, as well as the author’s own calculations.
To assess the level of financial stability, the indicators presented in
Appendix A are used.
In our opinion, it is necessary to dwell in more detail on the modified Shewhart chart methodology.
To investigate the stability and controllability of the coefficients of influence on the financial stability of the enterprise, the use of the Shewhart control charts (SCC) is suggested. Control charts do not solve the issues that are usually posed before statistical procedures.
Instead of looking for a theoretical model for data obtained for some well-defined phenomenon, one can decide using the control chart whether it is possible to use a sequence of data to predict what will happen in the future. When predictions are possible and done appropriately, control charts become the basis of such predictions. When prophecy is impossible or unsuitable through unmanageable variations, control charts will warn of this instability.
The Shewhart chart requires sample process data obtained at approximately equal intervals. Intervals can be set either by time (for example, hourly) or by the amount of production (each batch). As a rule, each subgroup consists of the same type of products or services with the same controlled indicators, and all subgroups have the same volume. For each subgroup, one or more characteristics such as the arithmetic mean of subgroup X and the scope of the subgroup R, or the sample standard deviations.
The Shewhart chart is a graph of the values of the found characteristics of subgroups depending on their numbers. The chart has a centerline corresponding to the reference value of the characteristic. When evaluating whether a process is in a statistically controlled state, the arithmetic mean of the data considered is usually the reference. During the management, the long-term value of the characteristic set in the technical conditions, or its nominal value based on preliminary information about the process, or the intended target value of the characteristic of the product or service, serves as the reference process. The Shewhart chart has two control limits (which are defined statistically) relative to the centerline (CL), which are called the upper control limit (UCL) and the lower control limit (LCL).
3. Results
The successful functioning of enterprises in the conditions of unstable economic situation is possible only under the condition of overcoming of the crisis phenomena, which may arise at the appropriate stage of their development. This can be done through timely analysis of the financial stability of the enterprise. The detailing of the procedural side of the financial stability analysis methodology depends on the goal, tasks, and various factors of information, temporary, methodological, technical, and personnel support. However, it should be noted that the results of formalized analytical procedures performed should not be the only and unconditional criterion for making a decision.
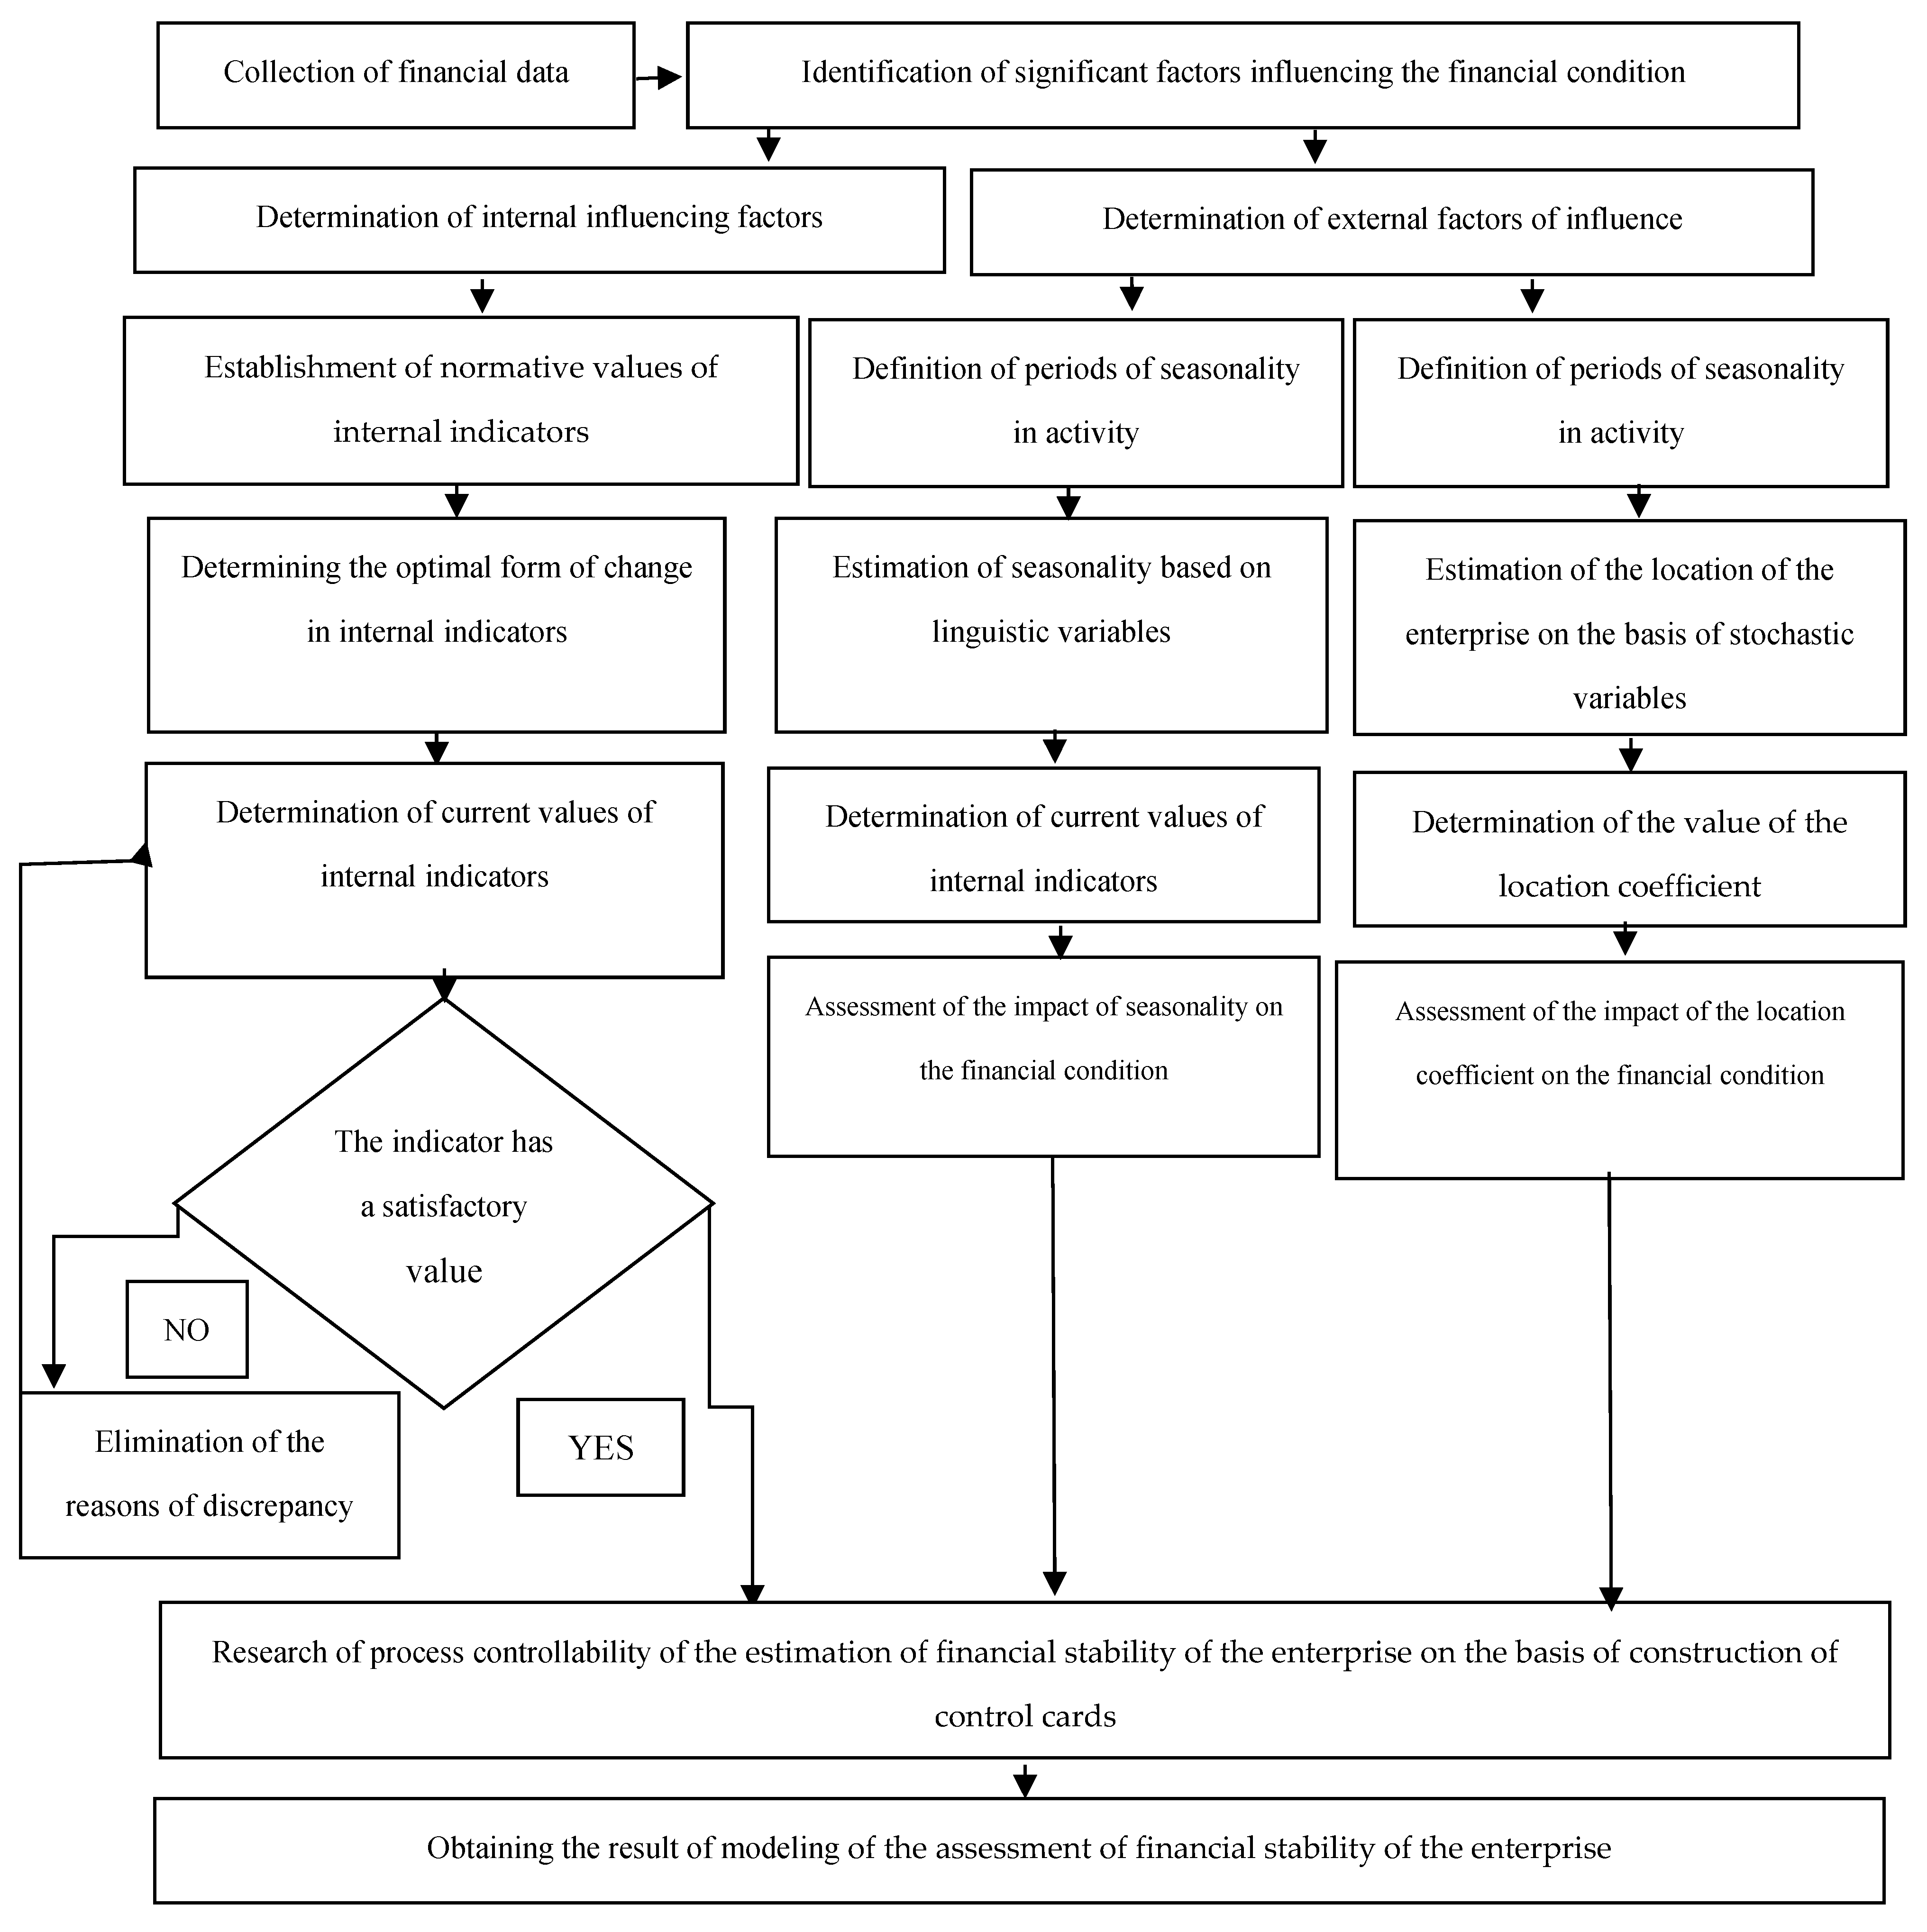
Modeling the assessment of the financial stability of a service sector enterprise is a laborious process. To model the assessment of the financial stability of an enterprise, various factors of influence on it, which were described in the first chapter of the candidate’s work, are taken into account.
Modeling the assessment of the financial stability of the SSE includes:
- -
determination of significant factors of influence on the financial condition;
- -
determination of internal and external factors of influence;
- -
establishment of normative values of internal indicators and the optimal form of changing these indicators;
- -
determination of the current values of internal indicators of a service sector enterprise;
- -
determination of the periods of seasonality and factors of the location of the service sector enterprise;
- -
estimation of the seasonality coefficient based on linguistic variables and estimation of the location coefficient based on stochastic variables
- -
defuzzification of the value of the coefficient of seasonality and determination of the coefficient of location, assessing the impact of external factors on the financial condition of a service enterprise;
- -
construction of a matrix of pairwise comparisons of external and internal coefficients of influence on the assessment of the financial stability of an enterprise in the service sector on its basis, to determine the priority of the coefficients;
- -
study of the controllability of the process of assessing the financial stability of a service sector enterprise by building Shewhart control charts for each coefficient;
- -
building a model of an integral indicator of the financial stability of the SSE;
- -
implementation of a model for assessing financial stability by using an expert system;
- -
obtaining research results.
As a result of the above-described process, an algorithm for modeling the system for assessing the financial stability of a service sector enterprise was developed (
Figure 1).
In order to study the coefficients of the financial stability assessment of the service sector enterprise with the help of the Shewhart charts, their calculation on the financial statements of the enterprise is carried out.
For control charts using quantitative data, a normal (Gaussian) distribution of deviations within the samples is provided, and deviations from this assumption influence the performance of the charts. The coefficients for the calculation of the control limits are derived under the condition of a normal distribution. Since most control limits are used only as empirical criteria in decision making, it is advisable to neglect small deviations from normality. In any case, due to the central limit theorem, sample averages have a distribution that approaches normal with the increase in the sample amount even when individual observations do not obey the normal law. This justifies the assumption of normality for X-charts even with such small sample amounts as 4 or 5 units taken for control.
Quantitative data charts can describe sample process data because of scattering (variability from unit to unit) and because of the center position (process average). Therefore, control charts for quantitative data are almost always used and analyzed in pairs—one chart for the position of the center and one for the scatter. Pairs of X- and R-charts are most commonly used.
Table 1 and
Table 2 and the formulas of the control limits and the coefficients for the corresponding charts are given.
Table 2 presents the coefficients for the calculation of the Shewhart chart control lines.
The purpose of the process management system is to obtain a statistical signal of the presence of special (non-random) causes of variations. The systematic elimination of special causes of excessive variability puts the process in a state of statistical controllability. If the process is in a statistically controlled state, the product quality can be predicted, and the process is fit to meet the requirements set out in the regulatory documents.
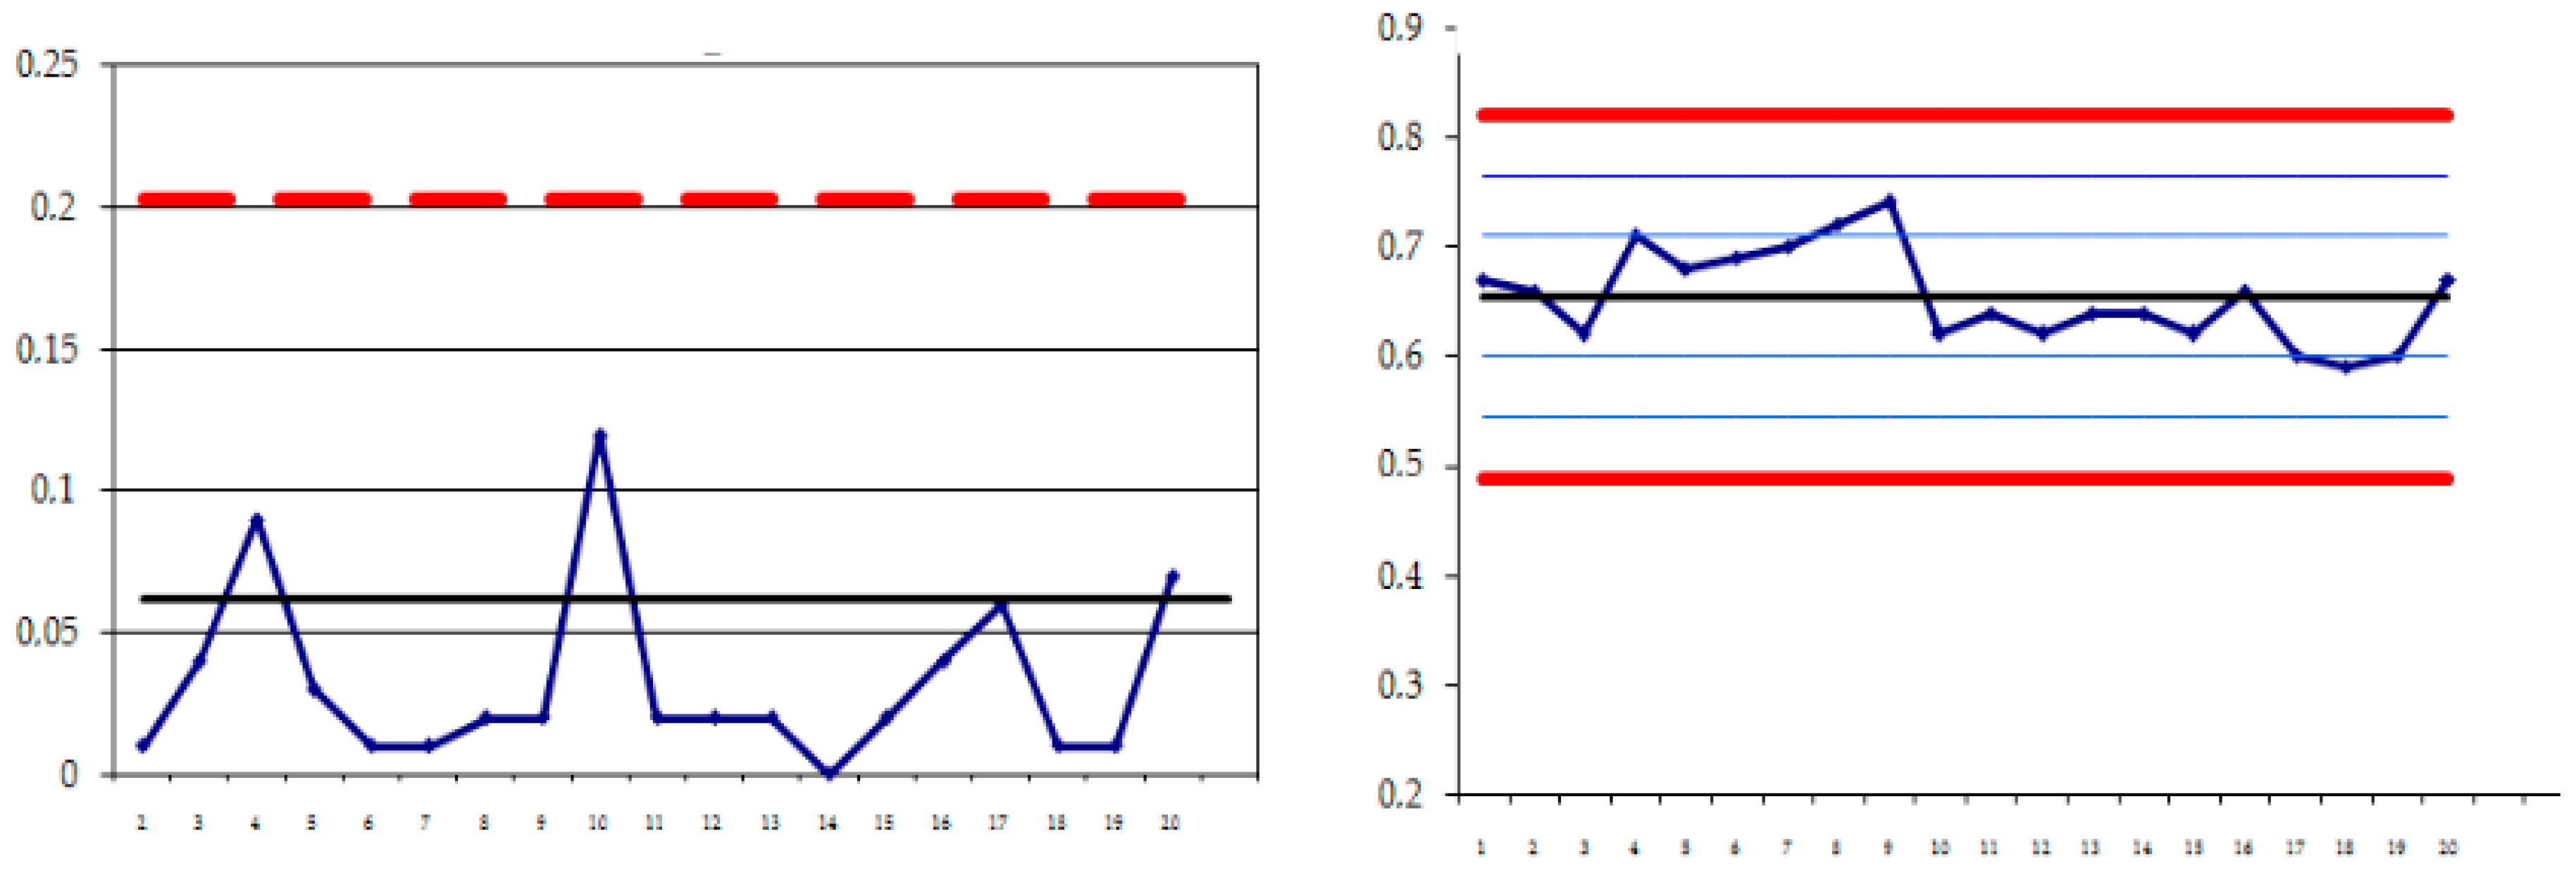
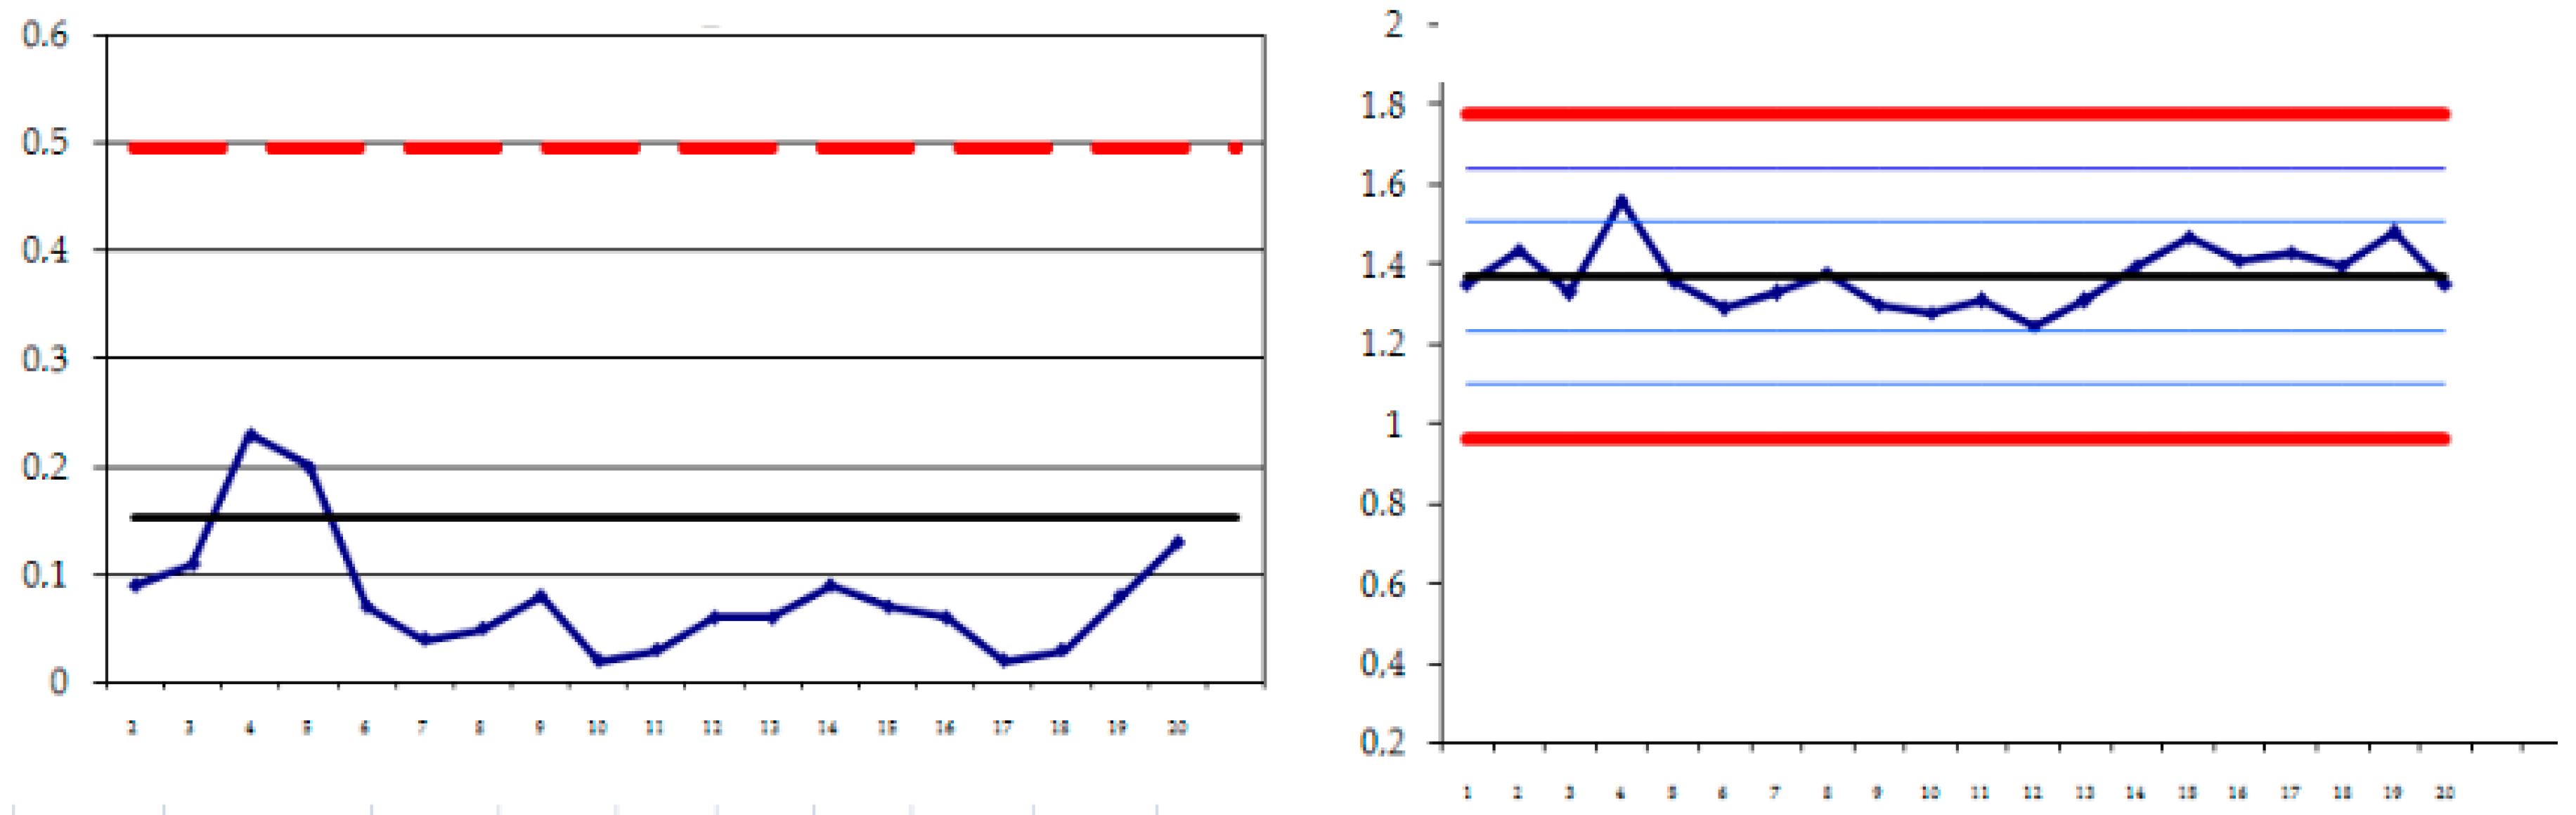
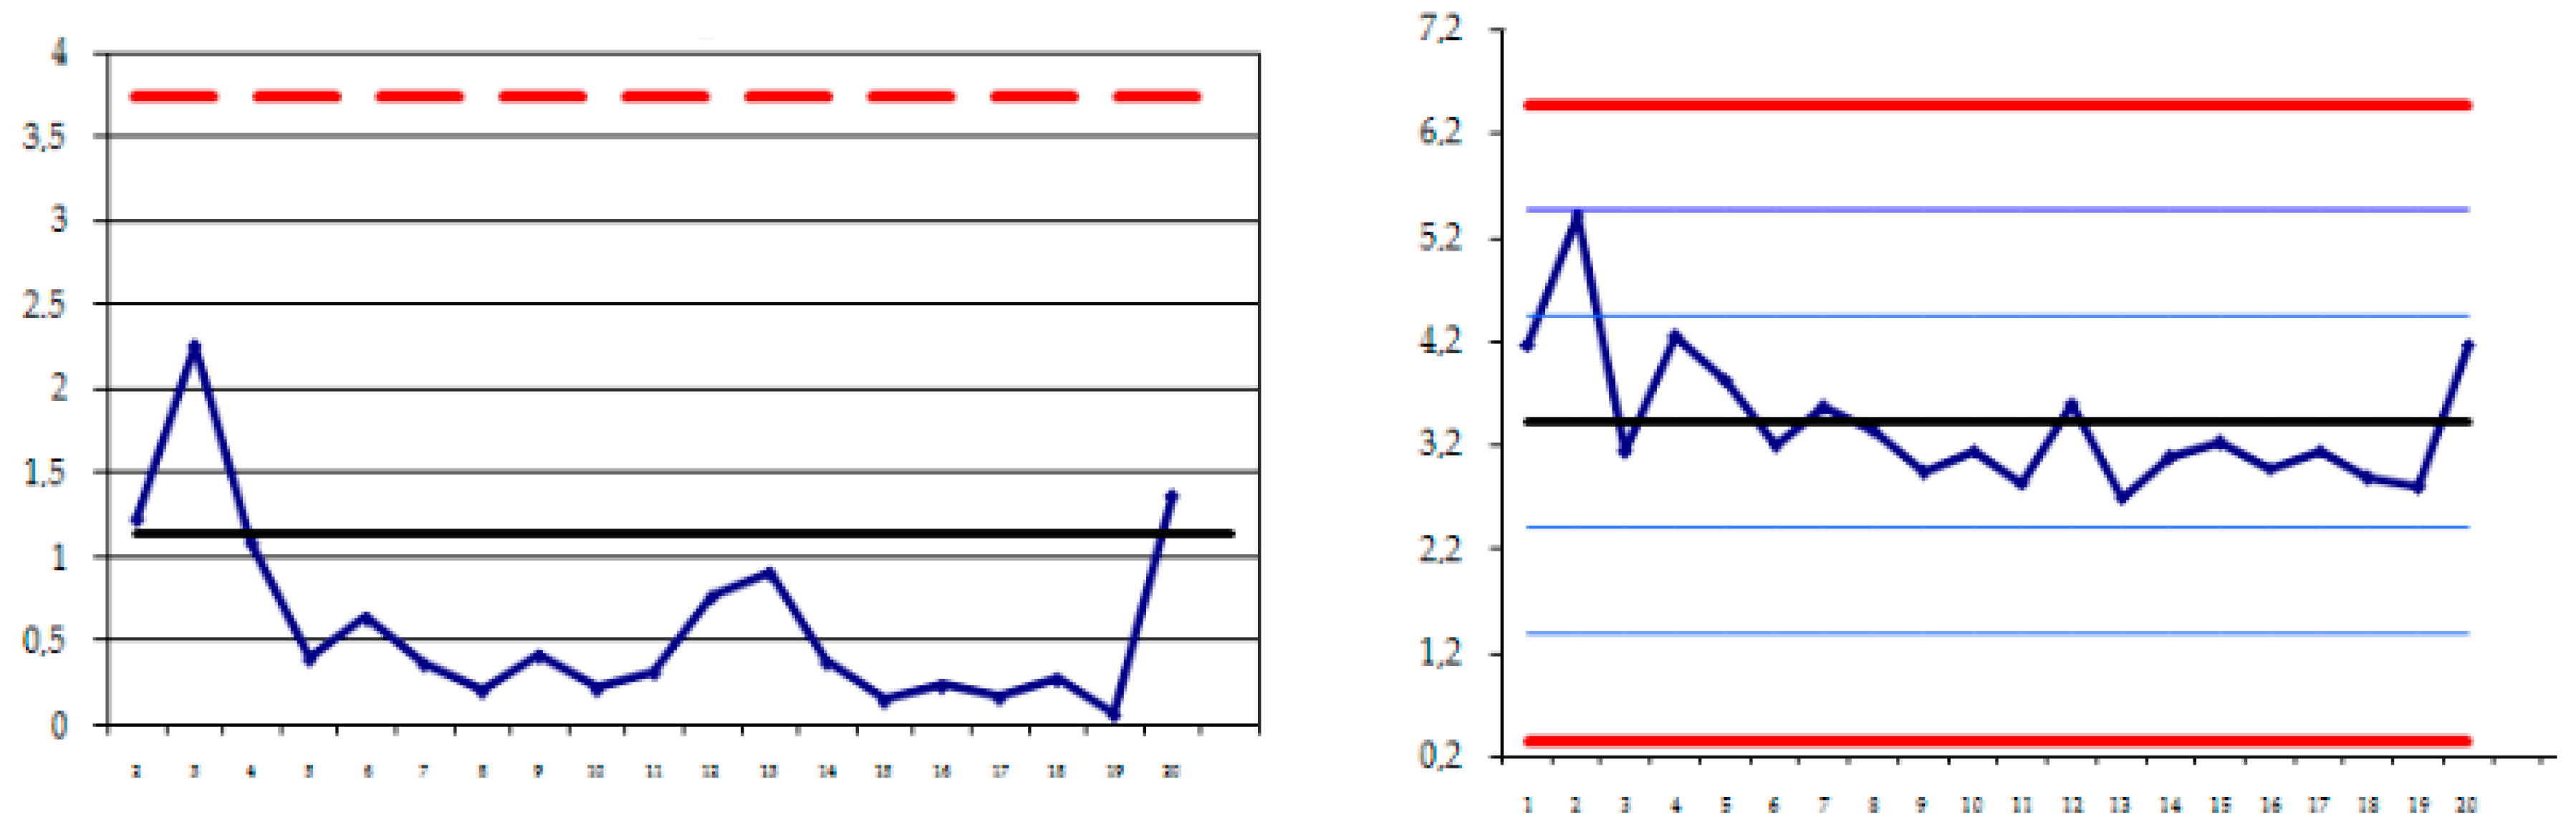
The process capabilities are determined by the total variability (process scatter) caused by common causes, that is, the minimum variability that remains after eliminating all non-random causes. The process capabilities are represented by process indicators in a statistically controlled state. The process is first brought to this state, and then its capabilities are determined. Thus, it is necessary to start determining the process capabilities after the control problems with X- and R-charts are solved, that is, specific causes are identified, analyzed, corrected, and their repetitions are diverted, and the current control charts demonstrate the persistence of the process in a statistically controlled state, at least for 25 subgroups. The process output data scatter is then compared with the specifications to confirm that these requirements can be confidently met. The criteria for the specific reasons for the Shewhart charts are presented in
Figure 2,
Figure 3 and
Figure 4. The calculation of Shewhart charts is performed in Microsoft Excel.
As can be seen from
Figure 3, the impact of seasonal activity on the financial condition of the service sector enterprise is very large. In the “high season”, the net profit increases, and therefore the financial position of the enterprise is in the stage of growth, which, to a certain extent, requires a possible increase in labor resources, additional raw materials, and also increases the investment attractiveness. The lowest income is in the December–February, the “low season”, which indicates the deterioration of the financial situation. This period encourages management to reduce labor resources, search for product sales, hotel services, and find ways to increase investment attractiveness.
One example of a solution to the problem of seasonality is the widespread system of contracts with companies that provide the hotel with business travelers.
Let us consider some measures that help reduce the seasonality index of a service sector enterprise:
the provision of several types of services, the demand for which fluctuates in the antiphase (seasonal decline or rise). For example, targeting vacationers in high season and business travelers in low season;
seasonal pricing policy—the use of progressive pricing depending on the expected consumer demand for a particular hotel service, as well as their ability to respond to such changes;
the widespread use of the mass media to generate demand for services and attract customers by alerting them to the properties and quality of services provided;
the use of progressive forms of customer service to shape the competitive advantage of the enterprise in the market;
comprehensive improvement of the provision of the services for the establishment of the enterprise in the competitive market;
formation of a base of regular customers and discount system for them;
formation of special package deals in the low season, for example, three nights for the price of two ones;
registration in the systems of reservation and use of contracts with corporate clients.
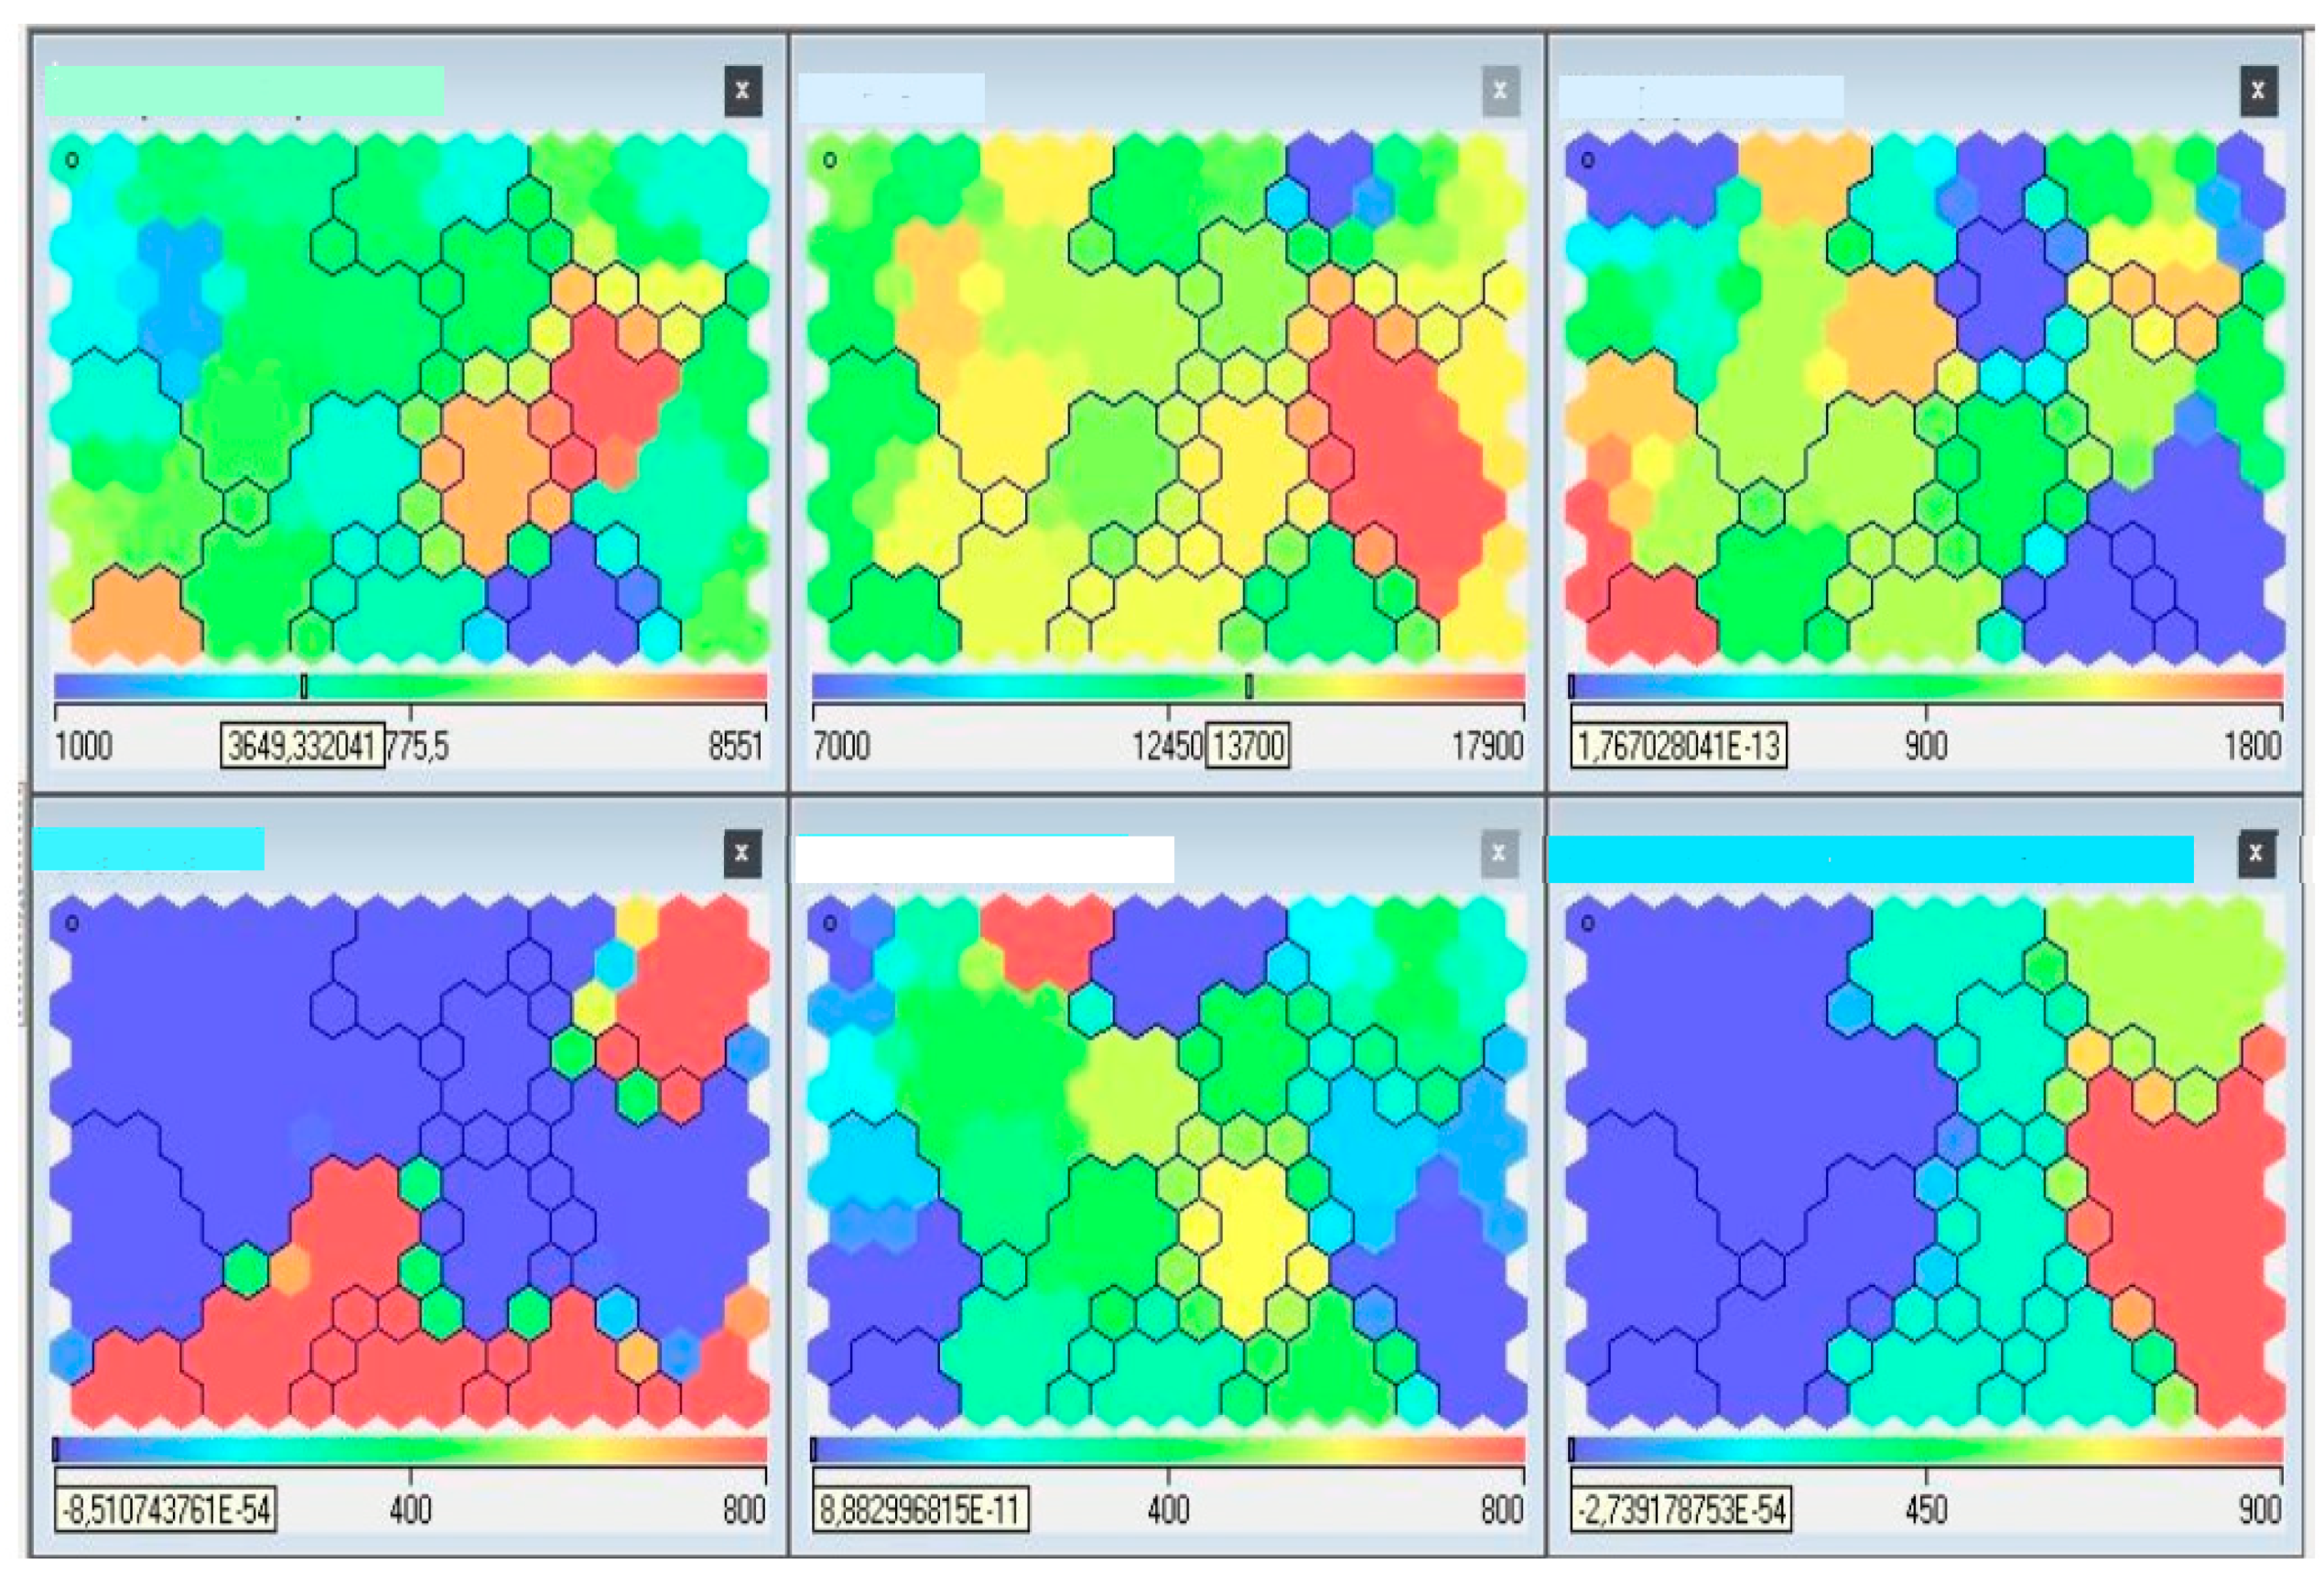
For example, we will analyze the company’s services and segment the visitor base, build profiles of service users by identifying their similar behavior in terms of frequency, type of services ordered and evaluate the most and least profitable segments. To analyze and to build a map of Kohonen, we use data from the company “HOTEL AND RESTAURANT PREMIUM CLUB”. The result is shown in
Table 3.
Hotel-restaurant visitors were segmented using an approach based on the Kohonen algorithm, objects were clustered according to the Kohonen algorithm, and an interpretation of the Kohonen map was built based on the company’s financial revenues from services provided. The results are based on the company’s activities for one month (
Table 4).
Figure 5 shows the obtained Kohonen maps based on
Table 4, which shows the company’s financial revenues from services provided. The results are based on the activities of the company “HOTEL AND RESTAURANT PREMIUM CLUB” for one month.
When assessing financial stability, an analytical approach is applied; that is, the actual financial stability indicators calculated are compared with extreme ones.
As can be seen from the above figures, the clear leader in terms of financial receipts of a service sector enterprise is the hotel service, receipts from this service were $431,350 in August 2019.
Restaurant and bar service, which brought $141,600 in a month, is in second place.
Conference hall service with an income of $25,800 is in third place.
Spa zone service with an income of $8000 is in fourth place.
“Accommodation with pets” service with an income of $7800 is in fifth place.
Sports hall service with an income of $7550 is in sixth place.
The survey results were conducted for August 2019, which may also affect the financial receipts from each service, as some of them are seasonal.
The formed structure of sources of funds, the turnover of current assets, the reputation of the enterprise, etc. Therefore, the acceptability of the values of the coefficients, the assessment of their dynamics and directions of change can be established only for a specific enterprise, taking into account the conditions of its activity.
The algorithm is based on a comprehensive analysis of financial stability indicators that will predict the future level of economic stability of the enterprise. The constructed algorithm gives an idea of the nature of the impact and the degree of correlation of the coefficients with each other, and the indicator of economic stability. This will give recommendations on the impact of a particular activity (personal, fixed assets, capital structure, etc.) of the enterprise on its economic stability.
4. Discussion
A study of the features of the financial activity of an enterprise in the service sector was carried out, and it was determined that a distinctive feature of this industry is a significant number of qualitative indicators of activity, which are difficult to express in a quantitative format.
To determine the system of optimal indicators for assessing the financial stability of an enterprise, a comparative characteristic of methods for assessing the financial condition by absolute indicators and an assessment of the financial condition using relative indicators, which use various data of the enterprise’s activities that affect the assessment of financial stability, are carried out.
To analyze a significant number of factors influencing the financial stability of enterprises in the service sector, which leads to a variety of classifications of these factors, the research of factors influencing the assessment of financial stability has been deeply studied, and the classification of factors has been improved by introducing external factors of seasonality and regional location of the enterprise in the service sector.
To determine the significance of the influence of external factors on the financial stability of the hotel business, such factors as seasonality and regional location, which are complicated by problems of their uncertain nature and discretization, which is necessary for calculating and assessing the financial stability of the enterprise, were researched in the paper. To assess the financial condition of a hotel enterprise, a visual interpretation of a neural network was used—a model of a self-organizing Kohonen map. It was proved that using the Kohonen map method for each service provided by a hotel enterprise, in a certain period of activity, it is possible to establish certain objective limitations of structural characteristics that will prevent the transition to problem clusters or ensure the transition to better ones.
An important tool for ensuring the financial stability of the enterprise in the long term is a set of activities and procedures for managing risks that influence its level. The organization of risk management at the enterprise simultaneously allows deciding or creating favorable conditions for the solution of the main tasks of its activity, among which are: planning of expected profits and losses, reduction of unexpected expenses, optimization of tax payments, increase of credit and investment rating, strengthening of financial stability, and the like. The solution of these tasks will contribute to the achievement of strategic financial goals of the enterprise.
This approach is due to the dual response of strategic management to external change: long-term and operational one simultaneously. The long-term response is laid down in strategic plans, and the operational one is implemented in real time. Therefore, the enterprise risk management subsystem must provide for risk control and management both in strategic decisions and in tactical and operational decisions.
Measures aimed at optimizing the risks of financial stability of the enterprise should not reduce the stability of its financial environment. The risk management system for reducing financial stability can only be considered effective if the costs of optimizing it are less than the expected loss.
In today’s economic environment, characterized by a high level of uncertainty, the achievement of strategic financial goals of enterprises and ensuring their long-term financial stability are impossible without creating an effective system of strategic financial management, an integral element of which is a mechanism for managing the risk of reducing financial stability.
Tax, investment, operational and liquidity risks are the main risks that hamper long-term development and cause a loss of financial stability for economic entities. Building an effective system of strategic financial stability management, which contains a risk management subsystem, will enhance the financial stability of the enterprise in the face of increased competition and uncertainty in the domestic and global markets.
Considering different approaches to calculations of the optimal capital structure of the company, it should be noted that the choice of methodology depends on the specific conditions of activity of the enterprise and the decisions of its management.
Depending on the goal—to minimize the risks or cost of capital or to maximize its profitability, the management of the company chooses the appropriate approach.
In the process of functioning, each enterprise must maintain not only the stability of its position but also balance the internal capabilities with the influence of the external environment to achieve a state of new quality, which will allow development.
The expert system was developed to assess the impact of external and internal factors on the financial stability of the enterprise. Of course, the company is not able to influence most external factors, but with information on the numerical assessment of financial stability, it can adapt to their impact and prepare effective strategies to address potential financial problems (
Shim 2017).
The presence or availability of the enterprise with labor resources affects the volume and rhythm of production and sales of products in the case of the hotel industry for the implementation of services, the efficiency of using fixed assets, the cost of products, works, services, profit, profitability, and the financial condition of the enterprise. The analysis of the availability and provision of the enterprise with labor resources is carried out in the following sequence: research of the composition and structure of personnel; calculation and study of indicators of the movement of labor; assessment of the provision of the enterprise with labor resources; search and calculation of reserves for increasing the efficiency and completeness of the use of labor resources.
The provision of an enterprise with labor resources is a relative indicator calculated by dividing the actual number of employees by category and profession by the planned need.
The analysis of the provision of the enterprise with labor resources should be carried out in close connection with the study of the degree of implementation of the plan (program) of the social development of the enterprise—the provision of housing for employees, ensuring their social and cultural needs, and the like.
In the course of the analysis, the reserves for reducing the enterprise’s need for labor resources as a result of these activities should be identified. Distribution and redistribution of workers is the distribution of personnel, positions, and jobs, which ensures the implementation of the necessary types and volumes of work. The use of workers involves the definition of such a structure of work that allows maximizing the opportunities and individual characteristics of workers.
Thus, the given expert system represents the calculation of the coefficients of influence on financial stability. The system indicates the input and output information (data that we have from the financial statements of the enterprise and, accordingly, the indicators that we obtain as a result of the analysis). The input indicators used in solving financial stability and initial information are described: the results of calculation of coefficients and their analysis, the system builds a matrix of pairwise ratios and transmits data for calculation of the integrated indicator of financial stability of SSE.
5. Conclusions
The comprehensive study of the problem of assessing financial stability was carried out in the paper, and new methodological approaches to solving the assessment of financial stability as leveling the risks of activities of enterprises in the service sector were implemented. To study the stability and controllability of the process of assessing financial stability, the types of control maps for each of the coefficients were determined. They have a significant impact on the assessment of the financial stability of a service sector enterprise. The control maps were built for each coefficient included in the integral indicator of financial stability, and their analysis for the presence of special reasons for the variability of the process of assessing financial stability was carried out. To assess financial stability, taking into account many criteria, a software implementation of a model for assessing the financial stability of an enterprise in the service sector was carried out in the form of an expert system, which provides for the calculation of coefficients of influence on financial stability, and the formation and analysis of an integral indicator of financial stability.
The method of constructing Kohonen maps was used for the segmentation of visitors. It can be argued that using the Kohonen map method for each service provided by a hotel company, at a certain period of activity, it is possible to establish some objective limitations of structural characteristics that will prevent the transition to problem clusters or ensure the transition to better ones. We are talking about the financial structure of indicators corresponding to the established level of financial stability of a service sector enterprise. Thus, the proposed apparatus of neural networks makes it possible not only to determine the most profitable activity of an enterprise but also to assess the financial condition of each of its research objects.
In the difficult financial and economic situation in the world, which is connected with external problems and complex internal situation, it is necessary for enterprises to take all possible measures to stabilize their own financial activities. To this end, it is advisable to recommend further research prospects:
to carry out constant monitoring and operative analysis of indicators of financial condition of the enterprise, taking into account features of the service sector;
to improve information support for analysis and forms of financial reporting, which will increase the analytical capabilities and the reality of assessment of the property of the hotel enterprise;
to study the implementation of neural network analysis to the analysis of the financial stability of the service sector enterprise.


