Article

The Economic Sustainability of Culture in Hawai’i: Tourists’ Willingness to Pay for Hawaiian Cultural Experiences

1
School of Travel Industry Management, Shidler College of Business, University of Hawaii at Manoa, 2560 Campus Rd., George Hall 346, Honolulu, HI 96822, USA
2
Hospitality and Tourism, Business Administration, University of Hawaii-West Oahu, 91-1001 Farrington Highway, Kapolei, HI 96707, USA
3
Faculty of Computer Science, Engineering & Economics, Østfold University College, BRA Veien 4, 1757 Halden, Norway
4
Harrah College of Hospitality, University of Nevada Las Vegas, 4505 S. Maryland Pkwy, Las Vegas, NV 89154, USA
*
Author to whom correspondence should be addressed.
J. Risk Financial Manag. 2021, 14(9), 420; https://0-doi-org.brum.beds.ac.uk/10.3390/jrfm14090420
Submission received: 25 August 2021 / Revised: 28 August 2021 / Accepted: 30 August 2021 / Published: 3 September 2021
(This article belongs to the Special Issue Economic Sustainability of Culture and Cultural Tourism)

Abstract

:
Given the current travel restrictions with the COVID-19 pandemic, there is an unprecedented opportunity for Hawai’i to reexamine its current tourism offerings and establish a new approach to support a more authentic, cultural, and sustainable tourism for the U.S. domestic tourist market. As tourists from the continental U.S. are the largest source market for visitors to Hawai’i, the purpose of this study is to examine the trend towards an “authentic cultural” tourism experience and evaluate whether U.S. visitors will be willing to pay for a deeper integration and representation of Hawaiian culture in tourism offerings. The contingent valuation method (CVM) was adopted to quantify the willingness to pay (WTP) more by the tourists to Hawaii in order to experience a more “authentic Hawaiian cultural experience” as well as “sustainable experiences”. Differences between returning and first-time visitors were considered. This study focused on continental U.S. visitors’ perceptions of Hawaiian culture and the sustainability of Hawaiian tourism products, as well as the assessment of locally grown food and tourists’ willingness to pay extra for these tourism products and experiences. The contingent valuation survey demonstrated that continental U.S. travelers were supportive of an additional fee in order to experience authentic Hawaiian cultural and tourism experiences designed and/or facilitated by Native Hawaiians. In addition, U.S. visitors were also supportive of paying additional fees for activities or experiences to support sustainable tourism in Hawai’i, including paying more for locally grown food, indicating that they would be willing to increase their restaurant/hotel food bill in order to support the Hawaii’s local farming industry. The results of this study demonstrate that there are economic opportunities to further integrate Hawaiian culture and sustainability into the experience of visitors, and that U.S. visitors are willing to support these cultural activities financially.

1. Introduction

The global COVID-19 pandemic has had a tremendous impact on the world economy, and the global tourism industry has not been exempt from this. Many travel destinations have struggled amidst the economic volatility and continued uncertainty caused by this disease. Despite the unprecedented challenge caused by COVID-19, numerous tourism researchers have identified the current crisis as an opportunity to promote more sustainable practices (Chang et al. 2020; Galvani 2020; Niewiadomski 2020). For the tourism industry, the current COVID-19 pandemic presents a considerable opportunity for building and delivering more authentic cultural tourism practices that are economically sustainable and global in scale. However, at the time of writing this research paper, there is still limited research as to how specific destinations are working towards planning and delivering authentic cultural tourism practices that are economically sustainable.
Tourism has historically been a significant contributor to the State of Hawai’i’s economy (Agrusa 1994; Min et al. 2020). The disruption caused by COVID-19 has emphasized the tourism industry’s importance in Hawai’i for hospitality and travel businesses, as well as its role as an economic contributor for local families who rely on employment in the tourism sector or supporting industries. Of the major tourist market areas identified by the Hawai’i Tourism Authority, a significant number of visitors to Hawai’i have historically come from the U.S. West and U.S. East markets. Based on visitor statistics released by the Hawai’i Tourism Authority in September 2020, while there has been a drastic decrease in the total number of visitor arrivals from each major market area due to COVID-19, most of the visitors who have been traveling to Hawai’i have come from the U.S. domestic market (Hawai’i Tourism Authority 2020). As it has been anticipated that domestic demand will recover before international demand (Air Passenger Forecasts: Potential Paths for Recovery into the Medium-and Long-run Rep. 2020, p. 14), developing a greater understanding of the motivations and preferences of the domestic U.S. tourist market could help the State of Hawai’i to better evaluate and reimagine the tourism industry at this time. This study aims to fill a gap in existing literature by examining the perceptions of Hawaiian culture among U.S. visitors to Hawai’i, along with their willingness to pay for Hawaiian culture, in an effort to support more sustainable tourism practices in the future.

2. Literature Review

2.1. COVID-19 and Its Impact on Cultural and Sustainable Tourism

A large portion of recent tourism, hospitality, and travel literature has centered on the COVID-19 pandemic. Many researchers have sought to examine the impact that the pandemic has had on these industries (Dube et al. 2020; Gursoy and Chi 2020; Maneenop and Kotcharin 2020; Suau-Sanchez et al. 2020; Sun et al. 2020) and anticipate how COVID-19′s disruption will continue to shape tourism, hospitality, and travel in the future (Alonso et al. 2020; Zenker and Kock 2020; Zhang 2020). Other scholars have explored the relationship between international tourism and the spread of COVID-19 (Farzanegan et al. 2020) and have suggested that the disruption caused by the pandemic could represent a transformative opportunity to address many of the issues associated with mass tourism (Ioannides and Gyimóthy 2020; Sigala 2020; Qiu et al. 2020).
As a subfield of tourism research, the concept of sustainable and cultural tourism has been a significant topic of interest, as it covers a wide range of subjects—including, but not limited to, sustainable tourism practices, eco-tourism, cultural tourism, protected area tourism, sustainable development, and small island destination management (Ruhanen et al. 2015). Despite this range of subjects, the concept of sustainable tourism has historically faced criticism due to varied definitions and usage amongst researchers, as well as the oversight of a number of sub-issues (Butler 1999; Liu 2003). Prior to the COVID-19 disruption, the sub-issue of “over-tourism” was a relatively hot topic in media and tourism academia, as more destinations faced urgent evidence of the negative impacts that increases in visitors can have on a destination over time (Koens et al. 2018; Milano et al. 2019; Perkumienė and Pranskūnienė 2019). Despite this increase in attention, Dredge (2017) suggests that the real issues driving overcrowding and the exploitation of destination resources and communities have been explored in research for many years. These issues include the prioritization of pro-growth economic objectives, the need for local and inclusive tourism, the control of destination development, the consideration of travel subsectors, the exploration of the impacts of tourism on the public sector, and the lack of collaborative knowledge management to deal with tourism issues (Dredge 2017).
Liu (2003) recognizes that tourism development is supply-led and demand-driven, suggesting that the role of tourism demand is a significant issue in research related to sustainable cultural tourism management. Tourism demand is influenced by numerous factors, including tourist preferences (Stabler et al. 2010). Tran and Ralston (2006) suggest that preferences serve as an intermediary between tourist motives and behavior, making tourist preferences “the act of selecting from among a set of choices as influenced by one’s motivations” (p. 428). Understanding tourists’ motivations is then an important aspect to consider in the effective planning and management of tourism, as it can provide insight into tourist preferences and behavior (Tran and Ralston 2006). Research by Snepenger et al. (2006) supports Iso-Ahola’s motivation theory in the tourism context, which suggests that tourists’ motivations fall into four different dimensions: personal escape, interpersonal escape, personal seeking, and interpersonal seeking. Of these dimensions, the rate of change in motivation for personal escape (getting away from the normal environment, changing pace from everyday life, and overcoming bad emotions) and personal seeking (experiencing new things, sharing experiences with others, and feeling good about oneself) was higher than for the other two dimensions, which suggests that tourism experiences are likely driven by personal escape and personal seeking motivations over interpersonal escape and interpersonal seeking motivations (Snepenger et al. 2006). Other research on tourist motivations has supported these findings and has suggested that the search for novel experiences is a factor that can affect visitors’ decisions regarding their choice of destination and the activities that they participate in (Lee and Crompton 1992). The novelty of travel, including the altering of routine and the provision of different experiences, can attract tourists to a destination (Lee and Crompton 1992), and in their search for a novel experience, the unique cultural experiences offered by a destination can be some of the influencing factors in the tourists’ decision to visit (Tapachai and Waryszak 2000).
In recent decades, there has been an increased awareness of, and interest in participating in, cultural tourism activities. According to the United Nations World Tourism Organization (UNWTO), cultural tourism can be defined as “a type of tourism activity in which the visitor’s essential motivation is to learn, discover, experience and consume the tangible and intangible cultural attractions/products in a tourism destination” (United Nations World Tourism Organization 2017, p. 4). In much of the previous research on cultural tourism, the foci tend to be on the pull of different cultural attractions, composition attributes of the cultural tourist, and the identification of different segments of cultural tourists (Barbieri and Mahoney 2010; Kim et al. 2007; McKercher 2002). Cultural tourists can range from recreational or pleasure-seeking tourists who choose to participate in a cultural tourism activity to elevate their trip experience, to tourists whose primary goal is to seek out cultural tourism activities (McKercher and Du Cros 2003). These cultural activities and attractions can include everything from food, art, historical sites, landmarks, and cultural facilities, to experiences in rural areas of a destination that highlight the culture, traditions, values, and lifestyles of the local community.
The concept of “authenticity”, and the impacts of the commodification of culture, have been discussed extensively in sustainable tourism and cultural tourism research (Engeset and Elvekrok 2015; Gnotha and Wang 2015; Kithiia and Reilly 2016; Taheri et al. 2018; Park et al. 2019; Shepherd 2002; Yeoman et al. 2007). In the seminal work by Cohen (1988) on authenticity and commodification in tourism, it was suggested that the commoditization of culture incited by tourism can destroy the authenticity or meaning of cultural products for both locals and tourists alike. Sustainable tourism and responsible cultural tourism management can serve to protect the authenticity or meaning of cultural products for the host population, as well as for visitors to the destination. Wang (1999) highlighted three theoretical approaches to viewing authenticity in the tourist experience: objectivism, constructivism, and post-modernism (existentialism). These approaches explore the concept of “authenticity” as it relates to the physical or objective characteristics, social constructs, and self-idealizing analyses of the tourist experience from the tourist’s perspective (Wang 1999). For the purpose of this paper, perceived cultural authenticity will be explored from the perspective of visitors to Hawai’i, with careful consideration of the potential for a deeper integration of Hawaiian culture, designed and facilitated by members of the host culture, in the tourist experience. For a culture-rich destination such as Hawai’i, thoughtful consideration of optimal tourism demand, the impacts of tourism on Hawai’i’s resources and local communities, and the potential draw of authentic cultural activities and attractions will be essential for the long-term sustainability of the destination.

2.2. Tourism Growth and Sustainability in Hawai’i

Tourism is the number one economic industry in Hawai’i. In 2019, Hawai’i’s tourism industry generated over USD 17 billion in total visitor spending and USD 2.07 billion in state tax revenue, emphasizing the industry’s position as the largest source of private capital for the State of Hawai’i (Fact Sheet: Benefits of Hawai’i’s Tourism Economy Rep. 2019). Over 10.4 million annual visitor arrivals were recorded in 2019, marking a 5.4% year-over-year increase from 2018 (Fact Sheet: Benefits of Hawai’i’s Tourism Economy Rep. 2019). For the State of Hawai’i, the increase in total visitor spending and arrivals in 2019 marked the eighth consecutive year of growth for both categories.
This growth has not come without challenges. Over the years, overcrowding in many areas of Hawai’i has led to increasing concern about “over-tourism” and the impact that increasing visitor arrivals can have on Hawai’i’s natural resources, infrastructure, and quality of life for residents (Hawai’i Saw more than 10 m Visitors 2020; Leong 2018; Yerton 2019). A study published in 2019 by the University of Hawai’i Economic Research Organization (UHERO) suggests that the current tourism governance model for the State of Hawai’i has been ineffective in managing the overall industry, as evidenced by “diminishing economic contribution, eroding resident sentiment, and increasing congestion and stress on sites and attractions” (Brewbaker et al. 2019, p. 1). While there have been some measures taken to address and regulate the impacts of tourism in Hawai’i (S.B 2319 2020; Wallace 2020), the abrupt disruption caused by the COVID-19 pandemic has emphasized both Hawai’i’s dependence on tourism and the unsustainable nature of Hawai’i’s tourism industry (Terrell 2020). In the period of uncertainty that COVID-19 has produced, Hawai’i’s break from mass tourism could represent an incredible opportunity for Hawai’i to reexamine the current tourism offerings and establish a new approach to support long-term sustainability for the industry.
As the Hawai’i Tourism Authority’s stated mission is “to strategically manage Hawai’i tourism in a sustainable manner that is consistent with economic goals, cultural values, preservation of natural resources, community desires and visitor industry needs”, being cognizant of the perceptions, attitudes, and behaviors of both tourists and the local population is essential (HTA 2019, p. 2). For example, Stylidis et al. (2014) presented the social exchange theory (SET), which demonstrated the expected benefits or costs in the economic, social, and environmental spheres between residents and the tourism industry. Brunt and Courtney (1999) outlined the key social/cultural impacts that can be attributed to many destinations undergoing redevelopment or new development, which can be beneficial, as it allows residents to participate in the management, design, control, and decision making regarding their community and quality of life. Finally, with the current generational traveler looking for cultural/activity-based experiences, thoughtful consideration of the cultural exchange process between visitors and the resident population, through the sharing of cultural attractions and artifacts, is crucial, as it can either preserve or dilute the host culture. The effective management of cultural tourism helps to protect host cultures from masses of insensitive people who might trivialize the unique aspects of the community (Agrusa et al. 2003).
While there was tourism in Hawai’i prior to 1959, it was not until after statehood and the introduction of jet travel between Hawai’i and the continental U.S. that the destination started seeing significant increases in tourism (Mak 2015). In the years that followed, the increasing pressure to attract tourists to Hawai’i led to destination management and marketing tactics that prioritized economic value and conformity to the current tastes of visitors rather than connecting tourism practices to the local culture, resulting in the distortion, degradation, and commodification of Hawaiian culture (Agrusa et al. 2010). Partially inspired by the civil rights and indigenous social justice movements of the 1960s, the Hawaiian community experienced a second cultural renaissance in the late 1960s and 1970s, which led to the renewed examination of traditional Hawaiian arts and culture (Hawaiian Renaissance 2009). This social movement eventually led to the deeper evaluation of tourism-centric development and the role that culture should play in the tourism industry of Hawai’i.
As described by Agrusa et al. (2003), the objective of true cultural tourism is to engage tourists, while also accurately informing them. According to Williams and Gonzalez (2017), “tourism in Hawai’i has relied on Native Hawaiian culture to carve out its unique niche” (p. 672); the role of tourism is critically analyzed in the structure of colonialism, and it is argued that “if the indigenous people of Hawai’i–on whom its tourism industry heavily relies for material, brand image and symbolic labor–continue to be relegated as hosts without a move toward reparation, tourism will remain socially unsustainable” (Williams and Gonzalez 2017, p. 680). Hawai`i’s cultural attractions draw visitors who want to experience activities that reflect their image of the Hawaiian culture. In order to accurately inform visitors, Native Hawaiians and the local population should be involved in the planning, development, and delivery of cultural artifacts implementing a bottom-up approach to tourism development (Chiabai et al. 2013). As highlighted in the Hawai’i Tourism Authority’s 2018 Resident Sentiment Report, while residents are aware of the economic benefits of tourism, they are increasingly looking for benefits beyond economic impact (Hawai’i Tourism Authority 2019); key recommendations to support resident sentiment towards tourism emphasized presenting Native Hawaiian culture in a more authentic manner; being dedicated to preserving Native Hawaiian culture and language, and sustaining Hawai’i’s natural resources, parks, and cultural sites, as well as increasing the presence of resident voices in the tourism development process (Hawai’i Tourism Authority 2019). In restoring cultural control to the indigenous people of Hawai’i and the local population, visitors would be provided with a more authentic experience of the host culture, and the local resident population’s perceptions of tourism could be positively impacted.
Currently, the contiguous United States is the largest source market for visitors to Hawai’i, as measured in terms of visitor spending, visitor days, and overall visitor arrivals (Hawai’i Tourism Authority 2019). As a report from Tourism Economics, in partnership with the International Air Transport Association (IATA), anticipates domestic passenger demand to recover from the COVID-19 crisis ahead of international passenger demand (Air Passenger Forecasts: Potential Paths for Recovery into the Medium-and Long-run Rep. 2020, p. 14), a greater understanding of the motivations and preferences of the domestic U.S. tourist market could also help the State of Hawai’i to better plan and manage sustainable tourism practices that prioritize the preservation and cultivation of Native Hawaiian culture.

3. Research Questions

The purpose of this study is to examine the trend towards an “authentic” and sustainable tourism experience, and to evaluate whether there is a U.S. visitor demand and willingness to pay for a deeper integration and representation of Hawaiian culture in the tourism offerings of Hawai’i, along with whether these offerings can be financially sustainable. Based on the review of existing literature, the contingent valuation method (CVM) was adopted to quantify the willingness of tourists to Hawaii to pay (WTP) more by in order to experience a more “authentic Hawaiian cultural experience” as well as “sustainable experiences.” Contingent valuation is a stated preference (survey) method in which respondents are asked to state their preferences in hypothetical or contingent markets, allowing analysts to estimate demands for goods or services that are not traded in markets (Markandya and Ortiz 2011). Specifically, the following research questions were examined:
RQ1: 
Are visitors from the continental U.S. interested in Hawaiian Culture?
RQ2: 
Are visitors from the continental U.S. interested in tourism experiences designed and/or facilitated by Native Hawaiians?
RQ3: 
Are U.S. visitors willing to pay more to support culturally respectful tourism experiences in Hawai’i?
RQ4: 
Are U.S. visitors willing to pay more to support sustainable tourism experiences in Hawai’i?

4. Methodology

In order to examine the perceptions and expectations of U.S. visitors to Hawai’i, a self-administered questionnaire was developed and distributed following a thorough review of previous literature. Based on the needs of this research study, the survey questionnaire method was chosen, as it allows researchers to collect data from large samples in a standardized manner. In order to ensure that the questions were appropriate, the survey was designed with input from researchers with expertise in the area of tourism, as well as researchers with expertise in the area of Hawaiian culture.

4.1. Questionnaire Design

The contingent valuation survey comprises a questionnaire. The objective of this research questionnaire was to explore some of the attitudinal and behavioral characteristics of U.S. visitors to Hawai’i, as well as to specifically examine their perceptions of Hawaiian culture in the tourist experience, and their willingness to pay for such an experience. Qualifying criteria were included to confirm that respondents met the target specification—in this case, persons who identify as current citizens of the United States, are over 18 years old, and have taken vacations by airplane in the past three years. In reference to the survey instrument itself, the 28 questions were divided into 5 different sections. A consent response was required before participants could continue with the survey. All questions except for one incorporated closed-ended responses to drive statistical analysis, while the open-ended question selected was included so that participants could share deeper insights into what would increase their interest in Hawaii as a travel destination.
The purpose of the first set of questions was to establish U.S. visitors’ background travel information. The next set of questions was designed to explore the destination image and perceptions of U.S. visitors to Hawai’i. The third section consisted of questions that asked respondents to rate their agreement with statements regarding their own knowledge and interest in Hawaiian culture on a five-point scale. The fourth set of questions was designed to assess U.S. visitors’ willingness to pay (WTP) extra for cultural and/or sustainable tourism experiences.
A payment ladder design was adopted for the latter section (Yeo 2003), in which respondents were presented with a series of monetary value percentages ranging from “up to 5% more” to “75% or more”, and were asked for their maximum WTP within this range. The final set of questions consisted of demographic questions included to obtain background information on the target group.

4.2. Sampling Size and Method

This study used a random sampling approach. The online research company Momentive (formerly Survey Monkey), alongside MTurk, was utilized to build and distribute the survey. Since the outbreak of the coronavirus pandemic, university research committees have strongly urged research faculty to minimize face-to-face survey data collection. According to Molnar (2019), the use of online data collection companies has become very popular among academic researchers =who design non-interactive online experiments, and has several advantages over platforms specifically designed for experiments, is completely web-based, and offers a more intuitive and streamlined interface. Therefore, an online survey platform is able to manage the data collection easily, and the overall survey responses are considered to be valid and reliable resources. Momentive was provided criteria by which to survey adult residents in the continental United States who had traveled on an airplane for vacation at least once in the last year.
The online platform allowed a diverse sample to be collected while ensuring the safety of the sample group during the COVID-19 pandemic. The data for this research were collected from U.S. residents who were older than 18 years old. A total of 455 survey responses were collected for this study. The surveys included questions such as “What are the top 3 images or characteristics that come to mind when you think of Hawai’i as a vacation destination?”; “If/when visiting Hawai’i, how important is it for you to understand and respect Hawaiian culture?”; and “As a tourist to Hawai’i, would you be willing to pay more to support sustainable and cultural tourism in Hawai’i?”. A 5-point Likert-type scale, ranging from strongly disagree (1) to strongly agree (5), was used to measure responses to questions 9–13. Data were analyzed using SPSS, running descriptive statistics and ANOVA testing at the 95% level of significance.
The purpose of this study was to explore the willingness of visitors from the continental U.S. to pay extra for activities that demonstrate authentic Hawaiian culture, and whether these activities can be economically sustainable, while also exploring whether there are opportunities to further integrate Hawaiian culture into the experience of U.S. visitors; the information provided by the randomly selected sampling method chosen for this study can provide significant insights.
Since the questionnaire participants were assured that their responses were anonymous and confidential, it is believed that the participants were more likely to answer honestly. A pre-test was completed to reduce the likelihood of some of the questions in the survey questionnaire being confusing to participants. Ultimately, the survey questions were verified in a pilot test to ensure that the questions chosen were appropriate and clearly understood, as the purpose of this research was to better understand tourists’ perceptions of Hawaiian culture, and whether these tourists were willing to spend enough money to keep cultural tourism in Hawaii sustainable.
The individuals involved in the pilot testing process were not included in the final survey results. Reviewing the survey instrument in the pilot test allowed the researchers to receive constructive feedback and adjust the instrument to reduce the potential for bias in the responses before conducting the larger sampling. Based on Qualtric’s (2020) sample size calculator, given the population of U.S. citizens, the ideal sample size for this study was at least 385 participants (reflecting a 95% confidence level and a 5% margin of error). The final sample for this study included 455 usable survey responses.
A total of 63.96% of the total survey respondents were first-time visitors and had never vacationed in Hawai’i, while 36.04% were return visitors who had previously visited the islands, see Figure 1.
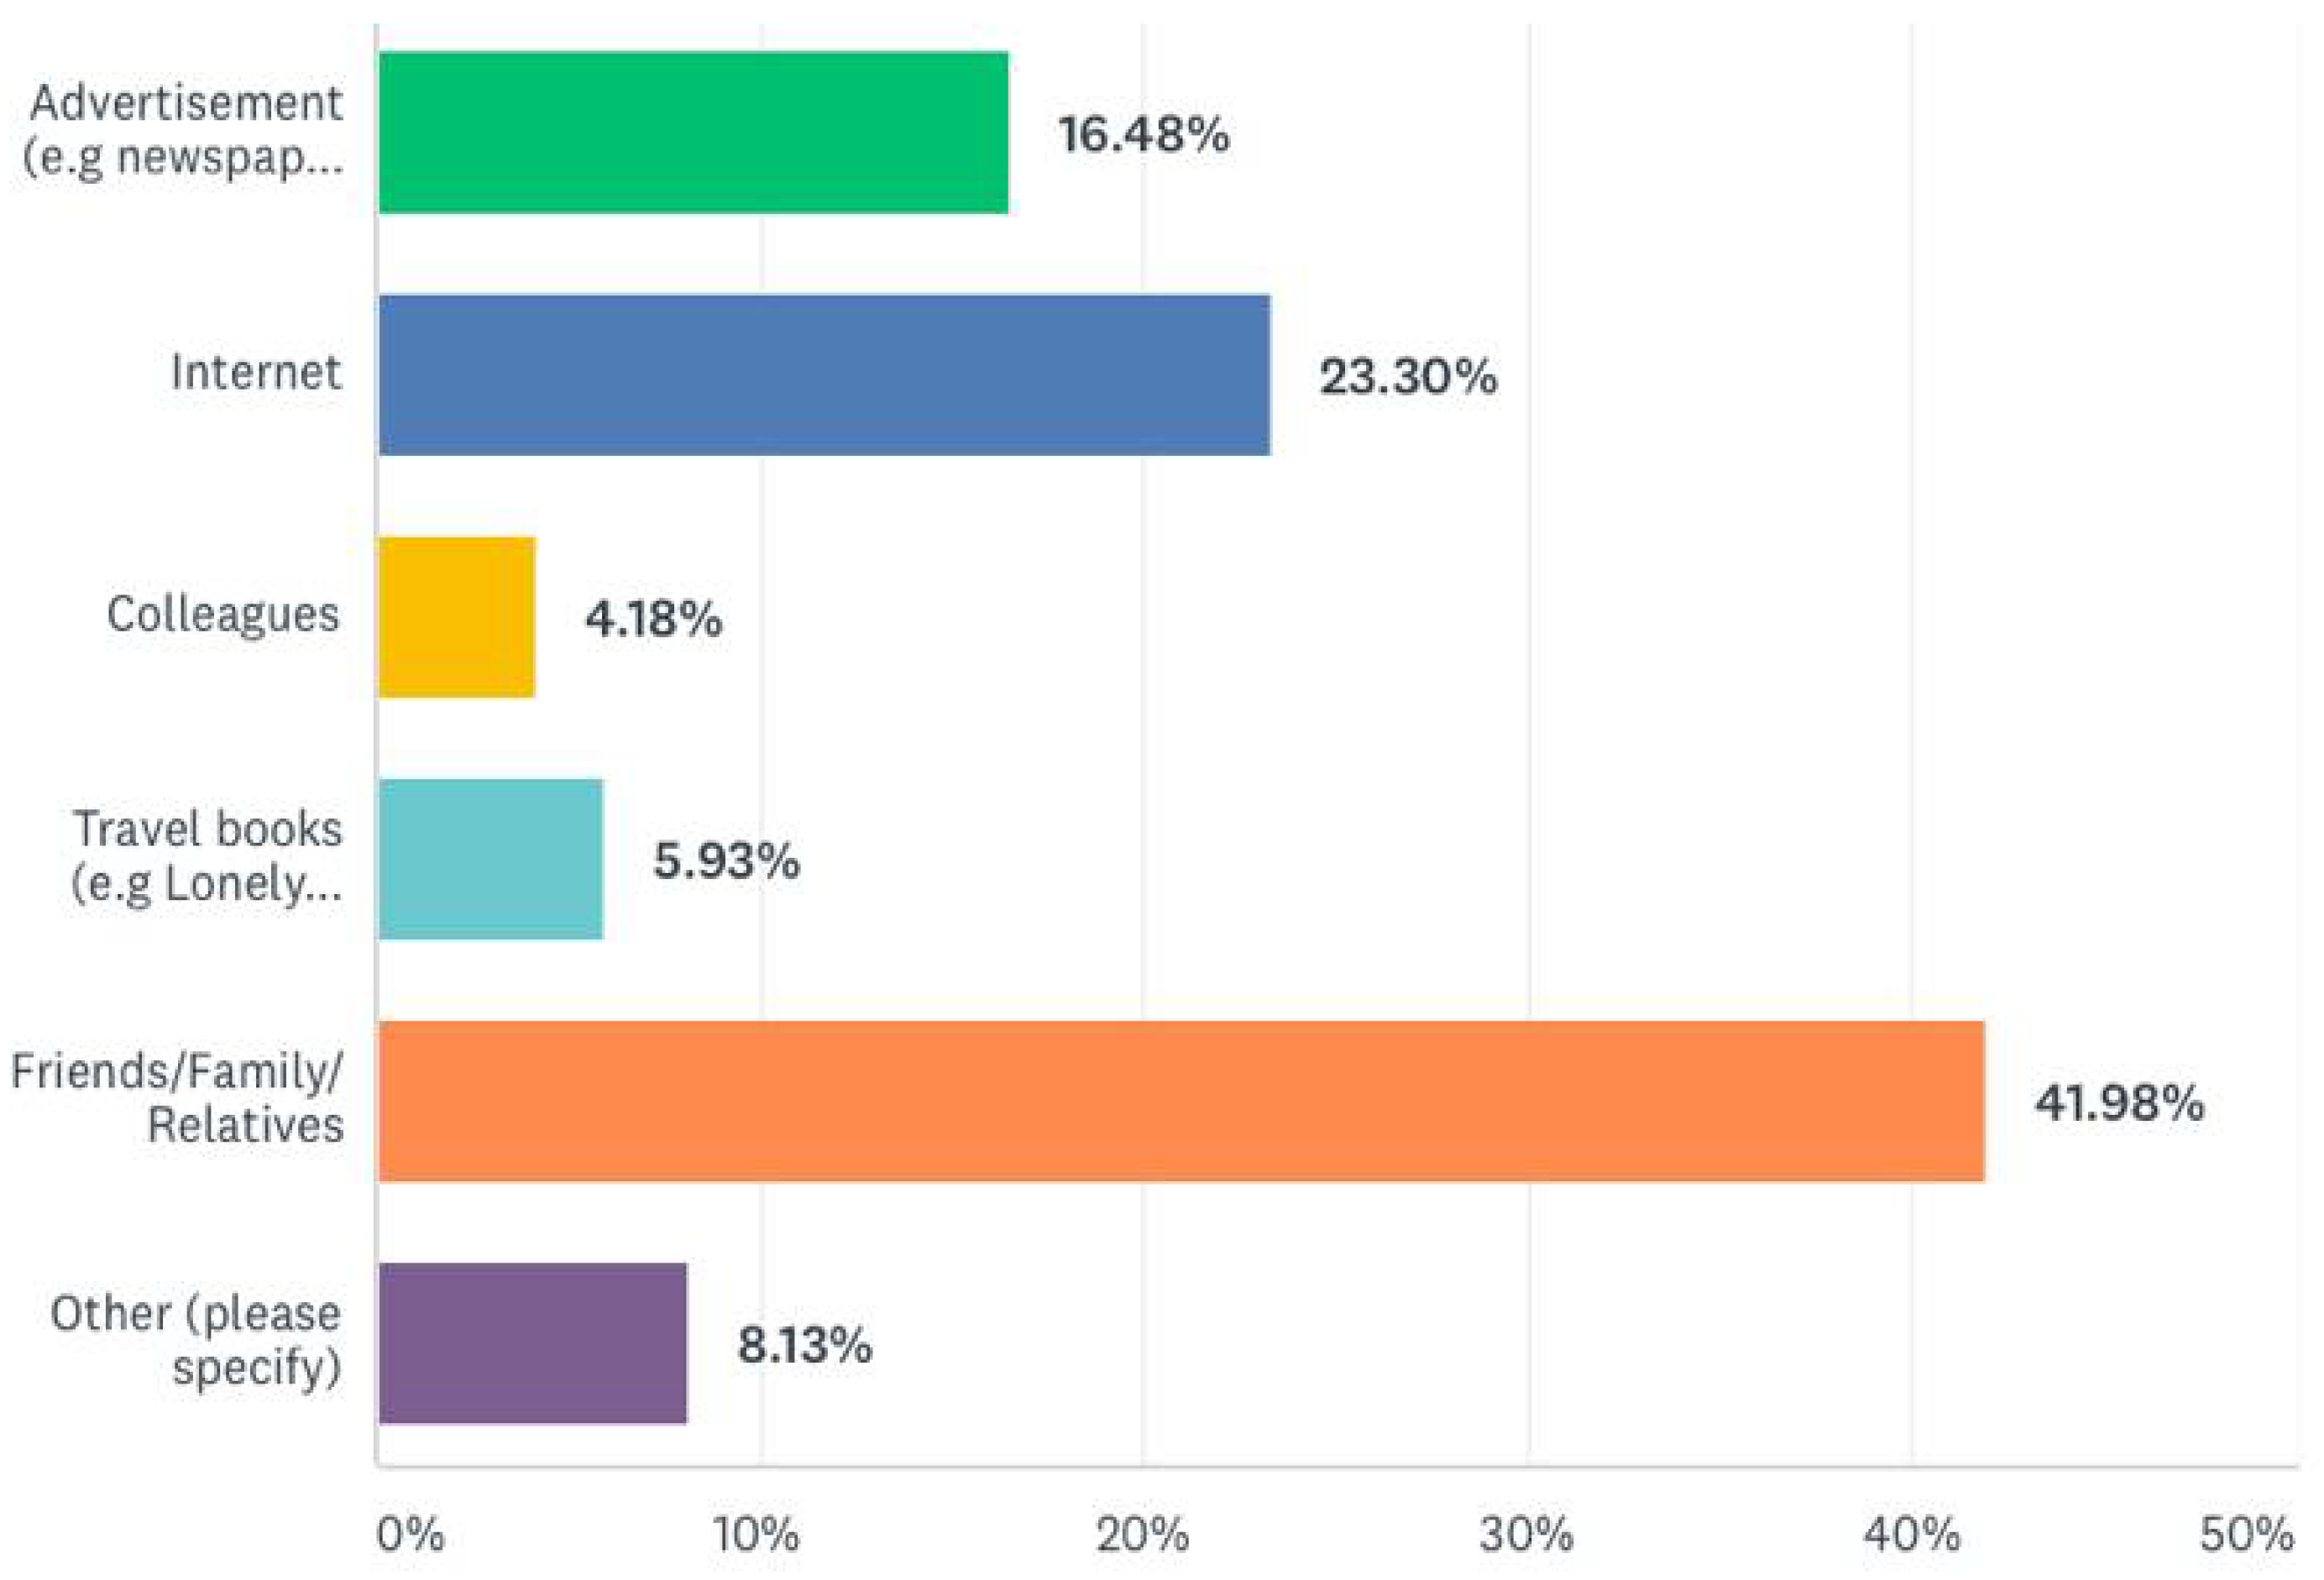
For marketing purposes, it is crucial to be aware of the different avenues by which people can hear about a destination. Based on the survey results, word-of-mouth played a significant role in how the survey participants heard about Hawai’i as a vacation destination, with 41.98% having heard about Hawai’i through friends/family/relatives, and 4.18% hearing about Hawai’i through colleagues. Many participants (23.30%) also seemed to rely on the Internet when searching for travel information about Hawai’i. Advertisements (including newspapers, magazines, movies, and TV programs) were another significant avenue by which survey participants learned about Hawai’i as a vacation destination (16.48%), see Figure 2.
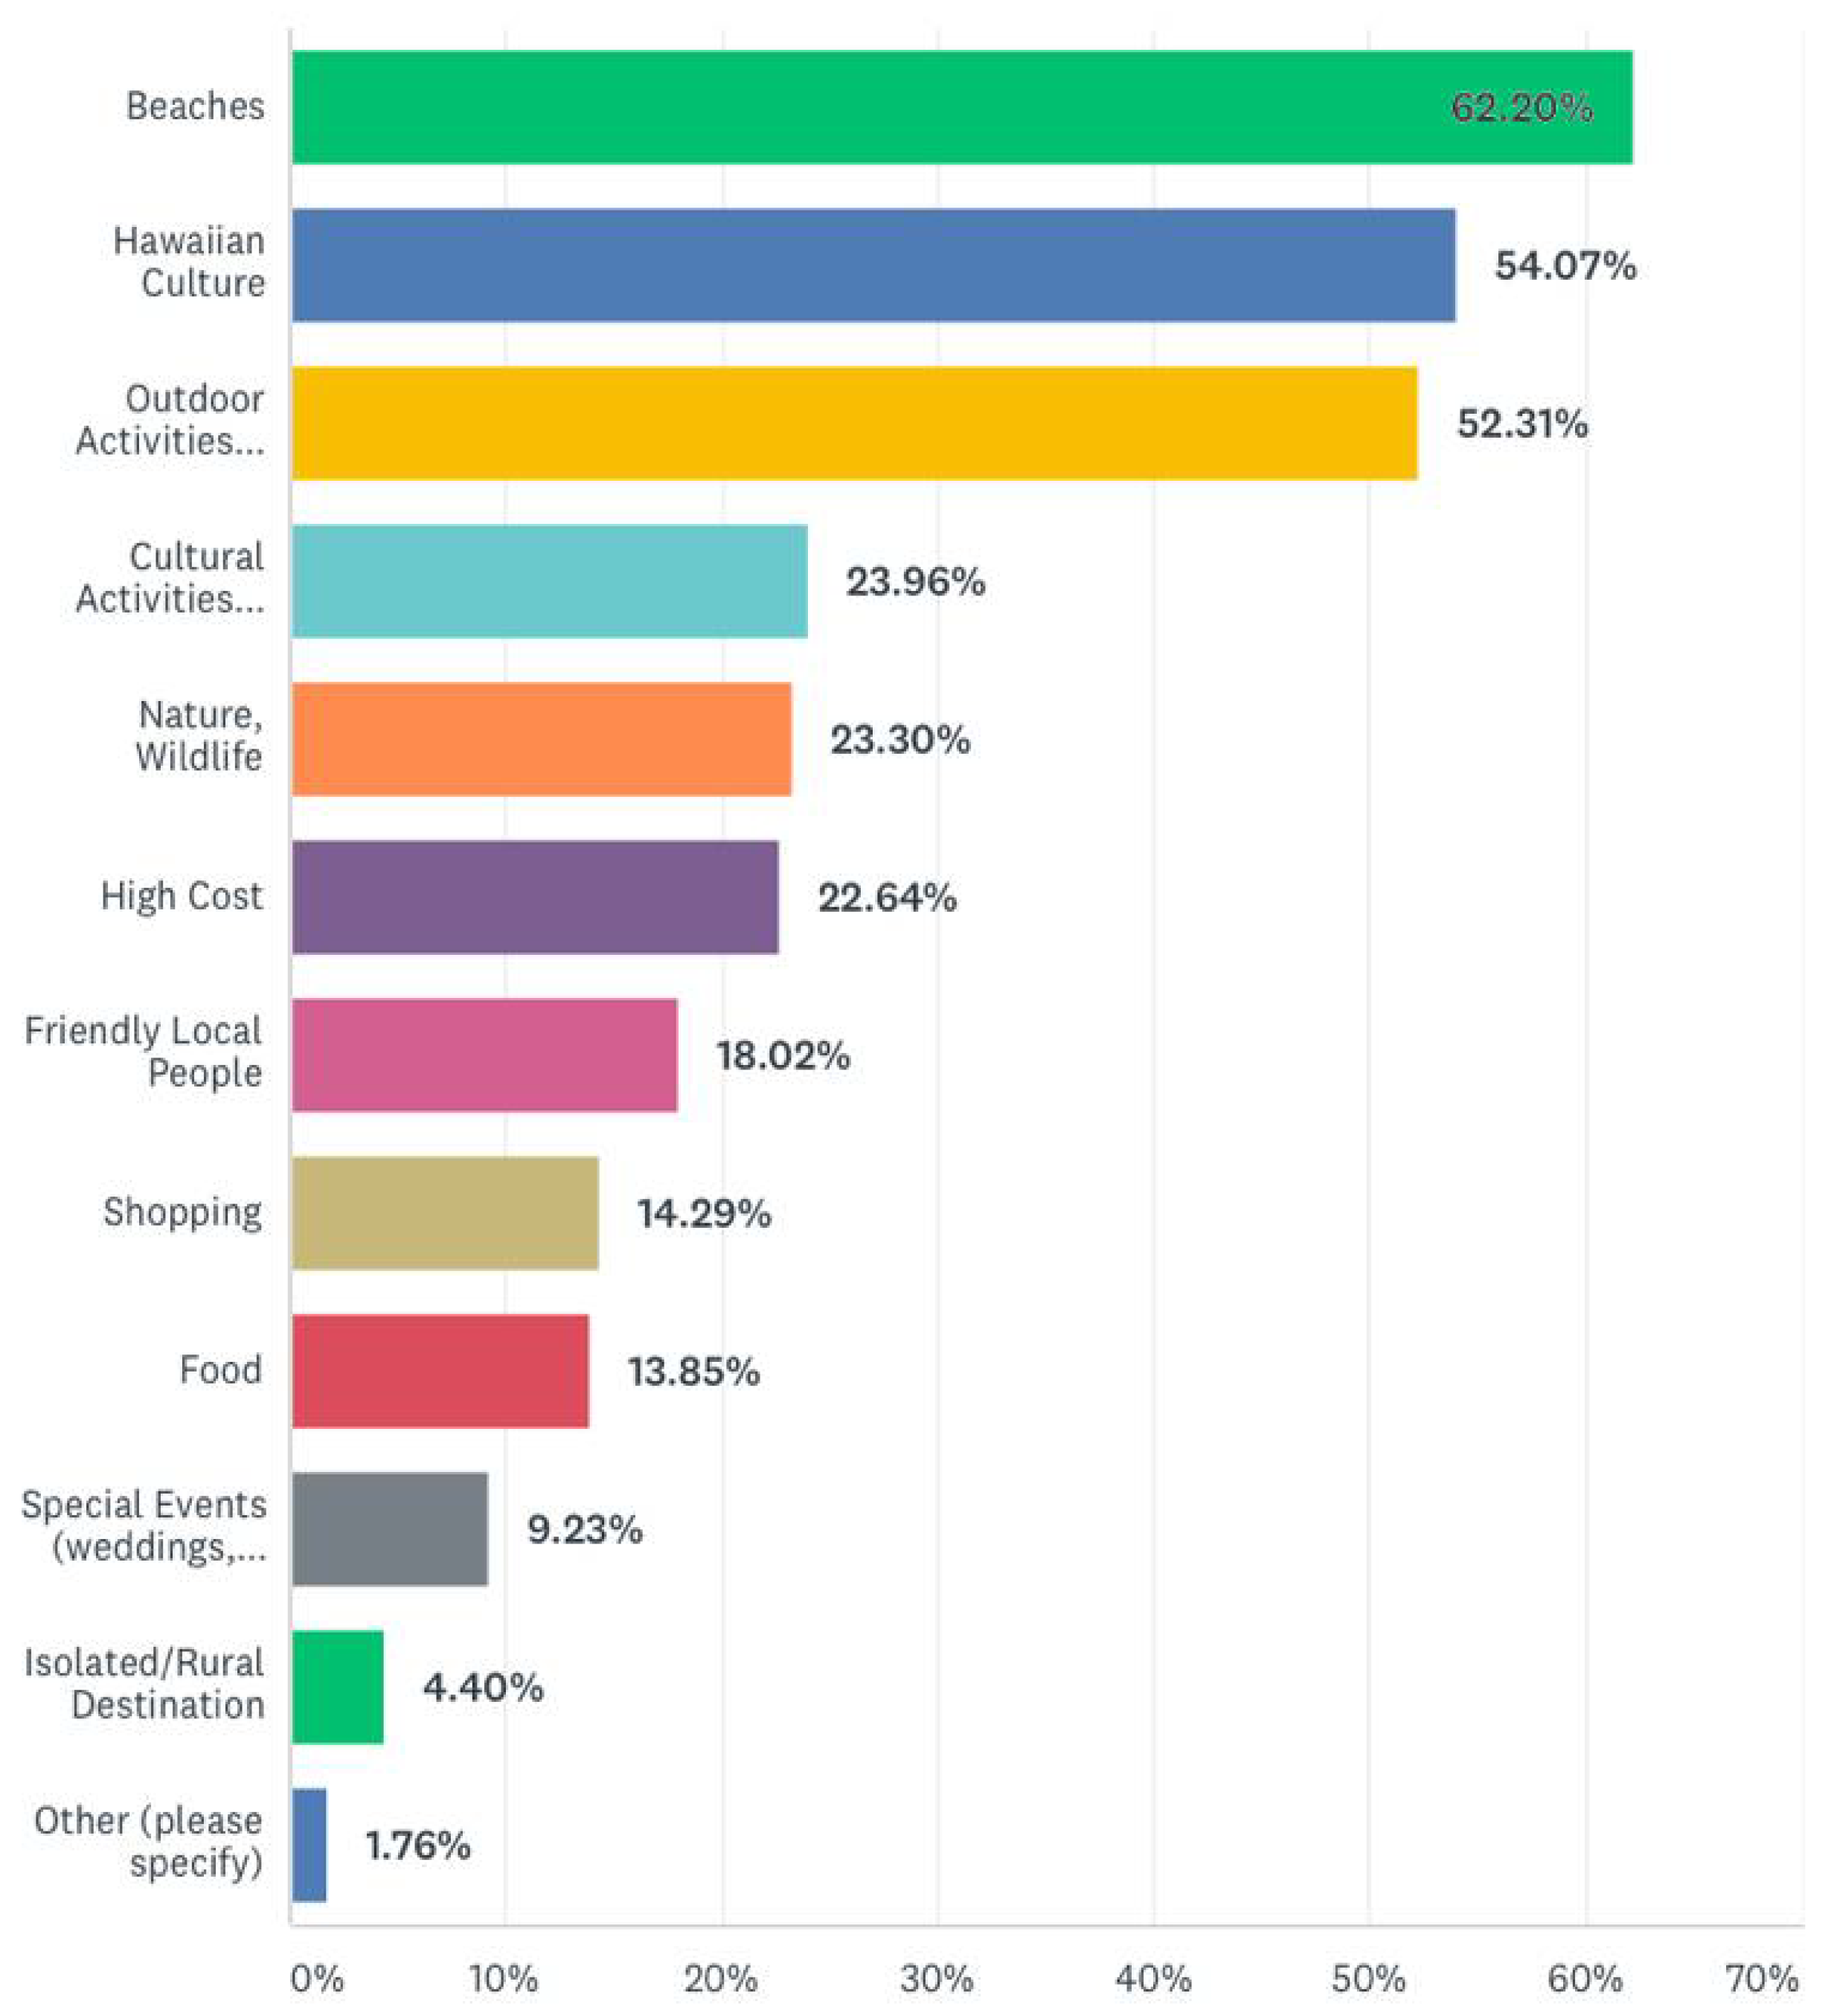
The second section of the survey was designed to gather information on U.S. visitors’ destination image of Hawai’i. Survey participants were asked to provide their top 3 images or characteristics associated with Hawai’i as a vacation destination, and to rate the importance of various characteristics in their perception of Hawai’i as a vacation destination. The provided list of images or characteristics for consideration included cultural activities, Hawaiian culture, outdoor activities, shopping, special events, friendly local people, isolated/rural destination, high cost, beaches, nature/wildlife, and food. More than 50% of survey respondents considered Hawai’i’s beaches, Hawaiian culture, and Hawai’i’s outdoor activities to be the top images or characteristics that came to mind when thinking of Hawai’i as a vacation destination. Of these, Hawai’i’s beaches ranked highest, with 62.2% of respondents listing them as a top image or characteristic.
Hawai’i’s beaches were also ranked highest in terms of importance to participants’ perceptions of Hawai’i as a leisure destination. Interestingly, when asked to rate the importance of the provided images and characteristics in their perception of Hawai’i as a leisure destination, the top four images or characteristics (by mean sample response) included “beaches”, “food”, “Hawaiian culture”, and “friendly local people”. Overall, “shopping” and “special events” were ranked the lowest in importance. The survey data also indicated slight differences between participants who had previously travelled to Hawai’i and participants who had not travelled to Hawai’i. Although both groups ranked Hawai’i’s “beaches” and “food” as “very Important” characteristics in their perception of Hawai’i as a leisure destination, “high cost” was the third highest rated characteristic in terms of importance in the perception of the survey participants who had not previously travelled to Hawai’i, while “nature/wildlife” was the third highest rated characteristic for participants who had been to Hawai’i before. The majority of the respondents (73.91%) who had previously travelled to Hawai’i considered Hawaiian culture to be “important” or “very important”, and 72.85% of participants who were first-time visitors to Hawai’i considered Hawaiian culture to be “important” or “very important”, see Figure 3.
The third section of the survey was designed to gather information on U.S. visitors’ knowledge of and interest in Hawaiian culture. Survey participants were asked to rate their current knowledge and interest in Hawaiian culture, as well as to indicate their level of agreement regarding the importance of interacting with local residents, experiencing Hawaiian culture, and understanding and respecting Hawaiian culture. The results suggest that most of the respondents self-rated their knowledge of Hawaiian culture as moderately low to average. When asked to self-rate their current interest in learning about Hawaiian culture, the mean response fell between average and moderately high. The mean sample response for U.S. visitors’ current interest in participating in tourism experiences designed and facilitated by Native Hawaiians also fell between average and moderately high. Over 50% of survey respondents indicated that it was important for them to understand and respect Hawaiian culture when visiting Hawai’i. When comparing response percentages, overall, the level of interest in learning about Hawaiian culture and interest in activities designed and facilitated by Native Hawaiians was only slightly higher in participants who had previously visited Hawai’i than in participants who were first-time visitors to Hawai’i, see Table 1.
The data above demonstrates that there was a significant difference (p (0.018 < 0.05) SE.04940) in how female and male participants rated Hawaiian culture, with females rating Hawaiian culture higher than males. On a rating scale of 1–5, both genders “agreed” (avg = 3.9341) that Hawaiian culture was of importance. Furthermore, there were other differences found between female and male participants. Males rated “outdoor activities (hiking, water sports, etc.)” higher than women, with a significant difference (p (0.030 < 0.05) SE.04790). On a rating scale of 1–5, both genders “agreed” (avg = 3.7802) that outdoor activities were of importance in their perception of Hawai’i. Another significant difference (p (0.001 < 0.05) SE.05321) was found in how the different genders rated “isolated/rural destination”, with males rating it higher than females. On a rating scale of 1–5, both genders reported “neutral” (avg = 3.0945) for the importance of image of Hawai’i being an isolated/rural destination in their perceptions of Hawai’i as a vacation destination. There was no significant difference between genders for the other items.
Based on the survey results on the visitors’ knowledge in reference to Hawaiian culture, there was a significant difference (p (0.001 < 0.05) SE 0.04887) between those had traveled to Hawai’i previously and those who were first-time visitors to Hawai’i when it came to rating their own knowledge about Hawaiian culture. Those who had been to Hawai’i indicated a stronger knowledge about the culture. When it came to rating their interest in learning about Hawaiian culture and rating their interest in participating in tourism experiences designed and facilitated by Native Hawaiians, there were no significant differences found between those who had previously visited Hawai’i and those who had not (p (1.02 > 0.05) and p (0.296 > 0.05), respectively), see Table 2.
Furthermore, Table 3 shows a significant difference (p (0.006 < 0.05) SE 0.04639) between genders when it comes to the perceived importance of experiencing Hawaiian culture during their stay in Hawai’i, with it being more important for women than for men to experience Hawaiian culture. On a rating scale of 1–5, both genders “agreed” (avg = 4.07) that experiencing Hawaiian culture during their stay was of importance. Furthermore, there was a significant difference, (p (0.015 < 0.05) SE 0.04559), between genders with regard to the perceived importance of understanding and respecting Hawaiian culture during their stay, with more females indicating that understanding and respecting Hawaiian culture is important. On a rating scale of 1–5, both genders “strongly agreed” 4.287 that understanding and respecting Hawaiian culture is important. Moreover, there was no significant difference (p (0.824 > 0.05) SE 0.05074), between the genders when it came to the perceived importance of interacting with locals during their stay.
As showcased in Table 4, there were also significant differences (p (0.007 < 0.05) SE 0.05074) between age groups when it came to being able to interact with local residents while on vacation; those over the age of 60 rated being able to interact higher than the younger generations (avg = 4.03). This might be related to the number of times the respondents had traveled to the islands.
Based on the survey results, there was found to be a significant difference (p (0.036 < 0.05) SE 0.04385) between genders in their agreement with the statement “The tourism industry must ensure quality tourism experiences for visitors”, with males rating it higher than females. On a rating scale of 1–5, both genders “agreed” (avg = 3.8769) that ensuring quality tourism experiences for visitors is of importance. Furthermore, men also rated the statement “It is the responsibility of tourism businesses to meet visitor needs”, higher than women (p (0.000 < 0.05) SE 0.04025). On a rating scale of 1–5, both genders “strongly agreed” (avg = 3.8286) that tourism businesses are responsible for meeting visitor needs. There was also found to be a significant gender difference (p (0.006 < 0.05) SE 0.04283) in the responses to the statement “It is the responsibility of tourism businesses to meet the needs of the local community”, where males rated the statement higher than females. On a rating scale of 1–5, both genders “strongly agreed” (avg = 3.8945) that tourism businesses are responsible for meeting the needs of the local community.
Moreover, as shown in Table 5, there were no significant differences (p (0.755 > 0.05) SE 0.04104) between the genders when it came to their agreement with the statement “Tourism must be developed with consideration of the natural and cultural environment”, nor were there any significant differences (p (0.775 > 0.05) SE 0.04330) between the genders when it came to their agreement with the statement “Tourism must contribute to the improvement of the local community”. On a rating scale of 1–5, both genders “agreed” (avg = 4.0396) that this would be of importance.
Likewise, as shown in Table 6, there were significant differences (p (0.000 < 0.05) SE 0.04385) between the various ages when it came to their agreement with the statement “The tourism industry must ensure quality tourism experiences for visitors” as well as significant differences (p (0.002 < 0.05) SE 0.04025) between the ages when it came to their agreement with the statement “It is the responsibility of tourism businesses to meet visitor needs”. Lastly, there were significant differences (p (0.012 < 0.05) SE 0.04330) between the age groups when it came to the statement “Tourism must be developed with consideration of the natural and cultural environment”. In all instances, those over the age of 60 rated the statements higher, except for the last question, where those aged 30–44 rated it higher.
The fourth section of the survey was designed to assess U.S. visitors’ overall willingness to engage with, and pay extra for, culturally respectful tourism and sustainable tourism. According to Table 7, most of the respondents agreed with statements suggesting that the tourism industry should ensure quality tourism experiences, meet local community and visitor needs, contribute to the improvement of the local community, and be developed with consideration of the natural and cultural environment. Most participants in this survey considered themselves to be culturally sensitive and environmentally responsible, as well as indicating that they consider the impact of their actions when making vacation decisions. The results of this survey also suggest that it is important for most U.S. visitors that the tourism industry supports culturally respectful and environmentally sustainable tourism practices.
More specifically, the survey results indicated that there a significant difference (p (0.002 < 0.05) SE 0.04570) between genders in their agreement with the statement “When choosing a vacation destination, it is important to me that the tourism industry supports environmentally sustainable tourism practices”, with females rating this statement higher than males; on a rating scale of 1–5, women “agreed” and men remained “neutral” (avg = 3.7978). There was also a significant difference (p (0.043 < 0.05) SE 0.04235) between genders in their agreement with the statement “When choosing a vacation destination, it is important to me that the tourism industry supports culturally respectful tourism practices”, with females rating it higher than males; on a rating scale of 1–5, women “agreed” and men remained “neutral” (avg = 4.0879) to the statement. On average, both genders tended to agree with statements describing themselves as responsible, culturally sensitive, or considerate of the potential impacts of their actions when making many of their vacation decisions. There were no significant differences found between genders for those statements.
As Table 8 demonstrates by comparing the age groups, there were significant differences (p (0.012 < 0.05) SE 0.04025) in how the participants described themselves as environmentally responsible. Those over the age of 60 rated themselves highest (avg = 4.0625) on a scale of 1–5.
Moreover, there were significant differences (p (0.012 < 0.05) SE 0.02139) between the age groups when it came to their agreement with the question “As a tourist, would you be willing to pay more to support sustainable tourism in Hawai’i?”, where those aged 45–60 were willing to pay the most. The average was reported to be (avg = 1.3643), see Table 9).
Furthermore, as shown in Table 10, there were significant differences (p (0.018 < 0.05) SE 2.445) between the ethnicities when it came to their agreement with the statement “As a tourist, would you be willing to pay more to support locally grown food (produce, meat, and fish) in order to support Hawaii’s farming industry?”; those marked as “Other”, followed by “Black or African American” were willing to pay the most. The average was reported to be (avg = 1.7000).
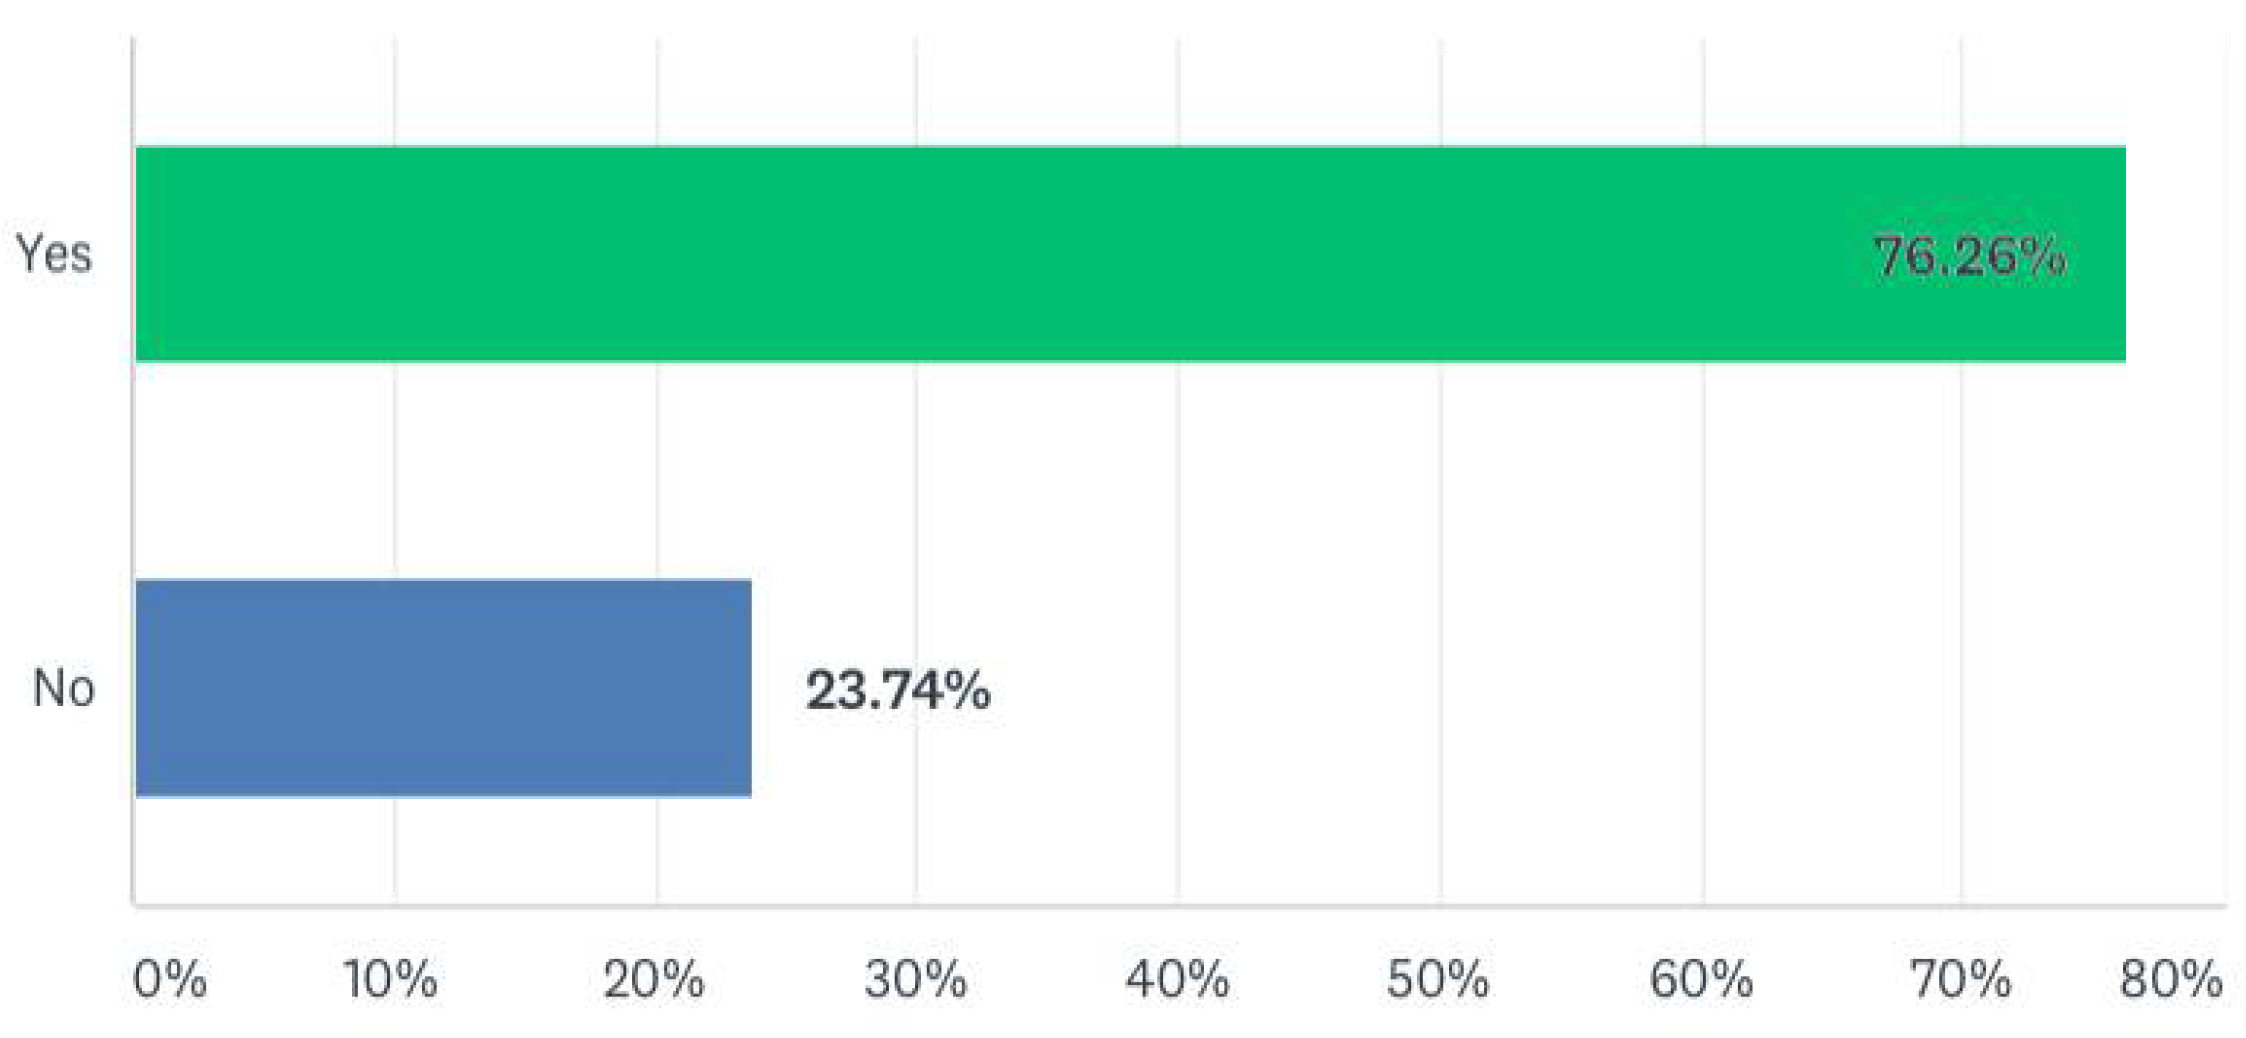
When it came to supporting tourism experiences that are respectful of the Native Hawaiian culture, 76.26% of participants also stated that they would be willing to pay more, see Figure 4.
According to 
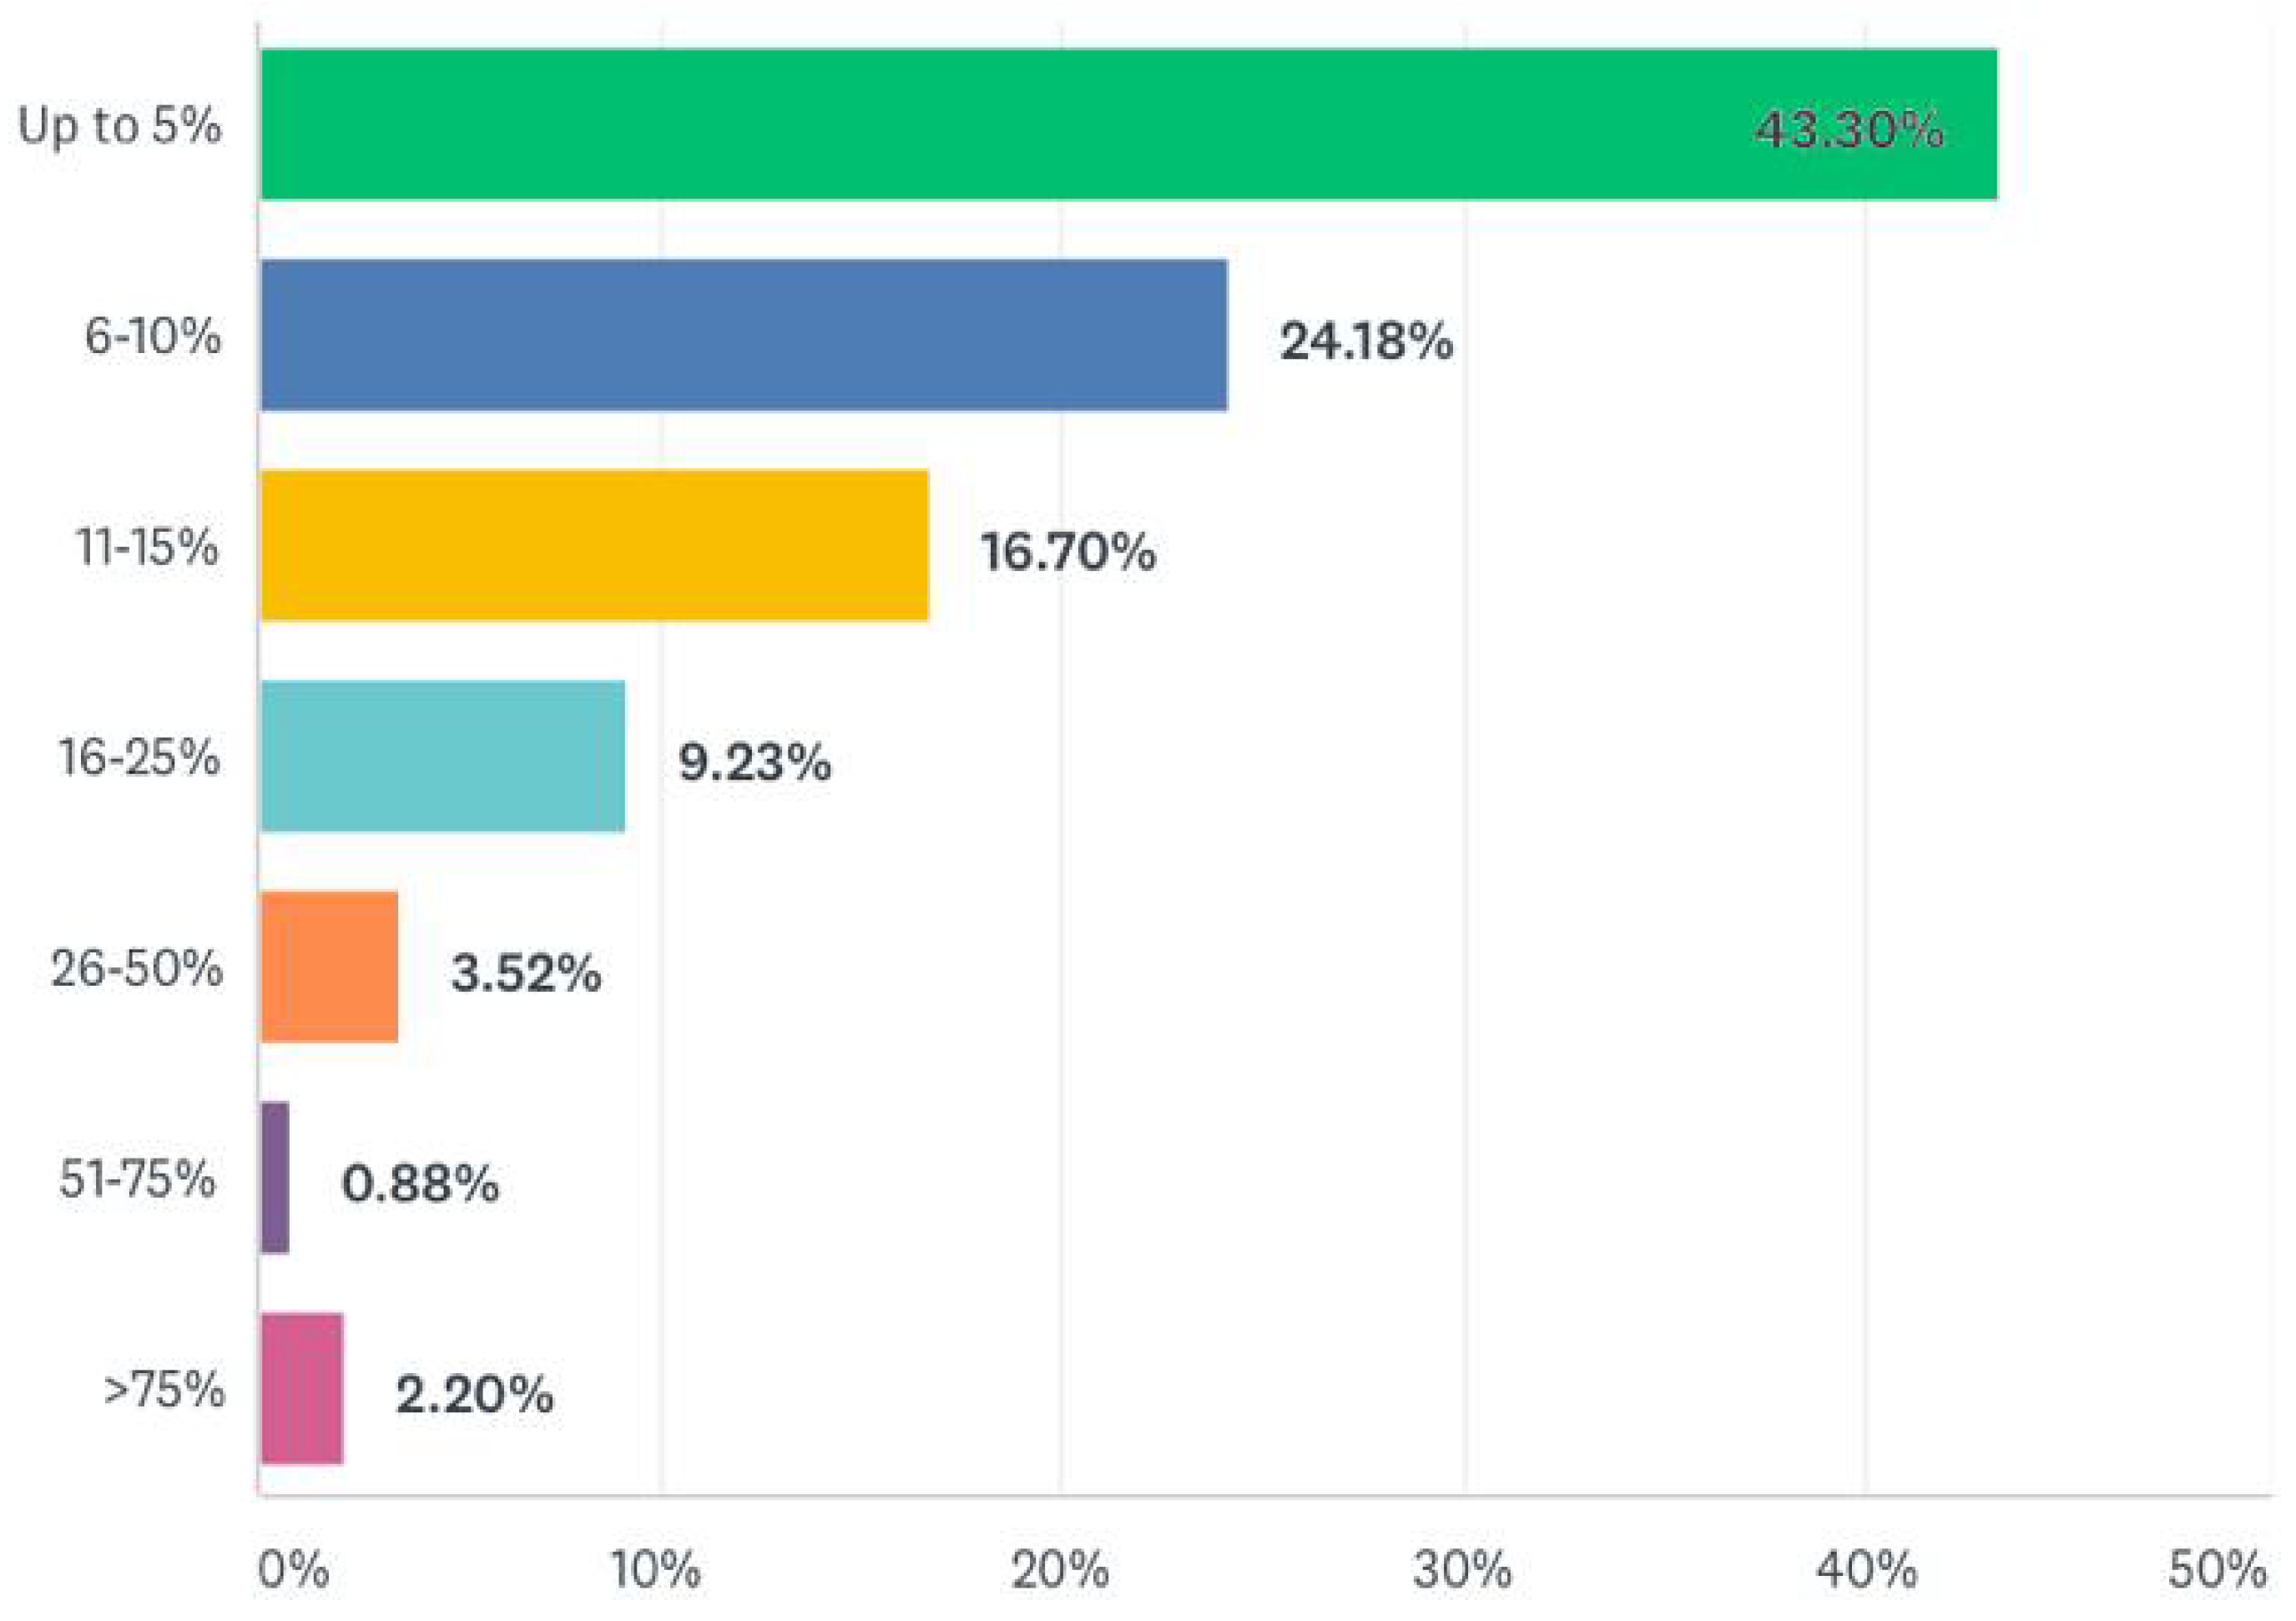
Figure 5, more than 3 out of 4 (76.26%) of the respondents answered that “yes”, they would be willing to pay more to support tourism experiences that are respectful of the Native Hawaiian culture, with close to 60 % (58.49%) of the participants being willing to increase their typical travel expenditures by 6% or more in order to support tourism experiences that respect the Native Hawaiian culture, while over 35% (35.39%) of the participants were willing to pay more than 10% extra. In addition, close to 20% (18.69%) of the U.S. participants were willing to pay an additional 16% or more for experiences that are respectful of Hawaiian culture.
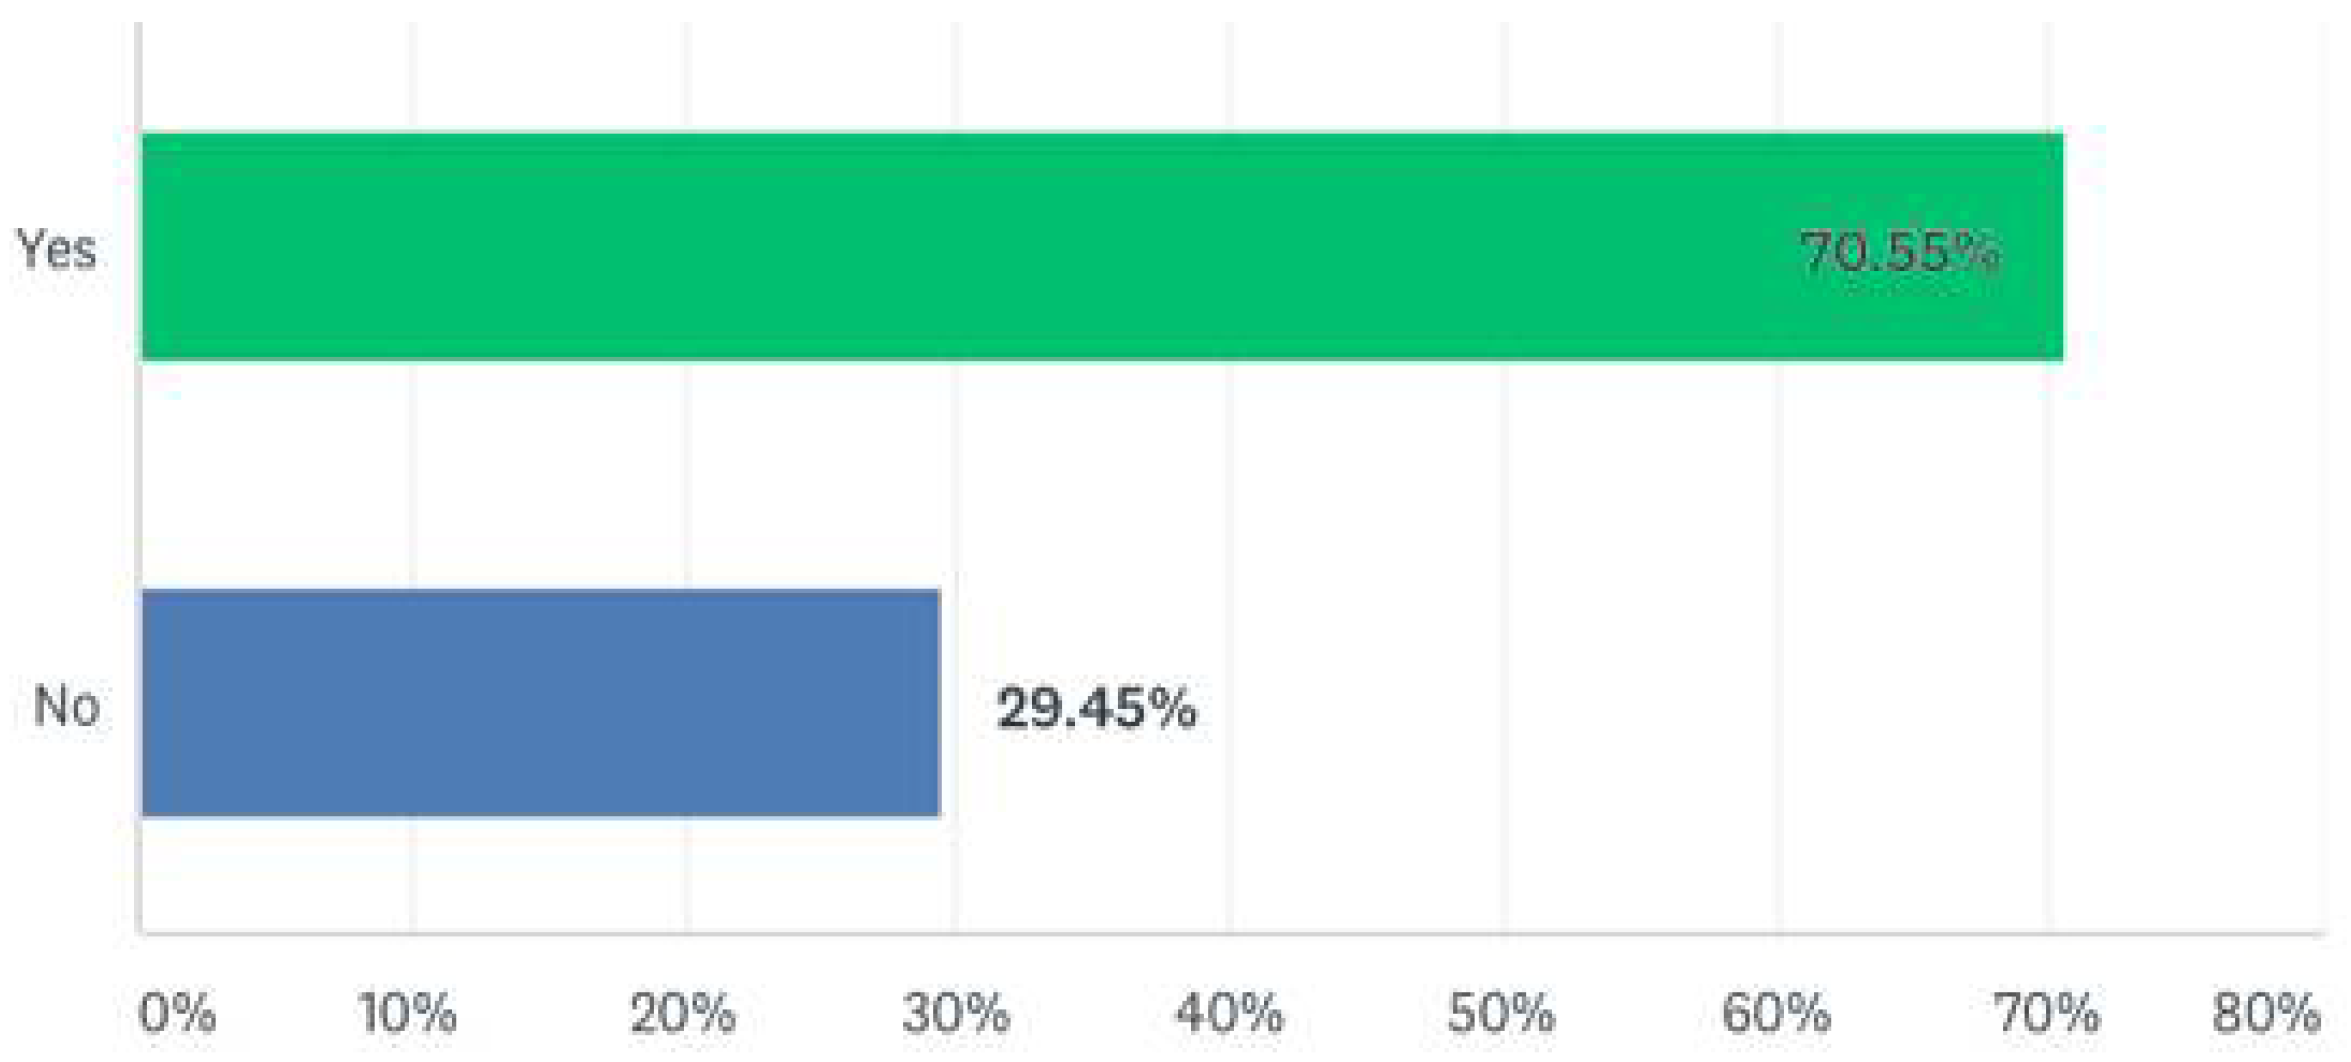
Over 70% of the U.S. visitors sampled indicated that they would be willing to pay more to support tourism experiences that were sustainable. This represents an increase of 38% from a study conducted in 2020 by MMGY Global (Leposa 2020). The younger generation is pushing more and more towards sustainability, see Figure 6.
While the majority of the tourists (65.71%) stated that they would pay in excess of 6% more, approximately one-third (32.53%) stated that they would pay over 10% more for activities or experiences to support sustainable tourism in Hawai’i.
Of the 70% of the U.S. visitors sampled who were willing to increase their typical travel expenditure for sustainable tourism and to support tourism practices that respect Native Hawaiian culture, the mean was 6–10%, see Figure 7.
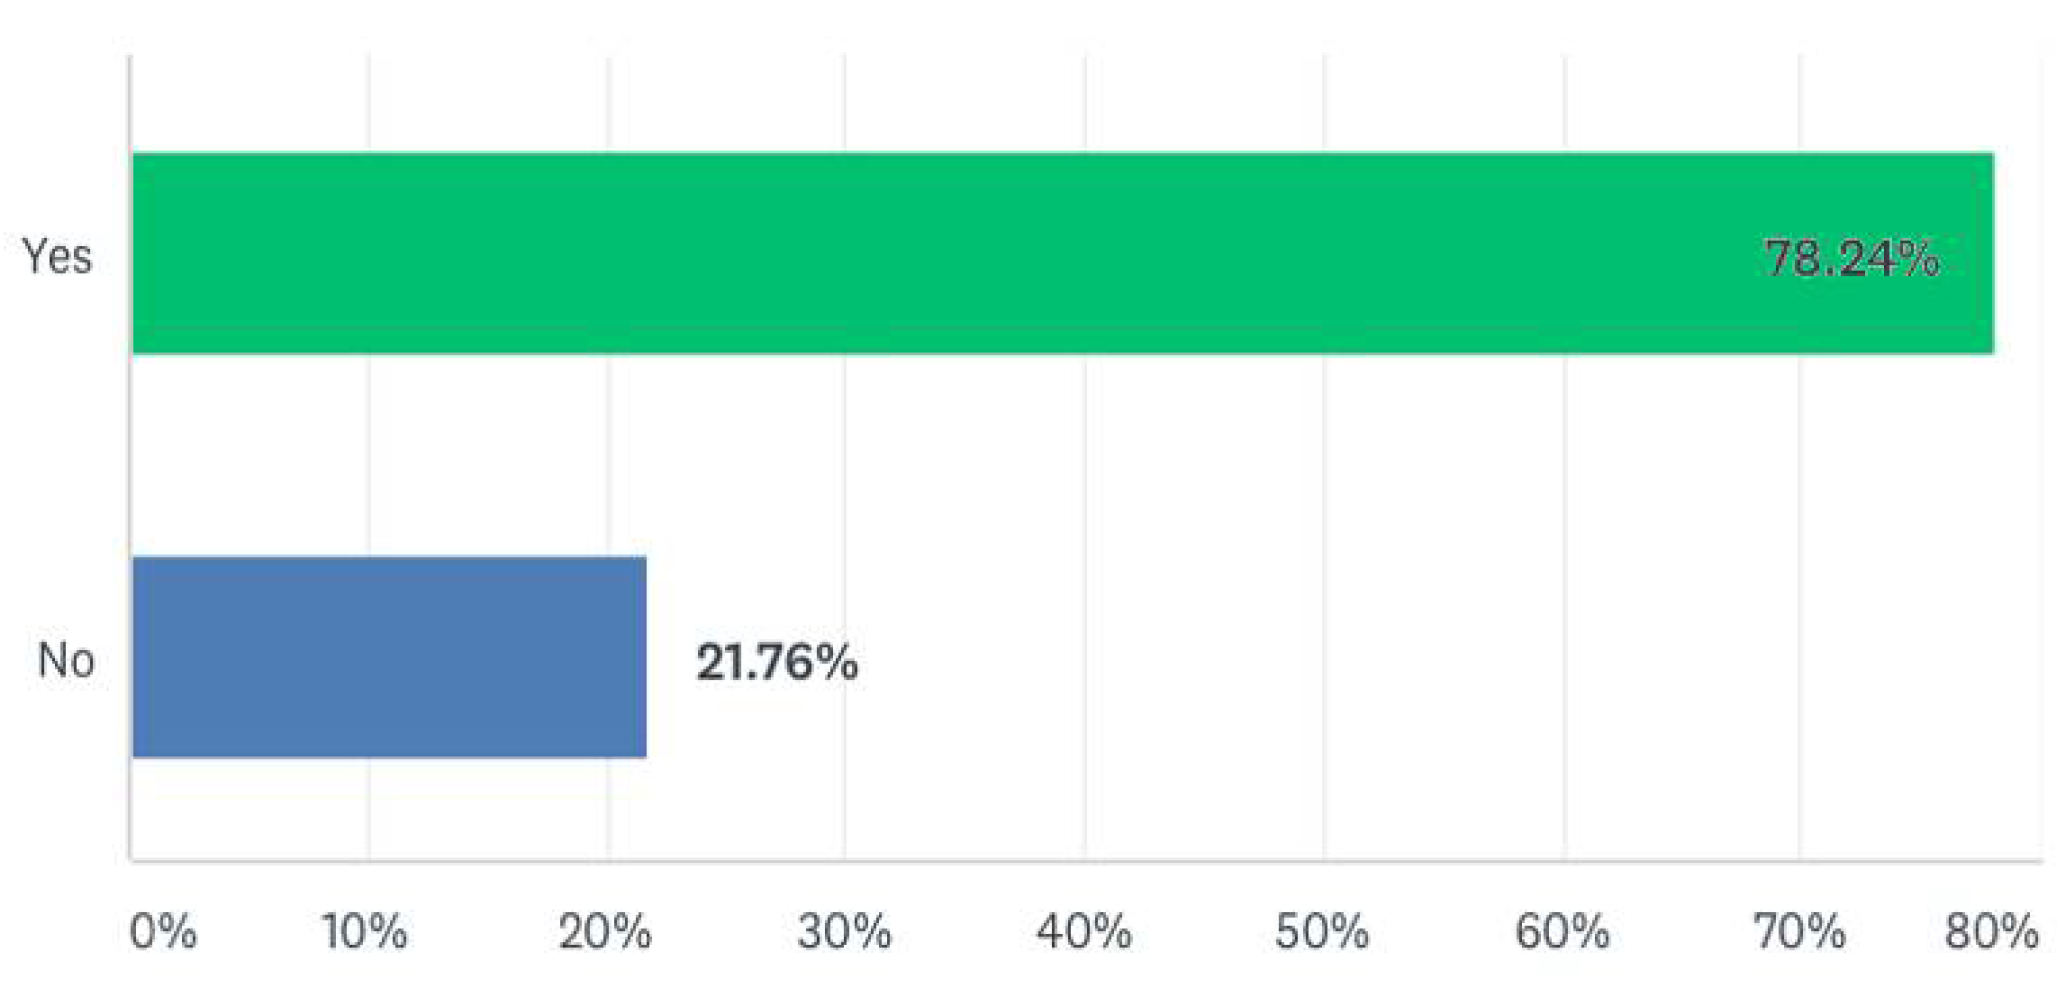
A total of 78.24% of the respondents indicated that they would be willing to support locally grown food to support Hawai’i’s farming industry, see Figure 8.
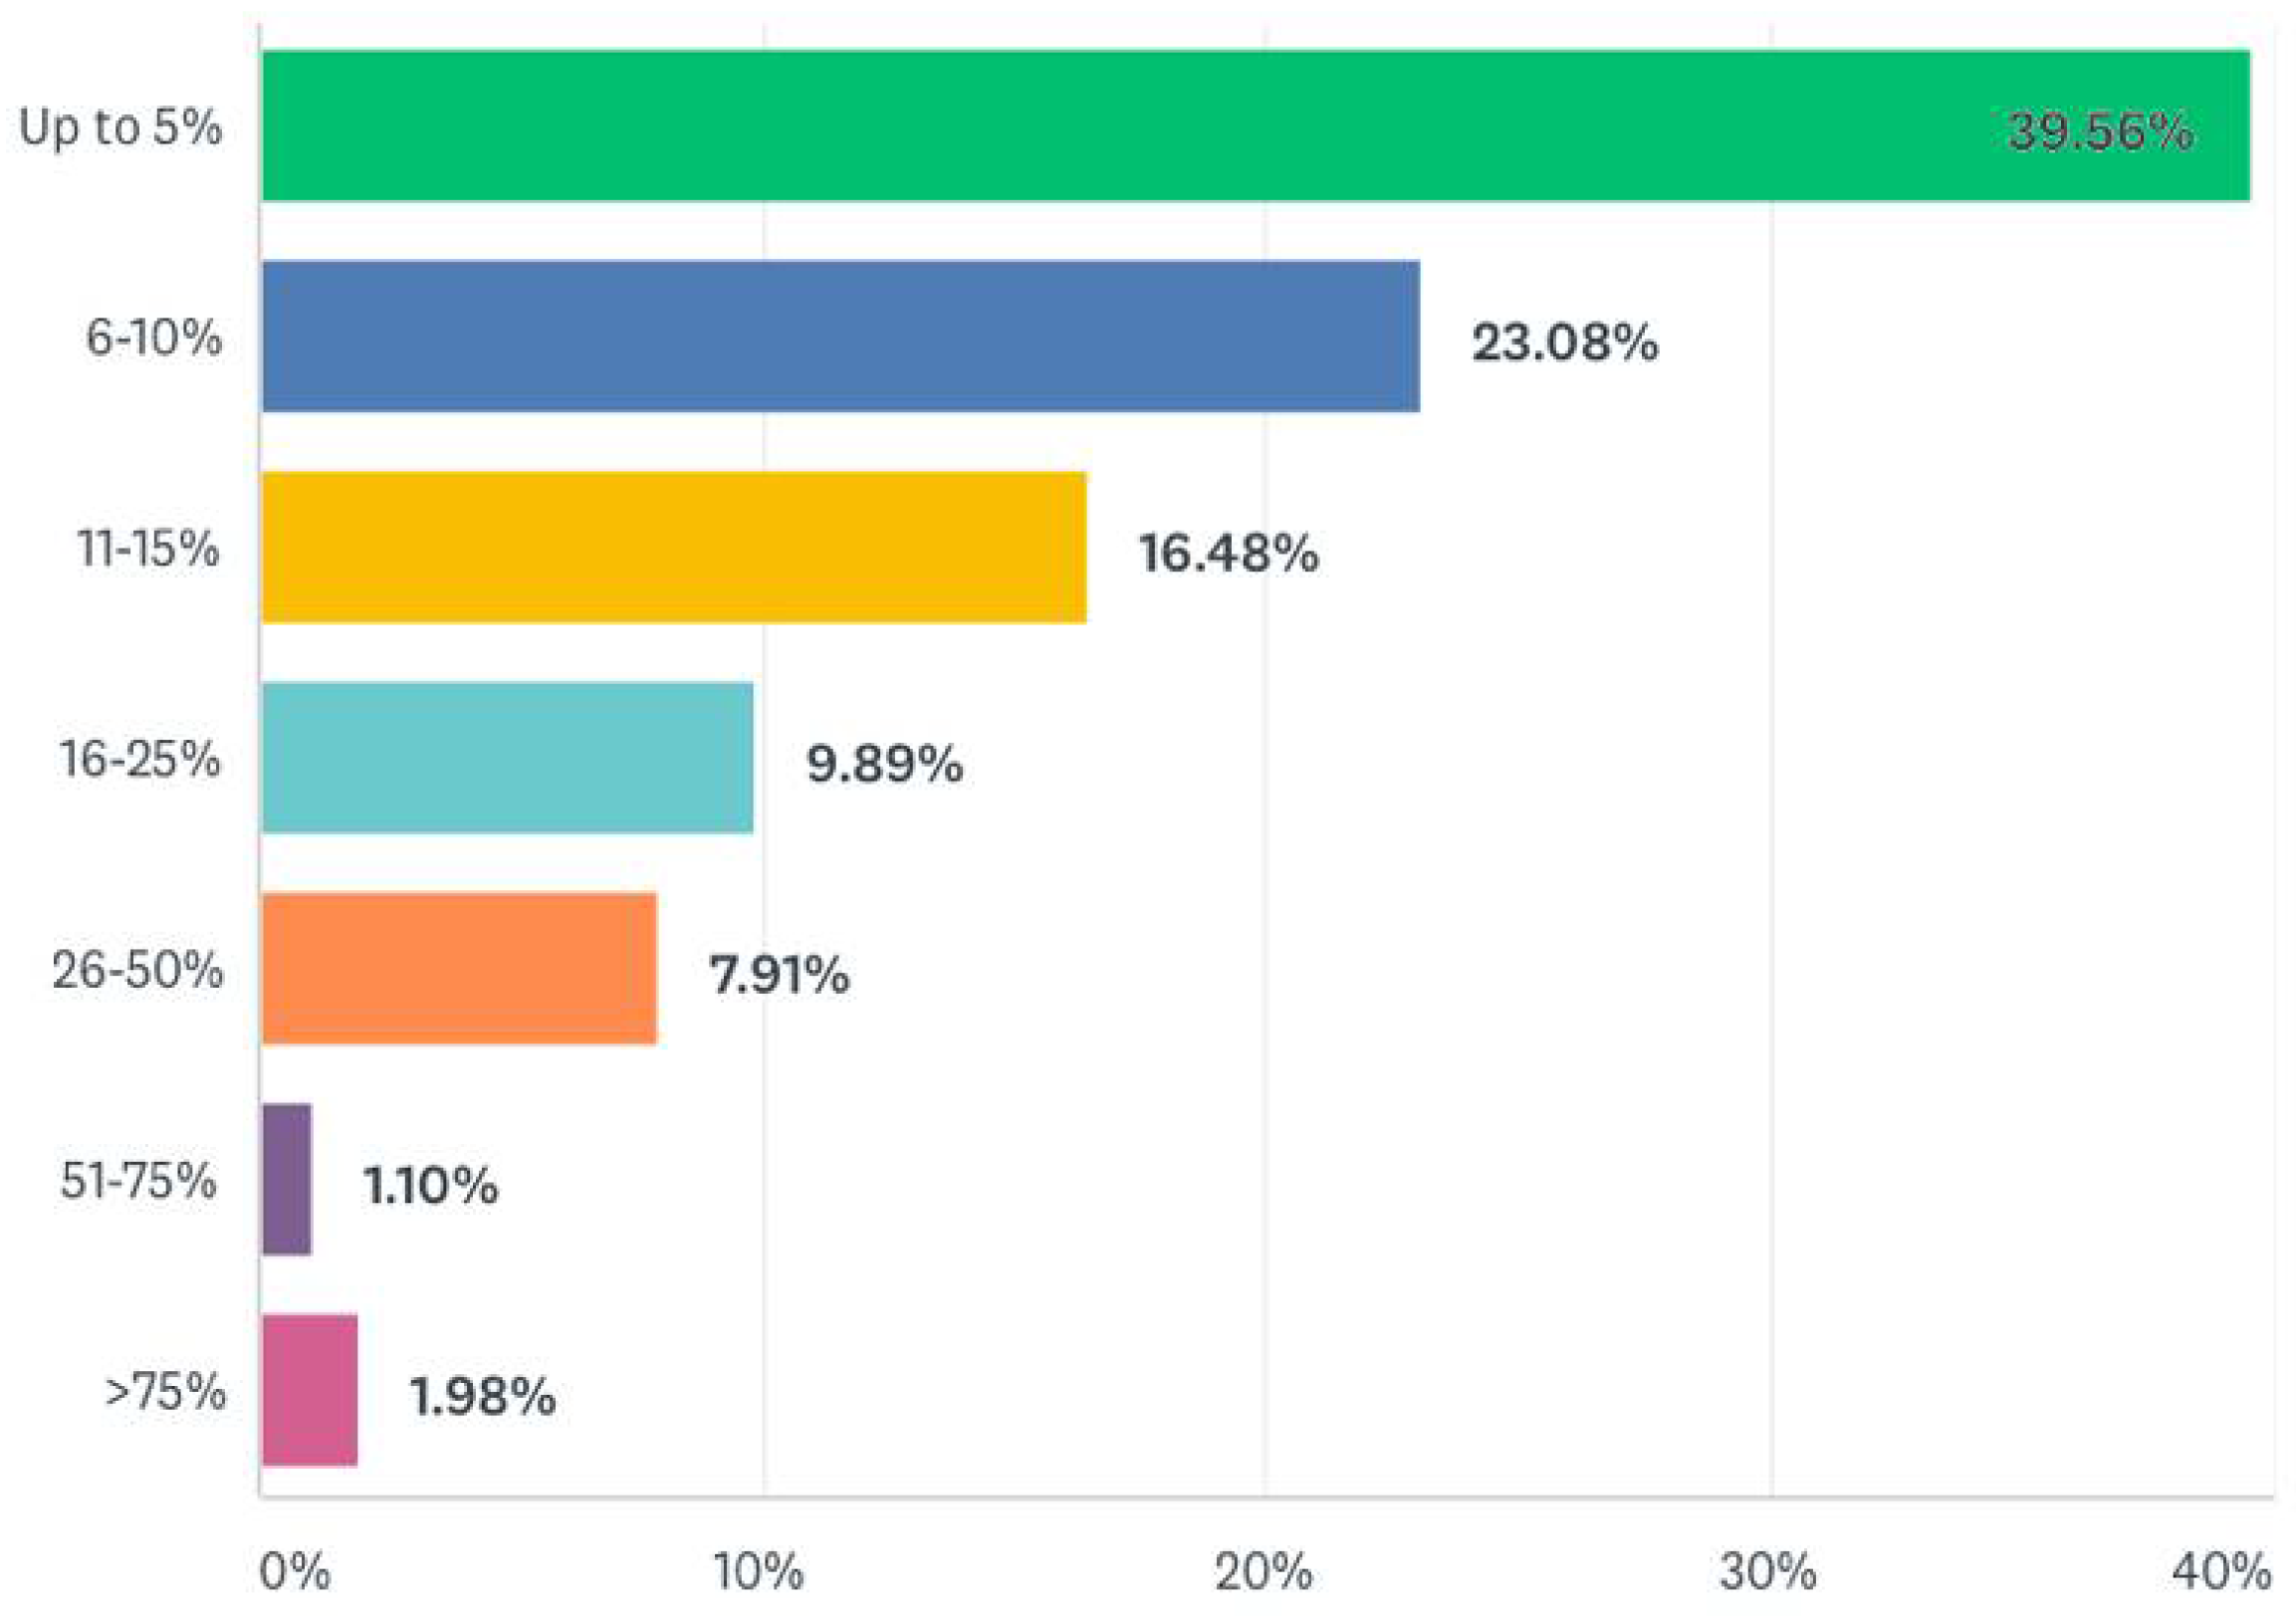
Close to 80% (78.24%) of respondents stated that they were willing to pay more to support locally grown food (produce, meat, and fish) in order to support Hawai’i’s farming industry”. More than 20% (20.88%) of survey participants indicated that they would be willing to increase their restaurant/hotel food bill by 16% or more, while over 37% of survey participants indicated that they would be willing to increase their bill by 11% or more, in order to support Hawai’i’s local farming industry. This provides quantifiable evidence that visitors to Hawaii are willing to increase their restaurant bills/hotel food expenditure in order to support Hawai’i’s local farming industry, see Figure 9.
The last portion of the questionnaire measured the demographic characteristics of the survey respondents using ordinal scale variables. The descriptive analysis includes the values shown in Table 11 for the mean, median, mode, standard deviation, skewness, and kurtosis. SPSS was used to calculate the values. Where the majority of the respondents were between 30 and 44 years of age, the standard deviation indicates a small intermediate distribution between the means, showing that the respondents agree. The data were evaluated for normality and found to be within +/− 1.00 and normally distributed for age (0.134), gender (−0.400), and region (−0.285). The dataset for ethnicity (−1.045) was skewed to the left, while the data for relationship status (1.900) and number of children (1.382) were skewed to the right. The kurtosis indicates the extent to which a distribution departs from the bell-shaped or normal curve. The values for age (−1.160), gender (−1.848), and region (−1.176) were found to be flatter than normal, while the value for number of children (3.258) was peakier than normal.
Over half (59.78%) of the total sample respondents identified as female, whereas 40.22% were male. Of the U.S. citizens surveyed, 28% were between the ages of 18 and 29, 27% were between the ages of 30 and 44, 31% were between the ages of 45 and 60, and 14% were over 60 years of age. More than 50% of the survey respondents indicated that they had a college degree, and 21.54% indicated that they had taken some college classes. Most of the survey respondents identified as ethnically White or Caucasian (59.34%), were married (63.74%), and had children (58.46%). Most survey participants indicated that they were employed full-time (49.89%), followed by 11.87% who indicated that they were employed part-time and 9.45% who were retired.
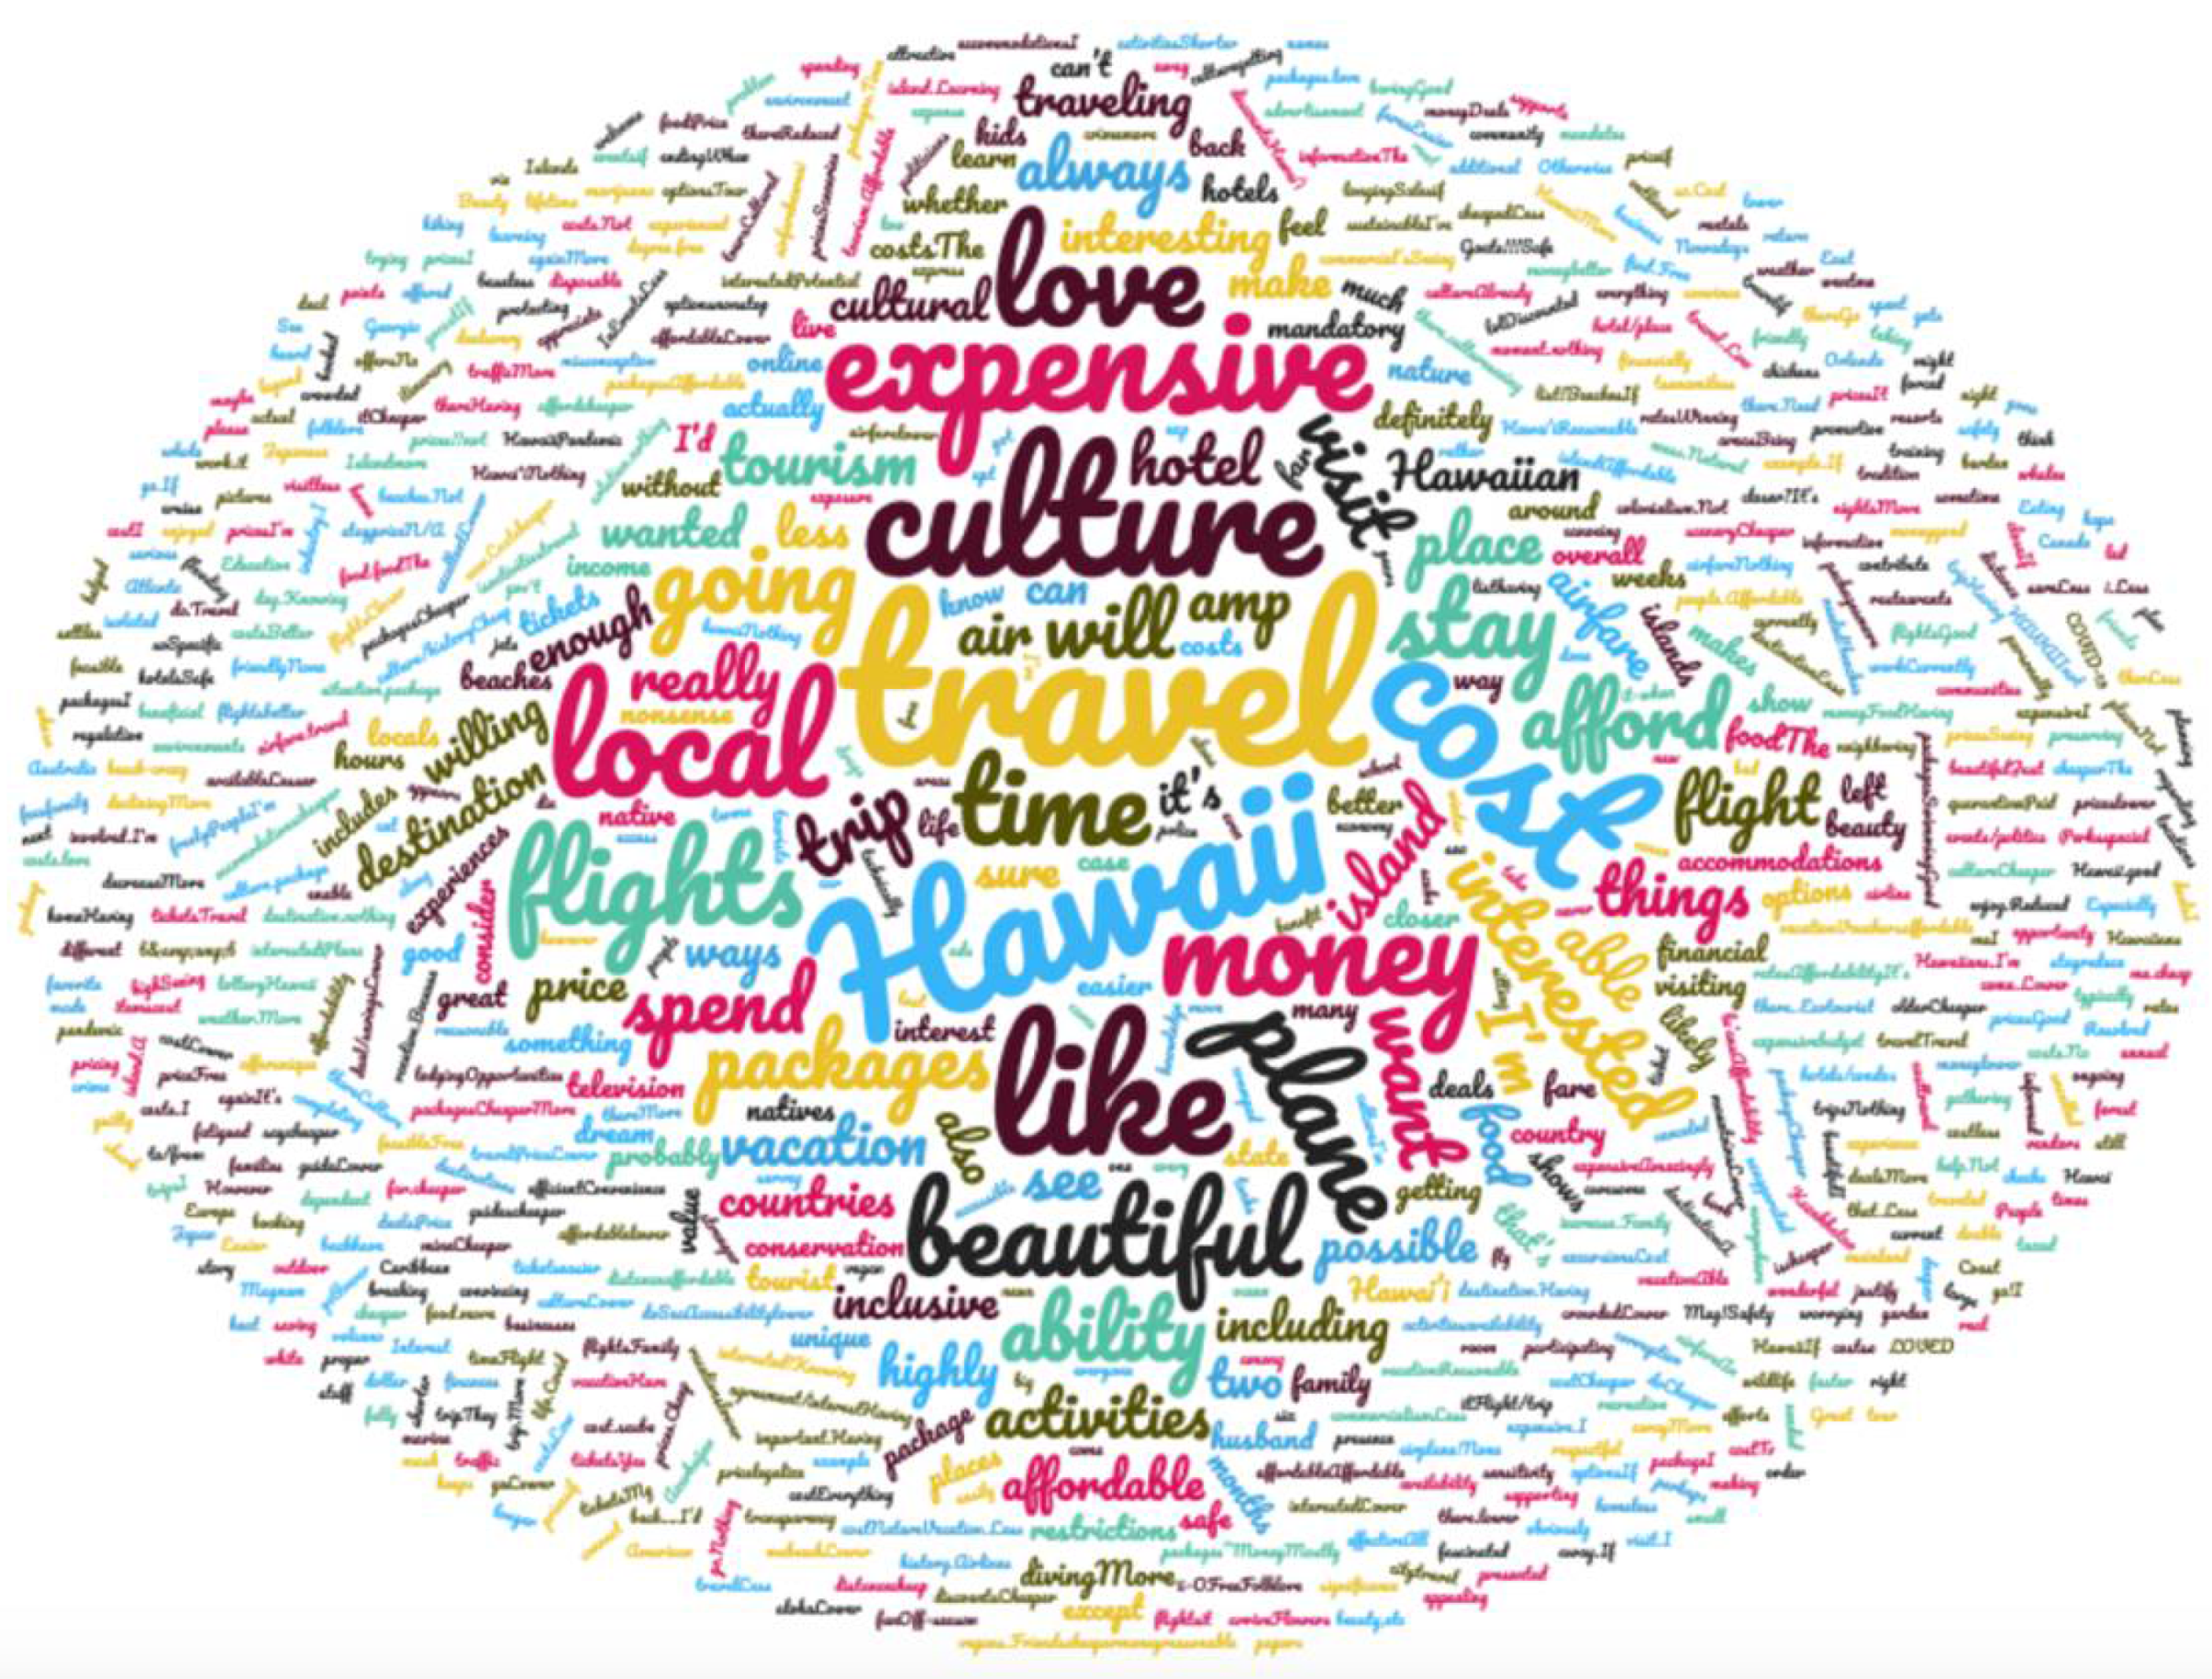
The open-ended question “What comes to mind when thinking of Hawai’i as a travel destination?“ revealed that cost was a significant concern for many survey participants. A majority of the participants indicated that expense was a major concern when planning a vacation in Hawai’i, but had a desire to go if money was no object. Despite the concerns over cost, many participants had a positive perception of Hawai’i as a tourist destination due to the destination’s family-friendliness, beautiful beaches, good food, culture, and nature.
A word cloud, also known as a tag cloud or text mining, is a visual representation of text data in the form of tags, which are usually single words whose importance is indicated by their size and color, as exemplified in Figure 10. As unstructured data in the form of text continue to expand at an unparalleled rate, particularly in the realm of social media, there is an increasing need to assess the large amounts of text generated by these platforms. Applying the responses from the open-ended survey question, one can see clearly what comes to mind for the respondents when thinking of Hawaii. One can then easily see themes of the respondents’ thoughts, which is useful, as it helps to showcase what is important to visitors and, thus, to continue to attract visitors to the islands, see Figure 10.
Some of the comments mentioned were:
  • “Flowers. Beauty. People of the island.”
  • “Have been there 3–4 times and enjoyed it over the years. Great place for families to enjoy.”
  • “Hawaii is awesome as is.”
  • “Unique areas, something that isn’t in most places.”
  • “Safe travel.”
  • “Opportunities to learn about local culture.”
  • “Less expensive airline travel I am personally interested in saving and protecting the whales. I am fascinated with Hawaiian culture and folklore. “
  • “I have an Interest in the forest and wildlife conservation on the islands. I also have an interest in the conservation of the marine life around the island.”

5. Discussion

The purpose of this study was, ultimately, to examine the trend towards an “authentic Hawaiian culture” tourism experience, and to evaluate whether there is a demand from U.S. visitors for a deeper integration and representation of Hawaiian culture in tourism offerings, along with tourists’ willingness to pay (WTP) for the experience. To investigate these questions, a contingent valuation survey instrument was distributed to U.S. citizens via Momentive, designed around four specific research questions: “Are continental U.S. visitors interested in Hawaiian Culture?”; “Are visitors from the continental U.S. interested in tourism experiences designed and/or facilitated by Native Hawaiians?”; “Are U.S. visitors willing to increase their expenditures (WTP) to support culturally respectful tourism experiences in Hawai’i?”; and “Are U.S. visitors willing to increase their expenditures (WTP) to support sustainable tourism experiences in Hawai’i?”.
Revisiting these research questions, the following can be concluded based on the results of the online survey:
RQ 1: Are continental U.S. visitors interested in Hawaiian Culture? In line with recent cultural tourism literature, the survey data suggest significant visitor interest in Hawaiian culture during their visit. Based on the survey results, participants seemed to have a positive outlook on Hawaiian culture, with a majority of respondents indicating that Hawaiian culture is a significant part of their image of Hawai’i, is important to their perception of Hawai’i as a vacation destination and is an important aspect of their Hawai’i experience. Additionally, almost half of the survey respondents indicated an interest in learning about Hawaiian culture (mean = 3.4703).
RQ 2: Are visitors from the continental U.S. interested in tourism experiences designed and/or facilitated by Native Hawaiians? When asked directly about their interest in tourism experiences designed and/or facilitated by Native Hawaiians, most survey participants indicated that it was important to participate in such experiences (mean = 3.6901). Over half of the survey respondents reported that it was also important to interact with local residents while on vacation (mean = 3.6747). These results suggest that there is a considerable interest from the U.S. citizens surveyed in tourism experiences designed and/or facilitated by Native Hawaiians.
RQ 3: Are U.S. visitors willing to pay (WTP) more to support culturally respectful tourism experiences in Hawai’i? There was significant evidence to suggest that U.S. visitors are willing to pay (WTP) more to support culturally respectful tourism experiences in Hawai’i. When asked whether they were willing to pay more to support tourism experiences that were respectful of Hawaiian culture, a strong majority (over 76%) of the survey respondents indicated “yes”. Furthermore, over 35% (35.39%) of the participants were willing to pay more than 10% extra. In addition, close to 20% (18.69%) of the U.S. participants were willing to pay an additional 16 % or more for experiences that are respectful of Hawaiian culture.
RQ 4: Are U.S. visitors willing to pay (WTP) more to support sustainable tourism experiences in Hawai’i? There was significant evidence to suggest that U.S. visitors are willing to pay more to support sustainable tourism in Hawai’i. When asked whether they were willing to pay more to support sustainable tourism in Hawai’i, over 70% of survey respondents answered “yes”. While most of the tourists (65.71%) stated they would pay in excess of 6% more, approximately one-third (32.53%) stated they would pay over 10% more for activities or experiences to support sustainable tourism in Hawai’i. In addition, over 78% of the survey participants also indicated that they were willing to pay more for locally grown food to support Hawaii’s farming industry; while the highest percentage of survey participants suggested that they were willing to pay up to 5% more, the mean of the data responses fell in the 6–10% range; this would result in a lower carbon footprint, being more sustainable because of the shipping distance to Hawaii being no less than 3500 miles from the nearest land mass.

6. Conclusions and Recommendations

The findings of this study fill the gap in the tourism research literature by providing quantitative evidence of U.S. visitors’ interest in Hawaiian culture and tourism experiences designed and/or facilitated by Native Hawaiians, along with the tourists’ willingness to pay (WTP) additional fees for these experiences. In addition, there is quantifiable evidence suggesting that U.S. visitors are willing to pay (WTP) extra to support sustainable tourism in Hawai’i. Furthermore, the findings of this research suggest that there are only slight differences in the perceptions of Hawaiian culture between U.S. visitors who have visited Hawai’i before and those who are first-time visitors to Hawai’i. In addition, those who have visited Hawai’i previously indicated a stronger self-rated knowledge of Hawaiian culture. The findings of this survey also suggest that female respondents considered Hawaiian culture to be more important than did their male counterparts. This study contributes to existing research by providing a better understanding of U.S. visitors’ interest in culturally respectful tourism practices and sustainable practices specifically relating to Hawai’i. Furthermore, the findings of this study provide empirical evidence that there is a willingness among U.S. visitors to pay more money to support culturally respectful tourism practices as well as sustainable practices in Hawai’i.
Recently, there have been changes in Hawai’i’s tourism governance. With these changes, there have been several new initiatives—including, but not limited to, the Hawaii Tourism Authority’s Malama Hawai’i campaign, and a new law that will add a fee for visitors participating in ocean-based activities in Hawai’i in 2024. The Malama Hawai’i campaign was designed to attract travelers interested in learning more about Hawaiian culture, and encourage mindful travelers to give back to the destination by participating in volunteer opportunities (Hawaii Tourism Authority Launches 2021). Many incentives were provided by industry partners in Hawai’i; for example, one incentive might be a free night’s stay at a participating Hawai’i hotel if tourists were willing to provide volunteer serves such as working in the restoration of an “ancient Hawaiian fishpond” or working in a “Lo’i” or “Tara patch”. The Hawaii Tourism Authority (HTA) has started the Malama Hawai’i campaign, which is centered on educating the traveler to facilitate a better connection with the Hawaiian culture and resource preservation (Hawaii Tourism Authority Launches 2021). The new law introduced in June 2021 adds a fee to ocean-based activities in order to aid in the conservation of natural resources by increasing funding (Gov. David Ige Marks World Oceans Day with Bill Signing Ceremony Addressing Hawaii’s Marine Resources 2021). The findings of this study suggest that a considerable portion of the U.S. visitor market will likely be receptive to initiatives such as the ones described, and are willing to provide financial support by paying more to support culturally respectful tourism experiences in Hawai’i.
A study of this nature can be replicated in other destinations to assess major market interest in culturally respectful and sustainable tourism practices. From a marketing perspective, the results of this study provide a deeper insight into the perceived image of a destination, and allow for more tailored marketing efforts that support both visitor demand and destination needs. This study also contributes general information about the typical U.S. traveler, which can be utilized as destinations start to reopen and there are increases in travel as more individuals in the United States become vaccinated.
There are some limitations to this study. The results and findings of this study are not generalizable to other major market areas of tourism for Hawai’i. Future studies can also expand to explore the perceptions of Hawaiian culture in the tourism experience for other major market areas following the COVID-19 pandemic. Another avenue of research would be to look at Hawaiian residents’ perceptions of Hawaiian culture in the tourism experience for visitors to Hawai’i.
While the effects of the COVID-19 pandemic will continue to have significant impacts on the global tourism industry for the foreseeable future, Hawai’i has the unprecedented opportunity to embrace its current slower tourism flows and refine its tourism product and tourism policies. This refinement process will involve a renewed dedication to addressing and meeting the needs of the local community, prioritizing the respect and appreciation of the Hawaiian culture and people, as well as determining tourists’ willingness to pay more for authentic Hawaiian cultural experiences. This study strives to explore one small aspect of the refinement process—the desires of the U.S. tourists to Hawai’i and their willingness to pay (WTP) for authentic Hawaiian cultural experiences, and for those tourism products to be economically sustainable.

Author Contributions

Conceptualization, G.A., J.A.; H.I.; and J.L.; methodology, G.A., J.A., formal analysis, C.L.; H.I.; and G.A.; investigation, G.A.; writing—original draft preparation, G.A., H.I.; C.L., J.L., and J.A.; writing—review and editing, H.I., G.A., C.L., and J.L. All authors have read and agreed to the published version of the manuscript.

Funding

This research received no external funding.

Institutional Review Board Statement

The study was conducted according to the guidelines of the Declaration of Helsinki, and approved by the Institutional Review Board of the University of Hawaii at Manoa (protocol code 2020-00104 and approval on 19 February 2021).

Informed Consent Statement

Informed consent was obtained from all subjects involved in the study.

Data Availability Statement

The data presented in this study is not publicly available.

Acknowledgments

The researchers appreciate the Shidler Summer research grant from the Shidler College of Business at the University of Hawaii at Manoa, which has supported this research project.

Conflicts of Interest

The author declares no conflict of interest.

References

  1. Agrusa, Jerome, Wendy Coats, and Jon Donlon. 2003. Working from a bottom-up approach: Cultural and heritage tourism. International Journal of Tourism Sciences 3: 121–28. [Google Scholar] [CrossRef]
  2. Agrusa, Jerome. 1994. Group tours in Hawai’i: A survey and analysis. Annals of Tourism Research 21: 146–47. [Google Scholar] [CrossRef]
  3. Agrusa, Wendy, Joseph Lema, John Tanner, Tanya Host, and Jerome Agrusa. 2010. Integrating sustainability and Hawaiian culture into the tourism experience of the Hawaiian Islands. Pasos (Tenerife (Canary Islands)) 8: 247–64. [Google Scholar] [CrossRef]
  4. Air Passenger Forecasts: Potential Paths for Recovery into the Medium-and Long-run Rep. 2020. Tourism Economics and the International Air Transport Association. Montreal: International Air Transport Association. [Google Scholar]
  5. Alonso, Abel Duarte, Seng Kiat Kok, Alessandro Bressan, Michelle O’Shea, Nikolaos Sakellarios, Alex Koresis, Maria Alejandra Buitrago Solis, and Leonardo J. Santoni. 2020. COVID-19, aftermath, impacts, and hospitality firms: An international perspective. International Journal of Hospitality Management 91: 102654. [Google Scholar] [CrossRef] [PubMed]
  6. Barbieri, Carla, and Edward Mahoney. 2010. Cultural tourism behaviour and preferences among the live-performing arts audience: An application of the univorous–omnivorous framework. International Journal of Tourism Research 12: 481–96. [Google Scholar] [CrossRef]
  7. Brewbaker, Paul, Frank Haas, and James Mak. 2019. Charting a New Course for Hawai’i Tourism (Issue brief). Available online: https://uhero.hawaii.edu/wp-content/uploads/2020/04/HTASustainableDestinationManagement-1.pdf (accessed on 17 May 2021).
  8. Brunt, Paul, and Paul Courtney. 1999. Host perceptions of sociocultural impacts. Annals of Tourism Research 26: 493. Available online: http://search.ebscohost.com.eres.library.manoa.hawaii.edu/login.aspx?direct=true&db=hoh&AN=COMP64933840&site=ehost-live (accessed on 20 June 2021). [CrossRef]
  9. Butler, Richard W. 1999. Sustainable tourism: A state-of-the-art review. Tourism Geographies: Sustainable Tourism 1: 7–25. [Google Scholar] [CrossRef] [Green Version]
  10. Chang, Chia-Lin, Michael McAleer, and Vicente Ramos. 2020. A charter for sustainable tourism after COVID-19. Sustainability 12: 3671. [Google Scholar] [CrossRef]
  11. Chiabai, Aline, Krassimira Paskaleva, and Patrizia Lombardi. 2013. e-Participation model for sustainable cultural tourism management: A bottom-up approach. International Journal of Tourism Research 15: 35–51. [Google Scholar] [CrossRef] [Green Version]
  12. Cohen, Erik. 1988. Authenticity and commoditization in tourism. Annals of Tourism Research 15: 371–86. [Google Scholar] [CrossRef]
  13. Dredge, D. 2017. “Overtourism” Old Wine in New Bottles? Available online: https://www.linkedin.com/pulse/overtourism-old-wine-new-bottles-dianne-dredge/ (accessed on 20 June 2021).
  14. Dube, Kaitano, Godwell Nhamo, and David Chikodzi. 2020. COVID-19 cripples global restaurant and hospitality industry. Current Issues in Tourism 24: 1487–90. [Google Scholar] [CrossRef]
  15. Engeset, Marit Gundersen, and Ingunn Elvekrok. 2015. Authentic concepts: Effects on tourist satisfaction. Journal of Travel Research 54: 456–66. [Google Scholar] [CrossRef]
  16. Fact Sheet: Benefits of Hawai’i’s Tourism Economy Rep. 2019. Honolulu: Hawai’i Tourism Authority. Available online: https://www.hawaiitourismauthority.org/media/4167/hta-tourism-econ-impact-fact-sheet-december-2019.pdf (accessed on 20 June 2021).
  17. Farzanegan, Mohammad Reza, Hassan F. Gholipour, Mehdi Feizi, Robin Nunkoo, and Amir Eslami Andargoli. 2020. International tourism and outbreak of coronavirus (COVID-19): A cross-country analysis. Journal of Travel Research 60: 687–92. [Google Scholar] [CrossRef]
  18. Galvani, Adriana. 2020. COVID-19 is expanding global consciousness and the sustainability of travel and tourism. Tourism Geographies 22: 567–76. [Google Scholar] [CrossRef]
  19. Gnotha, J., and Ning Wang. 2015. Authentic knowledge and empathy in tourism. Annals of Tourism Research 50: 170–72. [Google Scholar] [CrossRef]
  20. Gov. David Ige Marks World Oceans Day with Bill Signing Ceremony Addressing Hawaii’s Marine Resources. 2021. KHON2. June 9. Available online: https://www.khon2.com/local-news/gov-david-ige-marks-world-oceans-day-with-bill-signing-ceremony-addressing-hawaiis-marine-resources/ (accessed on 10 June 2021).
  21. Gursoy, Dogan, and Christina G. Chi. 2020. Effects of COVID-19 pandemic on hospitality industry: Review of the current situations and a research agenda. Journal of Hospitality Marketing & Management 29: 527–29. [Google Scholar] [CrossRef]
  22. Hawai’i Saw more than 10 m Visitors. 2020. Hawai’i Saw more than 10 m Visitors Last Year, but not Everyone is Celebrating. Hawai’i News Now. January 30. Available online: https://www.hawaiinewsnow.com/2020/01/31/Hawai’i-saw-more-than-m-visitors-last-year-not-everyone-is-celebrating/ (accessed on 15 May 2021).
  23. Hawai’i Tourism Authority. 2019. 2019 Annual Visitor Research Report. Available online: https://www.hawaiitourismauthority.org/media/5062/2019-annual-report-final-for-posting.pdf (accessed on 15 May 2021).
  24. Hawai’i Tourism Authority. 2020. Hawai’i Visitor Statistics Released for September 2020 [Press release]. October 29. Available online: https://www.hawaiitourismauthority.org/media/5538/september-2020-visitor-statistics-press-release-final.pdf (accessed on 12 April 2021).
  25. Hawaii Tourism Authority Launches. 2021. Hawaii Tourism Authority Launches Educational Malama Hawaii Campaign. Available online: https://www.hawaiitourismauthority.org/news/news-releases/2021/hawaii-tourism-authority-launches-educational-malama-hawaii-campaign/ (accessed on 10 July 2021).
  26. Hawaiian Renaissance. 2009. The Honolulu Advertiser: Hawai’i’s Newspaper. Available online: http://the.honoluluadvertiser.com/article/2009/Aug/16/ln/hawaii908160330.html (accessed on 12 April 2021).
  27. HTA. 2019. Resident Sentiment Survey 2018 Highlights. Available online: https://www.hawaiitourismauthority.org/media/2984/resident-sentiment-presentation-to-hta-board-01-31-2019.pdf (accessed on 12 April 2021).
  28. Ioannides, Dimitri, and Szilvia Gyimóthy. 2020. The COVID-19 crisis as an opportunity for escaping the unsustainable global tourism path. Tourism Geographies 22: 624–32. [Google Scholar] [CrossRef]
  29. Kim, Hyounggon, Chia-Kuen Cheng, and Joseph T. O’Leary. 2007. Understanding participation patterns and trends in tourism cultural attractions. Tourism Management 28: 1366–71. [Google Scholar] [CrossRef]
  30. Kithiia, J., and S. Reilly. 2016. Real (or) staged? Authenticity and cultural portrayal in Indigenous tourism. Journal of Tourism & Hospitality 5. [Google Scholar] [CrossRef] [Green Version]
  31. Koens, Ko, Albert Postma, and Bernadett Papp. 2018. Is overtourism overused? Understanding the impact of tourism in a city context. Sustainability 10: 4384. [Google Scholar] [CrossRef] [Green Version]
  32. Lee, Tae-Hee, and John Crompton. 1992. Measuring novelty seeking in tourism. Annals of Tourism Research 19: 732–51. [Google Scholar] [CrossRef]
  33. Leong, L. 2018. Overtourism and Crowding at Our Favorite Spots. Hawai’i Business. January 5. Available online: https://www.hawaiibusiness.com/overtourism/ (accessed on 12 April 2021).
  34. Leposa, Adam. 2020. Stt: 32% Willing to Pay More for Sustainable Vacations. Available online: https://www.travelagentcentral.com/your-business/stats-32-willing-to-pay-more-for-sustainable-vacations (accessed on 12 April 2021).
  35. Liu, Zhenhua. 2003. Sustainable tourism development: A critique. Journal of Sustainable Tourism 11: 459–75. [Google Scholar] [CrossRef] [Green Version]
  36. Mak, J. 2015. Creating “Paradise of the Pacific”: How Tourism began in Hawai’i. UHERO. Available online: https://uhero.hawaii.edu/creating-paradise-of-the-pacific-how-tourism-began-in-hawaii/ (accessed on 12 April 2021).
  37. Maneenop, Sakkakom, and Suntichai Kotcharin. 2020. The impacts of COVID-19 on the global airline industry: An event study approach. Journal of Air Transport Management 89: 101920. [Google Scholar] [CrossRef] [PubMed]
  38. Markandya, A., and R. A. Ortiz. 2011. General introduction to valuation of human health risks. Encyclopedia of Environmental Health 871–78. [Google Scholar] [CrossRef]
  39. McKercher, Bob, and Hilary Du Cros. 2003. Testing a cultural tourism typology. International Journal of Tourism Research 5: 45–58. [Google Scholar] [CrossRef]
  40. McKercher, Bob. 2002. Towards a classification of cultural tourists. International Journal of Tourism Research 4: 29–38. [Google Scholar] [CrossRef]
  41. Milano, Claudio, Marina Novelli, and Joseph M. Cheer. 2019. Overtourism and tourismphobia: A journey through four decades of tourism development, Planning and local concerns. Tourism Planning & Development 16: 353–57. [Google Scholar] [CrossRef]
  42. Min, Jihye, Jerome Agrusa, Joseph Lema, and Harold Lee. 2020. The tourism sector and U.S. regional macroeconomic stability: A network approach. Sustainability 12: 7543. [Google Scholar] [CrossRef]
  43. Molnar, Andras. 2019. SMARTRIQS: A simple method allowing real-time respondent interaction in Qualtrics surveys. Journal of Behavioral and Experimental Finance 22: 161–69. [Google Scholar] [CrossRef]
  44. Niewiadomski, Piotr. 2020. COVID-19: From temporary de-globalisation to a re-discovery of tourism? Tourism Geographies 22: 651–56. [Google Scholar] [CrossRef]
  45. Park, Eunkyung, Byoung-Kil Choi, and Timothy J. Lee. 2019. The role and dimensions of authenticity in heritage tourism. Tourism Management 74: 99–109. [Google Scholar] [CrossRef]
  46. Perkumienė, Dalia, and Rasa Pranskūnienė. 2019. Overtourism: Between the right to travel and residents’ rights. Sustainability 11: 2138. [Google Scholar] [CrossRef] [Green Version]
  47. Qiu, Richard, Jinah Park, ShiNa Li, and Haiyan Song. 2020. Social costs of tourism during the COVID-19 pandemic. Annals of Tourism Research 84: 102994. [Google Scholar] [CrossRef]
  48. Qualtric. 2020. How to Determine the Correct Survey Sample Size. Available online: https://www.qualtrics.com/experience-management/research/determine-sample-size/ (accessed on 12 April 2021).
  49. Ruhanen, Lisa, Betty Weiler, Brent D. Moyle, and Char-lee J. McLennan. 2015. Trends and patterns in sustainable tourism research: A 25-year bibliometric analysis. Journal of Sustainable Tourism 23: 517–35. [Google Scholar] [CrossRef] [Green Version]
  50. S.B 2319. 2020. 13th Legislature, 2020 Reg. Sess. Available online: https://www.capitol.Hawaii.gov/session2020/bills/SB2319_.HTM (accessed on 12 April 2021).
  51. Shepherd, Robert. 2002. Commodification, culture and tourism. Tourist Studies 2: 183–201. [Google Scholar] [CrossRef] [Green Version]
  52. Sigala, Marianna. 2020. Tourism and COVID-19: Impacts and implications for advancing and resetting industry and research. Journal of Business Research 117: 312–21. [Google Scholar] [CrossRef] [PubMed]
  53. Snepenger, David, Jesse King, Eric Marshall, and Muzaffer Uysal. 2006. Modeling Iso-Ahola’s motivation theory in the tourism context. Journal of Travel Research 45: 140–49. [Google Scholar] [CrossRef]
  54. Stabler, Mike J., Andreas Papatheodorou, and M. Thea Sinclair. 2010. Economics of Tourism, 2nd ed. London: Routledge. [Google Scholar]
  55. Stylidis, Dimitrios, Avital Biran, Jason Sit, and Edith M. Szivas. 2014. Residents’ support for tourism development: The role of residents’ place image and perceived tourism impacts. Tourism Management 45: 260–74. [Google Scholar] [CrossRef]
  56. Suau-Sanchez, Pere, Augusto Voltes-Dorta, and Natàlia Cugueró-Escofet. 2020. An early assessment of the impact of COVID-19 on air transport: Just another crisis or the end of aviation as we know it? Journal of Transport Geography 86: 102749. [Google Scholar] [CrossRef] [PubMed]
  57. Sun, Xiaoqian, Sebastian Wandelt, and Anming Zhang. 2020. How did COVID-19 impact air transportation? A first peek through the lens of complex networks. Journal of Air Transport Management 89: 101928. [Google Scholar] [CrossRef] [PubMed]
  58. Taheri, Babak, Ross Curran, Kevin O’Gorman, and Babak Taheri. 2018. Sustainability and the authentic experience. Harnessing brand heritage—A study from Japan. Journal of Sustainable Tourism 26: 49–67. [Google Scholar] [CrossRef] [Green Version]
  59. Tapachai, Nirundon, and Robert Waryszak. 2000. An Examination of the Role of Beneficial Image in Tourist Destination Selection. Journal of Travel Research 39: 37–44. [Google Scholar] [CrossRef]
  60. Terrell, J. 2020. Will Hawai’i Finally be Able to Break its Dependence on Tourism? Honolulu Civil Beat. October 12. Available online: https://www.civilbeat.org/2020/10/will-hawaii-finally-be-able-to-break-its-dependence-on-tourism/ (accessed on 12 April 2021).
  61. Tran, Xuan, and Linda Ralston. 2006. Tourist preferences influence of unconscious needs. Annals of Tourism Research 33: 424–41. [Google Scholar] [CrossRef]
  62. United Nations World Tourism Organization. 2017. Tourism and Culture. Available online: https://www.unwto.org/tourism-and-culture (accessed on 12 April 2021).
  63. Wallace, D. 2020. One year later: The effects of Hawai’i’s illegal short-term rental ban. Honolulu Magazine. August 10. Available online: http://www.honolulumagazine.com/Honolulu-Magazine/September-2020/One-Year-Later-The-Effects-of-Hawaiis-Illegal-Short-Term-Rental-Ban/ (accessed on 12 April 2021).
  64. Wang, Ning. 1999. Rethinking authenticity in tourism experience. Annals of Tourism Research 26: 349–70. [Google Scholar] [CrossRef]
  65. Williams, Liza Keānuenueokalani, and Vernadette Vicuña Gonzalez. 2017. Indigeneity, sovereignty, sustainability and cultural tourism: Hosts and hostages at ʻIolani Palace, Hawai’i. Journal of Sustainable Tourism 25: 668–83. [Google Scholar] [CrossRef]
  66. Yeo, B. H. 2003. The Recreational Benefits of Coral Reefs: A Case Study of Pulau Payar Marine Park, Kedah, Malaysia 2003 ReefBase. Available online: http://www.reefbase.org/resource_center/publication/pub_20541.aspx (accessed on 12 April 2021).
  67. Yeoman, Ian, Danna Brass, and Una McMahon-Beattie. 2007. Current issue in tourism: The authentic tourist. Tourism Management 28: 1128–38. [Google Scholar] [CrossRef]
  68. Yerton, S. 2019. 10 Million Visitors: Can Hawai’i Survive Its Own Popularity? Honolulu Civil Beat. June 10. Available online: https://www.civilbeat.org/2019/07/10-million-visitors-can-hawaii-survive-its-own-popularity/ (accessed on 12 April 2021).
  69. Zenker, Sebastian, and Florian Kock. 2020. The coronavirus pandemic—A critical discussion of a tourism research agenda. Tourism Management 81: 104164. [Google Scholar] [CrossRef]
  70. Zhang, Junyi. 2020. Transport policymaking that accounts for COVID-19 and future public health threats: A PASS approach. Transport Policy 99: 405–18. [Google Scholar] [CrossRef] [PubMed]
Figure 1. Previous Hawai’i experience. Note: responses to the question “Have you ever vacationed in Hawai’i before?”.
Jrfm 14 00420 g001
Figure 2. Channels of destination information. Note: responses to the question “Where did you hear about Hawai’i as a vacation destination?”.
Jrfm 14 00420 g002
Figure 3. U.S. participants’ top images or characteristics of Hawai’i. Note: responses to the question “What are the top 3 images or characteristics that come to mind when you think of Hawai’i as a vacation destination? (Select ONLY 3 by checking in the boxes below.)”.
Jrfm 14 00420 g003
Figure 4. U.S. participants’ willingness to pay—experiences that are respectful of Hawaiian culture. Note: responses to the question “As a tourist, would you be willing to pay more to support tourism experiences that are respectful of the Native Hawaiian culture?”.
Jrfm 14 00420 g004
Figure 5. Amount U.S. participants are willing to pay—experiences that are respectful of Hawaiian culture. Note: responses to the question “If you responded ‘Yes’ to the previous question, how much would you be willing to increase your typical travel expenditures to support tourism experiences that respect the Native Hawaiian culture?”.
Jrfm 14 00420 g005
Figure 6. U.S. participants’ willingness to pay—sustainable tourism. Note: responses to the question “As a tourist, would you be willing to pay more to support sustainable tourism in Hawai’i?”.
Jrfm 14 00420 g006
Figure 7. Amount U.S. participants are willing to pay—sustainable tourism. Note: responses to the question “If you responded ‘Yes’ to the previous question, how much would you be willing to increase your typical travel expenditure to support sustainable tourism in Hawai’i?”.
Jrfm 14 00420 g007
Figure 8. U.S. participants’ willingness to pay—support locally sourced food/farming industry. Note: responses to the question “As a tourist, would you be willing to pay more to support locally grown food (produce, meat, and fish) in order to support Hawai’i’s farming industry?”.
Jrfm 14 00420 g008
Figure 9. Amount U.S. participants are willing to pay—support locally sourced food/farming industry. Note: responses to the question “If you responded ‘Yes’ to the previous question, how much would you be willing to increase your restaurant bill/hotel food expenditure in order to support Hawai’i’s local farming industry?”.
Jrfm 14 00420 g009
Figure 10. Word cloud of responses to the open-ended question.
Jrfm 14 00420 g010
Table 1. Importance of each item/characteristic pertaining to participants’ perceptions of Hawai’i.
NMeanStd.SEFSig.
Nature, wildlifeMale1833.72131.13580.083960.0690.793
Female2723.751.144540.0694
Total4553.73851.139860.05344
BeachesMale1834.13111.076350.079570.3790.538
Female2724.19120.979610.0594
Total4554.1671.018880.04777
Hawaiian cultureMale1833.79231.0590.078285.5940.018
Female2724.02941.041150.06313
Total4553.93411.053650.0494
ShoppingMale1832.60661.300190.096110.970.325
Female2722.72061.147380.06957
Total4552.67471.211050.05678
Friendly local peopleMale1833.96721.037230.076671.40.237
Female2723.84931.046550.06346
Total4553.89671.043280.04891
Special events (weddings, anniversaries, exhibitions, conferences)Male1832.80331.246790.092173.0520.081
Female2722.59561.241230.07526
Total4552.67911.246270.05843
Outdoor activities (hiking, water sports, etc.)Male1833.90710.935920.069184.7590.03
Female2723.69491.068970.06482
Total4553.78021.021810.0479
Cultural activities (museums, markets, crafts, festivals, etc.)Male1833.65030.982310.072612.5810.109
Female2723.80150.985650.05976
Total4553.74070.986020.04623
High costMale1833.84151.158830.085662.2670.133
Female2723.67281.180840.0716
Total4553.74071.173680.05502
Isolated/rural destinationMale1833.31151.188880.0878811.4420.001
Female2722.94851.075180.06519
Total4553.09451.135080.05321
FoodMale1834.18580.882310.065223.5020.062
Female2724.01840.969860.05881
Total4554.08570.938240.04399
Table 2. Participants’ current knowledge of, and interest in, Hawaiian culture.
NMeanStd.SEFSig.
How would you rate your current knowledge about Hawaiian culture?Prior1642.96951.041610.0813440.6550.001
New2912.34710.975470.05718
Total4552.57141.042520.04887
How would you rate your current interest in learning about Hawaiian culture?Prior1643.56710.972830.075972.6850.102
New2913.41580.929750.0545
Total4553.47030.947230.04441
How would you rate your current interest in participating in tourism experiences designed and facilitated by Native Hawaiians?Prior1643.75610.98530.076941.0940.296
New2913.65291.023760.06001
Total4553.69011.01020.04736
Table 3. Participants’ perceptions of the importance of encounters with Hawaiian culture, by gender.
NMeanStd.SEFSig.
If/when visiting Hawai’i, how important is it for you to interact with local residents while on vacation?Male1833.68851.035750.076560.050.824
Female2723.66541.114410.06757
Total4553.67471.082360.05074
If/when visiting Hawai’i, how important is it for you to experience Hawaiian culture during your stay?Male1833.9181.031830.076287.5690.006
Female2724.17650.947960.05748
Total4554.07250.98960.04639
If/when visiting Hawai’i, how important is it for you to understand and respect Hawaiian culture?Male1834.1531.047540.077445.9560.015
Female2724.37870.909150.05513
Total4554.28790.97240.04559
Table 4. Participants’ perceptions of the importance of encounters with Hawaiian culture, by age.
NMeanStd.SEFSig.
If/when visiting Hawai’i, how important is it for you to interact with local residents while on vacation?18–291273.46461.118360.099244.1410.007
30–441243.64521.029590.09246
45–601403.72861.044640.08829
>60644.03131.112250.13903
Total4553.67471.082360.05074
If/when visiting Hawai’i, how important is it for you to experience Hawaiian culture during your stay?18–291273.92131.066120.09462.170.091
30–441244.04840.872850.07838
45–601404.13571.00510.08495
>60644.28130.983490.12294
Total4554.07250.98960.04639
If/when visiting Hawai’i, how important is it for you to understand and respect Hawaiian culture?18–291274.2520.991780.088010.7650.514
30–441244.24190.948860.08521
45–601404.28571.012770.08559
>60644.45310.889620.1112
Total4554.28790.97240.04559
Table 5. Participants’ view of the responsibilities of the tourism industry, by gender.
NMeanStd.SEFSig.
The tourism industry must ensure quality tourism experiences for visitors.Male1833.98910.983320.072694.4350.036
Female2723.80150.895420.05429
Total4553.87690.935250.04385
It is the responsibility of tourism businesses to meet visitor needs.Male1834.01640.841740.0622215.1070
Female2723.70220.8480.05142
Total4553.82860.858530.04025
It is the responsibility of tourism businesses to meet the needs of the local community.Male1834.03830.853990.063137.690.006
Female2723.79780.940830.05705
Total4553.89450.91360.04283
Tourism must be developed with consideration of the natural and cultural environment.Male1834.24590.864230.063890.0970.755
Female2724.27210.884190.05361
Total4554.26150.875360.04104
Tourism must contribute to the improvement of the local community.Male1834.05460.99850.073810.0810.775
Female2724.02940.871370.05283
Total4554.03960.923610.0433
Table 6. Participants’ view of the responsibilities of the tourism industry, by age.
NMeanStd.SEFSig.
The tourism industry must ensure quality tourism experiences for visitors.18–291273.55120.981650.0871110.7760.000
30–441243.89520.917920.08243
45–601403.95710.84710.07159
>60644.31250.852170.10652
Total4553.87690.935250.04385
It is the responsibility of tourism businesses to meet visitor needs.18–291273.6220.925210.08215.0010.002
30–441243.91130.80660.07243
45–601403.82140.824690.0697
>60644.09380.811010.10138
Total4553.82860.858530.04025
It is the responsibility of tourism businesses to meet the needs of the local community.18–291273.92130.913790.081091.9070.128
30–441243.93550.926060.08316
45–601403.75710.87220.07371
>60644.06250.957430.11968
Total4553.89450.91360.04283
Tourism must be developed with consideration of the natural and cultural environment.18–291273.89761.037660.092083.6940.012
30–441244.22580.844290.07582
45–601403.94290.87960.07434
>60644.17190.864740.10809
Total4554.03960.923610.0433
Tourism must contribute to the improvement of the local community.18–291274.20470.928720.082411.3360.262
30–441244.31450.922760.08287
45–601404.19290.838780.07089
>60644.42190.73040.0913
Total4554.26150.875360.04104
Table 7. Participants’ view of their responsibilities as leisure travelers, by gender.
NMeanStd.SEFSig.
I would describe myself as environmentally responsible.Male1833.79230.889840.065780.0850.771
Female2723.76840.838220.05082
Total4553.7780.858460.04025
I would describe myself as culturally sensitive.Male1833.87430.90210.066690.1310.717
Female2723.90440.845030.05124
Total4553.89230.867580.04067
I consider the potential impacts of my actions when making many of my vacation decisions.Male1833.69950.944820.069841.3950.238
Female2723.80150.874570.05303
Total4553.76040.903840.04237
When choosing a vacation destination, it is important to me that the tourism industry supports environmentally sustainable tourism practices.Male1833.6231.061270.0784510.0460.002
Female2723.91540.894950.05426
Total4553.79780.974790.0457
When choosing a vacation destination, it is important to me that the tourism industry supports culturally respectful tourism practices.Male1833.98360.928640.068654.1090.043
Female2724.15810.880710.0534
Total4554.08790.903350.04235
Table 8. Participants’ view of their responsibilities as leisure travelers, by age.
NMeanStd.SEFSig.
I would describe myself as environmentally responsible.18–291273.62990.97430.086453.6890.012
30–441243.76610.856430.07691
45–601403.79290.800150.06762
>60644.06250.663680.08296
Total4553.7780.858460.04025
I would describe myself as culturally sensitive.18–291273.83460.906450.080431.2440.293
30–441243.96770.805830.07237
45–601403.82140.899780.07605
>60644.01560.826010.10325
Total4553.89230.867580.04067
I consider the potential impacts of my actions when making many of my vacation decisions.18–291273.72440.914410.081140.3830.766
30–441243.82260.911070.08182
45–601403.72140.898180.07591
>60643.79690.894070.11176
Total4553.76040.903840.04237
When choosing a vacation destination, it is important to me that the tourism industry supports environmentally sustainable tourism practices.18–291273.77951.015070.090071.590.191
30–441243.88710.828450.0744
45–601403.67140.985090.08326
>60643.93751.110910.13886
Total4553.79780.974790.0457
When choosing a vacation destination, it is important to me that the tourism industry supports culturally respectful tourism practices.18–291274.03150.991530.087980.4190.74
30–441244.1210.888890.07982
45–601404.07140.862010.07285
>60644.17190.846180.10577
Total4554.08790.903350.04235
Table 9. Participants’ willingness to pay, by age.
NMeanStd.SEFSig.
As a tourist, would you be willing to pay more to support tourism experiences that are respectful of the Native Hawaiian culture?18–291271.32280.469410.041653.6780.012
30–441241.18550.390270.03505
45–601401.36430.482960.04082
>60641.29690.460490.05756
Total4551.29450.456320.02139
As a tourist, would you be willing to pay more to support sustainable tourism in Hawai’i?As a tourist, would you be willing to pay more to support sustainable tourism in Hawai’i?18–291271.24410.431250.038270.8760.454
30–441241.20160.402830.03618
45–601401.27860.449910.03802
>60641.20310.405510.05069
Total4551.23740.425930.01997
As a tourist, would you be willing to pay more to support locally grown food (produce, meat, and fish) in order to support Hawaii’s farming industry?18–291271.22050.416210.036932.5960.052
30–441241.14520.353690.03176
45–601401.28570.453380.03832
>60641.20310.405510.05069
Total4551.21760.413060.01936
Table 10. Participants’ willingness to pay, by ethnicity.
NMeanStd.SEFSig.
As a tourist, would you be willing to pay more to support tourism experiences that are respectful of the Native Hawaiian culture?Asian or Asian American651.26150.442890.054930.6960.676
Native Hawaiian or other Pacific Islander81.1250.353550.125
Black or African American341.26470.447810.0768
Hispanic or Latino551.16360.373350.05034
American Indian or Alaska Native2100
White or Caucasian2701.24440.430560.0262
Multiracial or Biracial111.18180.404520.12197
Other101.40.51640.1633
Total4551.23740.425930.01997
As a tourist, would you be willing to pay more to support sustainable tourism in Hawai’i?Asian or Asian American651.20.403110.051.1850.310
Native Hawaiian or other Pacific Islander81.1250.353550.125
Black or African American341.26470.447810.0768
Hispanic or Latino551.27270.449470.06061
American Indian or Alaska Native2100
White or Caucasian2701.32220.46820.02849
Multiracial or Biracial111.36360.504520.15212
Other101.50.527050.16667
Total4551.29450.456320.02139
As a tourist, would you be willing to pay more to support locally grown food (produce, meat, and fish) in order to support Hawaii’s farming industry?Asian or Asian American651.18460.3910.04852.4450.018
Native Hawaiian or other Pacific Islander81.1250.353550.125
Black or African American341.29410.46250.07932
Hispanic or Latino551.18180.389250.05249
American Indian or Alaska Native2100
White or Caucasian2701.21110.408850.02488
Multiracial or Biracial111.18180.404520.12197
Other101.70.483050.15275
Total4551.21760.413060.01936
Table 11. Descriptive analysis.
AgeGenderRegionEthnicityRelationship StatusNumber of Children
N455455445455455455
Mean3.30991.59785.23154.79122.02861.4462
Std. Error of Mean0.048170.023010.125120.089030.044370.02734
Median326621
Mode427621
Std. Deviation1.027490.490882.639431.898970.946390.58323
Skewness0.134−0.4−0.285−1.0451.91.382
Std. Error of Skewness0.1140.1140.1160.1140.1140.114
Kurtosis−1.16−1.848−1.176−0.3834.8533.258
Std. Error of Kurtosis0.2280.2280.2310.2280.2280.228
Publisher’s Note: MDPI stays neutral with regard to jurisdictional claims in published maps and institutional affiliations.

