
Price Transmission in Cotton Futures Market: Evidence from Three Countries


1
Accounting & Finance Area, Indian Institute of Management Sirmaur, Paonta Sahib 173025, India
2
Finance Area, Lal Bahadur Shastri Institute of Management, New Delhi 110075, India
*
Author to whom correspondence should be addressed.
J. Risk Financial Manag. 2021, 14(9), 444; https://0-doi-org.brum.beds.ac.uk/10.3390/jrfm14090444
Submission received: 1 July 2021
/
Revised: 29 August 2021
/
Accepted: 30 August 2021
/
Published: 14 September 2021
(This article belongs to the Special Issue Risk Management and Financial Derivatives)
Abstract
:This study examines the price transmission between cotton prices in U.S., Indian, and Chinese futures markets. We focus on studying the long-run price movements using cointegration and alternate causality tests. The empirical results indicate the following: (a) the U.S. cotton futures market continues to be the most dominant market, and it leads price changes in India and China; (b) the cotton prices in India also impacts the cotton prices in China as we report a unidirectional relationship flowing from India to China; (c) there is duality of direction of price transmission for U.S. and Chinese commodity markets as we document bi-directional causality between U.S. to Chinese cotton futures for the entire period and uni-directional causality from U.S. to Chinese markets for the two sub-periods; (d) the long-term relationship between the three markets has seen a significant shift as documented by the absence of cointegration which may be due to changes in government policy, especially in India and China specifically after 2014. Overall, results provide support for further reforms especially for Indian and Chinese commodity exchanges so that they can play a vital role in the price discovery process especially for commodities that are largely produced or consumed in these economies.
1. Introduction
After disruption in cotton supplies from the U.S. during the American Civil War (1861–1865), India emerged as a major supplier of raw cotton in the world market. Catering to domestic and international demand for cotton, it emerged as a major producer of cotton, producing almost one-fourth of the total cotton produced in the world (see Table 1).
With the growth in the cotton trade in India, futures trading in cotton also gained momentum. In 1922 futures trading was formally introduced when the Government of Bombay enacted the Cotton Contracts Act and granted recognition to the East India Cotton Association. However, due to allegations of futures trading leading to price rise and manipulations, the futures trading in agriculture commodities including cotton was banned on several occasions and remained suspended for a long period of time (Ahuja 2006; Ali and Gupta 2011).
Despite India having a dominant share in the world’s cotton production, the Indian commodity derivatives markets have performed a minor role in price discovery and transmission. Experts attribute the lack of transparent and organised agriculture markets as a major hindrance for cotton prices being discovered in India. In this regard, Indian policymakers initiated several reforms to integrate the fragmented spot agricultural markets and to improve price transmission and price discovery process. One major decision was taken in 2002 when the ban on agriculture commodity futures was lifted and national level multi-commodity exchanges including Multi Commodity Exchange of India (thereafter MCX, India) were set up (Ahuja 2006). Further, between 2013 and 2019 the government increased the floor price of long-staple cotton by 40% thereby incentivising farmers to produce more cotton. The higher floor price has increased the area under cotton cultivation to the highest in the last decade.
While Indian policymakers had initiated the abovementioned reform process, a similar reform process was initiated in China. National level commodity exchanges including Zhengzhou Commodity Exchange (thereafter ZCE, China) on the pattern of Chicago Board of Trade (thereafter CBOT) and The Intercontinental Exchange (thereafter ICE) were setup in China (Ge et al. 2010). Further, in 2012 to encourage domestic cotton production, the Chinese government introduced out-of-quota imports with 40% of tariffs on imported raw cotton. The shift in China’s cotton policy had a negative impact on farmer’s cultivating cotton in U.S. (Hopkinson 2018). Furthermore, the U.S–China trade war has added more uncertainty to the price transmission process especially when China imposed retaliatory tariffs on U.S cotton.
Experts recognize the recent developments in cotton markets of the U.S., China, and India to have a significant impact on the world cotton trade and the price transmission process. Further, over the last decade, the commodity exchanges in China and India have witnessed a spurt in trading volumes and attracted participation from hedgers, speculators, and other value chain participants. Past researchers consider U.S. markets to be the dominant market, leading other developing markets. However, few studies have also documented evidence of price discovery and price transmission from Chinese commodity exchanges (Zhao 2002; Demir et al. 2018). Moreover, Ruggiero (2008) and Henriques (2008) have attributed the abnormal spikes and volatility in commodity prices due to the excessive speculation in derivative markets of developing markets (Fung et al. 2013).
Given this background, this study attempts to examine price transmission across cotton derivative markets in the U.S., China, and India, the three major cotton players of the world jointly contributing 64.45% of total cotton produced in the world (Foreign Agricultural Service/USDA August 2021, Global Market Analysis). We try to examine the price transmission process and ascertain whether the U.S. cotton futures markets still play a key role in terms of information flow or if the U.S. markets are influenced by the changes in developing markets. The rest of the paper is organized as follows: Section 2 reviews the literature, Section 3 describes the data and discusses econometric methodology, Section 4 presents empirical results, and Section 5 concludes.
2. Literature Review
The information flows and price transmission in the agriculture commodities has been a widely researched area, with most studies using cointegration, granger causality, and error correction models (ECM). Among these, the most prominent ones have been (Spriggs et al. 1982; Gilmour and Fawcett 1987; Goodwin and Schroeder 1991; Mohanty et al. 1995; Bessler et al. 2003; Gardebroek et al. 2016; Arnade and Vocke 2016; Adammer et al. 2016).
While the earliest studies conducted in the 1980s, i.e., Spriggs et al. (1982) and Gilmour and Fawcett (1987) fail to document any significant information flows from the U.S. to Canadian wheat markets. Similarly, Mohanty et al. (1995) also provide evidence of U.S. markets strongly influencing the prices of wheat for other major exporters including Canada. Likewise, Bessler et al. (2003) study the relationship for five major wheat-producing regions from 1981–1999 and conclude that U.S. and Canada play a price leader role. Gardebroek et al. (2016) also find strong information flows and volatility transmission across the United States, Europe, and Asia for corn, wheat, and soybeans. Similarly, Adammer et al. (2016) examined price transmission across North American and European agricultural futures prices for canola, wheat, and corn and provide evidence of U.S. markets playing a price leadership role. Further, Arnade and Vocke (2016) study the changes in price discovery U.S./Australia wheat prices and document the dynamic nature of the price discovery process. Similarly, many researchers have explored causal price relationships across U.S. and other emerging markets. Booth and Ciner (1997) examine the information flows between Japan TGE and the U.S. CBOT commodity exchanges and conclude that the CBOT corn futures play a significant role in price discovery. Fung et al. (2003) tested the linkages between the U.S. and Chinese markets for copper, soybeans, and wheat by employing a bivariate GARCH model and find evidence of the dominance of U.S. market for lesser regulated commodities (copper and soybeans). More recently, Jia et al. (2016) study price and volatility transmission between the Chinese and American agriculture commodity markets and noted that China leads the U.S. markets in case of prices of soybean, corn, and wheat contracts after 2014. (Jiang et al. 2017) also confirm spillover effects between the U.S. and Chinese agricultural commodities for soybean, wheat, corn, and sugar. Arnade et al. (2017) examine price transmission across Chinese and international markets for several commodities including cotton and document evidence of integration of Chinese soybeans, soymeal, and chicken prices with world prices. Chen and Weng (2017) study the price and volatility transmission for corn, wheat, and soybeans futures in US and China and report the major role of U.S. markets in the price discovery process. They also document increasing information flows from China to the U.S. in less regulated commodities especially after trading structure changes in the Chinese markets. Li and Hayes (2017) investigate the lead–lag relationships among soybean prices in U.S., Brazil, and China and provide evidence of the U.S market acting as price leader for the other two markets. He and Wang (2019) examine cotton price transmission between Chinese cotton spot, futures and international markets and report stronger linkages between Chinese cotton future prices and cotton prices in the international markets. Li and Xiong (2021) examine the price transmission process of twelve agricultural contracts traded on Chinese commodity futures markets and find evidence of the price discovery process for the majority of commodities including cotton.
Likewise, Bohl et al. (2018) study the price discovery process of coffee across U.S. and Brazil and find two-way information transmission in terms of spillover effects between the two markets. Ertugrul et al. (2018) examined price linkages across cotton markets in Turkey and world cotton markets and found strong one-way causality from global markets to Turkey’s domestic cotton markets. Similarly, Sayed and Auret (2019) examine volatility transmissions in maize prices across U.S., Brazil, Argentina, and South Africa and provide evidence of significant spillovers in volatility across the four commodity derivative markets.
Janzen et al. (2018) examine linkages between cotton price volatility and speculation in other financial assets and report limited evidence of financial speculation leading to volatility in cotton prices. Adhikari and Putnam (2020); Dahl et al. (2020) examine co-movement across the energy and agriculture commodities and document spillovers from oil to cotton prices. In the Indian context, Shrinivas and Gómez (2016) study price transmission across international prices (U.S.) and Indian domestic prices and find evidence of integration between Indian and international cotton markets.
It can thus be observed that a lot of research has documented price transmission and volatility transfers from the U.S. to different economies including Canada, Australia, China, Brazil, etc. for several agricultural commodities. However, to date the literature examining the information flows among the agriculture futures market across India, China, and U.S. is scanty. This paper attempts to fill this gap by examining the price transmission and interrelationship across three major cotton markets. The study adds to the existing literature in the following aspects. First, the price transmission is studied using commodity futures prices instead of cash/export prices as earlier studies have considered futures prices more appropriate to study international commodity price dynamics (Protopapadakis and Stoll 1983; Yang et al. 2001; Yang and Leatham 1999). Thus, this paper offers additional insights on international cotton price relationships using futures prices. Second, to the best of our knowledge, this is the first comprehensive study exploring the relationship between the Indian cotton futures and international cotton futures markets of the U.S. and China. As previous studies (e.g., Ge et al. 2010; Beckmann and Czudaj 2014; Arnade et al. 2017; Demir et al. 2018) on international linkages of cotton prices mainly focus on the dynamics between Chinese and U.S. futures markets, this study will offer new insights into international cotton futures market relationships by considering the three major players of cotton i.e., India, China, and U.S.
3. Data and Methodology
3.1. Data Description
The analysis was carried on log of daily closing future prices. The cotton future price data for MCX, India; ICE, U.S.; and ZCE, China were taken from the Bloomberg database. A brief snapshot of the three contracts traded on these exchanges has been presented in Table 2. The contracts chosen for our study are the most actively traded futures contracts in the respective countries and attract the attention of traders, importers, exporters, and policymakers worldwide. The future prices of these contracts are therefore considered to be a suitable proxy of the price prevailing in the three markets. To get a continuous price series, we followed earlier literature (see Beckmann and Czudaj 2014; Demir et al. 2018) by considering the prices of the active near-month futures contract which attracted the highest liquidity until the delivery period. Further, to get matching price series for the three markets only those days where markets were open for all the three exchanges were selected.
The prices of the contracts traded at ZCE and MCX were converted to U.S. dollars using daily exchange rate prices of the Indian rupee and Chinese yuan from the Bloomberg database. Furthermore, since the price quotes of the three contracts traded on different exchanges are not for the same quantity, the daily closing price per 1000 kg of cotton was considered for the analysis. Further, we divide the entire period into two sub-periods i.e., October 2011 to October 2016 (1st Sub-Period) and October 2016 to March 2020 (2nd Sub-Period). The structural break in our data period was identified and tested for its potential influence on the relationship. Splitting the entire period into two sub-periods helps us to have a clear understanding of the changes in market structures due to policy changes pertaining to cotton policy in India and China during the same period.
The starting period for our study has been considered from 2011 onwards, keeping in account the Chinese and Indian commodity futures markets contracts have been traded more actively since then. Furthermore, the second sub-period from 2016 has been considered to specifically capture the changes in the government of China’s cotton procurement policy which earlier insulated their cotton producers from global cotton price movements (Demir et al. 2018).
3.2. Methodology
We first examine the stationarity of our variables using the Augmented Dickey–Fuller (ADF) and Phillips–Perron (PP) test. Further, Canova–Hansen Seasonal Unit Root Test was applied on the log return series (after converting observations from daily frequency to monthly) for checking seasonality. The null hypothesis of no seasonal root could not be rejected (see Appendix A), thereby confirming that data is free from seasonality. After testing stationarity and seasonality and upon confirmation that the three series are nonstationary at levels and become stationary after first differencing, we proceed with the cointegration tests to examine the long-term relationship among the variables. We employ the Engle and Granger (1987) method to check the long-run equilibrium among the variables. The same has been graphically represented by Figure 1 and Figure 2.
We first estimate the residuals from the regression for three pairs as
In Equations (1)–(3) , and refer to natural logarithms of future price series of China, the U.S., and India, respectively. If the residuals from Equations (1)–(3) () are found to be stationary, then the two series are cointegrated. The error terms were checked for stationarity using ADF and PP tests. The existence of cointegration among the variables confirms the existence of a long-term equilibrium between our tested variables and, a vector error correction model is recommended (Demir et al. 2018). Therefore, we consider an error-correction model (ECM) to test the long-run relationship as
where , , , , and are white-noise disturbance terms, and , , and are the cointegration errors of the calculated residuals from Equations (1)–(3).
We use the Wald test to test the direction of causality for the full sample and the two sub-periods. To test the robustness of our results and avoid the possibility of errors in the hypothesis testing procedure, we also employ Toda and Yamamoto (1995) (hereafter, the TY) test to check the robustness of our results. The procedure allows for testing the long-run Granger causality without the precondition of testing cointegration and can be applied to series with different integration orders (Toda and Yamamoto 1995; Dolado and Lütkepohl 1996).
4. Results
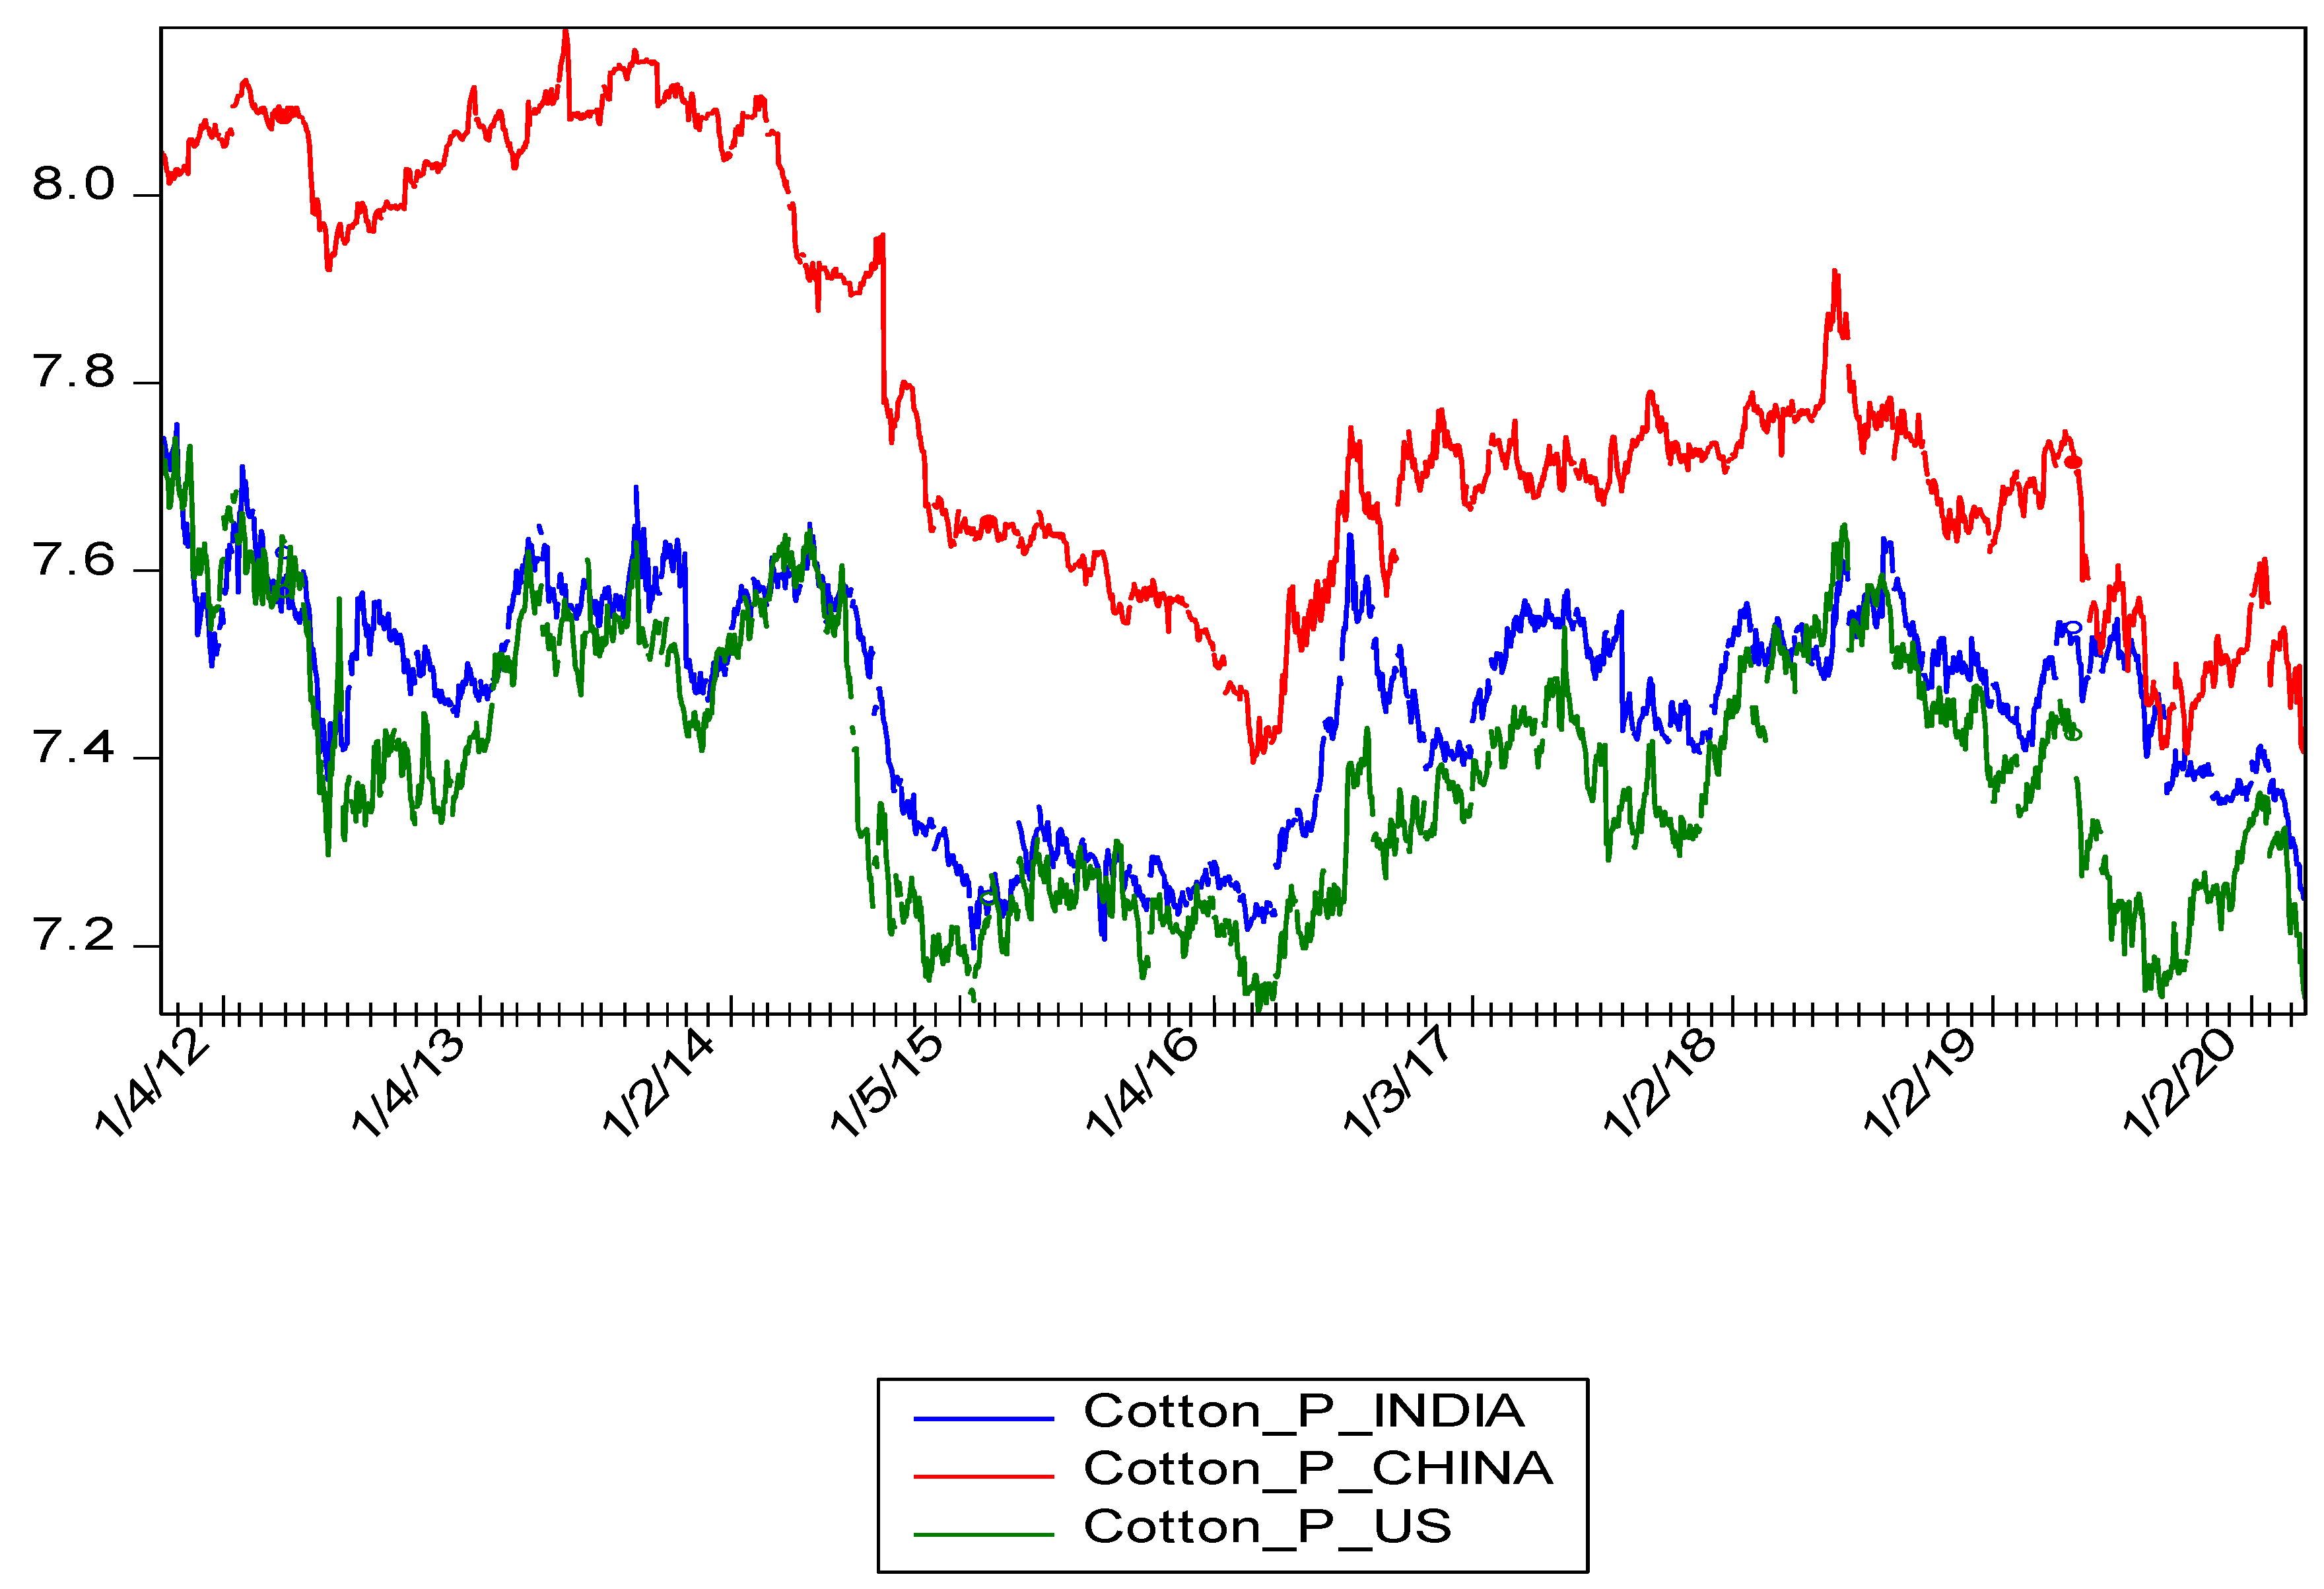
Table 3 provides the descriptive statistics. Descriptive statistics have been calculated for log-transformed futures price series of cotton traded on the U.S., Chinese, and Indian exchange for the entire period and two sub-periods. For the entire period, U.S. and Chinese price series display positive skewness, and on the contrary, Indian prices exhibit negative skewness. Kurtosis value is also higher for the Indian price series. Further, the Jarque–Bera test p-values indicate that the price series are not normally distributed. For the two sub-periods, we observe significant differences in terms of skewness and kurtosis. All prices are in U.S. Dollar per 1000 kg. The U.S., China, and India represent natural logarithm of ICE, ZCE, and MCX futures continuous nearby futures contracts of Cotton respectively. A cursory look at the time series plot of the prices in the three markets shows that they move in the same direction and are highly interrelated. We can also observe that prices of cotton in China were relatively higher as compared to Indian and U.S. prices until the end of 2014. Further, it is also visible that there was a decline in prices after 2015 in the Chinese markets. Furthermore, the price differential between Chinese, U.S., and Indian Cotton reduced after 2016 (Figure 1).
In the next step, we test the stationarity of the three cotton price series. Table 4 presents the results of the unit-root tests. The optimum lag length was identified using AIC criteria. Both the test indicate that three series are I (1) i.e., nonstationary at the level form and stationary at first-difference. Similar results were obtained for the two sub-periods and for different specifications (considering data levels with a trend); however, to conserve space, results for only the full sample period were presented.
The results of pairwise cointegration tests have been reported in Table 5. The trace and the maximum eigenvalue statistics provide evidence of at least one cointegrating vector across the three markets for the full sample period. The presence of a cointegration indicates that the price series follows similar characteristics in the long run. For the results of our sub-samples, we get conflicting results for the two periods. For the first sub-sample, both the test statistics indicate the presence of one cointegrating vector across the three pairs. However, cointegration cannot be detected for the second sub-sample. The absence of a cointegration relationship indicates changes in equilibrium dynamics after 2016.
To check the lead–lag relationship across the cointegrated series ECM model has been recommended in the previous literature (Chen and Weng 2017; Li and Hayes 2017; Demir et al. 2018). Thus, we ran a pairwise ECM for cotton prices for the complete sample. All the three pairs i.e., ZCE Cotton futures–U.S. Cotton futures, MCX Cotton futures–ICE Cotton Futures, and MCX Cotton Futures–ZCE Cotton Futures were tested. The joint significance of the lags of the independent variable was tested using the Wald test reported in Table 6.
The results of the entire period indicate bi-directional causality running from the U.S. to Chinese and vice versa and unidirectional leading effect from the U.S. to India and from India to China. The results of the TY test also indicate similar relationship as indicated by the VEC Granger causality test in the previous section (Table 7).
In the next stage, we test the direction of causality for the two subperiods using the TY procedure. For the first sub-period (Table 8) our results provide evidence of strong unidirectional causality flowing from the U.S. to the Chinese and Indian market and strong unidirectional causality from Indian markets to Chinese markets. The same results are preserved for the second sub-period (Table 9). The bi-directional causality detected for the full sample period between the Chinese markets and U.S. markets fades away; however, the unidirectional causality from U.S. markets to Indian and Chinese markets and the unidirectional causality from Indian markets to Chinese markets is preserved for the entire sample and the two sub-periods.
In particular, futures prices on the U.S. exchange (ICE Futures) lead the futures prices in India and China. The dominant role of the ICE cotton futures contract remains significant for the entire period and two sub-period. Further, the results also provide evidence that the lead–lag relationships have remained unchanged with the regulatory changes post 2016.
5. Findings and Conclusions
The data for cotton traded in three major futures markets for the period October 2011–March 2020 has been analysed to focus on the relationships between cotton futures prices in the U.S., China, and India. The paper used nearby futures prices of cotton contracts traded at ICE, ZCE, and MCX to study the price transmission across these three markets. The preliminary results indicate the existence of a long-term relationship among the three cotton markets when the entire period was studied. However, when the data for the two subperiods were examined, we document a significant shift in the market structure as indicated by the absence of cointegration in the second sub-period.
The absence of cointegration in the second sub-period can be linked to several reasons. Firstly, the Chinese government in 2014 initiated the pilot target-price-based subsidy program (TSP) in the Xinjiang region with the objective of motivating cotton farmers and reducing cotton imports (Shang et al. 2020). After the success of pilot TSP, a nationwide TSP was implemented (Qin 2016; Yao 2017), which led to a decline in demand for U.S. cotton in China. Secondly, Chinese demand for U.S. cotton declined after 2016 amidst rising trade tensions between two countries and Chinese importers substituted U.S. cotton with cotton from other countries like India, Brazil, and Vietnam. Third, in the same period U.S. cotton also lost global market share to countries like India and Brazil especially in Bangladesh, Vietnam, and Turkey (Robledo 2020). Fourth, the reduction in cotton yields in major cotton-producing areas in U.S. due to natural calamities including floods, droughts, and delayed harvest in 2019. Therefore, all these factors might have contributed to change in long-run relationship in the second sub-period.
In the case of our results related to the direction of flows from one market to another, the lead–lag effect has been stable for the three markets. More specifically, the U.S. cotton prices having a lead effect on the Indian and Chinese markets in both periods. We also report a unidirectional relationship flowing from India to China in both periods. The lead effect of U.S. cotton prices may be linked to the early harvest period in the U.S. as the cotton harvest period begins from the month of August in the U.S., whereas in China and India the harvest season starts from September and October, respectively. Therefore, other producers of cotton and traders follow the U.S. market as a source of market information (Ge et al. 2010). Further, the U.S. still being the largest exporter of Cotton influences the price of cotton in world markets.
From the results, two important conclusions can be derived. Firstly, the U.S. futures markets continue to play a leading role in cotton price discovery, especially for India and China. These results are in line with the findings of (Fung et al. 2003; Jiang et al. 2017; Arnade et al. 2017; Li and Hayes 2017; He and Wang 2019; Ertugrul et al. 2018; Sayed and Auret 2019), which have documented evidence of U.S. as a price leader for several commodities. Secondly, early signs of change in market dynamics especially after 2016. The documented change in market dynamics partially contradict the previous literature (Jia et al. 2016; Chen and Weng 2017) which have provided evidence of stronger information flows from Chinese agriculture futures markets to U.S. futures markets for several commodities including soymeal, soybean, etc. especially after policy changes in China. However, at the same time, we document early signs of weakening of U.S. markets as a price leader in the world cotton trade.
For farmers, traders, and hedgers, the results can be helpful as price signals from the U.S. markets can be used in taking timely decisions related to pricing, storage, etc. From the policy perspective, it is evident that changes in government policy especially in India and China related to agriculture commodity derivatives trading have helped in improving participation on these exchanges. However, results also provide support for further reform process especially in terms of establishing these exchanges at par with global exchanges by allowing global participation, reducing the cost of trading, improving delivery infrastructure, etc. so that these exchanges also start playing a vital role in the price discovery process especially for agricultural commodities widely cultivated and consumed in India and China. For future researchers, the results also point out towards the sensitive nature of causality tests which could give misleading results especially in the case of structural breaks which should be considered while examining the relationship. Further, future studies are warranted to see price linkages among other markets like Brazil, Vietnam, Bangladesh, Turkey, etc., especially during the recent times amidst the U.S.–China trade wars. Furthermore, price transmission across the different markets may be influenced by differences in market microstructures which can also be explored in future research.
Author Contributions
Conceptualization, A.S. and T.K.S.; methodology, A.S.; software, T.K.S.; validation, A.S. and T.K.S.; formal analysis, A.S. and T.K.S.; investigation, T.K.S.; resources, A.S.; data curation, T.K.S.; writing—original draft preparation, A.S.; writing—review and editing, A.S. and T.K.S.; visualization, A.S. All authors have read and agreed to the published version of the manuscript.
Funding
No funding was there for this research.
Informed Consent Statement
Not applicable.
Data Availability Statement
Data available on request.
Conflicts of Interest
The authors declare no conflict of interest.
Appendix A

Table A1.
Canova–Hansen Seasonal Unit Root Test.
| Country | Joint LM Stat | K | 1% | 5% | 10% | Hypothesis |
|---|---|---|---|---|---|---|
| China | 0.78 | 11 | 3.09 | 2.59 | 2.35 | Accepted |
| India | 1.35 | 11 | 3.09 | 2.59 | 2.35 | Accepted |
| US | 1.16 | 11 | 3.09 | 2.59 | 2.35 | Accepted |
Note: Null Hypothesis: No unit root at monthly frequency.
References
- Adammer, Philipp, Martin T. Bohl, and Christian Gross. 2016. Price discovery in thinly traded futures markets: How thin is too thin? Journal of Futures Markets 36: 851–69. [Google Scholar] [CrossRef] [Green Version]
- Adhikari, Ramesh, and Kyle J. Putnam. 2020. Comovement in the commodity futures markets: An analysis of the energy, grains, and livestock sectors. Journal of Commodity Markets 18: 100090. [Google Scholar] [CrossRef]
- Ahuja, Narender L. 2006. Commodity derivatives market in India: Development, regulation and futures prospects. International Research Journal of Finance and Economics 2: 153–62. [Google Scholar]
- Ali, Jabir, and Kriti Bardhan Gupta. 2011. Efficiency in agricultural commodity futures markets in India: Evidence from cointegration and causality tests. Agricultural Finance Review 71: 162–78. [Google Scholar] [CrossRef]
- Arnade, Carlos, and Gary Vocke. 2016. Seasonal Variation in the Price Discovery Process of International Wheat. Agribusiness 32: 16–32. [Google Scholar] [CrossRef]
- Arnade, Carlos, Bryce Cooke, and Fred Gale. 2017. Agricultural price transmission: China relationships with world commodity markets. Journal of Commodity Markets 7: 28–40. [Google Scholar] [CrossRef]
- Beckmann, Joscha, and Robert Czudaj. 2014. Volatility transmission in agricultural futures markets. Economic Modelling 36: 541–46. [Google Scholar] [CrossRef]
- Bessler, David A., Jian Yang, and Metha Wongcharupan. 2003. Price dynamics in the international wheat market: Modeling with error correction and directed acyclic graphs. Journal of Regional Science 43: 1–33. [Google Scholar] [CrossRef]
- Bohl, Martin T., Christian Gross, and Waldemar Souza. 2018. The role of emerging economies in the global price formation process of commodities: Evidence from Brazilian and US coffee markets. International Review of Economics & Finance 60: 203–15. [Google Scholar] [CrossRef] [Green Version]
- Booth, G. Geoffrey, and Cetin Ciner. 1997. International transmission on information in corn futures markets. Journal of Multinational Financial Management 7: 175–87. [Google Scholar] [CrossRef]
- Chen, Qian, and Xin Weng. 2017. Information Flows Between the US and China’s Agricultural Commodity Futures Markets—Based on VAR–BEKK–Skew-t Model. Emerging Markets Finance and Trade 54: 71–87. [Google Scholar] [CrossRef]
- Dahl, Roy Endré, Atle Oglend, and Muhammad Yahya. 2020. Dynamics of volatility spillover in commodity markets: Linking crude oil to agriculture. Journal of Commodity Markets 20: 100111. [Google Scholar] [CrossRef]
- Demir, Mert, Terrence F. Martell, and Jun Wang. 2018. The trilogy of China cotton markets: The lead–lag relationship among spot, forward, and futures markets. Journal of Futures Markets 39: 522–34. [Google Scholar] [CrossRef]
- Dolado, Juan J., and Helmut Lütkepohl. 1996. Making Wald tests work for cointegrated VAR systems. Econometric Reviews 15: 369–86. [Google Scholar] [CrossRef]
- Engle, Robert, and Hermione Jean Granger. 1987. Co-Integration and Error Correction: Representation, Estimation, and Testing. Econometrica 55: 251–76. [Google Scholar] [CrossRef]
- Ertugrul, Hasan Murat, Burak Darici, Halis Kiral, and Fatih Ayhan. 2018. Transmission of world cotton price to domestic cotton price in Turkey. In Politico-Economic Evaluation of Current Issues. Cambridge: Cambridge International Academics, pp. 165–73. [Google Scholar]
- Fung, Hung-Gay, Wai K. Leung, and Xiaoqing Eleanor Xu. 2003. Information flows between the US and China commodity futures trading. Review of Quantitative Finance and Accounting 21: 267–85. [Google Scholar] [CrossRef]
- Fung, Hung-Gay, Yiuman Tse, Jot Yau, and Lin Zhao. 2013. A leader of the world commodity futures markets in the making? The case of China’s commodity futures. International Review of Financial Analysis 27: 103–14. [Google Scholar] [CrossRef]
- Gardebroek, Cornelis, Manuel A. Hernandez, and Miguel Robles. 2016. Market interdependence and volatility transmission among major crops. Agricultural Economics 47: 141–55. [Google Scholar] [CrossRef] [Green Version]
- Ge, Yuanlong, Holly H. Wang, and Sung K. Ahn. 2010. Cotton market integration and the impact of China’s new exchange rate regime. Agricultural Economics 41: 443–51. [Google Scholar] [CrossRef]
- Gilmour, Brad, and Peter Fawcett. 1987. The Relationship between U.S. and Canadian Wheat Prices. Canadian Journal of Agricultural Economics 35: 571–89. [Google Scholar] [CrossRef]
- Goodwin, Barry K., and Ted C. Schroeder. 1991. Cointegration tests and spatial price linkages in regional cattle markets. American Journal of Agricultural Economics 73: 452–64. [Google Scholar] [CrossRef]
- He, ShaoHua, and Li Wang. 2019. Nonlinear spatial cotton price transmission between international and domestic markets. Research of Agricultural Modernization 40: 488–97. [Google Scholar]
- Henriques, Diana B. 2008. Regulators Say Company Manipulated Oil Market. The New York Times, July 25. [Google Scholar]
- Hopkinson, Jenny. 2018. Profiles and Effects of Retaliatory Tariffs on US Agricultural Exports. Report R45448. Washington, DC: Congressional Research Service, US. [Google Scholar]
- Janzen, Joseph P., Aaron Smith, and Colin A. Carter. 2018. Commodity Price Comovement and Financial Speculation: The Case of Cotton. American Journal of Agricultural Economics 100: 264–85. [Google Scholar] [CrossRef]
- Jia, Rui-Lin, Dong-Hua Wang, Jing-Qing Tu, and Sai-Ping Li. 2016. Correlation between agricultural markets in dynamic perspective—Evidence from China and the US futures markets. Physica A: Statistical Mechanics and its Applications 464: 83–92. [Google Scholar] [CrossRef] [Green Version]
- Jiang, Huayun, Neda Todorova, Eduardo Roca, and Jen-Je Su. 2017. Dynamics of volatility transmission between the US and the Chinese agricultural futures markets. Applied Economics 49: 3435–52. [Google Scholar] [CrossRef]
- Johansen, Søren. 1988. Statistical Analysis of Cointegration Vectors. Journal of Economics Dynamics and Control 12: 231–54. [Google Scholar] [CrossRef]
- Johansen, Søren. 1991. Estimation and hypothesis testing of cointegration vectors in Gaussian vector autoregressive models. Econometrica: Journal of the Econometric Society 59: 1551–80. [Google Scholar] [CrossRef]
- Li, Chao, and Dermot J. Hayes. 2017. Price Discovery on the International Soybean Futures Markets: A Threshold Co-Integration Approach. Journal of Futures Markets 37: 52–70. [Google Scholar] [CrossRef]
- Li, Miao, and Tao Xiong. 2021. Dynamic Price Discovery in Chinese Agricultural Futures Markets. Journal of Asian Economics, 101370. [Google Scholar] [CrossRef]
- MacKinnon, James G. 1996. Numerical distribution functions for unit root and cointegration tests. Journal of Applied Econometrics 11: 601–18. [Google Scholar] [CrossRef] [Green Version]
- Mohanty, Samarendu, E. Wesley F. Peterson, and Nancy Cottrell Kruse. 1995. Price asymmetry in the international wheat market. Canadian Journal of Agricultural Economics/Revue Canadiennedagroeconomie 43: 355–66. [Google Scholar] [CrossRef]
- Protopapadakis, Aris, and Hans R. Stoll. 1983. Spot and futures prices and the law of one price. The Journal of Finance 38: 1431–55. [Google Scholar] [CrossRef]
- Qin, Zhongchun. 2016. Thoughts and Suggestions on Deepening the Reform of Target-Price of Cotton. China Economic Times. October 13. Available online: https://www.chinathinktanks.org.cn/content/detail/id/qm9p1f22 (accessed on 14 August 2021).
- Robledo, Vega. 2020. International Cotton Trade and Causes of Price Volatility in the United States,” Beyond the Numbers: Prices and Spending; Washington, DC: U.S. Bureau of Labor Statistics, vol. 9, pp. 1–7. Available online: https://www.bls.gov/opub/btn/volume-9/international-cottontrade-and-causes-of-price-volatility-in-the-united-states.html (accessed on 14 August 2021).
- Ruggiero, Michael A. 2008. High risk, high volatility—High reward. Futures, December 1. [Google Scholar]
- Sayed, Ayesha, and Christo Auret. 2019. Volatility transmission in the South African white maize futures market. Eurasian Economic Review 10: 71–88. [Google Scholar] [CrossRef] [Green Version]
- Shang, Linmei, Yaghoob Jafaria, and Thomas Heckeleia. 2020. Market and Welfare Impact Assessment of the Target Price-Based Subsidy Program in the Chinese Cotton Market. Asian Journal of Agriculture and Development 17: 53–70. [Google Scholar] [CrossRef]
- Shrinivas, Aditya, and Miguel I. Gómez. 2016. Price transmission, asymmetric adjustment and threshold effects in the cotton supply chain: A case study for Vidarbha, India. Agricultural Economics 47: 435–44. [Google Scholar] [CrossRef]
- Spriggs, John, Michael Kaylen, and David Bessler. 1982. The lead-lag relationship between Canadian and US wheat prices. American Journal of Agricultural Economics 64: 569–72. [Google Scholar] [CrossRef]
- Toda, Hiro Y., and Taku Yamamoto. 1995. Statistical inference in vector autoregressions with possibly integrated processes. Journal of Econometrics 66: 225–50. [Google Scholar] [CrossRef]
- Yang, Jian, and David J. Leatham. 1999. Price discovery in wheat futures markets. Journal of Agricultural and Applied Economics 31: 359–70. [Google Scholar] [CrossRef] [Green Version]
- Yang, Jian, Michael S. Haigh, and David J. Leatham. 2001. Agricultural liberalization policy and commodity price volatility: A GARCH application. Applied Economics Letters 8: 593–98. [Google Scholar] [CrossRef]
- Yao, Sheng. 2017. Impact of Mainland’s Cotton Target Price Subsidy Policy on Farmers’ Production Decision. Journal of Shanxi Agricultural University (Social Science Edition) 16: 36–42. [Google Scholar]
- Zhao, Jinwen. 2002. Cointegration Analysis of Commodity Futures Prices in Dalian, China and Chicago. Journal of Emerging Markets 7: 17–27. [Google Scholar] [CrossRef]
Figure 1.
Natural Logarithms of Cotton futures price series in MCX Futures India, ICE Futures U.S., and Zhengzhou Commodity Exchange China.
Figure 1.
Natural Logarithms of Cotton futures price series in MCX Futures India, ICE Futures U.S., and Zhengzhou Commodity Exchange China.

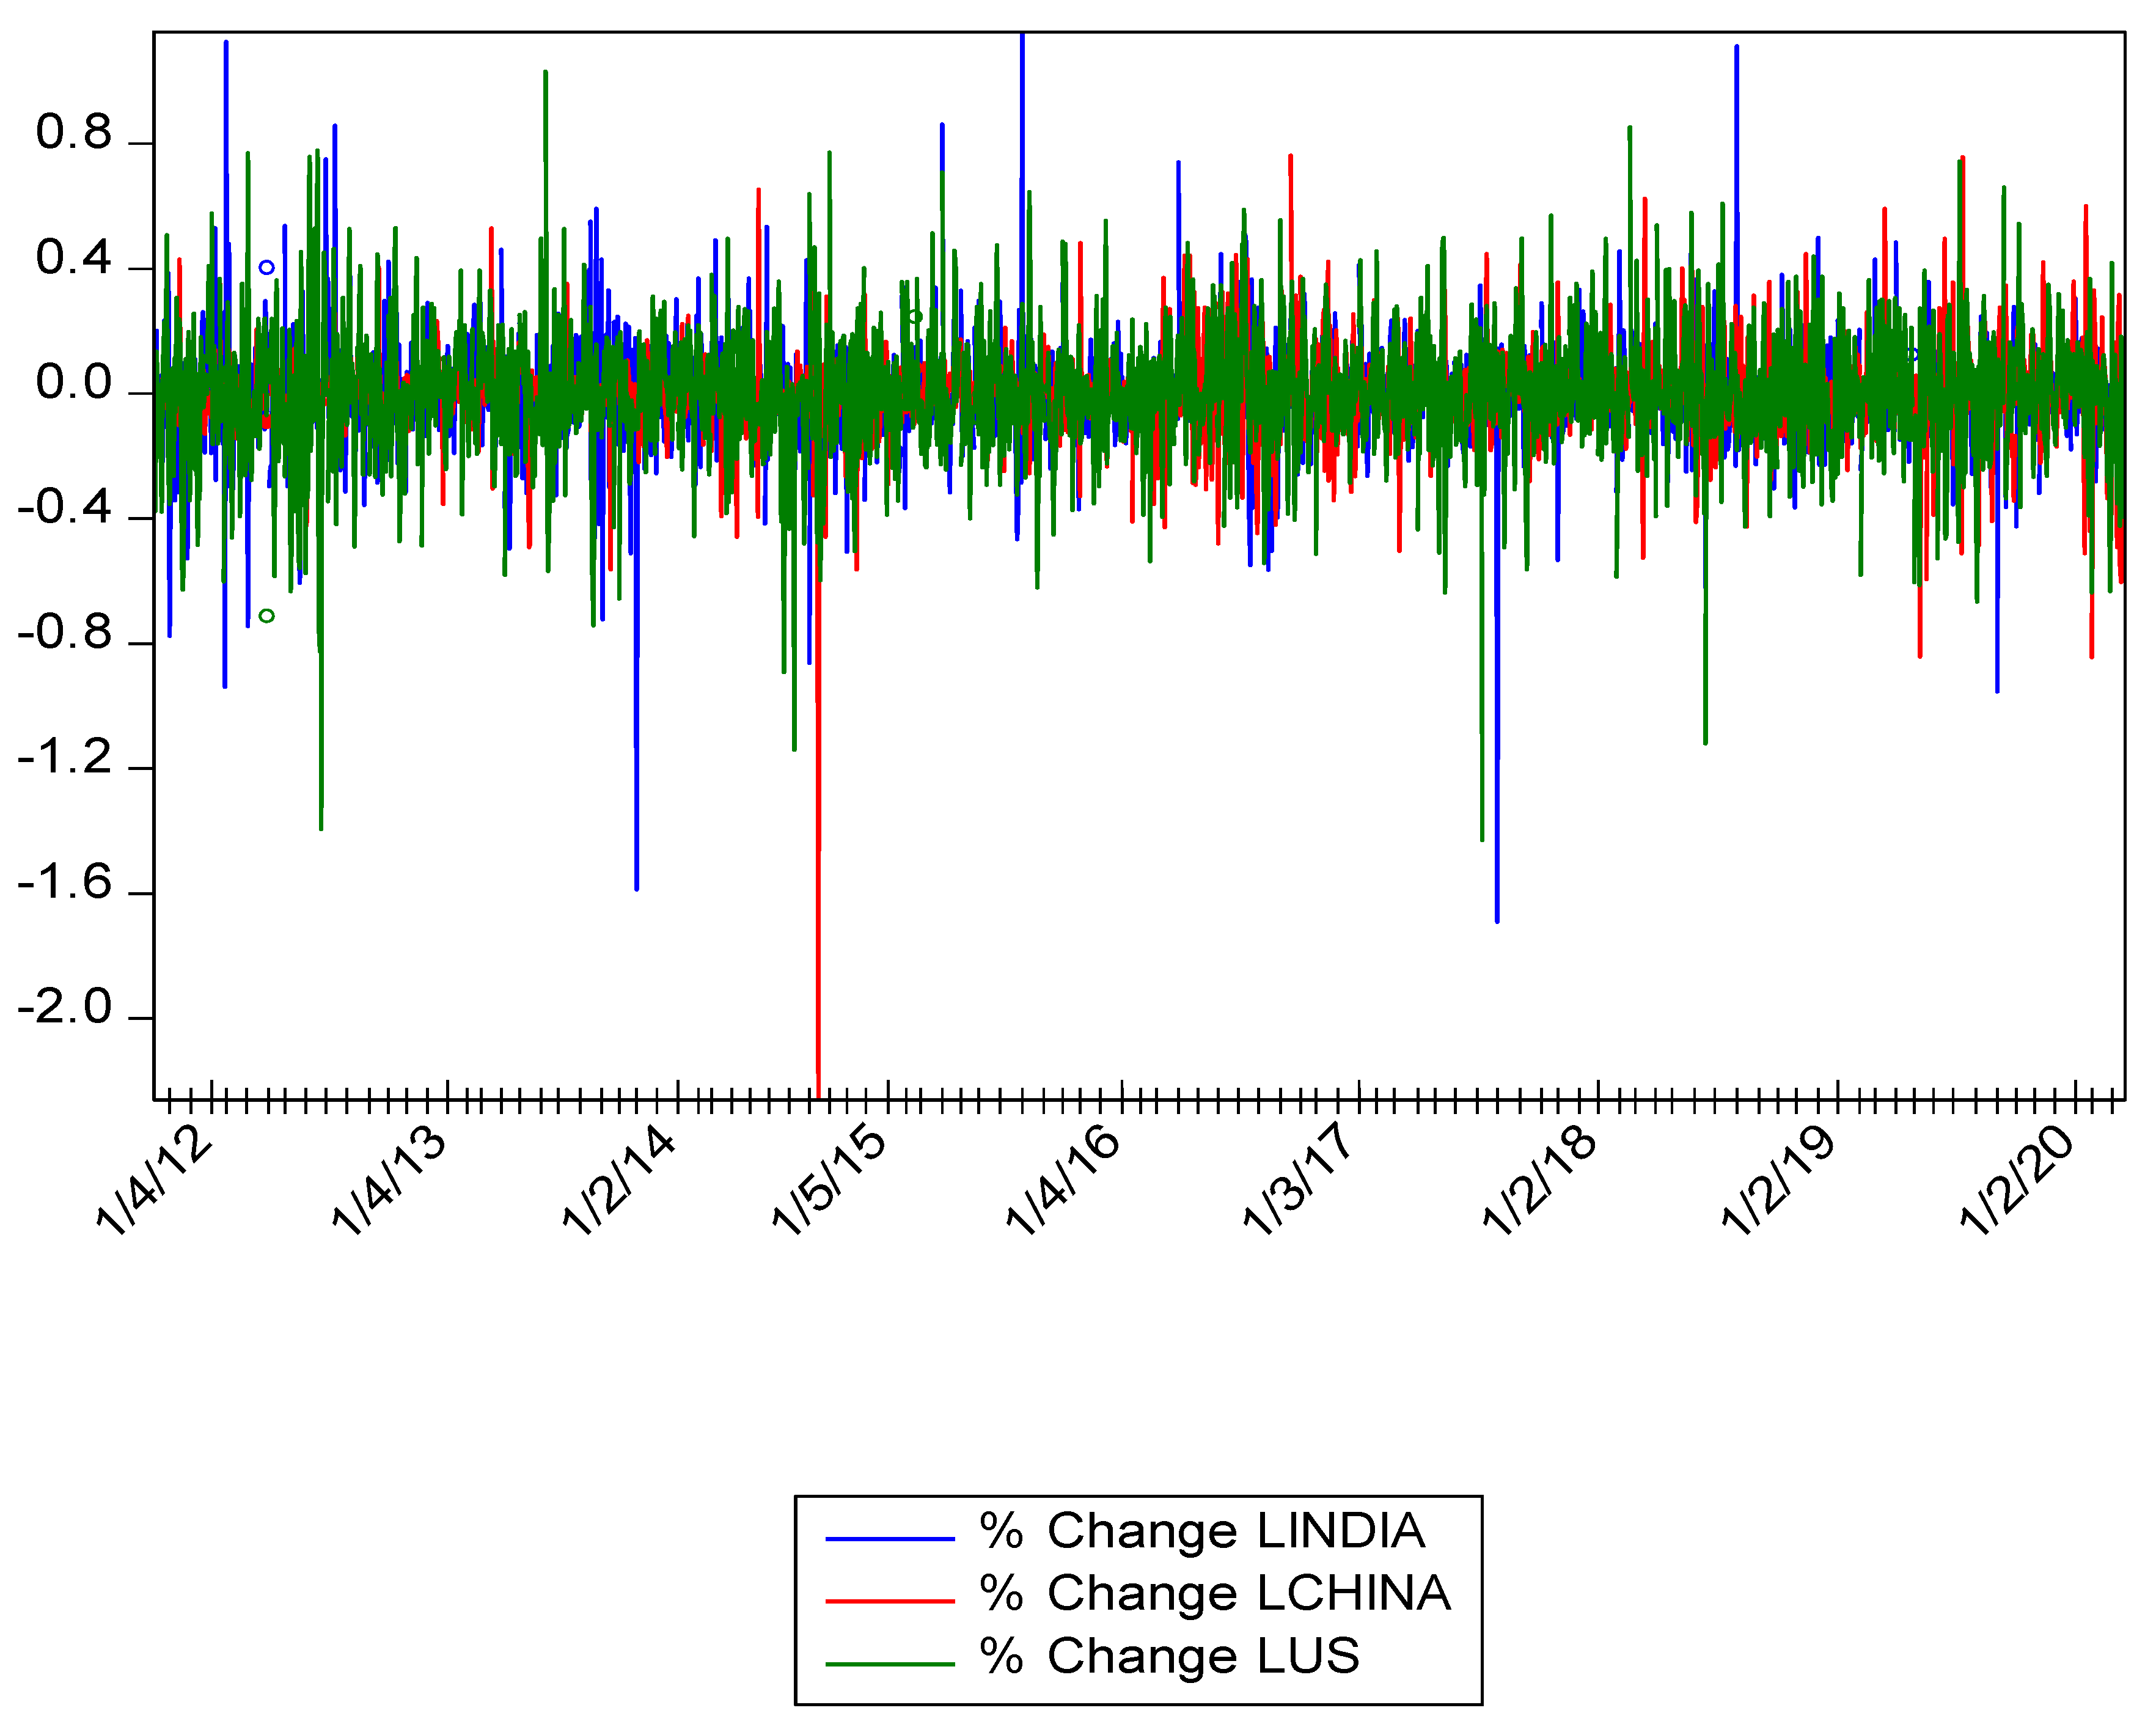
Figure 2.
Daily log returns in Cotton futures in Multi Commodity Exchange (MCX) India, Inter Continental Exchange (ICE) U.S., and Zhengzhou Commodity Exchange (ZCE) China.
Figure 2.
Daily log returns in Cotton futures in Multi Commodity Exchange (MCX) India, Inter Continental Exchange (ICE) U.S., and Zhengzhou Commodity Exchange (ZCE) China.

Table 1.
Country-wise cotton production (thousand bales).
| Country | 2014–2015 | 2015–2016 | 2016–2017 | 2017–2018 | 2018–2019 | 2019–2020 * |
|---|---|---|---|---|---|---|
| China | 30,000 | 22,000 | 22,750 | 27,500 | 27,750 | 27,250 |
| India | 29,500 | 25,900 | 27,000 | 29,000 | 25,800 | 29,500 |
| Other | 18,520 | 15,998 | 18,098 | 21,077 | 19,117 | 18,542 |
| United States | 16,319 | 12,888 | 17,170 | 20,923 | 18,367 | 19,800 |
| Brazil | 7180 | 5920 | 7020 | 9220 | 13,000 | 13,000 |
| Pakistan | 10,600 | 7000 | 7700 | 8200 | 7600 | 6600 |
| Turkey | 3200 | 2650 | 3200 | 4000 | 3700 | 3400 |
| Uzbekistan | 3900 | 3800 | 3725 | 3860 | 3275 | 3500 |
* March 2020, Cotton World Production (Season Beginning August 1). Source: Foreign Agricultural Service/USDA March 2020, Global Market Analysis.
Table 2.
Details of Cotton Contract traded on ICE, ZCE, and MCX.
| ZCE (China) | MCX (India) | ICE (U.S.) | |
|---|---|---|---|
| Product | Cotton No. 1—Zhengzhou Commodity Exchange | Cotton (29 mm) MCX Futures | Cotton No. 2 Futures |
| Trading Unit | 5 metric tons/lot (conditioned weight) | 25 Bales (of 170 Kgs each) | 50,000 pounds net weight |
| Price Quotation | Chinese yuan (CNY) per metric ton | Indian Rupee (INR) Rs. Per Bale | Cents and hundredths of a cent per pound |
| Minimum Price Fluctuation | CNY5/metric ton | Rs. 10 | 1/100 of a cent (one “point”) per pound equivalent to $5.00 per contract. |
| Daily Price Limit | ±4% of the settlement price of the previous trading day; | 4% (3% + 1%) | 3 to 7 cents per pound |
| Contract Month | January, March, May, July, September, and November | August, September, October, November, December, January, February, March, April, May | March, May, July, October, December |
| Trading Hours | Monday to Friday 9:00 a.m.–11:30 a.m. 1:30 p.m.–3:00 p.m. (Beijing time) | Monday to Friday: 9.00 a.m. to 9.00 p.m. (India time) | NEW YORK, 9:00 p.m.–2:20 p.m. 21:00 p.m.–14:20 p.m. |
| Last Trading Day | The 10th trading day of the delivery month | Last calendar day of the contract month. If the last calendar day is a holiday or Saturday then the preceding working day | Seventeen business days from the end of spot month. |
| Delivery Point | Delivery warehouses designated by Zhengzhou Commodity Exchange | Rajkot (Gujarat) | Galveston, TX, Houston, TX, Dallas/Ft. Worth, TX, Memphis, TN and Greenville/Spartanburg, SC. |
Table 3.
Descriptive statistics.
| 1st Sub Period 10 November 2011–4 November 2016 | 2nd Sub Period 5 November 2016 Onwards | Full Sample | |||||||
|---|---|---|---|---|---|---|---|---|---|
| U.S. | India | China | U.S. | India | China | U.S. | India | China | |
| Mean | 7.40 | 7.46 | 7.86 | 7.39 | 7.48 | 7.67 | 7.39 | 7.47 | 7.78 |
| Median | 7.38 | 7.49 | 7.94 | 7.39 | 7.49 | 7.71 | 7.39 | 7.49 | 7.73 |
| Maximum | 7.74 | 7.76 | 8.18 | 7.65 | 7.63 | 7.92 | 7.74 | 7.76 | 8.18 |
| Minimum | 7.13 | 7.20 | 7.40 | 7.14 | 7.25 | 7.41 | 7.13 | 7.2 | 7.4 |
| Std. Dev. | 0.16 | 0.14 | 0.23 | 0.11 | 0.07 | 0.11 | 0.14 | 0.11 | 0.21 |
| Skewness | 0.18 | −0.27 | −0.33 | −0.11 | −0.49 | −0.80 | 0.16 | −0.44 | 0.27 |
| Kurtosis | 1.71 | 1.74 | 1.51 | 2.57 | 2.80 | 2.82 | 2.05 | 2.34 | 1.83 |
| Jarque-Bera | 85.96 | 90.52 | 127.78 | 7.67 | 32.88 | 86.14 | 82.17 | 99.92 | 135.38 |
| Probability | 0.00 | 0.00 | 0.00 | 0.02 | 0.00 | 0.00 | 0 | 0 | 0 |
| Observations | 1154 | 1154 | 1154 | 799 | 799 | 799 | 1953 | 1953 | 1953 |
Table 4.
Augmented Dickey Fuller (ADF) and Phillips Perron (PP) tests.
| Series | Lags | ADF | PP | ||
|---|---|---|---|---|---|
| China | Levels | 1 | t-Statistic | −1.01 | −1.04 |
| Prob. * | 0.75 | 0.73 | |||
| Ist Diff | 1 | t-Statistic | −42.22 | −42.26 | |
| Prob. * | 0.00 | 0.00 | |||
| India | Levels | 1 | t-Statistic | −1.17 | −1.14 |
| Prob. * | 0.22 | 0.23 | |||
| Ist Diff | 1 | t-Statistic | −47.22 | −47.22 | |
| Prob. * | 0.00 | 0.00 | |||
| U.S. | Levels | 3 | t-Statistic | −1.22 | −1.34 |
| Prob. * | 0.20 | 0.16 | |||
| Ist Diff | 3 | t-Statistic | −23.67 | −41.44 | |
| Prob. * | 0.00 | 0.00 |
Table 5.
Pairwise cointegration tests.
| Cotton Futures | Johansen’s Cointegration | Null Hypothesis H0: R | Full Sample | 1st Sub Period 10 November 2011–4 November 2016 | 2nd Sub Period 5 November 2016 Onwards | |||
|---|---|---|---|---|---|---|---|---|
| Test Stat. | Prob. | Test Stat. | Prob. | Test Stat. | Prob. | |||
| China/U.S. (2 lag) | λ trace | 0 | 16.706 | 0.032 ** | 17.866 | 0.021 ** | 12.613 | 0.129 |
| 1 | 0.973 | 0.323 | 0.834 | 0.361 | 0.342 | 0.558 | ||
| λ max | 0 | 15.732 | 0.029 ** | 17.031 | 0.017 ** | 12.271 | 0.110 | |
| 1 | 0.973 | 0.323 | 0.834 | 0.361 | 0.342 | 0.558 | ||
| China/India (2 lag) | λ trace | 0 | 14.228 | 0.076 * | 16.048 | 0.041 ** | 11.386 | 0.188 |
| 1 | 1.060 | 0.303 | 1.331 | 0.248 | 0.562 | 0.453 | ||
| λ max | 0 | 13.167 | 0.074 * | 14.716 | 0.042 ** | 10.823 | 0.163 | |
| 1 | 1.060 | 0.303 | 1.331 | 0.248 | 0.562 | 0.453 | ||
| India/U.S. (2 lag) | λ trace | 0 | 29.241 | 0.000 *** | 22.367 | 0.003 *** | 11.597 | 0.177 |
| 1 | 7.648 | 0.005 *** | 5.137 | 0.023 ** | 1.794 | 0.180 | ||
| λ max | 0 | 21.592 | 0.002 *** | 17.229 | 0.016 ** | 9.803 | 0.225 | |
| 1 | 7.648 | 0.005 *** | 5.137 | 0.023 ** | 1.794 | 0.180 | ||
* Statistical significance at the 10% level, ** at the 5% level, *** at the 1% level. The constant is restricted to the cointegration relation, allowing for no linear trend, either in the data or in the cointegrating equation. The third column refers to the Johansen (1988, 1991) cointegration rank test, where null hypothesis is H0: rank = r and H1: rank > r.
Table 6.
Estimates of VEC Granger Causality Test of Three Cotton Markets.
| Commodity Pair | Null Hypothesis (H0) | Chi-sq | p-Value | Lags | Direction | Relationship |
|---|---|---|---|---|---|---|
| China/U.S. | U.S. does not granger cause China | 157.643 *** | 0.000 | 2 | Bi-directional | China→U.S. U.S.→China |
| China does not granger cause U.S. | 6.654 ** | 0.035 | ||||
| India/U.S. | India does not granger cause U.S. | 0.045 | 0.97 | 2 | Uni-directional | U.S.→India |
| U.S. does not granger cause India | 113.24 *** | 0.00 | ||||
| China/India | China does not granger cause India | 0.333 | 0.563 | 1 | Uni-directional | India→China |
| India does not granger cause China | 40.830 *** | 0.000 |
Note: Statistical significance at the 10% level, ** at the 5% level, *** at the 1% level.
Table 7.
Estimates of Toda–Yamamoto Granger Causality Test of Three Cotton Markets.
| Commodities | Null Hypothesis (H0) | Chi-sq | p-Value ** | Lags | Direction | Relationship |
|---|---|---|---|---|---|---|
| China/U.S. | U.S. does not granger cause China | 160.628 *** | 0.000 | 2 | Bi-directional | China→U.S. U.S.→China |
| China does not granger cause U.S. | 6.279 ** | 0.043 | ||||
| India/U.S. | India does not granger cause U.S. | 0.175 | 0.916 | 2 | Uni-directional | U.S.→ India |
| U.S. does not granger cause India | 143.243 *** | 0.000 | ||||
| China/India | China does not granger cause India | 1.414 | 0.234 | 1 | Uni-directional | India→China |
| India does not granger cause China | 33.530 *** | 0.000 |
Note: Statistical significance at the 10% level, ** at the 5% level, *** at the 1% level.
Table 8.
Estimates of Toda–Yamamoto Granger Causality Test (First Sub-Period).
| Commodities | Null Hypothesis (H0) | Chi-sq | p-Value | Lags | Direction | Relationship |
|---|---|---|---|---|---|---|
| China/U.S. | U.S. does not granger cause China | 65.173 *** | 0.000 | 2 | Uni-directional | U.S.→ China |
| China does not granger cause U.S. | 3.068 | 0.210 | ||||
| India/U.S. | India does not granger cause U.S. | 2.085 | 0.352 | 2 | Uni-directional | U.S.→ India |
| U.S. does not granger cause India | 110.602 *** | 0.000 | ||||
| China/India | China does not granger cause India | 0.552 | 0.758 | 2 | Uni-directional | India → China |
| India does not granger cause China | 13.175 *** | 0.001 |
Note: *** indicates statistical significance at the 1% level.
Table 9.
Estimates of Toda–Yamamoto Granger Causality Test (Second Sub-Period).
| Commodities | Null Hypothesis (H0) | Chi-sq | p-Value ** | Lags | Direction | Relationship |
|---|---|---|---|---|---|---|
| China/U.S. | U.S. does not granger cause China | 65.173 *** | 0.000 | 2 | Uni-directional | U.S.→ China |
| China does not granger cause U.S. | 3.068 | 0.215 | ||||
| India/U.S. | India does not granger cause U.S. | 2.278 | 0.32 | 2 | Uni-directional | U.S.→ India |
| U.S. does not granger cause India | 21.521 *** | 0.00 | ||||
| China/India | China does not granger cause India | 0.384 | 0.82 | 2 | Uni-directional | India→China |
| India does not granger cause China | 41.739 *** | 0.00 |
Note: *** indicates statistical significance at the 1% level, ** at the 5% level.
Publisher’s Note: MDPI stays neutral with regard to jurisdictional claims in published maps and institutional affiliations. |
© 2021 by the authors. Licensee MDPI, Basel, Switzerland. This article is an open access article distributed under the terms and conditions of the Creative Commons Attribution (CC BY) license (https://creativecommons.org/licenses/by/4.0/).
Share and Cite
MDPI and ACS Style
Singh, A.; Soni, T.K. Price Transmission in Cotton Futures Market: Evidence from Three Countries. J. Risk Financial Manag. 2021, 14, 444. https://0-doi-org.brum.beds.ac.uk/10.3390/jrfm14090444
AMA Style
Singh A, Soni TK. Price Transmission in Cotton Futures Market: Evidence from Three Countries. Journal of Risk and Financial Management. 2021; 14(9):444. https://0-doi-org.brum.beds.ac.uk/10.3390/jrfm14090444
Chicago/Turabian StyleSingh, Amrinder, and Tarun Kumar Soni. 2021. "Price Transmission in Cotton Futures Market: Evidence from Three Countries" Journal of Risk and Financial Management 14, no. 9: 444. https://0-doi-org.brum.beds.ac.uk/10.3390/jrfm14090444