
Do Inflation Expectations Matter for Small, Open Economies? Empirical Evidence from the Solomon Islands

1
Central Bank of Solomon Islands, Honiara P.O. Box 634, Solomon Islands
2
Department of Accounting Finance and Economics, Nathan Campus, Griffith University, Brisbane, QLD 4111, Australia
*
Author to whom correspondence should be addressed.
J. Risk Financial Manag. 2021, 14(9), 448; https://0-doi-org.brum.beds.ac.uk/10.3390/jrfm14090448
Submission received: 15 July 2021
/
Revised: 7 September 2021
/
Accepted: 16 September 2021
/
Published: 17 September 2021
(This article belongs to the Special Issue Monetary Policy, Inflation and Unemployment Dynamics: Theory and Empirics)
Abstract
:This paper examines the role of inflation expectations in Solomon Islands, a Pacific Island Country, using the Hybrid New Keynesian Phillips Curve model. The study applies the Generalized Method of Moments to estimate the Hybrid New Keynesian Philips Curve model using quarterly time series data for the period 2003–2017. The study confirms the existence of a Hybrid New Keynesian Philips Curve for Solomon Islands and finds that both backward-looking and forward-looking processes matter for inflation. Fuel prices and output gap are important indicators of current inflation. The study highlights key areas to further investigate including the weak monetary transmission mechanism and to examine the exchange rate pass through effect onto domestic prices. Studies on the role of inflation expectations in small, open, economies of the Pacific, such as Solomon Islands, is limited. This paper fills this void in literature by using quarterly time-series data to build a Hybrid New Keynesian Philips Curve model for Solomon Islands.
1. Introduction
Assessing inflation expectations as early and as precisely as possible for appropriate, proper and timely action has traditionally been a primary role of central banks worldwide. At the same time, the assessment itself has always been challenging for the monetary authorities since inflation expectations are not directly observable, requiring a need to turn to suitable indicators for assessment instead such as surveys, extractions from yield curves and inflation-linked bonds (Tomfort 2011). Moreover, central banks have often pondered on the question of whether expectations predominantly follow a forward-looking or backward-looking behaviour of firms. This question is important ultimately for the optimal monetary policy stance, via a process of understanding the different sources of inflation persistence and the costs of disinflation mechanisms (Dorich 2009).
The empirical evidence here has been mixed. Some studies find a predominantly forward-looking behaviour of firms (Sakurai 2016; Meng 2016; Hervino 2015; Gali and Gertler 1999) while others argue that the backward-looking behaviour is more prominent (Tomfort 2011; Mukhtar and Yousaf 2014). These studies span across many years, countries and regions but have largely ignored the case of the Pacific Island Countries (PICs)—small, vulnerable, open economies. This study, therefore, using the case of Solomon Islands, attempts to fill that gap in literature. We do this using the Hybrid New Keynesian Phillips Curve (HNKPC) framework. The model is estimated using quarterly data for the period 2003–2017. The estimation is conducted using the Generalized Method of Moments (GMM) methods. The study finds that both backward-looking and forward-looking behaviour of firms matter for inflation. The results show that fuel prices and output gap are important indicators of current inflation. Policy implications are discussed.
2. Study Context: Macroeconomic Performance and Inflation
2.1. Solomon Islands Economy: An Overview
Solomon Islands is a small island open economy with population of around 652,858 in 2018 (The World Bank 2020). Located in the North-East of Australia, it lies in an archipelago encompassing over 28,000 km2 of land area. It accommodates many scattered islands, with a total of 10 provincial centres including Honiara, the capital city. Since gaining its independence in 1978, the Solomon Islands economy has made reasonable progress in certain areas of its development; however, it has struggled to provide the basic infrastructure development for its people. Its geographically scattered islands are a major constraint for its planned developments and service deliveries.
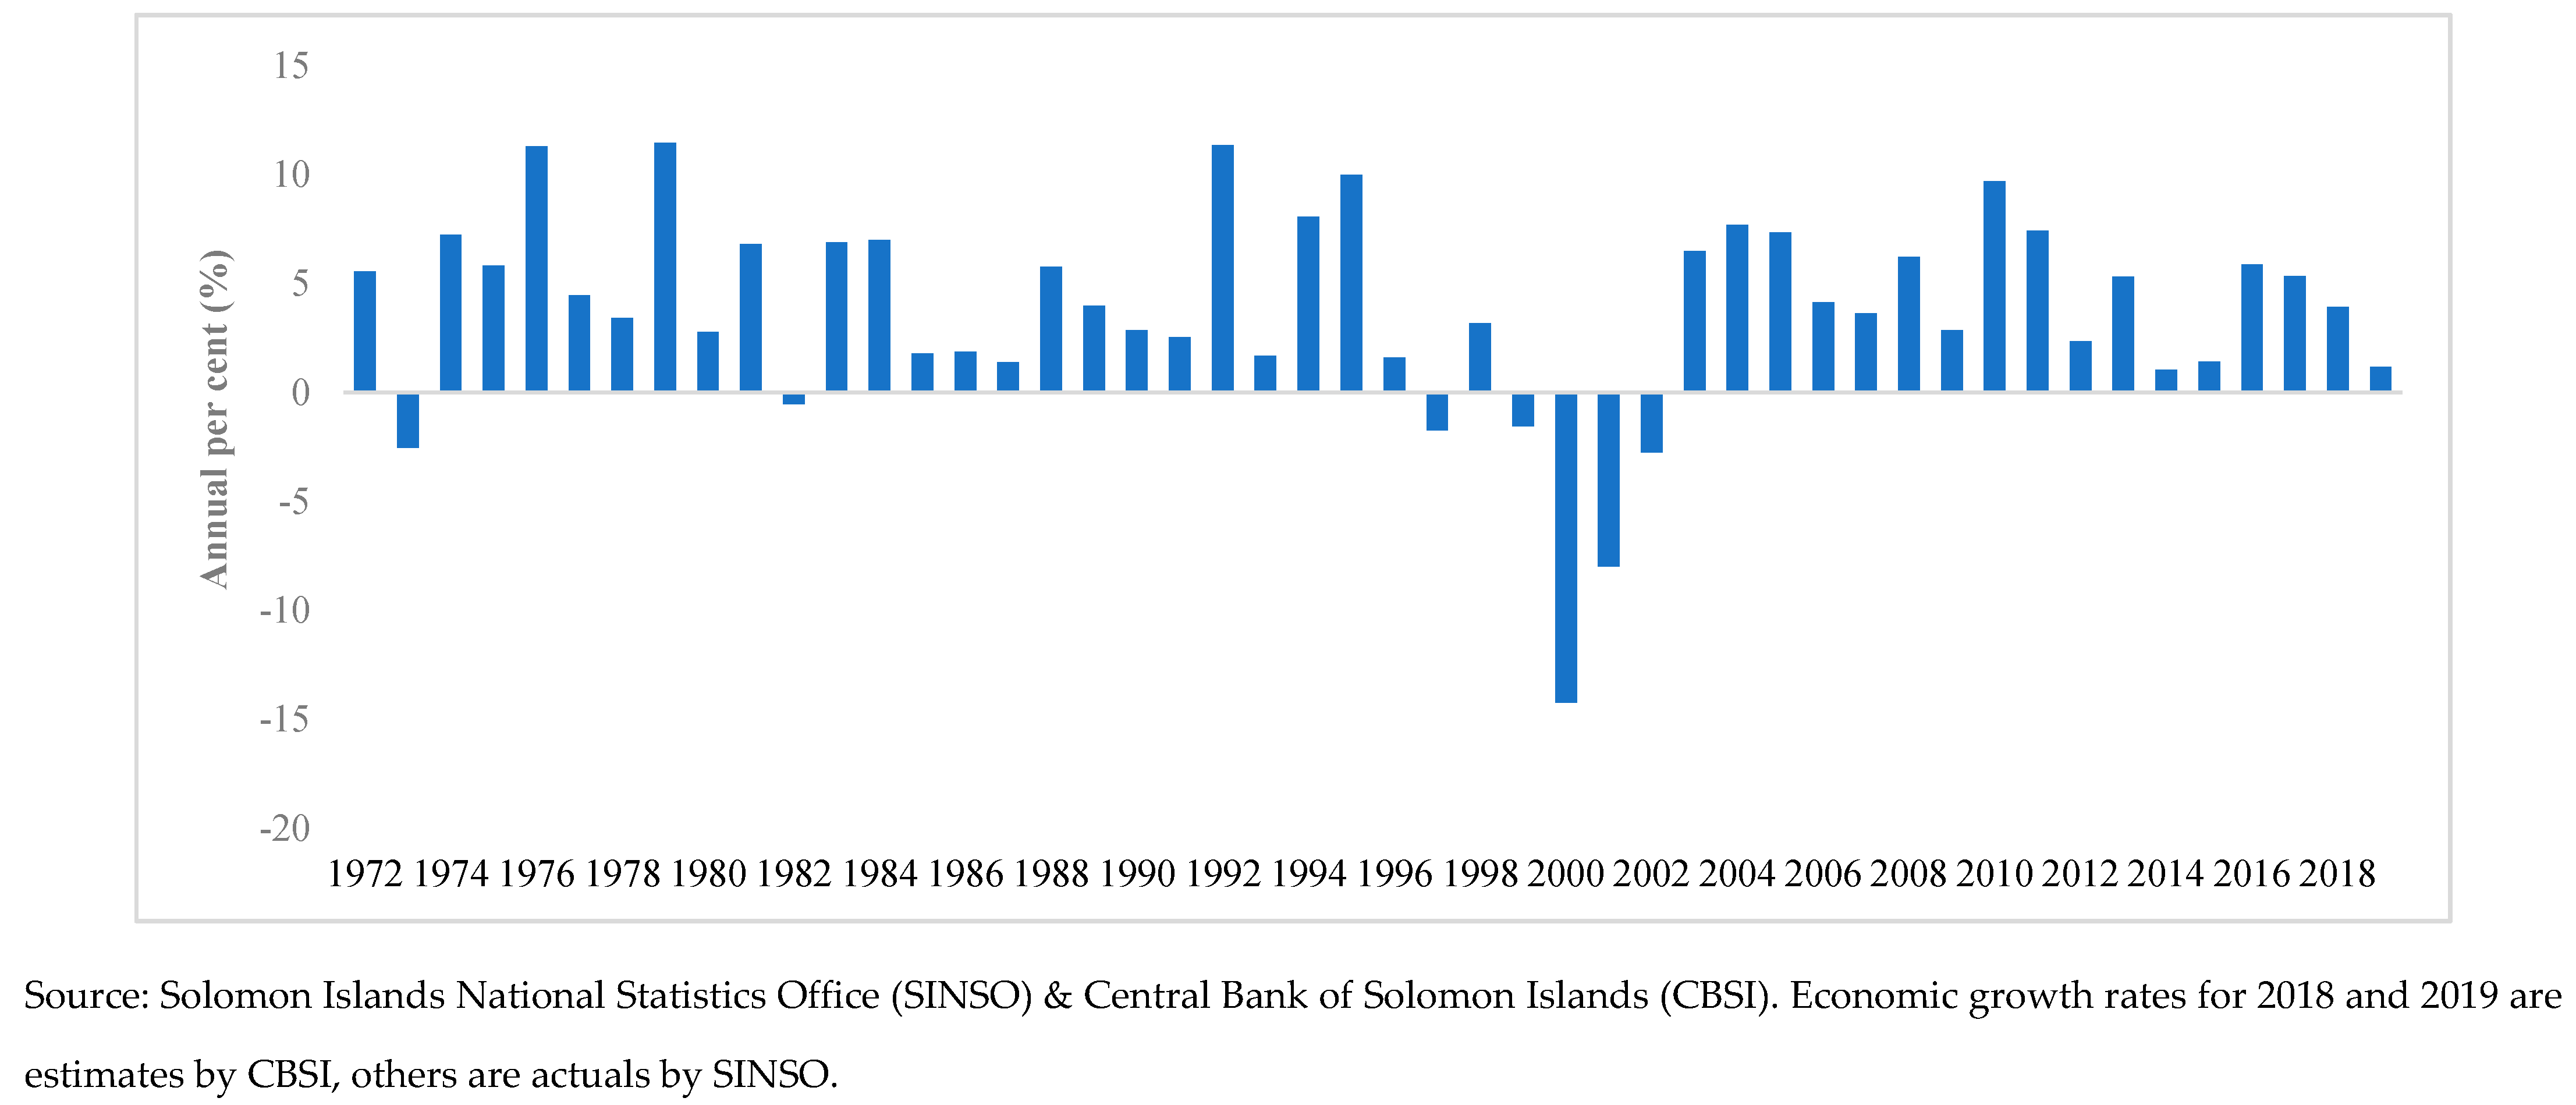
Solomon Islands’ economic growth has generally been low and volatile over the last four decades due to a wide range of external and internal shocks (Figure 1). In the 1970s, Solomon Islands experienced robust growth, recording an average growth of 5.8 per cent predominantly supported by the agriculture and fishing sectors. However, growth has gradually declined over the decade, falling to 3.8 per cent in the period 1981–1990 and falling substantially to 1.2 per cent over the period 1991–2001. The peak in 1984 and 1992 was driven by fish and log productions respectively.
The declining trend seen since 1996 to 2002 is a culmination of factors—namely, unfavourable seasons in the agriculture and fishing sectors, the 1997 Asian Financial Crisis that affected the country’s log exports and the political instability from 1999 to 2002. The economy was badly affected by the period of political instability, resulting in an average growth of negative 6.6 per cent over the period. These four years of conflict disrupted the narrowed-based production of the country and brought the country to an accumulated debt, which triggered acute fiscal deficit balances.
In July 2003, the arrival of the Regional Assistance Mission to the Solomon Islands (RAMSI) led to restored law and order, increased business confidence coupled with the injection of donor inflows towards the country’s post-conflict recovery efforts. All of these enabled the economy to find stable footing again. From 2001 to 2008, growth emerged out of the negative territory post RAMSI’s arrival to register an average growth of 3.1 per cent over the period. Conversely, in 2009, economic growth contracted sharply to 2.9 per cent following the global financial recession in late 2008 due to the slowdown in global demand. The robust turn-around in economic growth in 2010 reflected the opening of Gold Ridge Mining while the slight down-turn in growth in 2014 was attributed to the April Flash floods that disrupted business activities in the capital.
Furthermore, economic growth rebounded at a slower pace post 2014 and 2015 before rising to 5.9 per cent in 2016, driven by favourable gains in the agriculture and forestry sectors as well as strong performances in the industrial and services sector. In recent years, economic growth has slowed from 5.3 per cent in 2017 to an estimated 1.2 per cent in 2019, reflecting the gradual decline in the forestry sector.
Solomon Islands is a Lower Middle-Income country with a per capita income of US $1483 (2018); comparable countries in the region thus include Papua New Guinea (PNG), Samoa, Tonga and Vanuatu. According to the Human Development Index (HDI) report by the United Nations Development Programme (UNDP) (2019), Solomon Islands is classified in the Medium HDI group (ranking 153 out of 189 countries) and ranks lower than the average of the East Asia and the Pacific region of 0.741 and other PICs like Fiji (ranking of 98), Tonga (ranking of 105), Samoa (ranking of 111), Vanuatu (ranking of 141), although slightly higher than PNG (ranking of 155) (see Table 1).
2.2. Measurement of and Trends in Inflation
2.2.1. Some Conceptual Underpinnings
The Consumer Price Index (CPI) is the main indicator of inflation in Solomon Islands, which measures the average change in the price level of a basket of goods and services purchased by households in the country at a specific time relative to the base year (SINSO 2020). The current CPI is the National CPI, which covers four major urban centres; namely, Honiara, Auki, Gizo and Noro as a proxy for the country. Over the years, the country’s CPI has been rebased several times and have undergone structural developments to its composition.
Since the late 1970s, the Honiara Retail Price Index (HRPI) was the first index used as a measure of the changes in the prices of goods and services in Honiara. The consumption basket was derived from a household survey conducted in 1977, which consisted of six main categories including food, drink and tobacco, clothing, housing and utilities, transport and miscellaneous component (CBSI 1988). In the late 1980s, the HRPI was later split into Imported and Other Items as measures of imported and domestically sourced inflation, respectively. The weights of the CPI basket were also updated based on the completion of the 1982 and 1990/1991 sample Household and Income Expenditure Surveys (HIESs), which reflected household expenditures of mainly residents and expatriates in urban Honiara (SINSO 2020).
In 2005/2006, another HIES covering Solomon Islands resident households was conducted by the Solomon Islands National Statistics Office (SINSO) to update the CPI weights. The changes to the Honiara Consumer Price Index (HCPI) Series 2 included an updated consumption basket to accurately reflect consumer spending patterns with the inclusion of two new categorie; namely, “transport and communication” and “recreation and health”, resulting in a total of eight main categories (CBSI 2007). Consequently, this also led to a re-weighting of the main categories within the basket. Meanwhile, food and housing utilities still accounted for larger weights within the HCPI (see Table 2).
Moreover, the HCPI Series 3 was introduced in July 2018, using data from the latest HIES 2012/20131. The consumption basket was revised to reflect an updated basket of goods and services covering 205 items compared to 187 items in the prior series. The basket was also revised to align with the United Nations Classification of Individual Consumption According to Purpose (COICOP) categories used in the HIES. Thus, the consumption basket was increased from eight to twelve main categories (see Table 2) and therefore is now more comparable to the other PICs also using the COICOP categories—namely, Fiji and Samoa.
The HCPI Series 3 was later expanded to the National CPI series in November 2019, which included three other urban centres of Auki, Gizo and Noro. Of the total National CPI, Honiara accounted for 88.1 per cent of the composition relative to the other urban centres, which accounted for the remaining 11.9 per cent (SINSO 2020). The consumption basket for the National CPI consists of the same twelve categories used in the HCPI Series 3 and also maintains the same base period (see Table 2).
2.2.2. Trends in Inflation
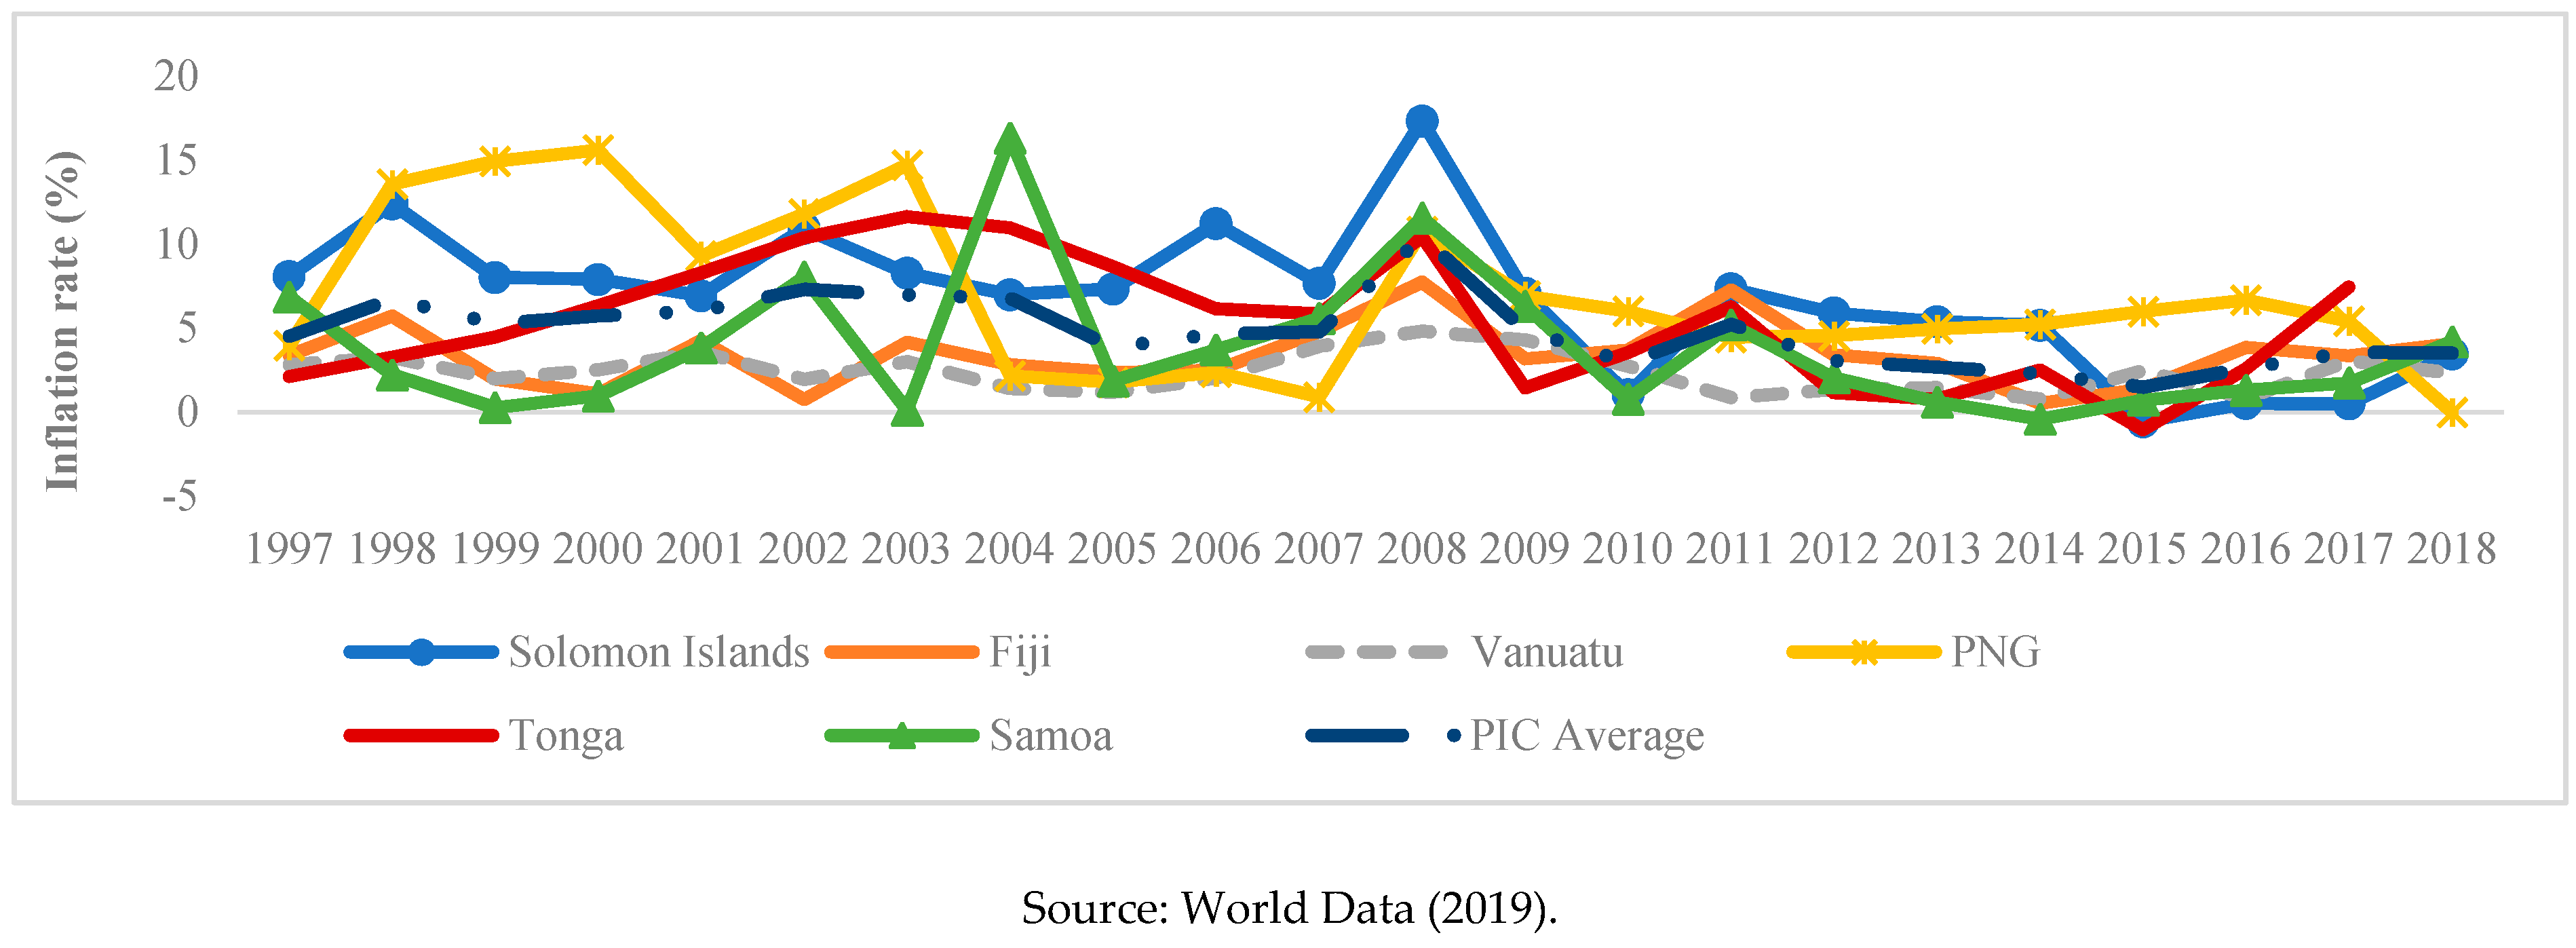
Inflation movements in the Solomon Islands, like many other PICs, is volatile as the economy is vulnerable to shocks originating from both domestic factors and pass throughs from external developments (see Figure 2). As a developing and small open economy that relies on tradable and consumable goods like food and fuel, it is highly exposed to price shocks in the global market. Whilst on the domestic front, it is highly susceptible to supply shocks—namely, natural disasters affecting the supply of domestically produced goods and services. In late 2008, inflation in the PICs averaged around 10 per cent stemming from high food and fuel prices in the global market following the 2008 Global Financial Crisis (GFC) (see Figure 2).
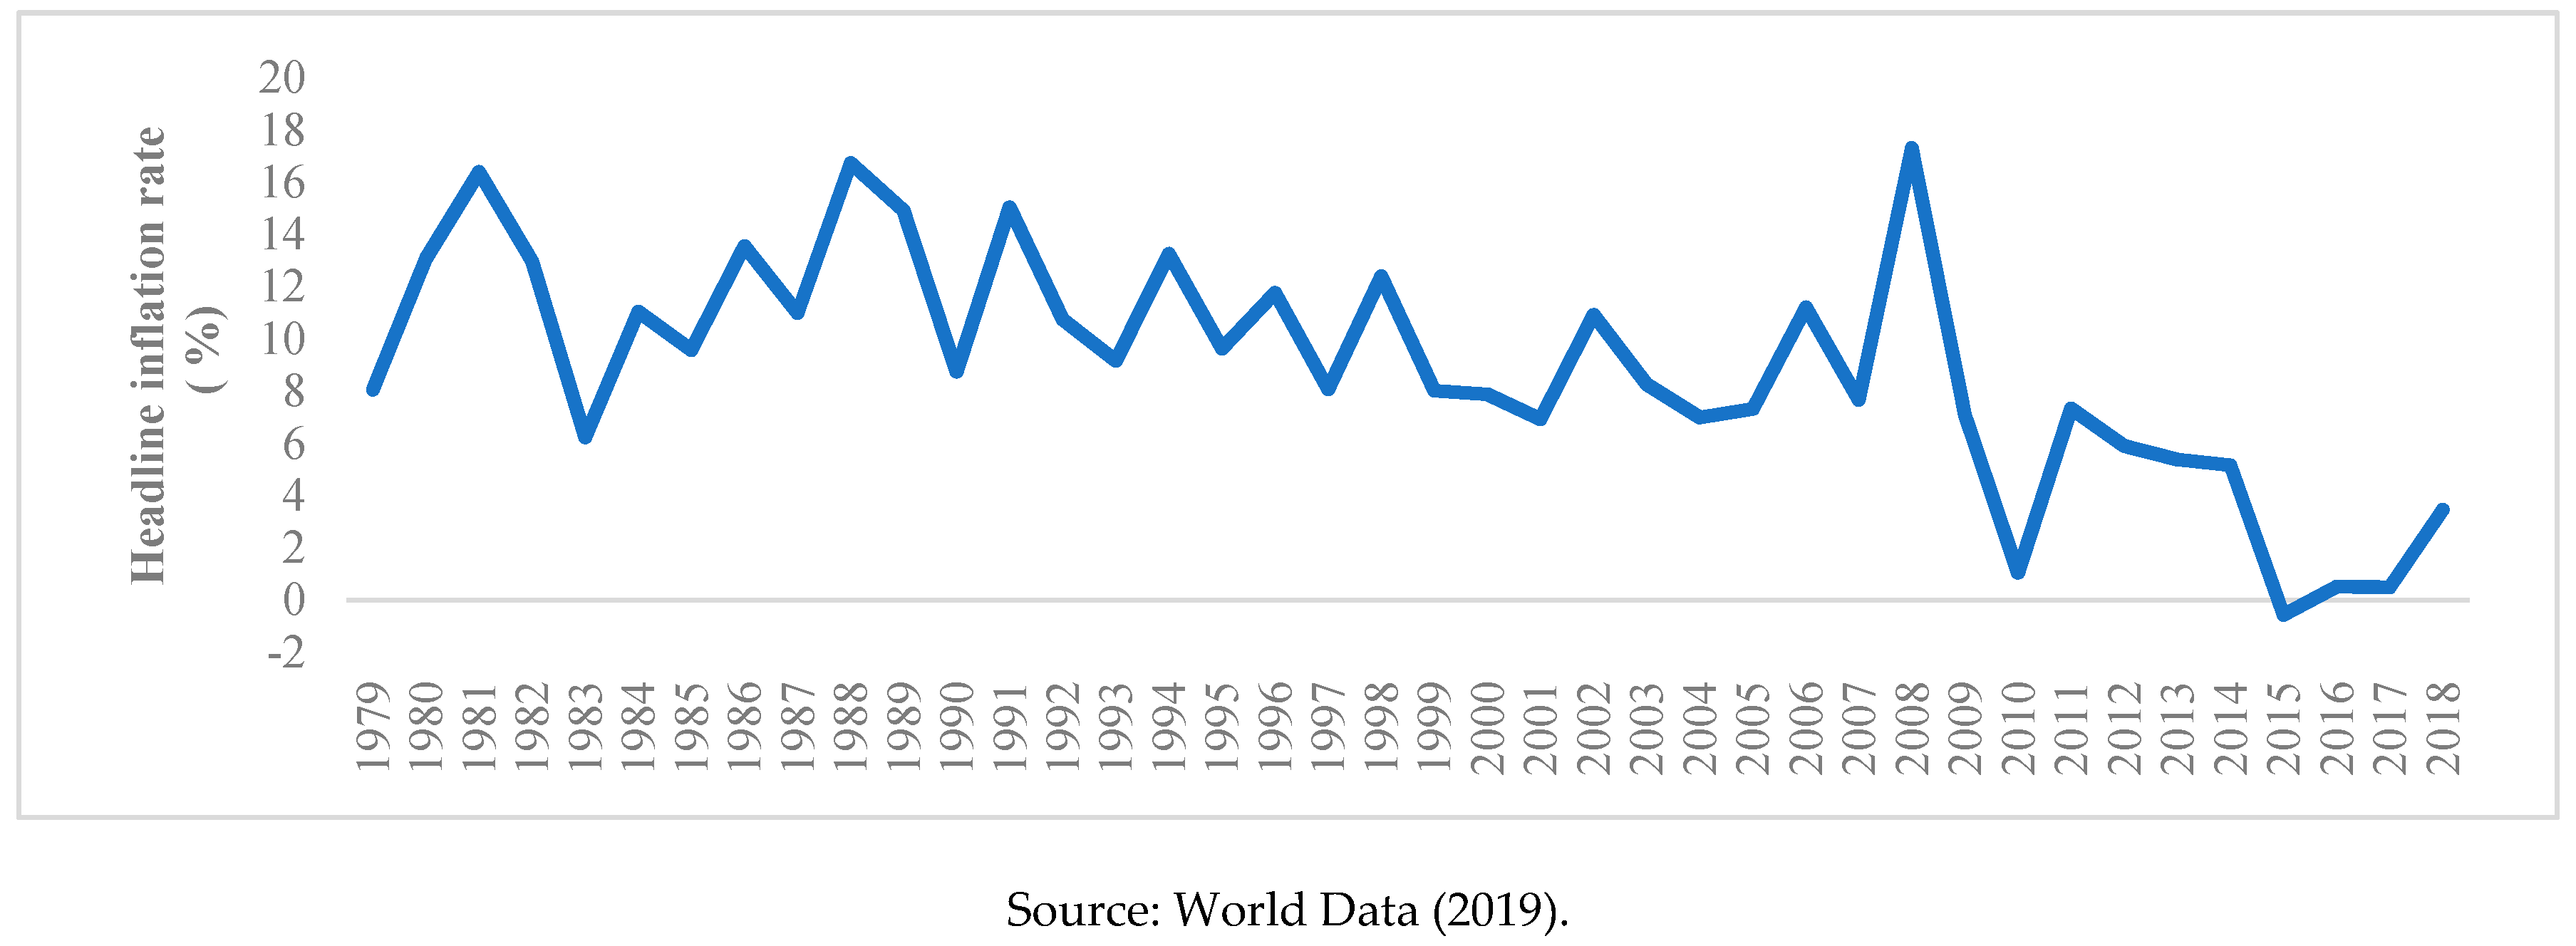
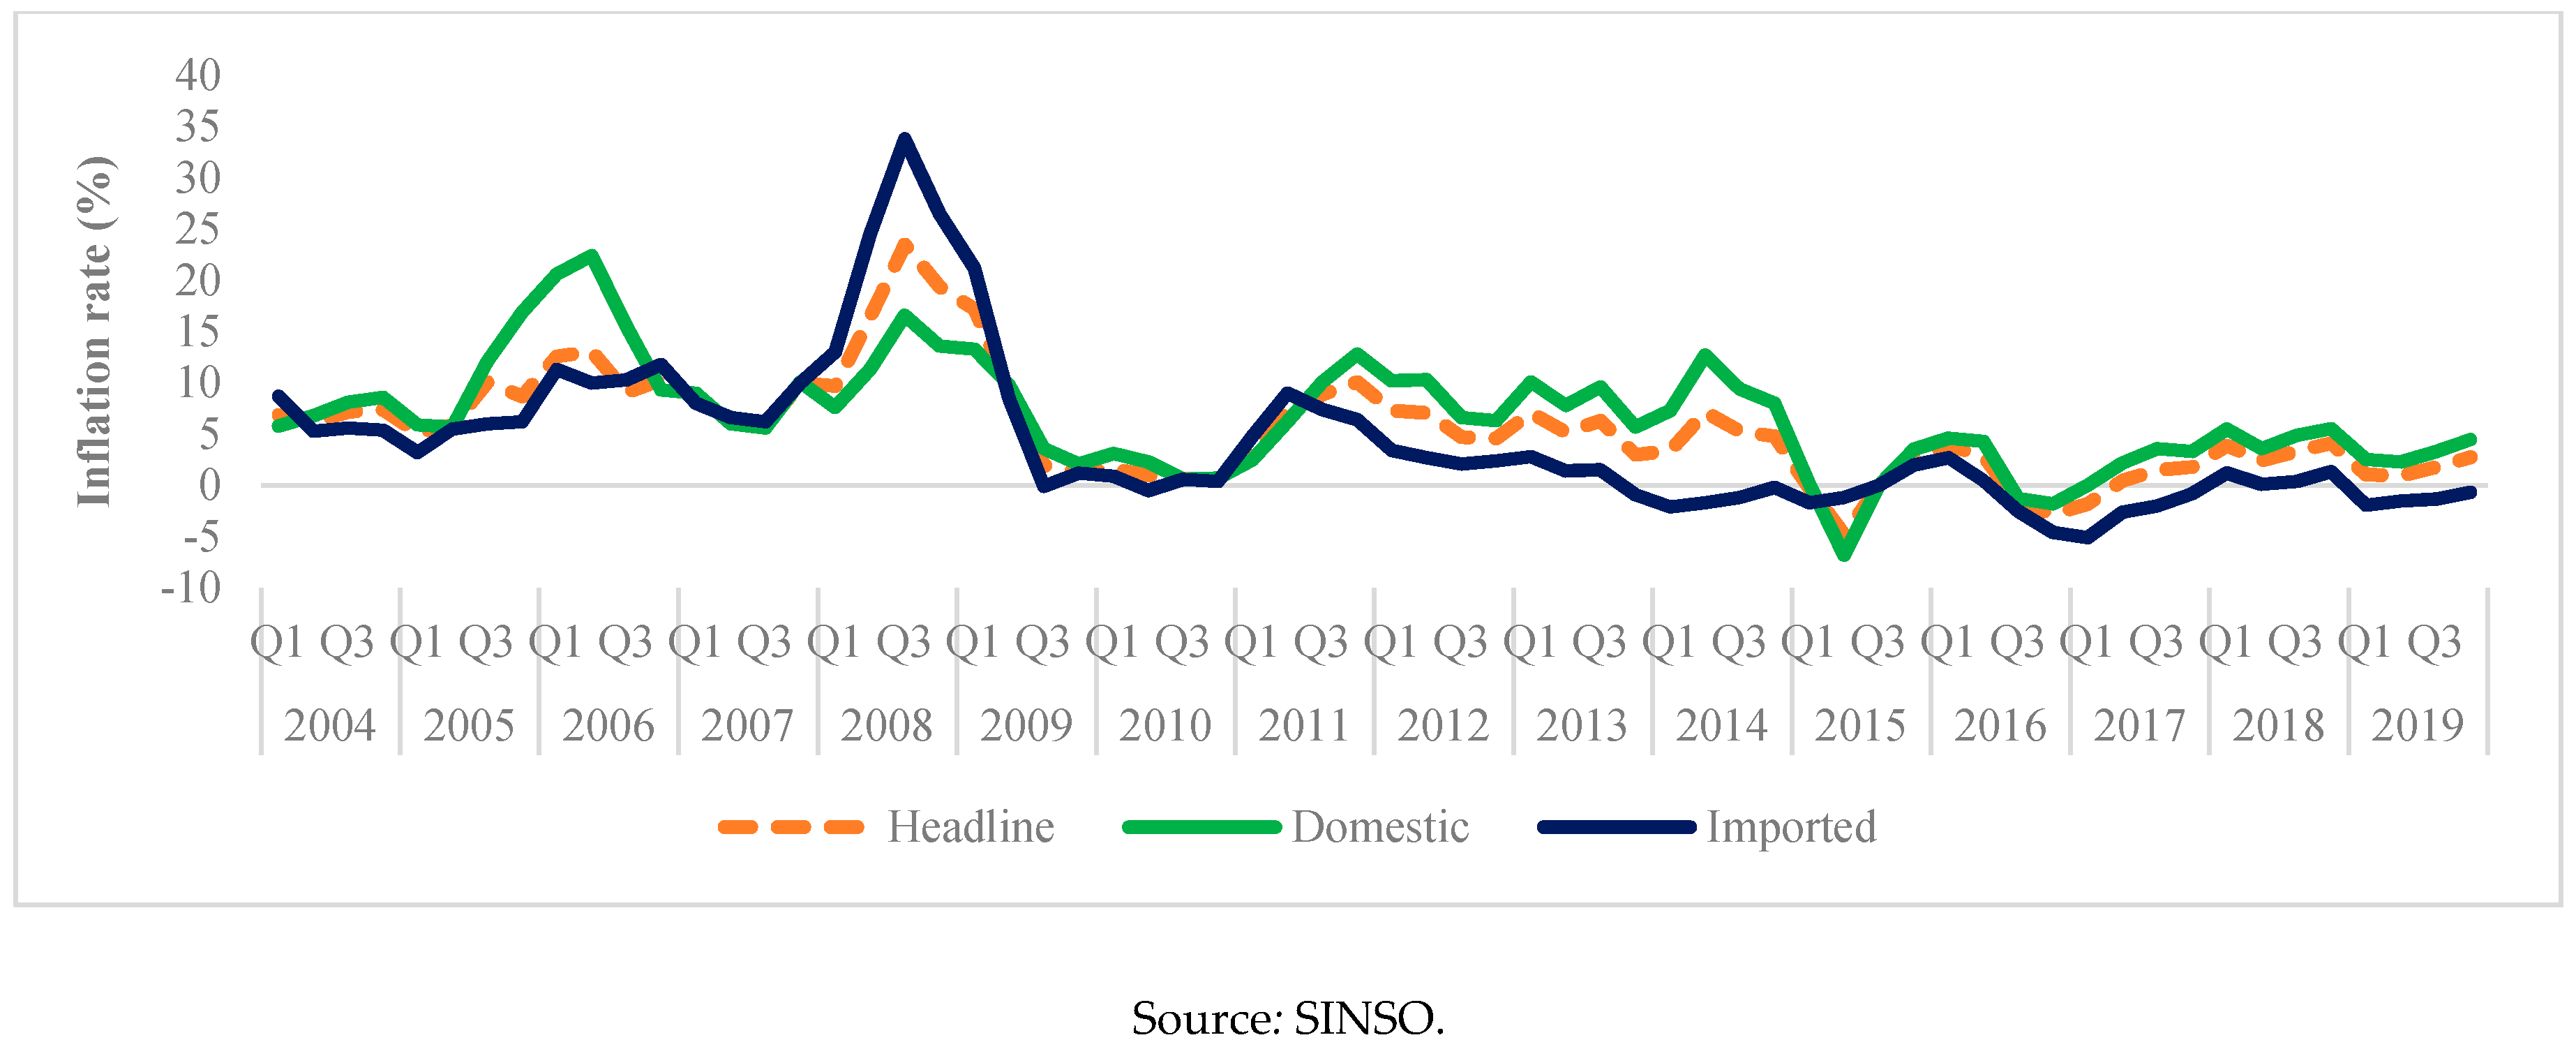
In the early 1990s, the average inflation rate in Solomon Islands was at 11 per cent driven mainly by domestic inflation (see Figure 3). In the later part of the decade, marked by the period of civil unrest from 1999 to 2002, average inflation declined to 8.4 per cent driven by imported inflation, reflecting sluggish demand that existed during the crises. Thereafter, from 2004 to 2008, the average inflation surged to 10.1 per cent, equally driven by both imported and domestic inflation. The spike in imported inflation was attributed to the commodity price boom in early 2008, followed by the decline in imported prices during the GFC as external demand waned. Meanwhile, the increase in domestic inflation was underpinned by price rises in food due to supply shortages in the market (see Figure 4).
Moreover, headline inflation rate dropped to an average of 5.4 per cent over the period 2009–2013, reflecting the price falls in both imported and domestic inflation. Contributing to the fall in imported inflation was the 5 per cent revaluation of the Solomon Islands dollar in June 2011, which aimed to address the inflationary pressures in the economy. This resulted in a 15 per cent appreciation of the Real Effective Exchange Rate (REER) (CBSI 2011).
Meanwhile, the spike in inflation rate in the second quarter of 2014 was attributed to the April Flash floods that led to a supply shock in the domestic market and, consequently, a rise in domestic inflation. Since then the headline inflation rate has plummented to a low of minus 4.8 per cent in the second quarter of 2015 attributed to the decline in domestic inflation, whilst imported inflation fell, remaining subdued below zero as imported prices continued to ease. In recent quarters, headline inflation has remained low, hovering at an average of 2.5 per cent over the period 2018Q1–2019Q4 (see Figure 4).
2.2.3. Measures and Targets
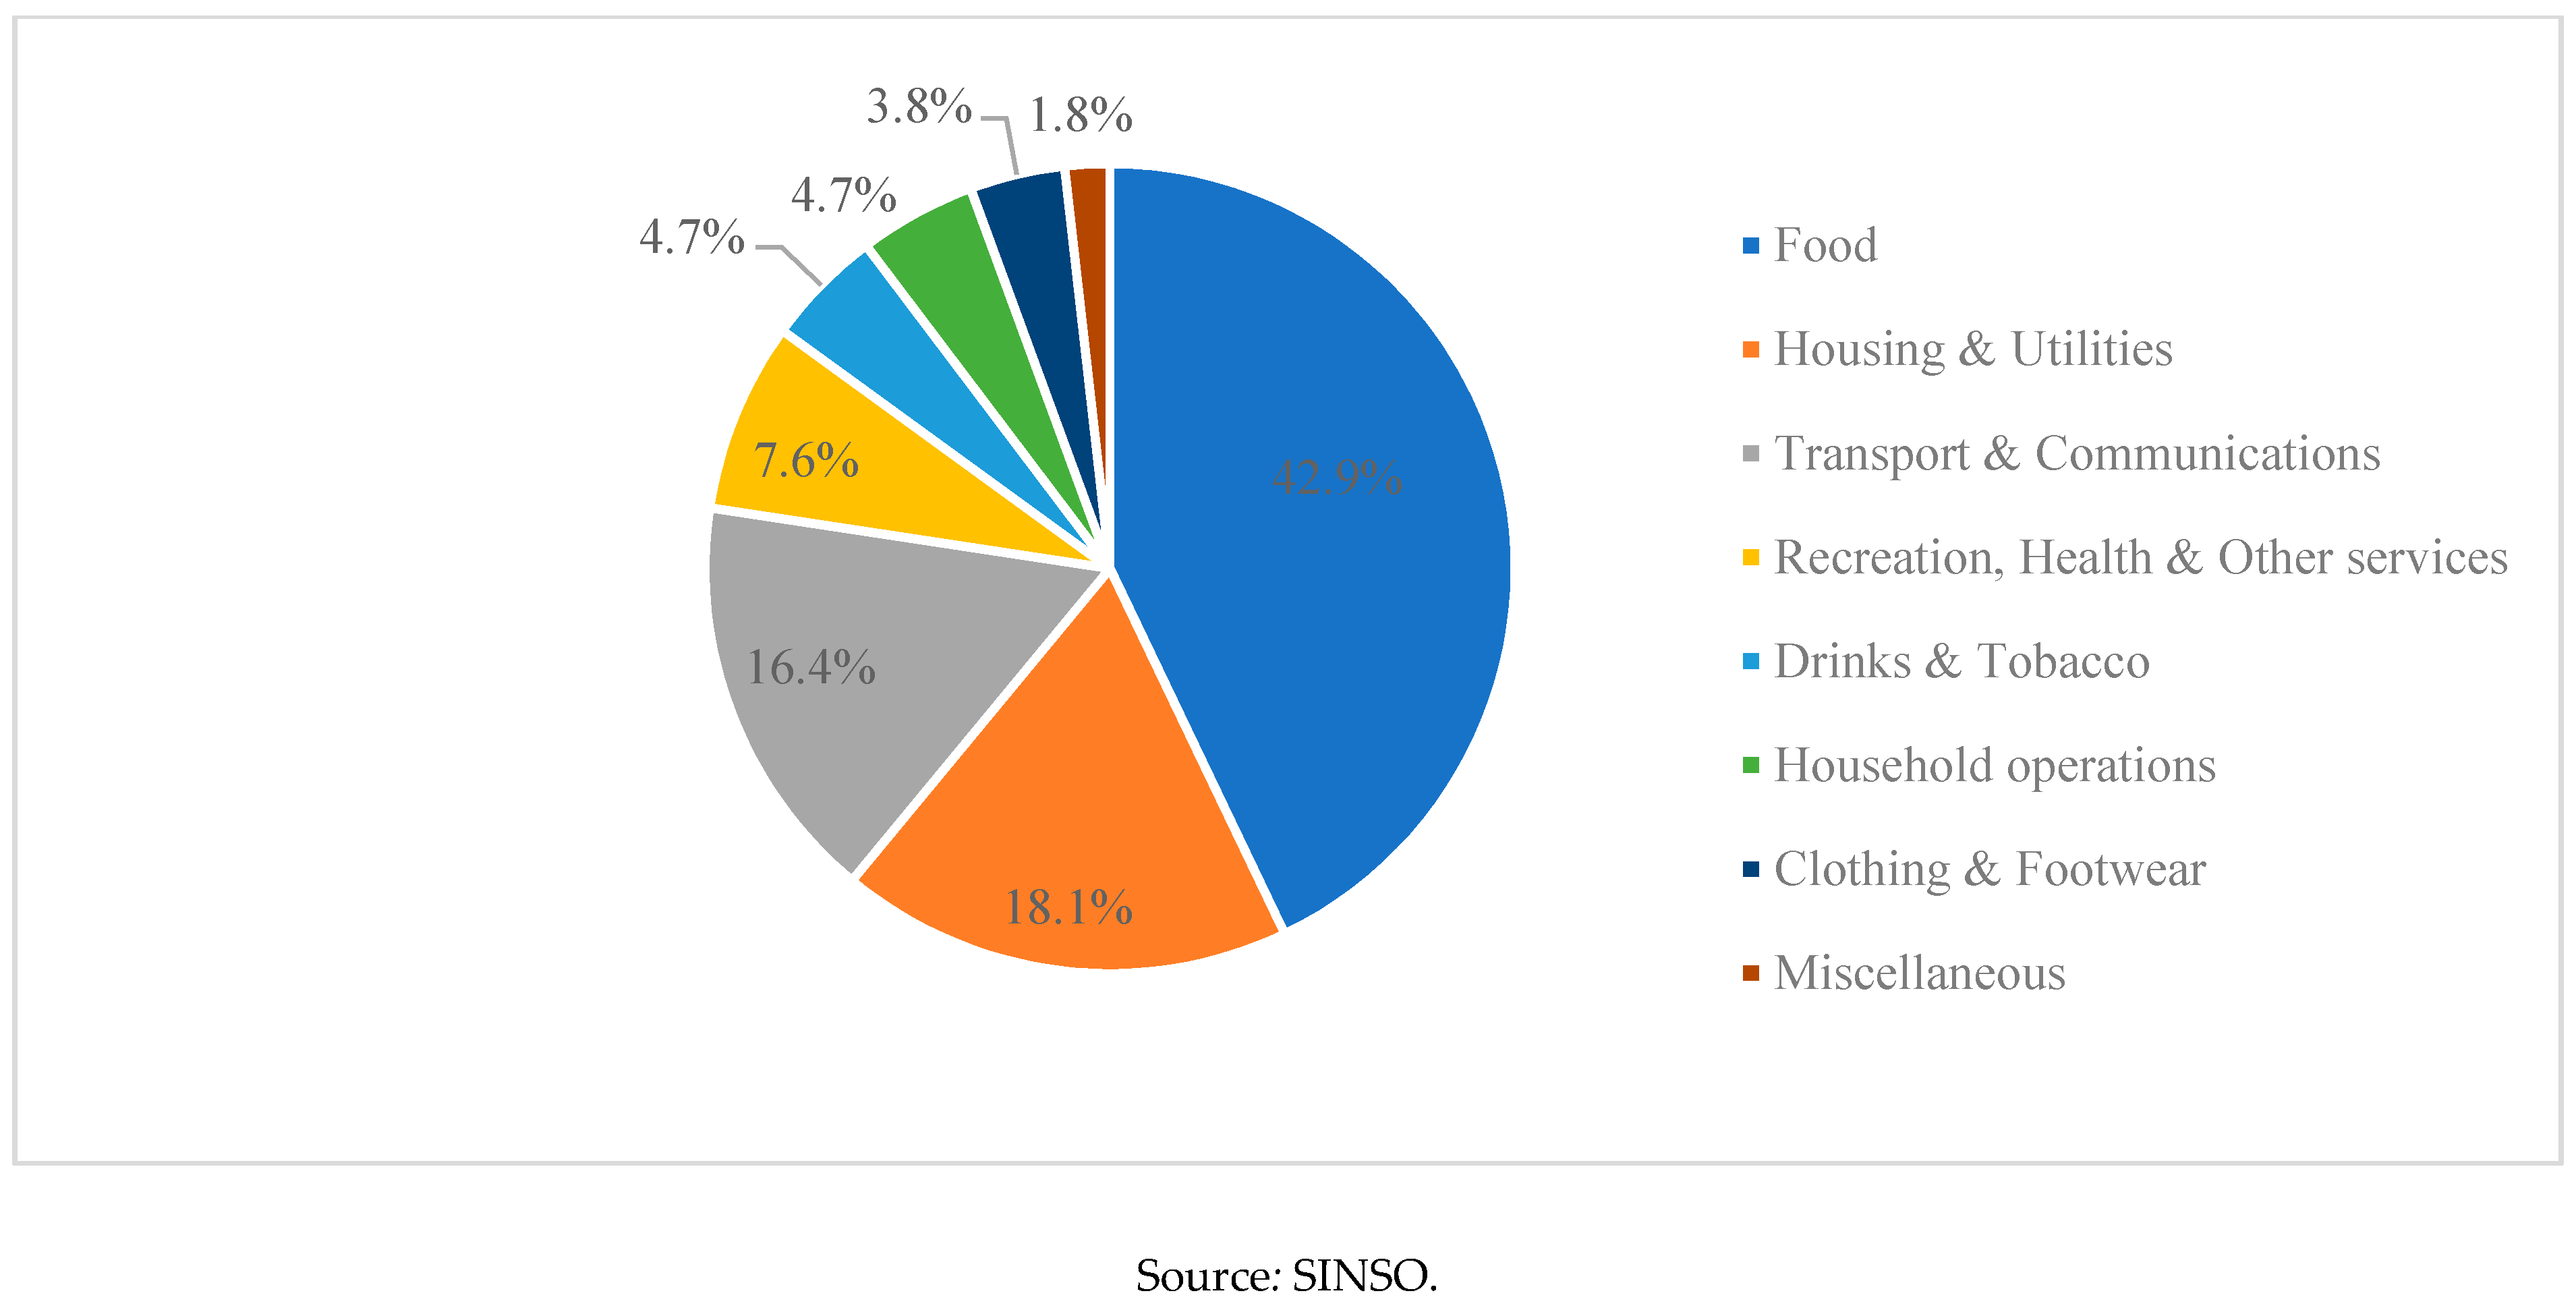
Headline inflation in Solomon Islands is currently measured on a monthly basis by the SINSO and is calculated based on a three-months moving average (3 mma). The HCPI Series 2 is used for this study, which consists of eight categories with food category accounting for the highest weight (42.9 per cent) followed by housing and utilities (18.1 per cent), transport and communication (16.4 per cent), recreation (7.6 per cent), drinks and tobacco (4.7 per cent), household operations (4.7 per cent), clothing and footwear (3.8 per cent) and miscellaneous (1.8 per cent) (see Figure 5)2. Similarly, most PICs have relatively high weights of food, transportation and housing utilities in their CPI baskets.
While the Central Bank’s primary objective is to maintain domestic price stability, there is no specific reference value or policy guideline, such as in the case of Australia (2–3 per cent), for managing the inflation rate. Nonetheless, there is a broad expectation that the inflation rate should be within 3–5 per cent.
Overall, economic growth have been low and volatile in the past decades reflecting the country’s vulnerability to external and internal shocks. While the country has made reasonable progress in terms of economic growth, socio-economic development challenges persist. Meanwhile, inflation has become relatively low in recent years; however, there still exists susceptibility to shocks on the domestic and external fronts. Thus, monitoring inflation developments is important for such a small island, vulnerable open economy and for achieving monetary policy’s primary objective of price stability.
3. Literature Review
3.1. HNKPC and the Small Open Economy: An Overview of the Theory
The HNKPC developed by Gali and Gertler (1999) has become a popular framework used in monetary policy analysis for estimating the short-run inflation dynamics. The model is an extension of the New Keynesian Phillips Curve (NKPC) model, which assumes a purely forward-looking inflation expectations and accounts for a backward-looking component for determining current inflation rates (Mavroeidis et al. 2014).
The HNKPC framework estimates the development of the inflationary process by relating current inflation rates to lagged inflation (backward-looking component), future inflation (forward-looking component) and an inflationary gap pressure such as marginal cost or output gap (Gali and Gertler 1999; Gali et al. 2005; Tomfort 2011). The results of Gali and Gertler (1999) provide empirical support for the forward-looking process as more dominant than the backward-looking behaviour in the formation of current inflation rates. However, Rudd and Whelan (2001) and Linde (2005) have raised criticism with respect to the model’s estimates as products of specification bias and that the results produced are non- robust. In response to these criticisms, Gali et al. (2005) have found robust evidence using estimation procedures including the GMM closed form and non-linear variables to confirm the initial findings of Gali and Gertler (1999).
The HNKPC has evolved in recent years to include an open economy version of the HNKPC model. Gali and Monacelli (2005) have designed a small open economy version of the HNKPC that assumes a small open economy that makes up the world economy. In this framework, an element of the open economy was included in the HNKPC model using an openness parameter namely terms of trade or an exchange rate variable.
3.2. HNKPC: The Empirical Studies
3.2.1. Geographical Coverage of Studies
Empirical studies that have applied the HNKPC to estimate inflation dynamics have mainly emerged from developed countries (Gali and Gertler 1999; Tomfort 2011; Dufour et al. 2005; Abbas et al. 2016) and emerging economies (Ishak-Kasim and Ahmed 2010; Mukhtar and Yousaf 2014; Meng 2016; Sakurai 2016; Salunkhe and Patnaik 2019). Moreover, a dearth of empirical studies exists in small island economies, especially in the case of PICs. Moreover, existing studies have found mixed results in terms of their relevance in explaining the inflation dynamics of the countries studied.
The initial work of Gali and Gertler (1999) have developed and estimated a structural model for the United States of America (USA). Their findings indicate that the HNKPC provides a good approximation to inflation dynamics of the USA. Similarly, Tomfort (2011) reaffirms empirical support for the use of the HNKPC in measuring the role of inflation expectations in the USA and Germany. Furthermore, Dufour et al. (2005) assess the empirical adequacy of the HNKPC in the case of USA and Canada by using two variants of the model, one using rational expectations assumptions and the other based on inflation expectations survey data. Although the framework is applicable for the USA, it does not provide empirical support for explaining Canada’s inflation dynamics, partly reflecting data compatibility issues with the Canadian data.
In emerging economies, a study by Sakurai (2016) examines the validity of the HNKPC in Thailand over two periods of large economic crisis namely in 1997 and 2009. The study provides empirical evidence for explaining the inflation dynamics of Thailand over the reviewed period. Moreover, a study by Mukhtar and Yousaf (2014) investigates whether the inflation dynamics in Pakistan can be explained by the NKPC and HNKPC models. Their findings confirmed the role of both models in explaining the inflationary process in Pakistan. Similarly, a study by Hervino (2015) provides evidence for the relevance of the HNKPC in explaining the inflationary process in Indonesia.
Furthermore, a study by Sediakgotla (2017) assesses the inflation dynamics in Bostwana and finds evidence of a HNKPC for Bostwana. Similary, a study by Leshoro and Kollamparambil (2016) examines whether a stable NKPC exists in South Africa by testing whether inflation expectations in South Africa is forward-looking or backward-looking. Their results confirmed an unstable NKPC for South Africa and the dominance of a forward-looking process over the backward-looking process in determining inflation. Similarly, Meng (2016) applies the HNKPC to assess the inflation process in Singapore. The study provides evidence for the HNKPC model in explaining Singapore’s inflationary process, which is critical for informing its monetary policy. Another study by Domic (2012) reviewed the inflation dynamics of Croatia by applying a variation of the HNKPC models and were found to be effective in modelling inflation dynamics in Croatia.
Other studies have applied various open economy related versions of the HNKPC for estimating inflation dynamics and have found mixed results. A study by Mihailov et al. (2011) analyses the inflation dynamics in the case of 10 OECD countries and employs the Gali and Monacelli (2005) model. The authors find empirical support for the role of the small open economy as measured by the significance of the terms of trade in explaining the inflation dynamics in the countries examined. Similarly, a small open economy NKPC model was applied for the Israeli economy and adequately explained the inflation dynamics of the Israeli economy under the inflation targeting regime from 1995–2006 (Binyamini 2007). Conversely, a study by Abbas et al. (2016) found that the inflation dynamics of Australia cannot be explained by the small open economy model by Gali and Monacelli (2005). This is due to various factors such as the invalid assumption of complete exchange rate pass through effect in the case of Australia as well as weak sampling uncertainty due to weak identification (Mavroeidis et al. 2014).
3.2.2. Elements of HNKPC
The conventional variables used to estimate a HNKPC model include forward-looking inflation expectations and lagged inflation values (Gali and Gertler 1999) largely derived from the survey or CPI data and an inflationary demand pressure variable gauged by a nominal marginal cost or output gap. Besides these conventional elements, the selection of variables used in the HNKPC model are dependant on data availability, its relevance to country context and significance of the variable in the model.
The measure for inflationary demand pressure varies considerably across the empirical studies reviewed. Most studies have used a marginal cost variable by following closely the work of Gali and Gertler (1999), Meng (2016) and Gali et al. (2005) due to the measurement uncertainties arising from the use of the output gap (Gali and Gertler 1999; Leith and Malley 2007) and in other cases the output gap variable does not perform well (Gali et al. 2005). Conversely, other studies (Sakurai 2016; Hervino 2015; Mukhtar and Yousaf 2014) have incorporated an output gap variable as an indicator for measuring the level of economic acitivity due to non-availability of the marginal cost data (Mukhtar and Yousaf 2014). Typically, Central Banks prefer the use of the output gap as a direct measure of inflationary pressure (Tomfort 2011). Moreover, some studies have incorporated both marginal cost and output gap in the HNKPC model to ascertain the variable that produces the more robust and meaningful results (Domic 2012; Maturu et al. 2006).
Furthermore, studies have extended the HNKPC model to account for domestic and external factors that may impact on inflation. Meng (2016) modelled inflation dynamics in Singapore by incorporating relative wage, labour share in GDP, aggregate output and terms of trade as an openness variable. The results revealed the significance of the labour share and aggregate output in the HNKPC model while the relative wage and terms of trade coefficients were statistically insignificant at the conventional level, although they obtained the correct signs and were economically significant. Moreover, Salunkhe and Patnaik (2019) analysed the inflation dynamics in India by including the REER and international crude oil price inflation to account for supply shocks originating from the external sector. The authors have found that both variables have a modest impact on India’s inflation. Additionally, other studies have included dummy variables to capture certain events that have induced a spike or decline in inflation such as country specific crisis (Sakurai 2016) or external shocks; namely, oil price and the GFC (Hervino 2015; Leshoro and Kollamparambil 2016).
3.2.3. Inflation Dynamics: Is It a Forward-Looking or Backward-Looking Process?
The HNKPC is primarily used to ascertain the role of inflation expectations in the inflation development process, whether inflation dynamics is predominately a forward-looking or backward-looking process. This information is important for Central Banks in forecasting inflation rates and providing insights into the appropriate inflation regime for the country (Cunningham et al. 2010). The forward-looking behaviour is largely associated with well anchored inflation expectations for which countries have adopted an inflation targetting regime. Meanwhile, countries with high inflation persistence are known to form inflation expectations in a backward-looking manner.
Several studies have established a more dominant forward-looking inflation expectations in the inflationary process (Gali and Gertler 1999; Gali et al. 2005; Hervino 2015; Meng 2016 and Sakurai 2016). Building on from the earlier work of Gali and Gertler (1999), Hervino (2015) also confirmed the prominence of the forward-looking component in explaining the inflation dynamics in Indonesia over the backward-looking component. Similarly, in Singapore, although both forward-looking and backward-looking behaviours were important in Singapore’s inflationary process, forward-looking expectations was more influential using the GMM model (Meng 2016). Moreover, Sakurai (2016) establishes a more dominant forward-looking behaviour when estimating a HNKPC for Thailand over the period 2009Q2–2014Q4. The author uses quarterly data namely GDP deflator as CPI is not readily available and the output gap as well as capturing two large crisis in Thailand in 1997 and 2008 to estimate the Phillips Curve.
Conversely, other studies have found a more influential backward-looking process in determining current inflation rates (Linde 2005; Tomfort 2011; Mukhtar and Yousaf 2014; and Sediakgotla 2017). Mukhtar and Yousaf (2014) found a more quantitatively significant lagged inflation over the forward-looking term, implying that the price setting behaviour in Pakistan is largely backward-looking. Sediakgotla (2017) also found that the inflation process in Bostwana revealed a larger inflation persistence marked by a significantly larger backward-looking coefficient than the forward-looking coefficient. In line with these findings, Tomfort (2011) considers the impact of inflation expectations on the development of inflationary process in the US and Germany. The results by Tomfort (2011) show for longer time horizon of more than three years, past inflation rates were more important than forward-looking expectations as economic agents tend to anchor inflation expectations on past experiences due to increasing uncertainty.
4. Methodology, Model Specification and Data
4.1. The Methodology
From the review of literature, determining the role of inflation expectations in Solomon Islands will be formulated and tested with econometric analysis. Most studies have applied the HNKPC model in modelling inflation dynamics. We follow closely the extended HNKPC model proposed by Meng (2016), Sediakgotla (2017) and Salunkhe and Patnaik (2019). These studies have incorporated economic variables that to some extent are suitable and available for describing the inflationary development process in the Solomon Islands. Moreover, the HNKPC has the ability to examine the relative quantitative importance of the backward and forward looking components in determining inflation dynamics in Solomon Islands.
Relating to the role of inflation expectations is the unbiased expectations theory, which has usually been useful in guiding monetary policy decsions, particulary in determining expected inflation rates. However, for this study, the assumption of unbiased expectations was not evaluated primarly due to the country’s rudimentary financial markets, with no active bond trading and not so well defined transmission channels in the domestic financial markets. Hence, further research may be required to establish the relevance of the umbiased expectations theory in the case of Solomon Islands.
This study applies GMM estimation methods to estimate the HNKPC model due to its ability to correct for autocorrelation of the residuals in the OLS estimation and to addresss the problem of endogeneity3. Sediakgotla (2017) points out that the GMM estimation technique is well known for its advantage of correcting unknown forms of autocorrelation and heteroscedasticity as well for being relatively simple and easy to interpret.
Moreover, the GMM has been a popular methodology used in the estimation of the NKPC and HNKPC models initially used by Gali and Gertler (1999) and subsequently in other studies by Gali and Monacelli (2005), Gali et al. (2005), Hervino (2015), Meng (2016), Sakurai (2016), Sediakgotla (2017) and Salunkhe and Patnaik (2019). The GMM proposed by Hansen (1982) is a more preferred estimation method compared to its alternative as it is relatively simple to use given its computation simplicity whereby specifiying the full data generating process for the forcing variable is not required and second for its robustness in correcting mispecifications (Mavroeidis et al. 2014). Conversely, Binyamini (2007) points out the drawback of this estimation method is the choice of instrument variables and the poor sampling properties of the GMM method. Similarly, Linde (2005) who utilises the Full Information Maximum Likelihood also rejects Gali and Gertler’s (1999) estimation approach using the GMM and its findings in favour of a forward-looking NKPC. In reponse to these claims, Gali et al. (2005) finds that the conclusions of Gali and Gertler (1999) and others regarding the importance of forward-looking behaviour remain robust under various estimation procedures.
Furthermore, the GMM estimation is conditioned on a set of instrumental variables, which requires the orthogonality conditions to be met. In order to determine the GMM estimates, the moment conditions are set in orthogonality conditions between the residual of the regression in equation (εt) and a set of instrumental variables (). The instrumental variable are variables that are influential to inflation. In Equation (1), the instrumental variables ( used in this model are four lags of headline inflation, imported food index and REER and three three lags of fuel and reserve money. The constant is also included as an instrument to restrict the model errors in the equation to have a zero mean.
In estimating the HNKPC model using the GMM methodology, various diagnostic tests were applied to test the robustness of the model. The normality test was used to determine whether the residuals were normally distributed while the Q-statistic test was used to test for serial correlation in the residuals. Additionally, the Hansen’s J-statistc tests was conduced to test whether the excluded instrument variables are independent of the error process. The J-statistics implies that the null hypohesis of the over-identifying restrictions in the GMM estimation are valid (Hansen 1992).
4.2. Model Specification
The HNKPC model is specified as follows:
In Equation (1), <. The HNKPC model (1) states that inflation at time t depends on past inflation ( and expected inflation ; fuel prices proxied by tapis oil prices ; the Real Effective Exchange Rate ; reserve money ; the output gap of the economy and a dummy ( for 2014Q2. The dummy accounts for the spike in inflation due to supply side shocks emanating from the April 2014 Flash floods, which led to a surge in domestic inflation and overall increase in headline inflation.
The HNKPC model adopted for this study is modified to capture imported inflation through the REER. The output gap is used as marginal cost is not available for Solomon Islands. The output gap measures the deviation of actual output from potential output in per cent of potential. The potential output was generated through the Hodrick-Prescott (HP) filter method. When the output gap is zero, there is neither upward nor downward pressure on inflation. When output gap is positive, there is an upward pressure on inflation while the opposite is true when there is a negative output gap.
A positive relationship is expected between the fuel and inflation as fuel is an imported item in the Solomon Islands and adds to the cost of production in productive sectors. Likewise, reserve money is expected to have a positive correlation with the dependent variable. Meanwhile, a negative relationship is expected between inflation and REER since an appreciation of the Solomon Islands dollar would imply cheaper imported goods, which leads to lower inflation on imported items. Similarly, a depreciation of the Solomon Islands dollar would imply an increase in cost of imported goods and therefore an increase in inflation4. Table 3 details the expected coefficient signs of the variables used in the HNKPC model.
4.3. Data
Estimation of the HNKPC model is based on quarterly data spanning from 2003Q1 to 2017Q4. Data coverage were dictated by the non-availability of some variables in prior periods. The variables used in the study are headline inflation rate (Inf), which measures the price movement under the 3 mma measure, REER, fuel prices using the the tapis oil prices (Fl), reserve money (M0); output gap (OG) and a dummy variable for 2014Q2 reflecting supply side shock causing spike in the headline inflation rate (Dum_2014Q2). The output gap is calculated using the HP filter techniques and the use of chow-lin disaggregation procedure. In determining the output gap, quarterly GDP was generated using the imported food index reflecting several imported food items such as wheat, flour, sugar, beef and chicken prices. Expected inflation in this study is proxied by one period ahead of headline inflation due to the non-availability of time-series data particularly from business surveys (Mukhtar and Yousaf 2014; Sediakgotla 2017).
All data are available in quarterly frequency except for GDP which is compiled on an annual basis and disaggregated using methodologies of Chow and Lin (1971) and Fernandez (1981) to convert the annual GDP series to a quarterly series. Although GDP is not included in the model, it is used in computing the output gap. Both GDP and headline inflation are sourced from SINSO. Meanwhile, the REER, food price index and fuel prices are sourced from the IMF’s International Financial Statistics (IFS), World Bank and Bloomberg respectively.
5. Empirical Results
5.1. Unit Root Tests
This section assesses the time series properties of inflation and its explanatory variables. In determining the order of intergration, the Augmented Dickey Fuller (ADF) (Dickey and Fuller 1979, 1981) and Phillips–Perron (Phillips and Perron 1988) test for the null hypothesis of a unit root were conducted. In conducting the unit root test, all variables were checked with only intercept. The null and the alternative hypotheses for a unit root in are: H0: α = 0 and H1: α < 0. To select the lag length (k), we use the ‘t-sig’ approach proposed by Hall (1994).
Both the ADF and Phillips–Perron tests showed that the inflation rate and output gap are stationary variable or I (0), while the rest of the explanatory variables are non-stationary variables or are integrated of order one I (1) (see Table 4).
The inflation rate and output gap are stationary at the levels, implying a much smoother path in comparision to month-on-month price movement as the headline inflation is used in monetary policy considerations. The rest of the variables are therefore converted to first differenced form to induce stationarity, implying non-stationary data or I (1) variables.
5.2. HNKPC Model
The results of the HNKPC estimation are two-fold. Apart from establishing whether a short-run trade-off between inflation and output exists, this study also establishes the combined influence of backward and forward-looking behaviour in influencing inflation as depicted by the model results (see Table 5).
The model specification showed that both the backward and forward-looking components appeared to have statistically significant coefficients. The backward-looking component is estimated at 0.70, indicating a high level of inflation persistence compared to the forward-looking component of 0.30. This implies that when forming inflation expectations, economic agents are more backward-looking than forward looking in Solomon Islands. These results are consistent with the findings of Tomfort (2011), Sediakgotla (2017), Rasaki (2017) and Salunkhe and Patnaik (2019) who conclude that the backward-looking inflation behaviour is a dominant factor in explaining current inflation. Accordingly, Tomfort (2011) points out that when forming expectations, economic agents tend to base their decisions largely on past experiences or previous information than on forward-looking expectations due to uncertainty and the absence of concrete information for the future.
Similarly, the output gap for Solomon Islands is highly significant with positive coefficient implying the importance of aggregate demand in the inflation process. Fuel prices also have a positive relationship with inflation at the 5 per cent confidence level and positively related to inflation. Solomon Islands is highly dependent on imported fuel; therefore, fuel is an important indicator of inflation movements. On the other hand, reserve money is negatively related to inflation and insignificant. These results could be explained by the weak transmission mechanism in the money aggregates in affecting inflation as other channels may have played a dominant role.
Moreover, the REER yields contradicting results to literature by showing a positive sign under the GMM model. In the case of Solomon Islands, an appreciation of the REER does not translate directly into a fall in inflation, instead inflation still remains high. This could be ascribed to structural issues akin to the small island economy, such as the high cost of doing business in the country. According to Paul and Motlaleng (2008), nominal exchange rate changes may not pass through to domestic prices. Paul et al. (2017) confirmed that this finding is in line with the work of Paul and Motlaleng (2008) who found that the lack of competition in Bostwana’s wholesale sector allows importers to take advantage of the currency appreciation in their profit margins whilst only passing the negative impact of depreciation to consumers. Furthermore, these results highlight areas for future research namely into probing the exchange rate pass through effect in the Solomon Islands and the need to calculate its own REER index to verify the results obtained.
Meanwhile, the dummy variable representing the 2014 April Flash floods has a positive and significant impact on current inflation indicating that domestically sourced supply side shocks have a profound impact on inflationary pressures in the country as opposed to external shocks such as the GFC.
An evaluation of the results of diagnostic tests indicates that the residuals are normally distributed and are not serially correlated. The J-test of over-identifying restrictions is not rejected thus indicating that the model is correctly specified.
6. Conclusions and Policy Implications
Modelling the HNKPC is important as it contains information about adaptive and rational expectations which are crucial for policy analysis. Expected inflation and past inflation plays a significant role in determining the current inflation and therefore it is important for the Central Bank to incorporate these dynamics into the inflation forecasting model for Solomon Islands. This study estimated the HNKPC model for Solomon Islands using quarterly time series data for the period 2003–2017 by applying the generalised GMM estimation methods.
The results obtained confirmed that the HNKPC does exist for Solomon Islands and is relevant for modelling inflation dynamics in the country. While our findings indicate that economic agents in Solomon Islands are both rational and adaptive in predicting inflation, there is evidence of inflation persistence in the inflation process as demonstrated by a more significant backward-looking behaviour. The results are consistent with the findings by Tomfort (2011), Mukhtar and Yousaf (2014), Sediakgotla (2017) and Rasaki (2017), although contrary to the findings of Hervino (2015), Leshoro and Kollamparambil (2016), Meng (2016), Sakurai (2016) and Salunkhe and Patnaik (2019) who conclude that the forward-looking component was more dominant in determining current inflation.
Furthermore, the output gap, which captured demand shocks in the economy also proved to be a significant determinant of inflation in the country. This is in line with literature and empirical studies by Mukhtar and Yousaf (2014), Sediakgotla (2017), Salunkhe and Patnaik (2019). Similarly fuel prices also had a positive impact on current inflation as in the case of Salunkhe and Patnaik (2019). The dummy variable reflecting the major domestic supply side shock in 2014Q2 also had a profound impact on inflation. On the contrary the REER revealed divergent results to literature and empirical studies by Rasaki (2017) and Salunkhe and Patnaik (2019). This result can be ascribed to structural issues akin to the Solomon Islands economy, whereby Paul and Motlaleng (2008) notes nominal exchange rate changes may not pass through to domestic prices. Meanwhile, the reserve money indicator does not have a significant influence on inflation in the Solomon Islands and could be attested to the weak monetary transmission channel in the country.
Overall, the findings of this study are two-fold. The study provides empirical basis for monetary policy framework in the Solomon Islands and are useful for guiding monetary policy decisions. Secondly, the empirical results confirm the significance of the output gap and fuel prices in the inflationary process as opposed to the monetary and exchange rate variables used in this study. Therefore, these findings imply that in pursuit of price stability, it is necessary to monitor global fuel prices and domestic output developments in order to ascertain their influence on inflation. Furthermore, it highlights areas to further investigate the weak monetary transmission mechanism and to examine the exchange rate pass through effect onto domestic prices. This is critical in disentangling how best the Central Bank can perform its monetary policy under the current regime in achieving its mandatory role of price stability.
This study is constrained by data limitations. Particularly, this study includes unobserved variables which has been difficult to gauge as such as inflation expectations in the absence of surveys and bond yield curves thus, we have resorted to using actual inflation. Also, unlike in developed countries, there is a lack of readily available economic data such as import price index, unemployment rate and marginal cost data that could be used in enhancing the HNKPC model for Solomon Islands. Moreover, the availability of consistently longer time series data is a challenge coupled with the rebasing of the country’s CPI series on several occasions, hence we have a shorter time series. Given the differing results to literature as obtained in the exchange rate variable for Solomon Islands, a useful extension of this paper for future researchers would be to consider constructing Solomon Islands own REER index in order to re-estimate the HNKPC in order to verify the results obtained.
Author Contributions
Conceptualization of the paper by A.B.R. and P.S.; Methodology by A.B.R.; Software application by A.B.R.; Validation of results and text A.B.R.; Formal analysis by A.B.R.; Investigation by A.B.R.; Resources by A.B.R.; Data curation by A.B.R.; Writing—Original draft preparation by A.B.R.; Writing—Review and editing by P.S.; Visualization by A.B.R. P.S.; Supervision by P.S.; Project administration by P.S. All authors have read and agreed to the published version of the manuscript.
Funding
This research received no external funding.
Data Availability Statement
All data used is sourced from publicly available sites, including the following: https://www.cbsi.com.sb/statistics/, accessed on 10 July 2021; Solomon Islands National Statistics Office (SINSO). 2020. National Consumer Price Index: Statistical Bulletin July 2020. Honiara; The World Bank. 2020. World Development Indicators. Washington, DC: The World Bank.
Acknowledgments
The Authors acknowledge the Governor and technical staff of Central Bank of Solomon Islands and team from the Griffith University for the administrative, technical and other support in making it possible for the collaboration between both institutions, in one of the many working papers to be published jointly. Especially, Tarlok Singh’s mentoring and guidance is highly appreciated.
Conflicts of Interest
The authors declare no conflict of interest.
Appendix A

Table A1.
Descriptive Statistics.
| INF | FUEL | M0 | REER | OG | |
|---|---|---|---|---|---|
| Mean | 6.255000 | 76.36833 | 1192.822 | 121.7032 | −0.000200 |
| Median | 6.050000 | 70.50000 | 1026.600 | 117.7500 | 0.001000 |
| Maximum | 23.50000 | 133.7000 | 2777.200 | 154.7000 | 0.044000 |
| Minimum | −4.800000 | 27.30000 | 168.4000 | 95.30000 | −0.043000 |
| Std.Dev. | 5.440383 | 30.89719 | 835.6854 | 19.44875 | 0.019457 |
| Observations | 60 | 60 | 60 | 60 | 60 |
Table A2.
Correlation Matrix.
| INF | FUEL | M0 | REER | OG | |
|---|---|---|---|---|---|
| INF | 1.0000 | 0.1186 | −0.6142 | −0.4451 | 0.2139 |
| FUEL | 0.1186 | 1.0000 | 0.2315 | 0.0888 | 0.2994 |
| M0 | −0.6142 | 0.2315 | 1.0000 | 0.8928 | 0.0899 |
| REER | −0.4451 | 0.0888 | 0.8928 | 1.0000 | −0.0641 |
| OG | 0.2139 | 0.2994 | 0.0899 | −0.0641 | 1.0000 |
Table A3.
OLS estimates and diagnostic test results.
| Dependent Variable: Headline Inflation Rate | |
|---|---|
| Independent Variable | OLS Estimates |
| C | −0.0424 |
| (0.8968) | |
| 0.6019 *** | |
| (0.0000) | |
| 0.4058 *** | |
| (0.0000) | |
| D_Fl | 0.0031 |
| (0.8966) | |
| D_M0 | −0.0035 |
| (0.1839) | |
| D_REER | 0.0610 |
| (0.4479) | |
| OG | 41.0775 *** |
| (0.0038) | |
| Dum_2014Q2 | 3.5091 *** |
| (0.0000) | |
| R2 | 0.9034 |
| F-statistics | 66.8306 |
| DW | 2.7605 |
| Jacque-Bera | 0.3496 (0.8396) |
| Serial Correlation LM Test (Breusch-Godfrey) | 9.2728 (0.0004) |
| Heteroscedasticity (Breusch-Godfrey F-statistic) | 1.6402 (0.1459) |
| Observation | 58 |
Notes: Figures in parentheses are the p-values. *** Indicates levels of statistical significance at the 1%. Normality test (Jacque-Bera) for residuals indicate that the residuals are normally distributed. The heteroscedasticity results fail to reject the null indicating the errors have a constant variance. However, the Serial Correlation LM test rejects the null hypothesis of no serial correlation and that there is serial correlation in the model. D refers to first difference given variables are not stationary at their levels.
| 1 | The HCPI Series 3 used a new base year of (2013 Q4 = 100) and an index reference period of 2017 = 100 from a base year of (2005Q4 = 100) in HCPI Series 2. |
| 2 | The HCPI Series 2 is used for this study due to the lack of longer time series data in the latest National CPI. Also, since Honiara accounts for a greater proportion (88.1 per cent) of the National CPI, any price movements in Honiara have a larger impact on inflation outcomes in the country. |
| 3 | We do, however, provide OLS results as well in the Appendix A. |
| 4 | Based on the IMF’s IFS, an increase in REER implies that exports become more expensive, and imports become cheaper. |
References
- Abbas, Syed Kanwar, Prasad Bhattacharya, Debdulal Mallick, and Pasquale Michael Sgro. 2016. The New Keynesian Phillips Curve in a small open economy: Empirical evidence from Australia. Economic Record 92: 409–34. [Google Scholar] [CrossRef]
- Binyamini, Alon. 2007. Small open economy New Keynesian Phillips Curve: Derivation and application to Israel. Israel Economic Review 5: 67–92. [Google Scholar]
- Central Bank of Solomon Islands (CBSI). 1988. Seminar on Inflation: Causes, Effects, Remedies. Honiara: Central Bank of Solomon Islands. [Google Scholar]
- Central Bank of Solomon Islands (CBSI). 2007. Quarterly Review September 2007. Honiara: Central Bank of Solomon Islands. [Google Scholar]
- Central Bank of Solomon Islands (CBSI). 2011. CBSI Annual Report 2011. Honiara: Central Bank of Solomon. [Google Scholar]
- Central Bank of Solomon Islands (CBSI). 2018a. Quarterly Review December 2018. Honiara: Central Bank of Solomon. [Google Scholar]
- Central Bank of Solomon Islands (CBSI). 2018b. Quarterly Review December 2019. Honiara: Central Bank of Solomon. [Google Scholar]
- Central Bank of Solomon Islands (CBSI). 2018c. Historical GDP data from CBSI Real Sector Archives. Honiara: Central Bank of Solomon. [Google Scholar]
- Central Bank of Solomon Islands (CBSI). 2020a. Key Statistics: Inflation Rate Data 2004–April 2018. Honiara: Central Bank of Solomon. [Google Scholar]
- Central Bank of Solomon Islands (CBSI). 2020b. Key Statistics: Inflation Rate Data 2004–August 2017. Honiara: Central Bank of Solomon. [Google Scholar]
- Chow, Gregory C., and An-loh Lin. 1971. Best linear unbiased interpolation, distribution and extrapolation of time series by related series. The Review of Economics and Statistics 53: 372–75. [Google Scholar] [CrossRef]
- Cunningham, Rose, Brigitte Desroches, and Eric Santor. 2010. Inflation expectations and conduct of monetary policy: A review of recent evidence and experience. Bank of Canada Review 2010: 13–25. [Google Scholar]
- Dickey, David A., and Wayne A. Fuller. 1979. Distribution of the estimators for autogregressive time series with a unit root. Journal of the Americal Statistical Association 74: 427–31. [Google Scholar]
- Dickey, David A., and Wayne A. Fuller. 1981. Likelihood ratio statistics for autoregressive time series with a unit root. Econometrica 49: 1057–72. [Google Scholar] [CrossRef]
- Domic, Alan. 2012. An application of New Keynesian models to inflation in Croatia. Business Systems Research 3: 6–13. [Google Scholar] [CrossRef] [Green Version]
- Dorich, José. 2009. Forward-Looking versus Backward-Looking Behaviour in Inflation Dynamics: A New Test. Working Paper No. 1020. 2010 Meeting Papers from Society for Economic Dynamics. Ottawa: Bank of Canada. [Google Scholar]
- Dufour, Jean-Marie, Lynda Khalaf, and Maral Kichian. 2005. Inflation Dynamics and the New Keynesian Phillips Curve: An Identification-Robust Econometric Analysis. Working Paper No. 2005–2027. Ottawa: Bank of Canada. [Google Scholar]
- Fernandez, Roque B. 1981. A methodological note on the estimation of time series. The Review of Economics and Statistics 63: 471–76. [Google Scholar] [CrossRef]
- Gali, Jordi, and Mark Gertler. 1999. Inflation dynamics: A structural econometric analysis. Journal of Monetary Economics 44: 195–222. [Google Scholar] [CrossRef] [Green Version]
- Gali, Jordi, and Tommaso Monacelli. 2005. Monetary policy and exchange rate volatility in a small open economy. Review of Economic Studies 72: 707–34. [Google Scholar] [CrossRef]
- Gali, Jordi, Mark Gertler, and J. David Lo’pez-Salido. 2005. Robustness of the estimtates of the hybrid New Keynesian Phillips Curve. Journal of Monetary Economics 52: 1107–18. [Google Scholar] [CrossRef] [Green Version]
- Hall, Alastair. 1994. Testing for a unit root in time series with pretest data based model. Journal of Business and Economic Statistics 12: 461–70. [Google Scholar]
- Hansen, Bruce E. 1992. Testing for parameter instabilities in linear models. Journal of Policy Modeling 14: 517–33. [Google Scholar] [CrossRef]
- Hansen, Lars Peter. 1982. Large sample properties of generalized method of moments estimators. Econometrica 50: 357–84. [Google Scholar] [CrossRef]
- Hervino, Aloysius Deno. 2015. A hybrid model of New Keynesian Phillips Curve: An application in Indonesia. Journal of Economics, Business, and Accountancy Ventura 18: 311–16. [Google Scholar] [CrossRef] [Green Version]
- Ishak-Kasim, Syurkani, and Abdullahi D. Ahmed. 2010. Inflation expectations and rationality: Evidence from Indonesian survey data. Economics and Finance in Indonesia 57: 255–75. [Google Scholar]
- Leith, Campbell, and Jim Malley. 2007. Estimated open economy New Keynesian Phillips Curves for the G7. Open Economies Review 18: 405–26. [Google Scholar] [CrossRef] [Green Version]
- Leshoro, Temitope, and Umakrishnan Kollamparambil. 2016. Inflation or output targeting? Monetary policy appropriateness in South Africa. PSL Quarterly Review 69: 77–104. [Google Scholar]
- Linde, Jesper. 2005. Estimating New-Keynesian Phillips: A full information maximum likelihood approach. Journal of Monetary Economics 52: 1135–49. [Google Scholar] [CrossRef] [Green Version]
- MacKinnon, James G. 1996. Numerical Distribution Functions for Unit Root and Cointegration Tests. Journal of Applied Econometrics 11: 601–18. [Google Scholar] [CrossRef] [Green Version]
- Maturu, Benjamin, Kethi Kisinguh, and Isaya Maana. 2006. A New Keynesian Phillips Curve for Kenya. Paper presented at the African Econometric Society, Cape Town, South Africa, July 4–6. [Google Scholar]
- Mavroeidis, Sophocles, Mikkel Moller-Plagborg, and James H Stock. 2014. Empirical evidence on inflation expectations in the New Keynesian Phillips Curve. Journal of Economic Literature 5: 124–88. [Google Scholar] [CrossRef]
- Meng, Choy Keen. 2016. The inflation process and expectations in Singapore. In Inflation Mechanisms, Expectations, and Monetary Policy. Edited by Bank of International Settlements. Basel: Bank of International Settlements, pp. 335–43. [Google Scholar]
- Mihailov, Alexander, Fabio Rumler, and Johann Scharler. 2011. The small open-economy New Keynesian Phillips Curve: Empirical evidence and implied inflation dynamics. Open Economies Review 22: 317–37. [Google Scholar] [CrossRef] [Green Version]
- Mukhtar, Tahir, and Abida Yousaf. 2014. Inflation dynamics and New Keynesian Phillips Curve: A reassessment for Pakistan. Journal of Business & Economics 6: 177–202. [Google Scholar]
- Paul, Muthucattu Thomas, James D. Kimata, and M. G. M. Khan. 2017. Purchasing power parity theory and applications for Solomon Islands. Journal of Economics and Public Finance 3: 507–30. [Google Scholar] [CrossRef] [Green Version]
- Paul, M. Thomas, and Gaotlhobogwe Motlaleng. 2008. The Pula-Dollar exchange rate and the purchasing power parity in Bostwana. Journal of Developing Areas 41: 205–31. [Google Scholar] [CrossRef]
- Phillips, Peter C. B., and Pierre Perron. 1988. Testing for a unit root in time series regression. Biometrika 75: 335–46. [Google Scholar] [CrossRef]
- Rasaki, Mutiu Gbade. 2017. An Estimated New Keynesian Philips Curve for Nigeria. Acta Universitatis Danubius. Œconomica 13: 203–11. [Google Scholar]
- Rudd, Jeremy, and Karl Whelan. 2001. New Tests of the New-Keynesian Phillips Curve; Washington, DC: Federal Reserve Board.
- Sakurai, Hiroaki. 2016. The New Keynesian Phillips Curve in Thailand through two financial crisis. Asia Economic and Financial Review 6: 90–195. [Google Scholar]
- Salunkhe, Bhavesh, and Anuradha Patnaik. 2019. Inflation dynamics and monetary policy in India: A New Keynesian Phillips Curve perspective. South Asian Journal of Macroeconomics and Public Finance 8: 144–79. [Google Scholar] [CrossRef]
- Sediakgotla, Lizzy K. 2017. The short-run dynamics of inflation: Estimating the Hybrid New Phillips Curve for Bostwana. Research Bulletin 30: 15–22. [Google Scholar]
- Solomon Islands National Statistics Office (SINSO). 2020a. National Consumer Price Index: Statistical Bulletin July 2020. Honiara: SINSO. [Google Scholar]
- Solomon Islands National Statistics Office (SINSO). 2020b. Gross Domestic Product 2003–2017 (Rebasing to 2012 Base Year). Honiara: SINSO. [Google Scholar]
- The World Bank. 2020. World Development Indicators. Washington, DC: The World Bank. [Google Scholar]
- Tomfort, Andre. 2011. The role of inflation expectations. International Journal on GSTF Business Review 1: 221–26. [Google Scholar]
- United Nations Development Programme—UNDP. 2019. Human Development Indices and Indicators: 2019 Statistical Update. Washington: Communications Development Incorporated. [Google Scholar]
- WorldData.info. 2020a. Development of the Inflation Rates on the Fijis. Available online: https://www.worlddata.info/oceania/fiji/inflation-rates.php (accessed on 10 July 2021).
- WorldData.info. 2020b. Development of the Inflation Rates in Vanuatu. Available online: https://www.worlddata.info/oceania/vanuatu/inflation-rates.php (accessed on 10 July 2021).
- WorldData.info. 2020c. Development of the Inflation Rates in Papua New Guinea. Available online: https://www.worlddata.info/oceania/papua-new-guinea/inflation-rates.php (accessed on 10 July 2021).
- WorldData.info. 2020d. Development of the Inflation Rates in Tonga. Available online: https://www.worlddata.info/oceania/tonga/inflation-rates.php (accessed on 10 July 2021).
- WorldData.info. 2020e. Development of the Inflation Rates in Samoa. Available online: https://www.worlddata.info/oceania/samoa/inflation-rates.php (accessed on 10 July 2021).
- WorldData.info. 2020f. Development of the Inflation Rates on the Solomon Islands. Available online: https://www.worlddata.info/oceania/solomon-islands/inflation-rates.php (accessed on 10 July 2021).
Figure 1.
Solomon Islands economic growth rate, 1972–2019. Data from Central Bank of Solomon Islands (CBSI 2018a, 2018b, 2018c) and Solomon Islands National Statistics Office (SINSO 2020b).
Figure 1.
Solomon Islands economic growth rate, 1972–2019. Data from Central Bank of Solomon Islands (CBSI 2018a, 2018b, 2018c) and Solomon Islands National Statistics Office (SINSO 2020b).

Figure 2.
Annual rates of inflation in PICs, 1997–2018. Data from WorldData.info. (WorldData.info 2020a, 2020b, 2020c, 2020d, 2020e, 2020f).

Figure 3.
Annual headline inflation rate in Solomon Islands, 1979–2018. Data from WorldData.info. (WorldData.info 2020f).
Figure 3.
Annual headline inflation rate in Solomon Islands, 1979–2018. Data from WorldData.info. (WorldData.info 2020f).

Figure 4.
Headline, imported and domestic inflation rates in Solomon Islands, 2004Q1–2019Q4. Data from Central Bank of Solomon Islands (CBSI 2020a).
Figure 4.
Headline, imported and domestic inflation rates in Solomon Islands, 2004Q1–2019Q4. Data from Central Bank of Solomon Islands (CBSI 2020a).

Figure 5.
HCPI Series 2 (2005 Q4) categories & weights. Data from Central Bank of Solomon Islands (CBSI 2020b).
Figure 5.
HCPI Series 2 (2005 Q4) categories & weights. Data from Central Bank of Solomon Islands (CBSI 2020b).

Table 1.
Economic development indicators.
| Country | GDP per Capita (2018) | Population (2018) | HDI Category | World Bank Income Classification |
|---|---|---|---|---|
| Solomon Islands | 1483 | 652,858 | 0.557 (Medium) | Lower Middle Income |
| Fiji | 4795 | 883,483 | 0.724 (High) | Upper Middle Income |
| PNG | 2417 | 8,606,316 | 0.543 (Low) | Lower Middle Income |
| Samoa | 3749 | 196,130 | 0.707 (High) | Upper Middle Income |
| Tonga | 4055 | 103,197 | 0.717 (High) | Upper Middle Income |
| Vanuatu | 2875 | 292,680 | 0.597 (Medium) | Lower Middle Income |
Notes: (1) GDP per capita in 2018 is at constant prices (2010 US$); (2) HDI: Human Development Index. Source: For comparison purposes other country data collected from World Development Indicators, The World Bank, 2020. HDI sourced from (UNDP 2019).
Table 2.
Evolution of Solomon Islands CPI composition.
| HRPI | HCPI Series 2 | HCPI Series 3 | National CPI | |||
|---|---|---|---|---|---|---|
| Q4 1977 = 100, Rebased 1985 = 100 | Q4 1992 = 100, Rebased Q4 2005 = 100 | Q4 2013 = 100 | Q4 2013 = 100 | |||
| Categories | Weights | Categories | Weights | Categories | Weights | Weights |
| Food | 470 | Food | 429 | Food & Non-alcoholic beverages | 33.3 | 34.3 |
| Drink & Tobacco | 95 | Drink & Tobacco | 47 | Alcoholic, Beverages & Tobacco, Narcotics | 12.6 | 12.4 |
| Clothing | 50 | Clothing & Footwear | 38 | Clothing & Footwear | 2.6 | 2.6 |
| Housing & Utilities | 155 | Housing & Utilities | 181 | Housing, water, electricity, gas & other fuels | 16.9 | 16.6 |
| Transport | 110 | Household Operations | 47 | Furnishing, household, equipment, routine, household maintenance | 2.9 | 3.0 |
| Miscellaneous | 120 | Transport & Communications | 164 | Health | 0.3 | 0.3 |
| Recreation & others | 76 | Transport | 18.2 | 17.5 | ||
| Miscellaneous components | 18 | Communication | 6.3 | 6.3 | ||
| Recreation & Culture | 1.3 | 1.4 | ||||
| Education | 2.7 | 2.7 | ||||
| Restaurants & Hotels | 1.5 | 1.4 | ||||
| Miscellaneous goods & services | 1.5 | 1.5 | ||||
| Total | 1000 | 1000 | 100 | 100 | ||
Source: SINSO and CBSI.
Table 3.
Expected signs of coefficients of variables in the HNKPC model.
| Dependant Variable: Headline Inflation | ||
|---|---|---|
| Variable | Expected Sign | Rationale |
| Past inflation ( | + | Past inflation is expected to positively influence current inflation prices. A larger coefficient on past inflation relative to expected inflation indicates inflation expectations is predominately backward-looking. |
| Expected inflation ( | + | Future inflation is positively related to inflation. A larger coefficient on expected inflation relative to past inflation indicates that forward looking inflation expectations is dominant. |
| Fuel ( | + | Fuel adds to cost of production and therefore increase in fuel prices causes increase in headline inflation |
| Real Effective Exchange rate ) | - | Negative relationship between real effective exchange rate and inflation is expected. Appreciation of the Solomon Islands dollar would imply a decrease in cost of imported goods, thus decrease in inflation |
| Reserve Money ( | + | Increase in reserve money in the economy leads to higher inflationary pressures |
| Output gap () | + | A positive output gap indicates upward increase in inflationary pressures. |
| Dummy () | + | Domestically induced supply side shock depicting the April 2014 Flash floods are associated with increase in inflation. |
Table 4.
Unit root test results.
| ADF Statistics | Phillips–Perron Statistics | |||
|---|---|---|---|---|
| Series | Level | Difference | Level | Difference |
| Inf | −3.2890 ** | −2.6968 * | ||
| Fl | −1.9738 | −6.2101 *** | −2.0886 | −6.0726 *** |
| M0 | 0.4970 | −8.5608 *** | 0.6415 | −8.5344 *** |
| REER | −0.7122 | −6.1795 *** | −0.6330 | −5.7842 *** |
| OG | −4.0429 *** | −4.1148 *** | ||
Notes: ***, **, * indicate the statistical significance at the 1%, 5% and 10% respectively. The MacKinnon (1996) critical values for ADF are −2.5940 (at 10%), −2.9126 (at 5%), and −3.5482 (at 1%). The critical values for Phillips–Perron test are −2.5936 (at 10%), −2.9117 (at 5%) and −3.5461 (at 1%) (MacKinnon 1996). Source: Authors own estimation based on Eviews 10 statistical software.
Table 5.
GMM estimates of the model.
| [Dependent Variable: Headline Inflation Rate] | |
|---|---|
| Independent Variable | GMM Estimates |
| C | −0.3957 |
| (0. 5428) | |
| 0.6967 *** | |
| (0.0000) | |
| 0.2944 ** | |
| (0.0115) | |
| D_Fl | 0.0568 ** |
| (0.0433) | |
| D_M0 | −0.0012 |
| (0.7517) | |
| D_REER | 0.1497 * |
| (0.0626) | |
| OG | 63.3397 *** |
| (0.0021) | |
| Dum_2014Q2 | 5.8266 * |
| (0.0762) | |
| R2 | 0.8801 |
| J-statistics | 9.6473 |
| DW | 2.1004 |
| Q-statistics [1st order serial correlation test] | 0.2689 (0.604) |
| Q-statistics [2nd order serial correlation test] | 0.3548 (0.837) |
| Jarque-Bera | 0.6306 (0.7296) |
| Endogeneity (J-statistics) | 11.0950 (0.8036) |
| Observation | 54 |
Notes: Figures in parentheses are the p-values. ***, ** and * indicate levels of statistical significance at the 1%, 5% and 10%, respectively. The p-value for the J-statistics in the GMM model is 0.5624. Hence, we accept the null-hypothesis that the J-statistics indicate that the over-identification restrictions in the GMM are valid. The Q-statistic is for null hypothesis of no-autocorrelation in residuals. Normality test for residuals (Jarque-Bera) indicate that the residuals are normally distributed. Instrument variables: headline inflation (−1 to −4), Fuel (−1 to −3), Imported food index (−1 to −4), REER (−1 to −4) and M0 (−1 to −3). D refers to first difference given variables are non-stationary at their levels.
Publisher’s Note: MDPI stays neutral with regard to jurisdictional claims in published maps and institutional affiliations. |
© 2021 by the authors. Licensee MDPI, Basel, Switzerland. This article is an open access article distributed under the terms and conditions of the Creative Commons Attribution (CC BY) license (https://creativecommons.org/licenses/by/4.0/).
Share and Cite
MDPI and ACS Style
Rohoia, A.B.; Sharma, P. Do Inflation Expectations Matter for Small, Open Economies? Empirical Evidence from the Solomon Islands. J. Risk Financial Manag. 2021, 14, 448. https://0-doi-org.brum.beds.ac.uk/10.3390/jrfm14090448
AMA Style
Rohoia AB, Sharma P. Do Inflation Expectations Matter for Small, Open Economies? Empirical Evidence from the Solomon Islands. Journal of Risk and Financial Management. 2021; 14(9):448. https://0-doi-org.brum.beds.ac.uk/10.3390/jrfm14090448
Chicago/Turabian StyleRohoia, Angeline B., and Parmendra Sharma. 2021. "Do Inflation Expectations Matter for Small, Open Economies? Empirical Evidence from the Solomon Islands" Journal of Risk and Financial Management 14, no. 9: 448. https://0-doi-org.brum.beds.ac.uk/10.3390/jrfm14090448