
Investigating the Impact of Trade Disruptions on Price Transmission in Commodity Markets: An Application of Threshold Cointegration


Abstract
:1. Introduction
2. Method
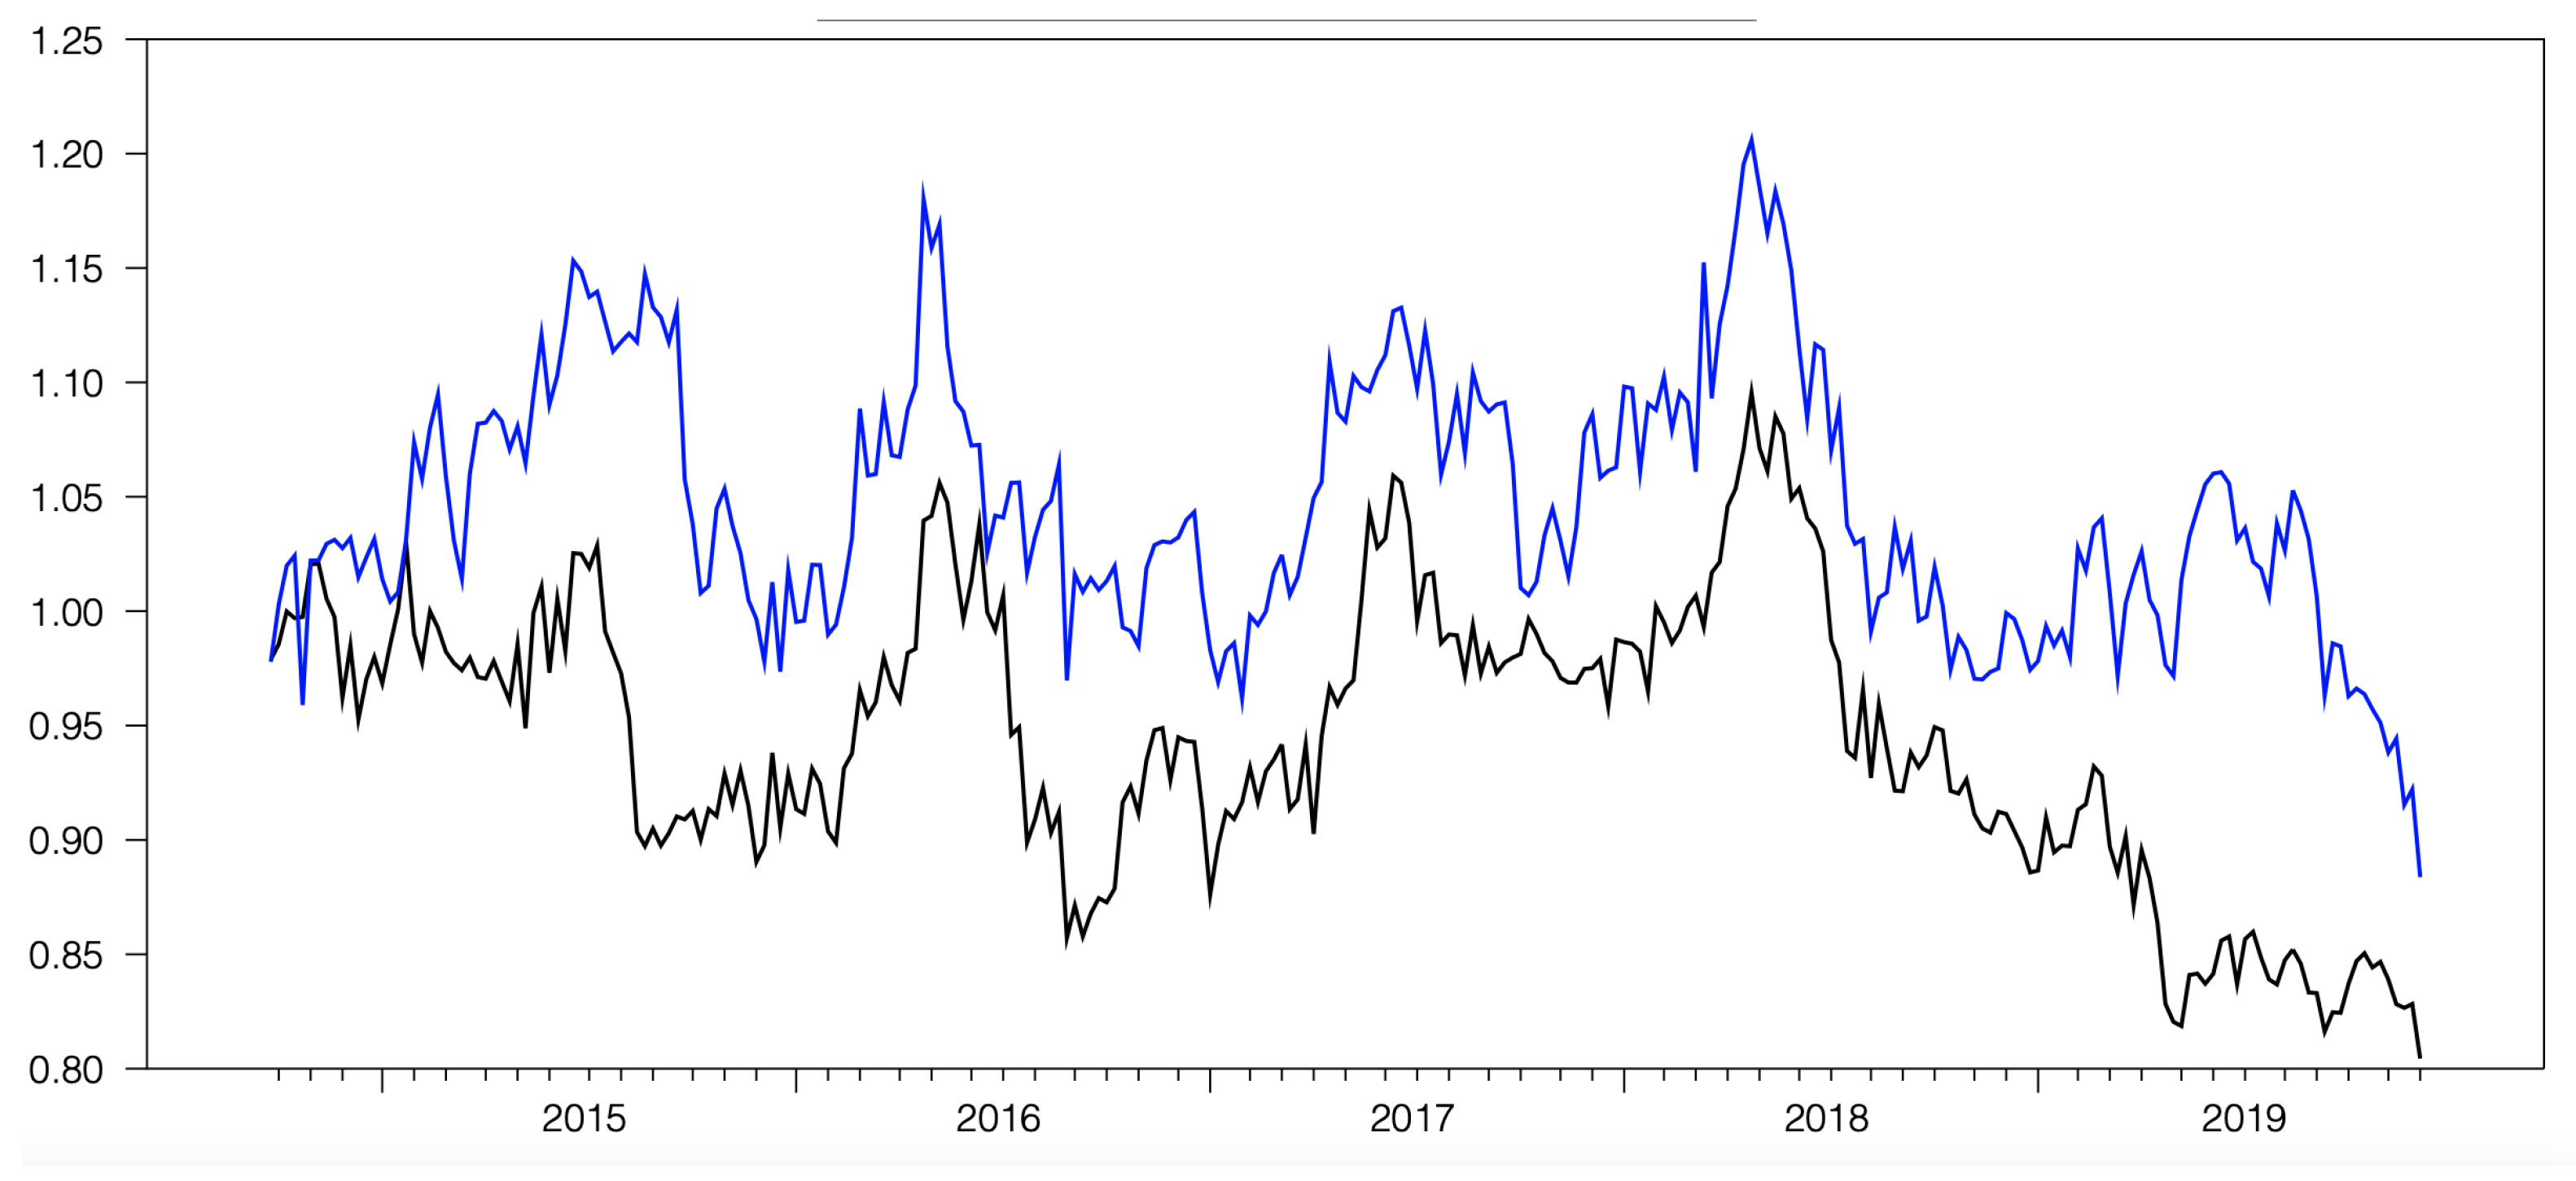
- and are the canola price ratios.
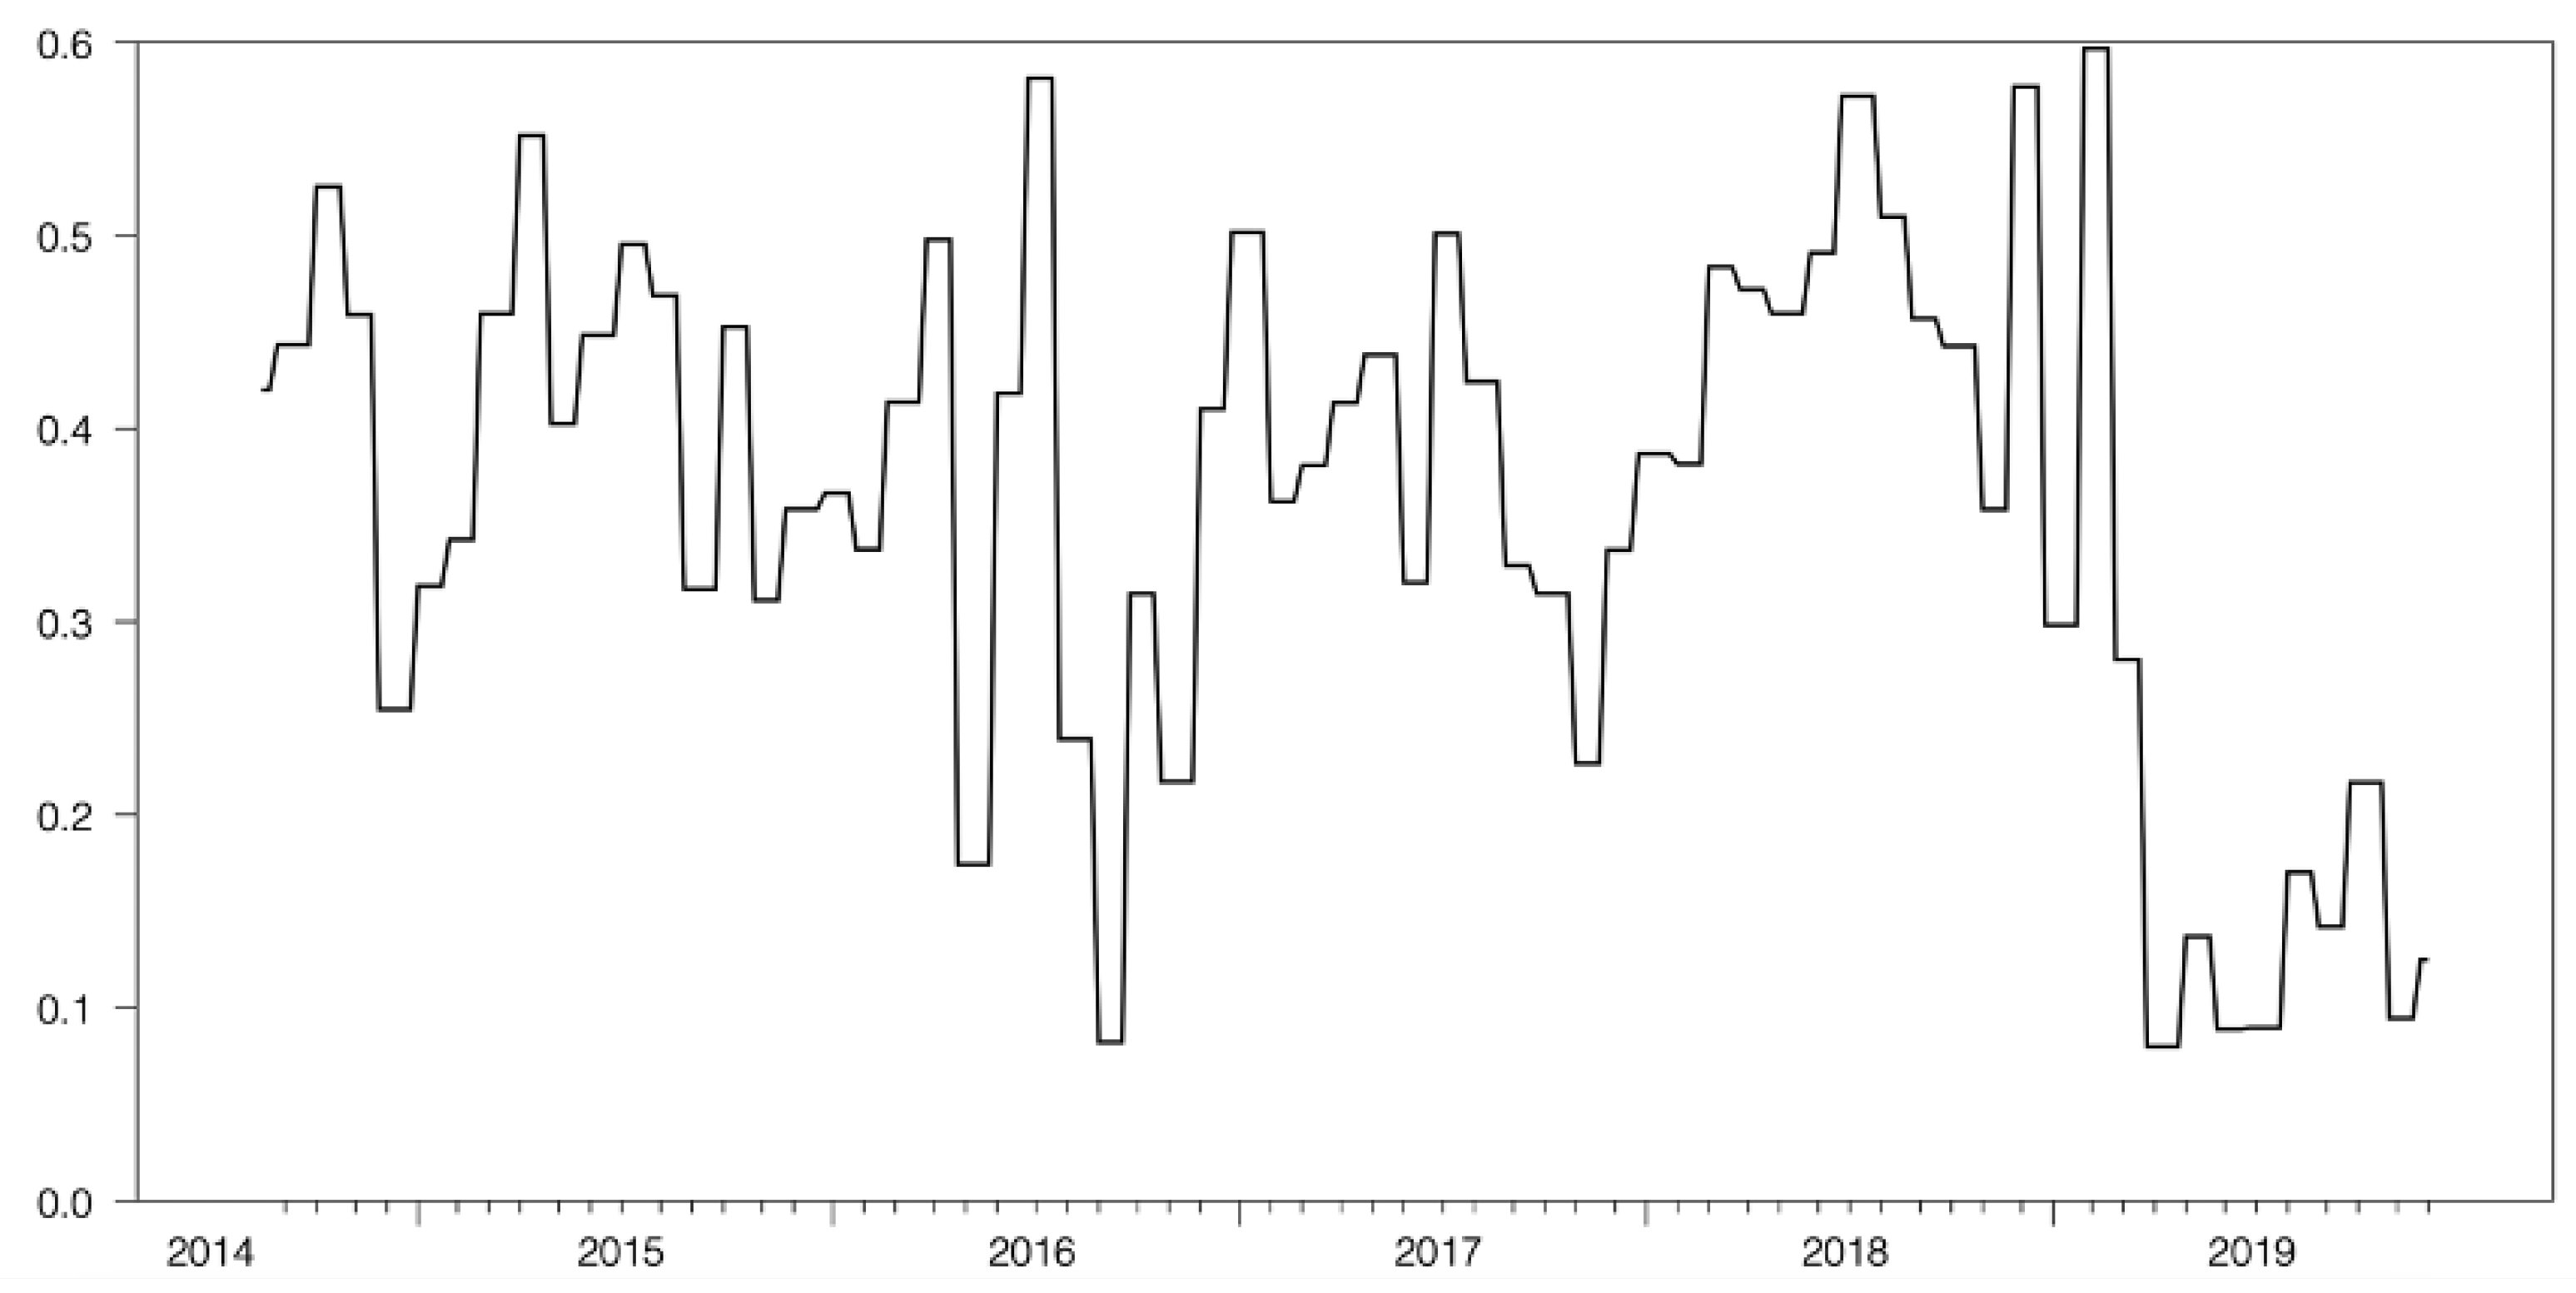
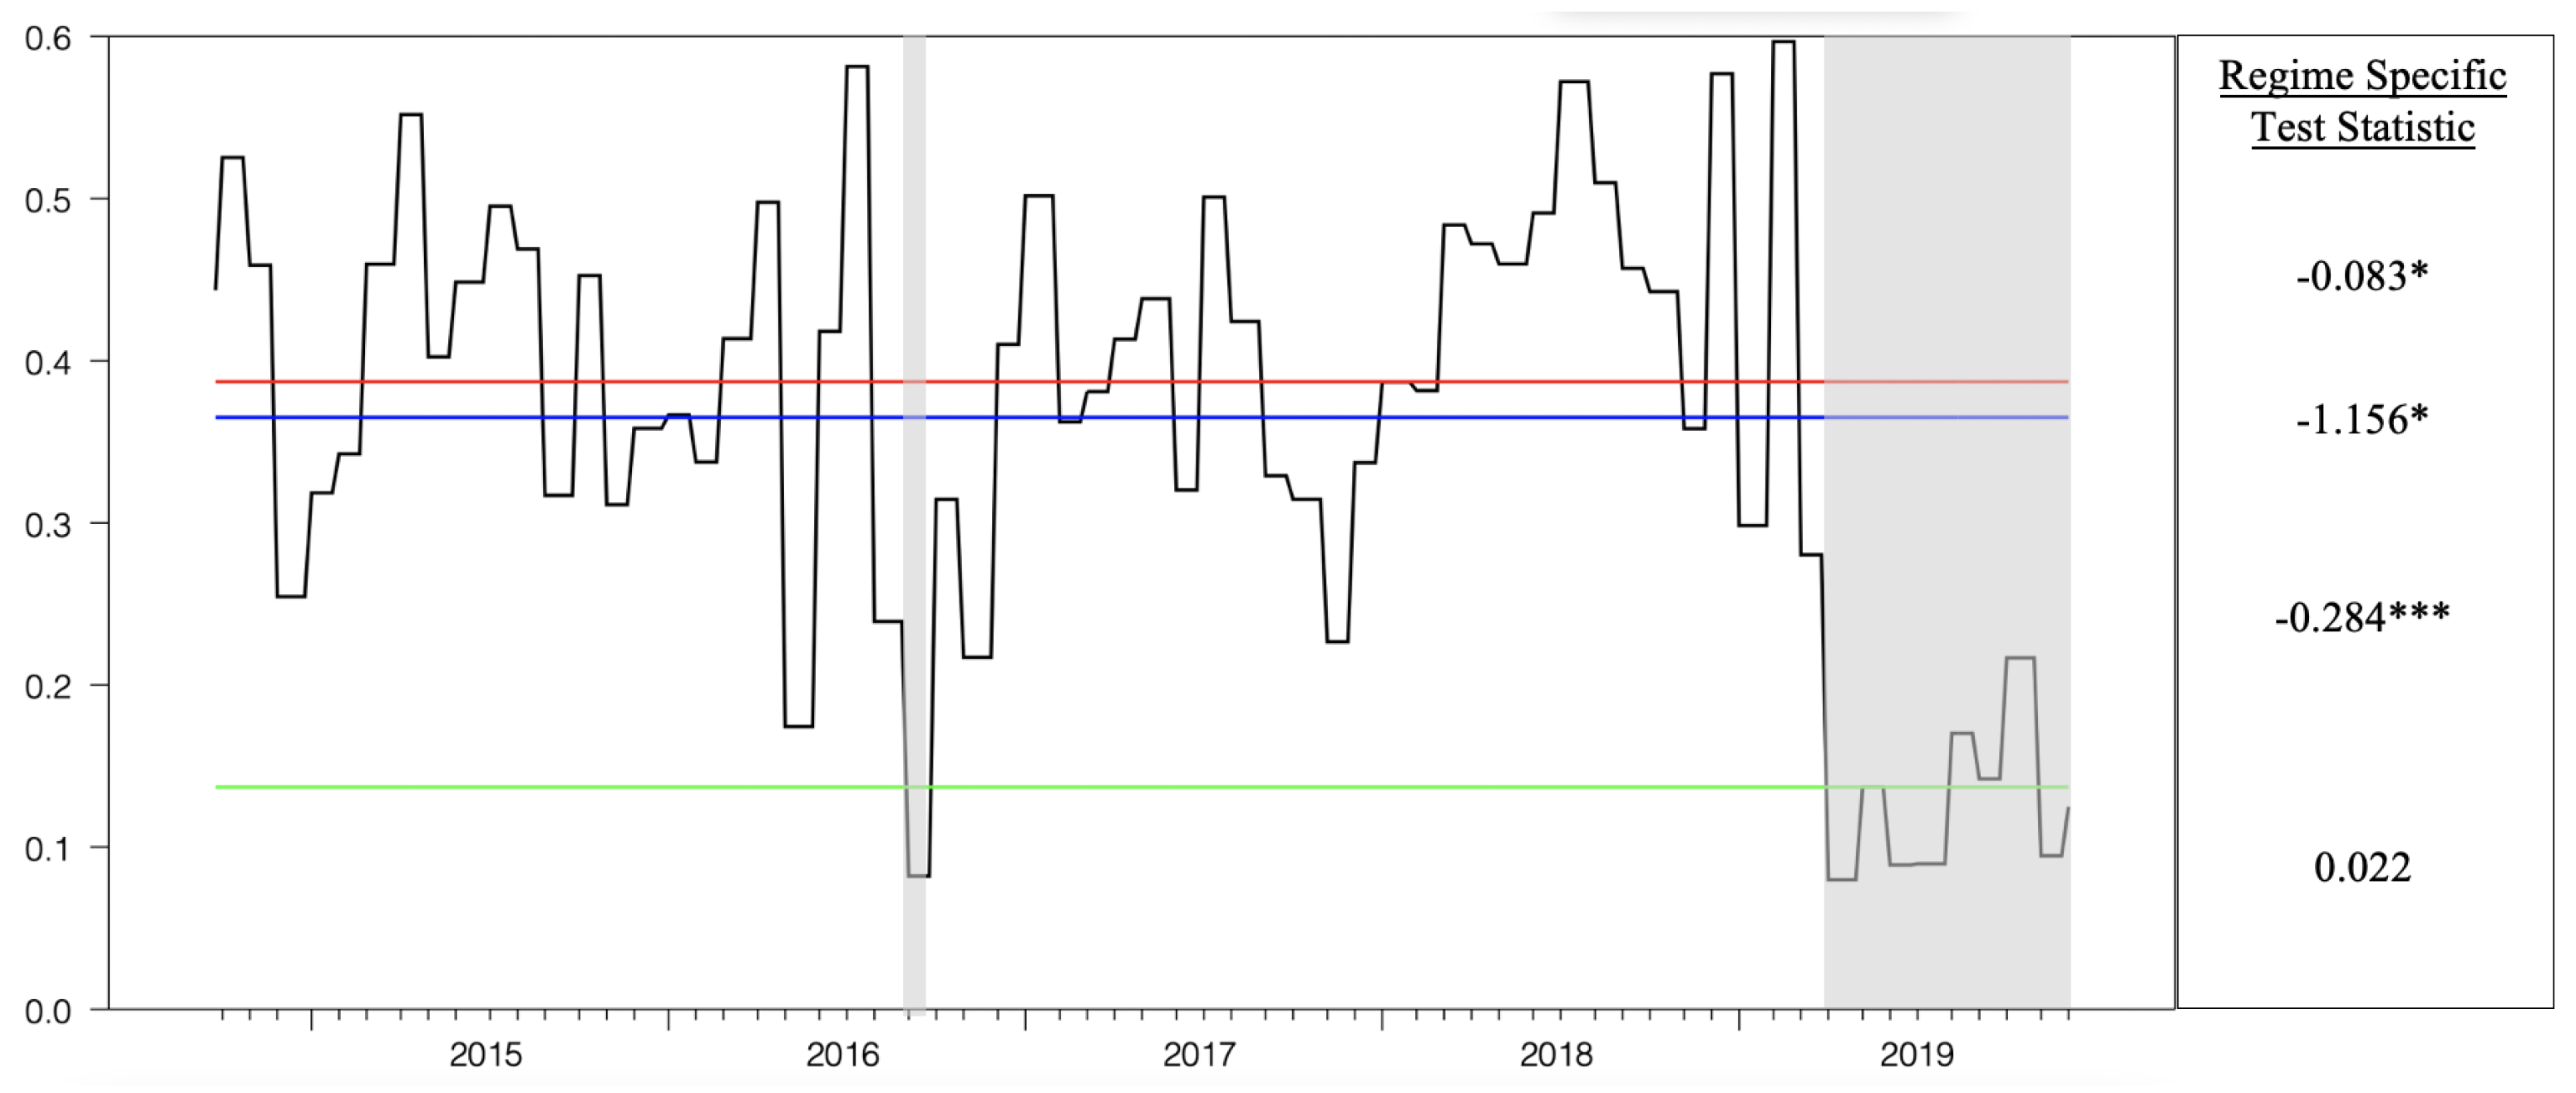
- is the proportion of total Canadian canola exports that are imported by China.
- < are the thresholds that divide observations in to the bottom, middle and top regimes.
- I( ) is the Heaviside indicator function.
- is the difference operator.
3. Application to Canola Trade Dispute
4. Data and Results
5. Conclusions
Author Contributions
Funding
Institutional Review Board Statement
Informed Consent Statement
Data Availability Statement
Acknowledgments
Conflicts of Interest
| 1 | The order of integration is the number of times a series must be differenced to be made stationary and is typically represented by the letter d and abbreviated I(d). |
References
- Alston, Julian M., Richard Gray, and Daniel A. Sumner. 1994. The wheat war of 1994. Canadian Journal of Agricultural Economics 42: 231–51. [Google Scholar] [CrossRef]
- Arltová, Markéta, and Darina Fedorová. 2016. Selection of unit root test on the basis of length of the time series and value of AR(1) parameter. STATISTIKA 96: 47–64. [Google Scholar]
- Balke, Nathan S., and Thomas B. Fomby. 1997. Threshold cointegration. International Economic Review 38: 627–45. [Google Scholar] [CrossRef] [Green Version]
- Balzer, Brian, and Kyle W. Stiegert. 1999. The European Union-United States wheat gluten policy dispute. Journal of Food Distribution Research 30: 1–10. [Google Scholar]
- Boyd, Roy, and Kerry Krutilla. 1987. The welfare impacts of U.S trade restrictions against the Canadian softwood lumber industry: A spatial equilibrium analysis. Canadian Journal of Economics 20: 17–35. [Google Scholar] [CrossRef]
- Cardwell, Ryan, and Derek G. Brewin. 2019. Blackleg or blackmail? Economics of the Canada–China canola trade dispute. Canadian Journal of Agricultural Economics 67: 251–60. [Google Scholar] [CrossRef]
- Dickey, David A., and Wayne A. Fuller. 1979. Distribution of the estimators for autoregressive time series with a unit root. Journal of the American Statistical Association 74: 427–31. [Google Scholar]
- Dickey, David A., and Wayne A. Fuller. 1981. Likelihood ratio statistics for autoregressive time series with a unit root. Econometrica 49: 1057–72. [Google Scholar] [CrossRef]
- Enders, Walter, and Pierre L. Siklos. 2001. Cointegration and threshold adjustment. Journal of Business and Economic Statistics 19: 166–76. [Google Scholar] [CrossRef] [Green Version]
- Engle, Robert F., and Clive W. J. Granger. 1987. Co-integration and error correction: Representation, estimation, and testing. Econometrica 55: 251–76. [Google Scholar] [CrossRef]
- Food and Agricultural Organization of the United States. 2021. Crops and Livestock Products. Available online: http://www.fao.org/faostat/en/#data/TP (accessed on 15 July 2021).
- Gonzalo, Jesús, and Jean-Yves Pitarakis. 2002. Estimation and model selection based inference in single and multiple threshold models. Journal of Econometrics 110: 319–52. [Google Scholar] [CrossRef] [Green Version]
- Hassanzoy, Najibullah, Shoichi Ito, Hiroshi Isoda, and Yuichiro Amekawa. 2017. Cointegration and spatial price transmission among wheat and wheat-flour markets in Afghanistan. Applied Economics 49: 2939–55. [Google Scholar] [CrossRef]
- Higgins, Vaughan, and Jacqui Dibden. 2011. Biosecurity, trade liberalisation, and the anti(politics) of risk analysis: The Australia-New Zealand apples dispute. Environment and Planning A: Economy and Space 43: 393–409. [Google Scholar] [CrossRef]
- Leftfield Commodity Research. 2019. Canola Price Data. [Google Scholar]
- Rude, James, Jared Carlberg, and Scott Pellow. 2007. Integration to fragmentation: Post-BSE Canadian cattle markets, processing capacity, and cattle prices. Canadian Journal of Agricultural Economics 55: 197–216. [Google Scholar] [CrossRef]
- Rude, James, Javed Iqbal, and Derek Brewin. 2006. This little piggy went to market with a passport: The impacts of U.S country of origin labeling on the Canadian pork sector. Canadian Journal of Agricultural Economics 54: 401–20. [Google Scholar] [CrossRef]
- Sanogo, Issa, and Mahamane Maliki Amadou. 2010. Rice market integration and food security in Nepal: The role of cross-border trade with India. Food Policy 35: 312–22. [Google Scholar] [CrossRef]
- Sephton, Peter S. 2011. Spatial arbitrage in Sarawak pepper prices. Canadian Journal of Agricultural Economics 59: 405–16. [Google Scholar] [CrossRef]
- Sephton, Peter, and Janelle Mann. 2013. Threshold cointegration, model selection with an application. Journal of Economics and Econometrics 56: 54–77. [Google Scholar]
- Statistics Canada. 2021. Exports of Grains, by Final Destination. Series V125138 and V125173. Available online: https://www150.statcan.gc.ca/n1/en/type/data (accessed on 15 July 2021).
- Wells, Jacob, and Peter Slade. 2021. The effect of the Canada–China canola trade dispute on canola prices. Canadian Journal of Agricultural Economics 60: 141–49. [Google Scholar] [CrossRef]


| Variable | Mean | Std Dev | Range |
|---|---|---|---|
| Proportion of Total Canadian Canola Exports that are Imported by China | 0.361 | 0.137 | 0.517 |
| Vancouver/Rouen Price Ratio | 0.945 | 0.062 | 0.291 |
| Vancouver/Kwinana Price Ratio | 1.046 | 0.056 | 0.322 |
| Variable | Level | |
|---|---|---|
| Proportion of Total Canadian Canola Exports that are Imported by China | −3.150 * | NA |
| Vancouver/Rouen Price Ratio | −2.724 | −19.846 ** |
| Vancouver/Kwinana Price Ratio | −2.819 | −19.565 ** |
Publisher’s Note: MDPI stays neutral with regard to jurisdictional claims in published maps and institutional affiliations. |
© 2021 by the authors. Licensee MDPI, Basel, Switzerland. This article is an open access article distributed under the terms and conditions of the Creative Commons Attribution (CC BY) license (https://creativecommons.org/licenses/by/4.0/).
Share and Cite
Mann, J.; Brewin, D. Investigating the Impact of Trade Disruptions on Price Transmission in Commodity Markets: An Application of Threshold Cointegration. J. Risk Financial Manag. 2021, 14, 450. https://0-doi-org.brum.beds.ac.uk/10.3390/jrfm14090450
Mann J, Brewin D. Investigating the Impact of Trade Disruptions on Price Transmission in Commodity Markets: An Application of Threshold Cointegration. Journal of Risk and Financial Management. 2021; 14(9):450. https://0-doi-org.brum.beds.ac.uk/10.3390/jrfm14090450
Chicago/Turabian StyleMann, Janelle, and Derek Brewin. 2021. "Investigating the Impact of Trade Disruptions on Price Transmission in Commodity Markets: An Application of Threshold Cointegration" Journal of Risk and Financial Management 14, no. 9: 450. https://0-doi-org.brum.beds.ac.uk/10.3390/jrfm14090450