
Impact of Improved Corporate Governance and Regulations on Earnings Management Practices—Analysis of 7 Industries from the Indian National Stock Exchange


Abstract
:1. Introduction
2. Literature Review
3. Materials and Methods
4. Results
5. Discussion
6. Conclusions
Author Contributions
Funding
Institutional Review Board Statement
Informed Consent Statement
Data Availability Statement
Conflicts of Interest
Abbreviations
| CCE | Cash and Cash Equivalents. Liquid cash plus marketable securities |
| D&A | Depreciation and Amortization |
| EM | Earnings Management |
| MCA | Ministry of Consumer Affairs |
| NFRA | National Financial Reporting Authority |
| NSE | National Stock Exchange of India Limited |
| PPE | Gross Property Plant and Equipment that are not meant for resale. |
| REC | Net receivables of the firm. Owed to the firm by its debtors |
| REV | Revenue/income of the firm from its normal business activities. |
| TA | Total Assets of the firm. Combination of both liquid/current assets and fixed assets. |
| TCA | Total Current Assets. Sum of liquid assets – cash, receivables, inventories and supplies. |
| TCL | Total Current Liabilities. Short term obligations of the firm to be met within a year. |
| SEBI | Securities and Exchange Board of India |
| SOX | The Sarbanes-Oxley Act of 2002 |
| STD | Short Term Debts of the firm, payable in less than a year. |
Appendix A
Notations
| Variables and functions | |
| α1, α2 and α3 | Estimated parameters of the coefficients of the Modified Jones model. |
| ∆CAt | Change in current assets in year t, |
| ∆Casht | Change in cash and cash equivalents in year t, |
| ∆CLt | Change in current liabilities in year t, |
| ∆DCLt | Change in short term debt included in current liabilities in year t, |
| ∆REVt | Revenues is year t less revenues in year t − 1, |
| ∆RECt | Net receivables in year t less net receivables in year t − 1, |
| DEPt | Depreciation and amortization expense in year t. |
| NDACCt | Non-discretionary accruals divided by total assets in year t − 1 |
| PPEt | Gross property plant and Equipment in year t, |
| TACCt | Total Accruals in year t |
References
- Baik, Yoon-Suk, and Jaywon Lee. 2007. Earnings Management Dynamics and Deregulation: Case of the US Airline Industry (Working Papers). Kaist Business School Working Paper No. 2007-008. New York: SSRN. [Google Scholar] [CrossRef]
- Beattie, Vivien, Stella Fearnley, and Hines Tony. 2014. Boundary spanning and gatekeeping roles of UK audit committees. Accounting and Business Research 44: 315–43. [Google Scholar] [CrossRef] [Green Version]
- Brickey, Kathleen F. 2003. From Enron to WorldCom and Beyond: Life and Crime After Sarbanes-Oxley. Washington University Law Review 81: 357–401. [Google Scholar] [CrossRef] [Green Version]
- Burgstahler, David, and Ilia Dichev. 1997. Earnings management to avoid earnings decreases and losses. Journal of Accounting and Economics 24: 99–126. [Google Scholar] [CrossRef]
- Byun, Sanghyuk, and Kristin Roland-Luttecke. 2014. Meeting-or-Beating, Earnings Management, and Investor Sensitivity after the Scandals. Accounting Horizons 28: 847–67. [Google Scholar] [CrossRef]
- Callao, Susana, Riccardo Cimini, and José Ignacio Jarne. 2016. Value relevance of accounting figures in presence of earnings management. Are enforcement and ownership diffusion really enough? Journal of Business Economics and Management 17: 1286–99. [Google Scholar] [CrossRef] [Green Version]
- Carcello, Joseph V., and Albert L. Nagy. 2004. Audit Firm Tenure and Fraudulent Financial Reporting. AUDITING: A Journal of Practice & Theory 23: 55–69. [Google Scholar]
- Cheng, Qiang, and Terry Warfield. 2005. Equity Incentives and Earnings Management. The Accounting Review 80: 441–76. [Google Scholar] [CrossRef]
- Cohen, Daniel A., and Paul Zarowin. 2008. Real and Accrual-based Earnings Management in the Pre and Post Sarbanes Oxley Periods. The Accounting Review 83: 757–87. [Google Scholar] [CrossRef] [Green Version]
- Cohen, Jeffrey R., Udi Hoitash, Ganesh Krishnamoorthy, and Arnold M. Wright. 2014. The Effect of Audit Committee Industry Expertise on Monitoring the Financial Reporting Process. The Accounting Review 89: 243–73. [Google Scholar] [CrossRef]
- Dayanandan, Ajit, and Jaspreet Kaur Sra. 2018. Accrual management and expected stock returns in India. Journal of Accounting in Emerging Economies 8: 426–41. [Google Scholar] [CrossRef]
- Dayanandan, Ajit, Han Donker, Mike Ivanof, and Gökhan Karahan. 2016. IFRS and accounting quality: Legal origin, regional, and disclosure impacts. International Journal of Accounting & Information Management 24: 296–316. [Google Scholar] [CrossRef]
- DeAngelo, Linda. 1988. Discussion of evidence of earnings management from the provision for bad debts. Journal of Accounting Research 26: 32–40. [Google Scholar] [CrossRef]
- Dechow, Patricia M., and Douglas J. Skinner. 2000. Earnings Management: Reconciling the Views of Accounting Academics, Practitioners, and Regulators. Accounting Horizons 14: 235–50. [Google Scholar] [CrossRef]
- Dechow, Patricia M., Richard G. Sloan, and Amy P. Sweeney. 1995. Detecting Earnings Management. The Accounting Review 70: 193–225. [Google Scholar]
- Dhaoui, Abderrazak. 2008. R&D diversification in MNCs: Between earnings management and shareholders increasing wealth. Journal of Business Economics and Management 9: 199–205. [Google Scholar]
- Di Meo, Fabrizio, Juan Manuel García Lara, and Jordi A. Surroca. 2017. Managerial entrenchment and earnings management. Journal of Accounting and Public Policy 36: 399–414. [Google Scholar] [CrossRef] [Green Version]
- Dichev, Ilia, John Graham, Campbell R. Harvey, and Shiva Rajgopal. 2016. The Misrepresentation of Earnings. Financial Analysts Journal 71: 22–35. [Google Scholar] [CrossRef]
- Doukakis, Leonidas C. 2014. The effect of mandatory IFRS adoption on real and accrual-based earnings management activities. Journal of Accounting and Public Policy 33: 551–72. [Google Scholar] [CrossRef]
- Du, Qianqian, and Rui Shen. 2018. Peer performance and earnings management. Journal of Banking & Finance 89: 125–37. [Google Scholar]
- Epps, Ruth W., and Tariq Hassaneen Ismail. 2009. Board of Directors’ Governance Challenges and Earnings Management. Journal of Accounting & Organizational Change 5: 390–416. [Google Scholar] [CrossRef]
- Fisher, Timothy C. G., Ilanit Gavious, and Jocelyn Martel. 2016. Earnings Management, Chapter 11. Emergence and Firm Value. SSRN. Available online: https://ssrn.com/abstract=2786587 (accessed on 7 September 2021).
- Goel, Sandeep. 2018. Earnings management in corporate enterprises in India: A test for multi-nationality, reputation and related variables. International Journal of Emerging Markets 13: 1820–34. [Google Scholar] [CrossRef]
- González, Jesus Sáenz, and Emma García-Meca. 2014. Does Corporate Governance Influence Earnings Management in Latin American Markets? Journal of Business Ethics 121: 419–40. [Google Scholar] [CrossRef] [Green Version]
- Graham, John R., Campbell R. Harvey, and Shiva Rajgopal. 2005. The economic implications of corporate financial reporting. Journal of Accounting and Economics 40: 3–73. [Google Scholar] [CrossRef] [Green Version]
- Healy, Paul M. 1985. The effect of bonus schemes on accounting decisions. Journal of Accounting and Economics 7: 85–107. [Google Scholar] [CrossRef]
- Healy, Paul M., and James M. Wahlen. 1999. A Review of the Earnings Management Literature and Its Implications for Standard Setting. Accounting Horizons 13: 365–83. [Google Scholar] [CrossRef]
- International Monetary Fund. 2013. Report Country Report No. 13/226. India: Financial Sector Assessment Program—Detailed Assessments Report on IOSCO Objectives and Principles of Securities Regulation. Available online: https://www.imf.org/external/pubs/ft/scr/2013/cr13266.pdf (accessed on 15 September 2021).
- Ipino, Elisabetta, and Antonio Parbonetti. 2016. Mandatory IFRS adoption: The trade-off between accrual-based and real earnings management. Accounting and Business Research 47: 91–121. [Google Scholar] [CrossRef]
- Jeanjean, Thomas, and Hervé Stolowy. 2008. Do accounting standards matter? An exploratory analysis of earnings management before and after IFRS adoption. Journal of Accounting and Public Policy 27: 480–94. [Google Scholar] [CrossRef]
- Jones, Jennifer J. 1991. Earnings Management during Import Relief Investigations. Journal of Accounting Research 29: 193–99. [Google Scholar] [CrossRef]
- Kang, Sun-A., and Yong-Shik Kim. 2012. Effect of corporate governance on real activity-based earnings management: Evidence from Korea. Journal of Business Economics and Management 13: 29–52. [Google Scholar] [CrossRef] [Green Version]
- Kedia, Simi, and Thomas Philippon. 2007. The Economics of Fraudulent Accounting. The Review of Financial Studies 22: 2169–99. [Google Scholar] [CrossRef]
- Khan, Muhammad Kaleem, Ying He, Ahmad Kaleem, Umair Akram, and Zahid Hussain. 2018. Remedial role of financial development in corporate investment amid financing constraints and agency costs. Journal of Business Economics and Management 19: 176–91. [Google Scholar] [CrossRef] [Green Version]
- Klein, April. 2002. Audit committee, board of director characteristics, and earnings management. Journal of Accounting and Economics 33: 375–400. [Google Scholar] [CrossRef] [Green Version]
- Lambert, Caroline, and Samuel Sponem. 2005. Corporate governance and profit manipulation: A French field study. Critical Perspectives on Accounting 16: 717–48. [Google Scholar] [CrossRef] [Green Version]
- Larcker, David F., Scott A. Richardson, and I˙rem Tuna. 2007. Corporate Governance, Accounting Outcomes and Organizational Outcomes. The Accounting Review 82: 963–1008. [Google Scholar] [CrossRef]
- Leuz, Christian, Dhananjay Nanda, and Peter D. Wysocki. 2003. Earnings management and investor protection: An international comparison. Journal of Financial Economics 69: 505–27. [Google Scholar] [CrossRef]
- Lin, Jerry W., and Mark I. Hwang. 2010. Audit Quality, Corporate Governance, and Earnings Management: A Meta-Analysis. International Journal of Auditing 14: 57–77. [Google Scholar] [CrossRef]
- Liu, Qiao, and Zhou Lu. 2007. Corporate governance and earnings management in the Chinese listed companies: A tunneling perspective. Journal of Corporate Finance 13: 881–906. [Google Scholar] [CrossRef]
- López, M. Victoria, Arminda Garcia, and Lazaro Rodriguez. 2007. Sustainable Development and Corporate Performance: A Study Based on the Dow Jones Sustainability Index. Journal of Business Ethics 75: 285–300. [Google Scholar] [CrossRef]
- Moradi, Mahdi, Mahdi Salehi, and Mohammad Zamanirad. 2015. Analysis of incentive effects of managers’ bonuses on real activities manipulation relevant to future operating performance. Management Decision 53: 432–50. [Google Scholar] [CrossRef]
- Nathan, Robert Jeyakumar, Chin Xin Yi, Eva H. Görgényi, Vijay Victor, G. Gonda, and M. Fekete Farkas. 2019. Impact of Knowledge and Innovation Management to Firm Financial and Non-Financial Performance. Vadyba Journal of Management 35: 71–81. [Google Scholar]
- Nosratabadi, Saeed, Gergo Pinter, Amir Mosavi, and Sandor Semperger. 2020. Sustainable banking; evaluation of the European business models. Sustainability 12: 2314. [Google Scholar] [CrossRef] [Green Version]
- Parfet, William U. 2000. Accounting Subjectivity and Earnings Management: A Preparer Perspective. Accounting Horizons 14: 481–88. [Google Scholar] [CrossRef]
- Park, KoEun. 2019. Does peer firm executive compensation affect earnings management? Managerial Finance 45: 54–71. [Google Scholar] [CrossRef]
- Popescu, Cristina Raluca Gh, and Gheorghe N. Popescu. 2019. An Exploratory Study Based on a Questionnaire Concerning Green and Sustainable Finance, Corporate Social Responsibility, and Performance: Evidence from the Romanian Business Environment. Journal of Risk and Financial Management 12: 162. [Google Scholar] [CrossRef] [Green Version]
- Punniyamoorthy, Murugesan, and Jose Joy Thoppan. 2012. ANN-GA based model for stock market surveillance. Journal of Financial Crime 20: 52–66. [Google Scholar] [CrossRef]
- Rahman, Rashid, and Fairuzana Ali. 2006. Board, Audit committee, Culture and Earnings Management: Malaysian Evidence. Managerial Auditing Journal 21: 783–804. [Google Scholar] [CrossRef]
- Rangan, Srinivasan. 1998. Earnings Management and the Performance of Seasoned Equity Offerings. Journal of Financial Economics 50: 101–22. [Google Scholar] [CrossRef]
- Ronen, Joshua, and Varda Yaari. 2008. Earnings Management: Emerging Insights in Theory, Practice, and Research. New York: Springer US. [Google Scholar]
- Rudra, Titas, and CA Dipanjan Bhattacharjee. 2012. Does IFRS Influence Earnings Management? Journal of Management Research 4. [Google Scholar] [CrossRef] [Green Version]
- Sarkar, Jayati, Subrata Sarkar, and Kaustav Sen. 2008. Board of Directors and Opportunistic Earnings Management: Evidence from India. Journal of Accounting. Auditing & Finance 23: 517–51. [Google Scholar] [CrossRef]
- Shen, Chung-Hua, and Hsiang-Lin Chih. 2005. Investor Protection, Prospect Theory, and Earnings Management: An International Comparison of the Banking Industry. Journal of Banking and Finance 29: 2675–97. [Google Scholar] [CrossRef]
- Shen, Chung-Hua, and Hsiang-Lin Chih. 2007. Earnings Management and Corporate Governance in Asia’s Emerging Markets. Corporate Governance: An International Review 15: 999–1021. [Google Scholar] [CrossRef]
- Škare, Marinko, and Tea Hasić. 2016. Corporate governance, firm performance, and economic growth—Theoretical analysis. Journal of Business Economics and Management 17: 35–51. [Google Scholar] [CrossRef] [Green Version]
- Srivastava, Varnita, Niladri Das, and Jamini Kanta Pattanayak. 2018. Corporate governance: Mapping the change. International Journal of Law and Management 60: 19–33. [Google Scholar] [CrossRef]
- Steurer, Reinhard, Markus E. Langer, Astrid Konrad, and André Martinuzzi. 2005. Corporations, stakeholders and sustainable development: A theoretical exploration of business–society relations. Journal of Business Ethics 61: 263–81. [Google Scholar] [CrossRef]
- Stewart, Bennett. 2006. The Real Reasons Enron Failed. Journal of Applied Corporate Finance 18: 116–19. [Google Scholar] [CrossRef]
- Suryani, Arna, K. Pirzada, and Mufidah. 2018. Analysis of opportunistic behavior of management to company performance. Polish Journal of Management Studies 18: 379–88. [Google Scholar] [CrossRef]
- Teoh, Siew Hong, Ivo Welch, and Tak Jun Wong. 1998. Earnings management and the underperformance of seasoned equity offerings. Journal of Financial Economics 50: 63–99. [Google Scholar] [CrossRef]
- Teoh, Siew Hong, Ivo Welch, and T. J. Wong. 2002. Earnings Management and the Long-Run Market Performance of Initial Public Offerings. The Journal of Finance 53: 1935–74. [Google Scholar] [CrossRef] [Green Version]
- Van Tendeloo, Brenda, and Ann Vanstraelen. 2005. Earnings Management under German GAAP versus IFRS. European Accounting Review 14: 155–80. [Google Scholar] [CrossRef]
- Van Tendeloo, Brenda, and Ann Vanstraelen. 2008. Earnings management and audit quality in Europe: Evidence from the private client segment market. European accounting Review 17: 447–69. [Google Scholar] [CrossRef] [Green Version]
- Young, Steven. 1999. Systematic Measurement Error in the Estimation of Discretionary Accruals: An Evaluation of Alternative Modelling Procedures. Journal of Business Finance and Accounting 26: 833–62. [Google Scholar] [CrossRef]
- Zéman, Zoltán, and Cs Lentner. 2018. The changing role of going concern assumption supporting management decisions after financial crisis. Polish Journal of Management Studies 18: 428–41. [Google Scholar] [CrossRef]


| Variables | Mean | Standard Deviation | Minimum | Maximum |
|---|---|---|---|---|
| REC | 20,959.29 | 35,037.88 | 10.16 | 249,430 |
| REV | 192,509.90 | 355,350.80 | 170.00 | 2,885,961 |
| PPE | 133,836.90 | 301,478.00 | 42.92 | 1,795,240 |
| TCA | 114,699.80 | 187,662.10 | 145.88 | 1,359,728 |
| TA | 265,084.80 | 451,802.20 | 743.60 | 3,313,505 |
| TCL | 79,257.24 | 150,645.70 | 459.67 | 1,432,195 |
| STD | 21,825.73 | 45,957.25 | 0.00 | 322,450 |
| CCE | 22,809.01 | 66,592.12 | 5.75 | 622,360 |
| D&A | 8014.23 | 18,539.62 | 12.49 | 215,536 |
| Variable | Auto | FMCG | Media | IT | Pharma | Realty | Metal |
|---|---|---|---|---|---|---|---|
| * (n = 104) | (n = 116) | (n = 106) | (n = 70) | (n = 78) | (n = 79) | (n = 105) | |
| REC | 23,867 | 6471 | 3479 | 44,928 | 20,669 | 6425 | 46,659 |
| REV | 367,538 | 87,729 | 16,564 | 226,829 | 86,971 | 23,575 | 494,366 |
| PPE | 165,446 | 21,117 | 29,666 | 227,127 | 33,327 | 39,087 | 567,275 |
| TCA | 148,609 | 43,410 | 11,489 | 150,310 | 72,527 | 86,216 | 291,891 |
| TA | 354,431 | 83,978 | 9221 | 47,261 | 156,671 | 147,991 | 807,815 |
| TCL | 134,596 | 29,651 | 11,879 | 4638 | 45,697 | 50,086 | 218,419 |
| STD | 30,174 | 6694 | 2686 | 28,375 | 20,731 | 17,875 | 65,049 |
| CCE | 27,635 | 6928 | 2357 | 42,703 | 12,464 | 4349 | 63,162 |
| D&A | 15,693 | 1817 | 1880 | 5311 | 3951 | 1162 | 23,420 |
| Year | REC | REV | TA | TCA | TCL | PPE | STD | CCE | D&A |
|---|---|---|---|---|---|---|---|---|---|
| FY 2011 | 9403 | 60,497 | 67,861 | 35,180 | 20,503 | 15,027 | 4926 | 6686 | 1581 |
| FY 2012 | 12,915 | 79,605 | 87,874 | 48,624 | 24,918 | 18,029 | 5209 | 12,388 | 1992 |
| FY 2013 | 15,865 | 99,225 | 107,688 | 60,074 | 31,295 | 21,521 | 7913 | 13,239 | 2404 |
| FY 2014 | 20,003 | 122,465 | 130,917 | 77,218 | 37,635 | 25,465 | 9672 | 18,736 | 2920 |
| FY 2015 | 21,407 | 130,520 | 139,462 | 82,217 | 41,615 | 28,401 | 9951 | 23,416 | 3360 |
| FY 2016 | 25,515 | 141,393 | 163,776 | 91,700 | 42,885 | 30,629 | 12,362 | 23,092 | 3751 |
| FY 2017 | 28,519 | 174,334 | 211,975 | 119,763 | 53,939 | 35,320 | 15,935 | 23,379 | 5132 |
| FY 2018 | 32,593 | 183,034 | 232,767 | 125,112 | 58,552 | 38,095 | 16,058 | 22,782 | 5731 |
| Variables | Auto | FMCG | IT | Media | Metal | Pharma | Realty |
|---|---|---|---|---|---|---|---|
| Constant (α0) | 0.070 (0.128) | 0.0426 (0.097) | −0.086 (0.336) | −0.068 (0.107) | −0.017 (0.213) | −0.18001 (0.252) | −0.02423 (0.112) |
| 1/At − 1 (α1) | 1963.899 (1830.798) | −689.362 (2889.663) | −12.552 (1286.258) | 542.622 (274.088) | −298.134 (2388.114) | 7273.424 (8366.806) | 878.3234 (6108.166) |
| (∆REVt − ∆RECt)/At − 1 (α2) | −0.225 (0.316) | −0.205 (0.439) | 0.350 (0.954) | −0.048 (0.346) | 0.035 (0.312) | 0.275784 (1.342) | 0.092686 (1.05816) |
| PPEt/At− 1 (α3) | −0.145 (0.136) | −0.028 (0.288) | 0.336 (1.892) | −0.147 (0.227) | −0.028 (0.281) | 0.007341 (0.577) | −0.06578 (0.153) |
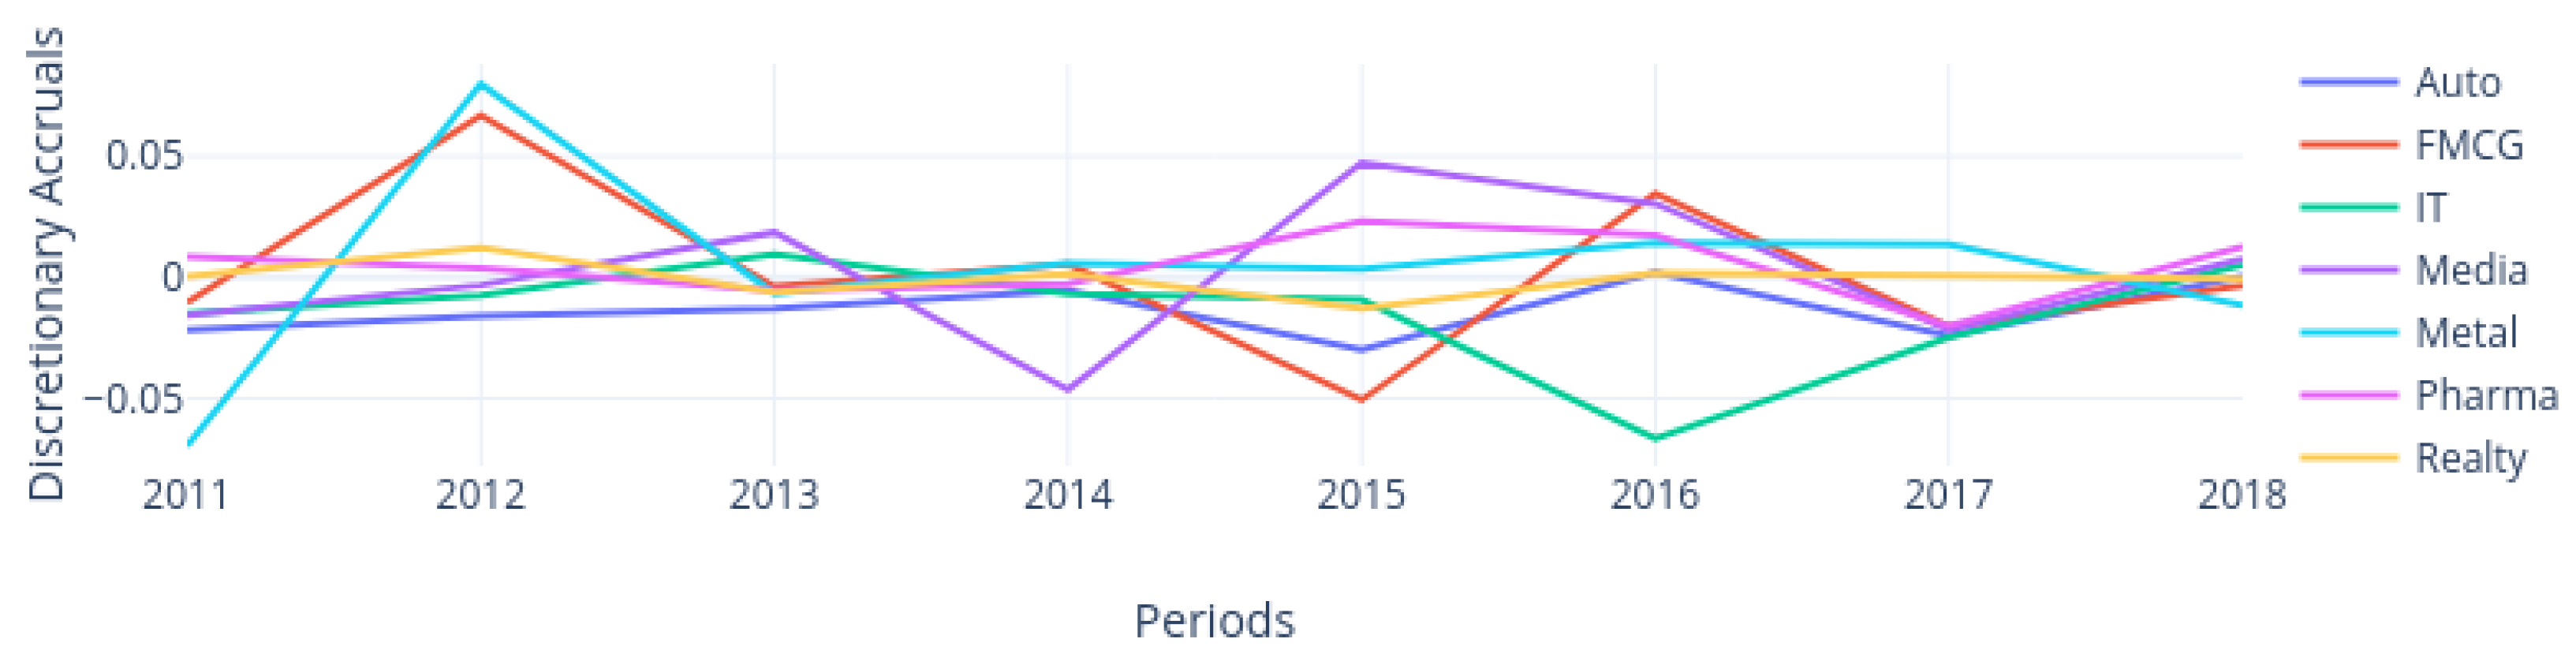
| Category | Statistic | 2011 | 2012 | 2013 | 2014 | 2015 | 2016 | 2017 | 2018 | Average |
|---|---|---|---|---|---|---|---|---|---|---|
| Automobile | Median | −0.022 (0.157) | −0.016 (0.080) | −0.013 (0.078) | −0.006 (0.041) | −0.030 (0.112) | 0.002 (0.101) | −0.024 (0.077) | 0.000 (0.121) | −0.014 (0.097) |
| FMCG | Median | −0.010 (0.192) | 0.067 (0.182) | −0.004 (0.057) | 0.005 (0.159) | −0.051 (0.128) | 0.035 (0.190) | −0.020 (0.074) | −0.003 (0.069) | 0.003 (0.138) |
| IT | Median | −0.015 (0.142) | −0.007 (0.115) | 0.010 (0.100) | −0.007 (0.070) | −0.009 (0.103) | −0.067 (0.147) | −0.025 (0.184) | 0.005 (0.061) | 0.005 (0.015) |
| Media | Median | −0.016 (0.290) | −0.003 (0.166) | 0.019 (0.156) | −0.046 (0.172) | 0.047 (0.2290) | 0.031 (0.197) | −0.022 (0.126) | 0.008 (0.109) | 0.003 (0.180) |
| Metal | Median | −0.070 (0.194) | 0.080 (0.205) | −0.007 (0.065) | 0.006 (0.034) | 0.004 (0.050) | 0.014 (0.101) | 0.014 (0.080) | −0.012 (0.029) | 0.010 (0.104) |
| Pharma | Median | 0.008 (0.258) | 0.004 (0.129) | −0.005 (0.134) | −0.003 (0.087) | 0.023 (0.112) | 0.017 (0.126) | −0.020 (0.204) | 0.013 (0.077) | 0.011 (0.145) |
| Realty | Median | 0.000 (0.207) | 0.012 (0.110) | −0.006 (0.069) | 0.001 (0.110) | −0.013 (0.073) | 0.002 (0.030) | 0.001 (0.058) | −0.001 (0.025) | −0.002 (0.097) |
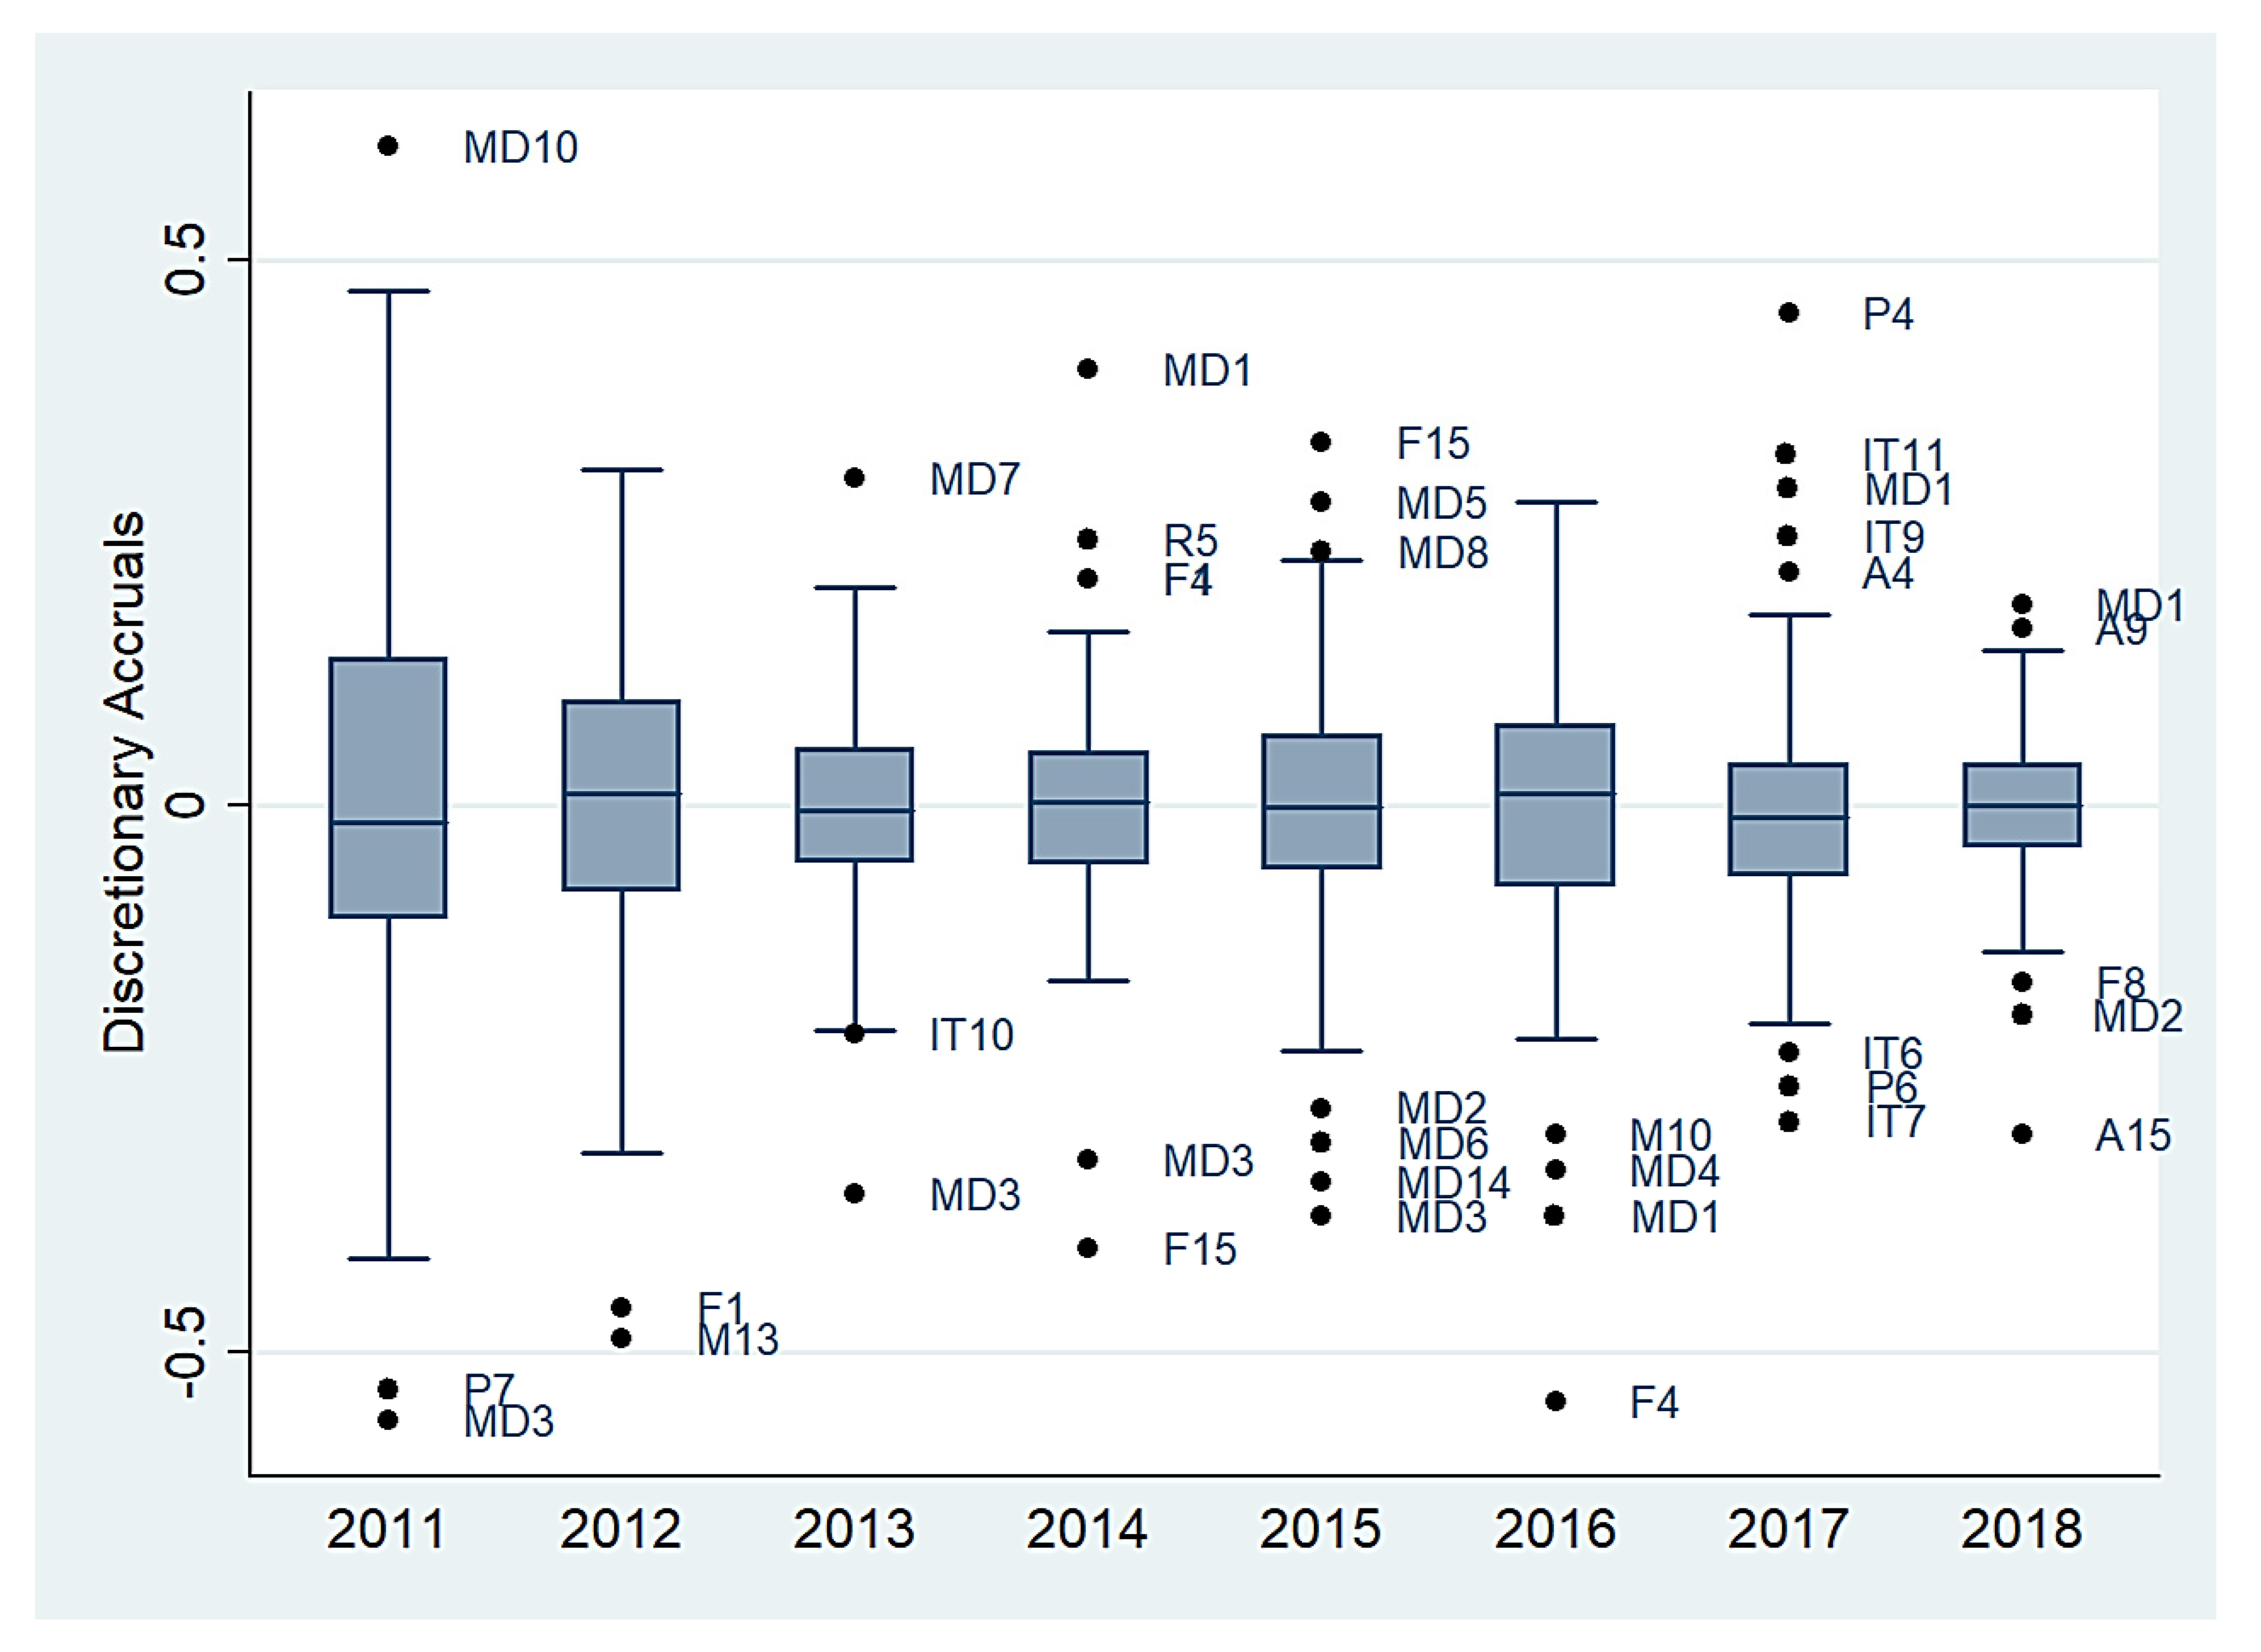
| Industry | 2011 | 2012 | 2013 | 2014 | 2015 | 2016 | 2017 | 2018 | Count | |
|---|---|---|---|---|---|---|---|---|---|---|
| + VE | Realty | R5 | 1 | |||||||
| Pharmaceutical | P4 | 1 | ||||||||
| Automobile | A4 | A9 | 2 | |||||||
| IT | IT9, IT11 | 2 | ||||||||
| FMCG | F1, F4 | F15 | 3 | |||||||
| Media | MD10 | MD7 | MD1 | MD5, MD8 | MD1 | MD1 | 5 | |||
| − VE | Media | MD3 | MD3 | MD3 | MD2, MD3, MD6, MD14 | MD1, MD4 | MD2 | 7 | ||
| FMCG | F1 | F15 | F4 | F8 | 4 | |||||
| IT | IT10 | IT6, IT7 | 3 | |||||||
| Automobile | A15 | 1 | ||||||||
| Pharmaceutical | P7 | P6 | 2 | |||||||
| Metal | M13 | M10 | 2 |
Publisher’s Note: MDPI stays neutral with regard to jurisdictional claims in published maps and institutional affiliations. |
© 2021 by the authors. Licensee MDPI, Basel, Switzerland. This article is an open access article distributed under the terms and conditions of the Creative Commons Attribution (CC BY) license (https://creativecommons.org/licenses/by/4.0/).
Share and Cite
Thoppan, J.J.; Nathan, R.J.; Victor, V. Impact of Improved Corporate Governance and Regulations on Earnings Management Practices—Analysis of 7 Industries from the Indian National Stock Exchange. J. Risk Financial Manag. 2021, 14, 454. https://0-doi-org.brum.beds.ac.uk/10.3390/jrfm14100454
Thoppan JJ, Nathan RJ, Victor V. Impact of Improved Corporate Governance and Regulations on Earnings Management Practices—Analysis of 7 Industries from the Indian National Stock Exchange. Journal of Risk and Financial Management. 2021; 14(10):454. https://0-doi-org.brum.beds.ac.uk/10.3390/jrfm14100454
Chicago/Turabian StyleThoppan, Jose Joy, Robert Jeyakumar Nathan, and Vijay Victor. 2021. "Impact of Improved Corporate Governance and Regulations on Earnings Management Practices—Analysis of 7 Industries from the Indian National Stock Exchange" Journal of Risk and Financial Management 14, no. 10: 454. https://0-doi-org.brum.beds.ac.uk/10.3390/jrfm14100454