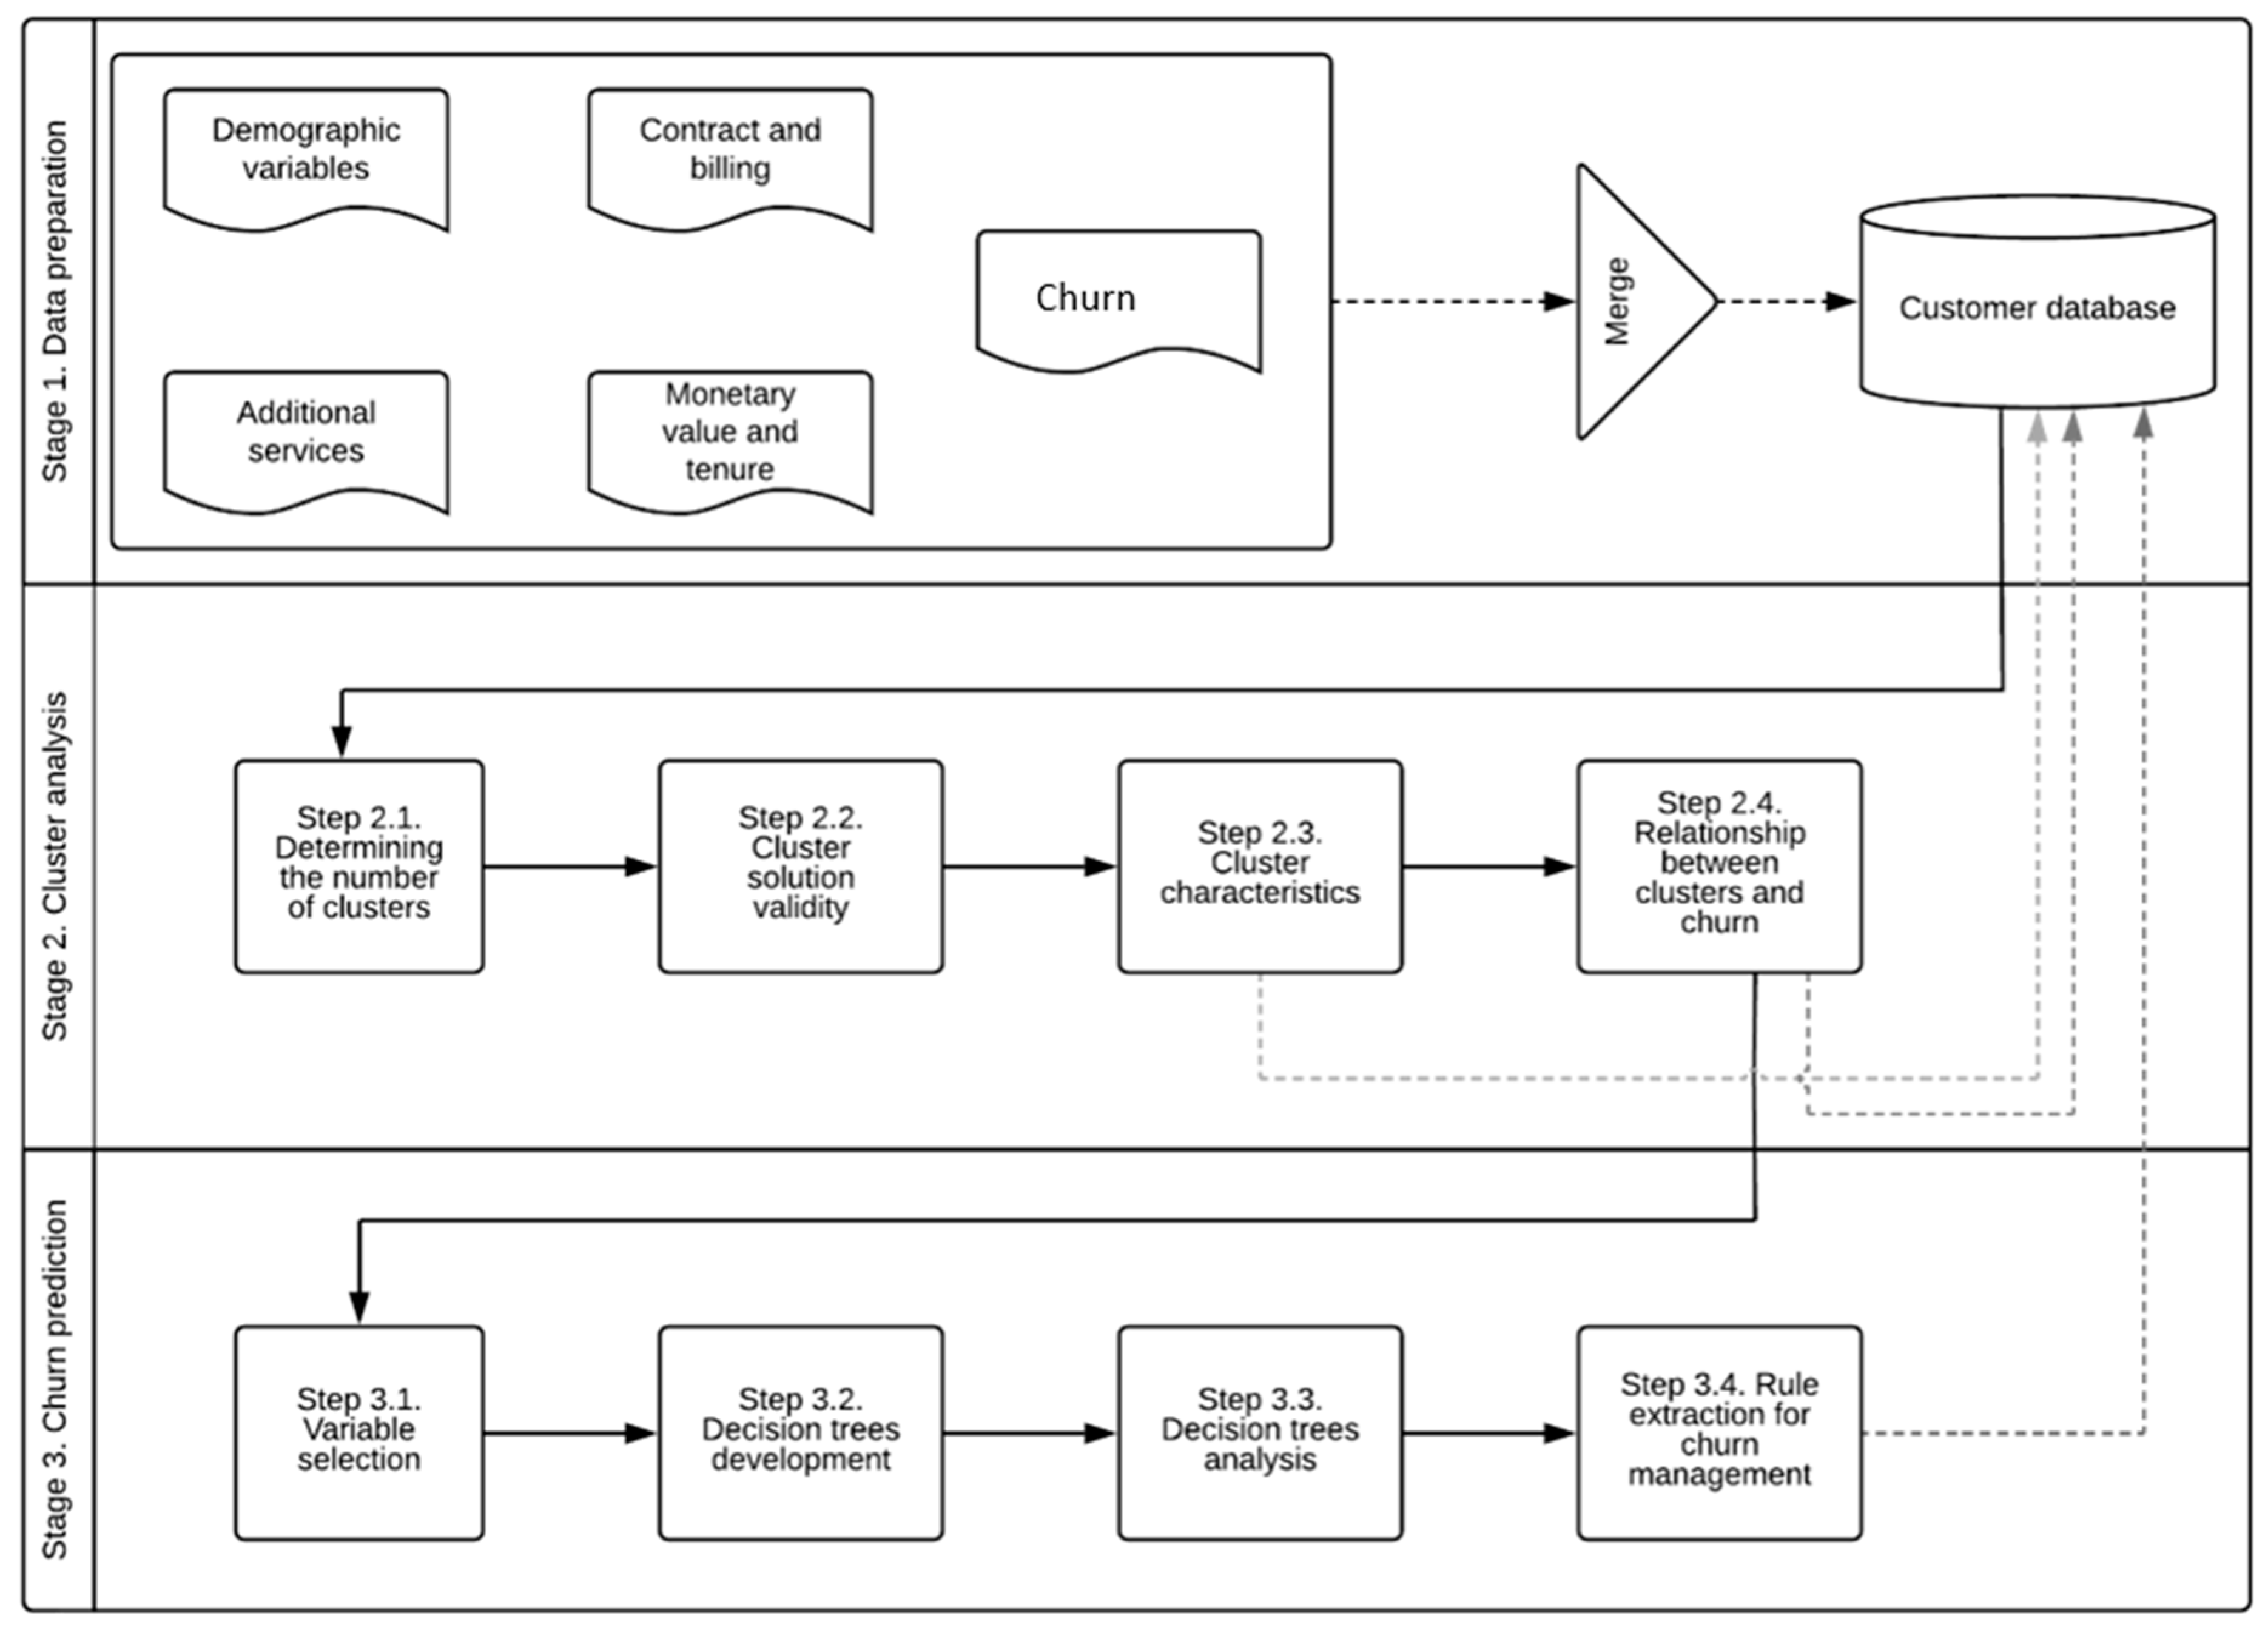
4.1. Stage 1. Data Preparation
The dataset used to demonstrate the proposed hybrid approach combining cluster analysis and decision trees was the Telco Customer Churn open dataset, which is available on the Kaggle platform—
https://www.kaggle.com/blastchar/telco-customer-churn (accessed on 9 November 2021). This dataset was selected since it contains heterogeneous variables that reflect customer demographic characteristics, usage of services and billing behavior.
Table 1 shows the variables used in the analysis. We divided the data into five groups: demographic variables, contracts and billing, additional services used, customer monetary value and tenure, and churn behavior. The prepared dataset includes 7032 customers with 20 variables.
The first group of variables contains demographic variables, and they are all binomial. The Gender variable is represented by two modalities, Female and Male, while the SeniorCitizen, Dependents and Partners variables are represented by two modalities, No and Yes.
The variables that describe the features of contracts and billing are Contract, PaperlessBilling and PaymentMethod. The Contract variable is related to the contract term of the customer. It is of a nominal type, and it has three modalities: month-to-month, one year and two years. The PaperlessBilling variable describes whether the customer has paperless billing. The PaymentMethod variable is a nominal-type variable with four modalities that show a customer’s payment method: Bank transfer, Credit card, Electronic check or mail.
The third group of variables describes additional services that the customers use. The InternetService variable is a nominal variable with three modalities, DSL, Fiber Optic and No. The DeviceProtection, OnlineBackup, OnlineSecurity, StreamingMovies, StreamingTV and TechSupport variables are all nominal-type variables with three possible modalities: No stands for not having contracted the service, No Internet service represents cases in which a customer does not use Internet service, and Yes refers to cases when customers use some of these services. The MultipleLines variable has three modalities: No describes cases when a customer does not use multiple phone lines, No phone service refers to instances in which a customer does not use phone services at all, and Yes is used when the customer has multiple phone lines.
The last group of variables describes customer monetary value and tenure. The Tenure variable is a numeric variable representing customer lifespan in months—the number of months the customer stayed with the company. The variables MonthlyCharges and TotalCharges are numeric numbers containing data on the amount charged to the customer, either monthly or in total (in USD).
The Churn variable is the dependent variable that is binomial and takes on two values, No and Yes, referring to customers who did not churn and customers who did churn, respectively.
4.2. Stage 2. Cluster Analysis
The k-means clustering algorithm was applied to group the customers according to the 19 observed variables’ values. All of the variables were included except for churn. Customers were assigned to a particular cluster based on the Euclidian distances as a distance measure. The maximum initial distance approach was used to estimate initial centroids (
Lee and Han 2012). A 10-fold cross-validation approach was applied to find the optimal clustering solution or the number of clusters with the lowest estimated error rate (intra-cluster variance), as successfully applied by the previous research (
Thomassey and Fiordaliso 2006). The Statistica (Version 13.05) software was used for the cluster analysis.
Step 2.1. Determining the number of clusters
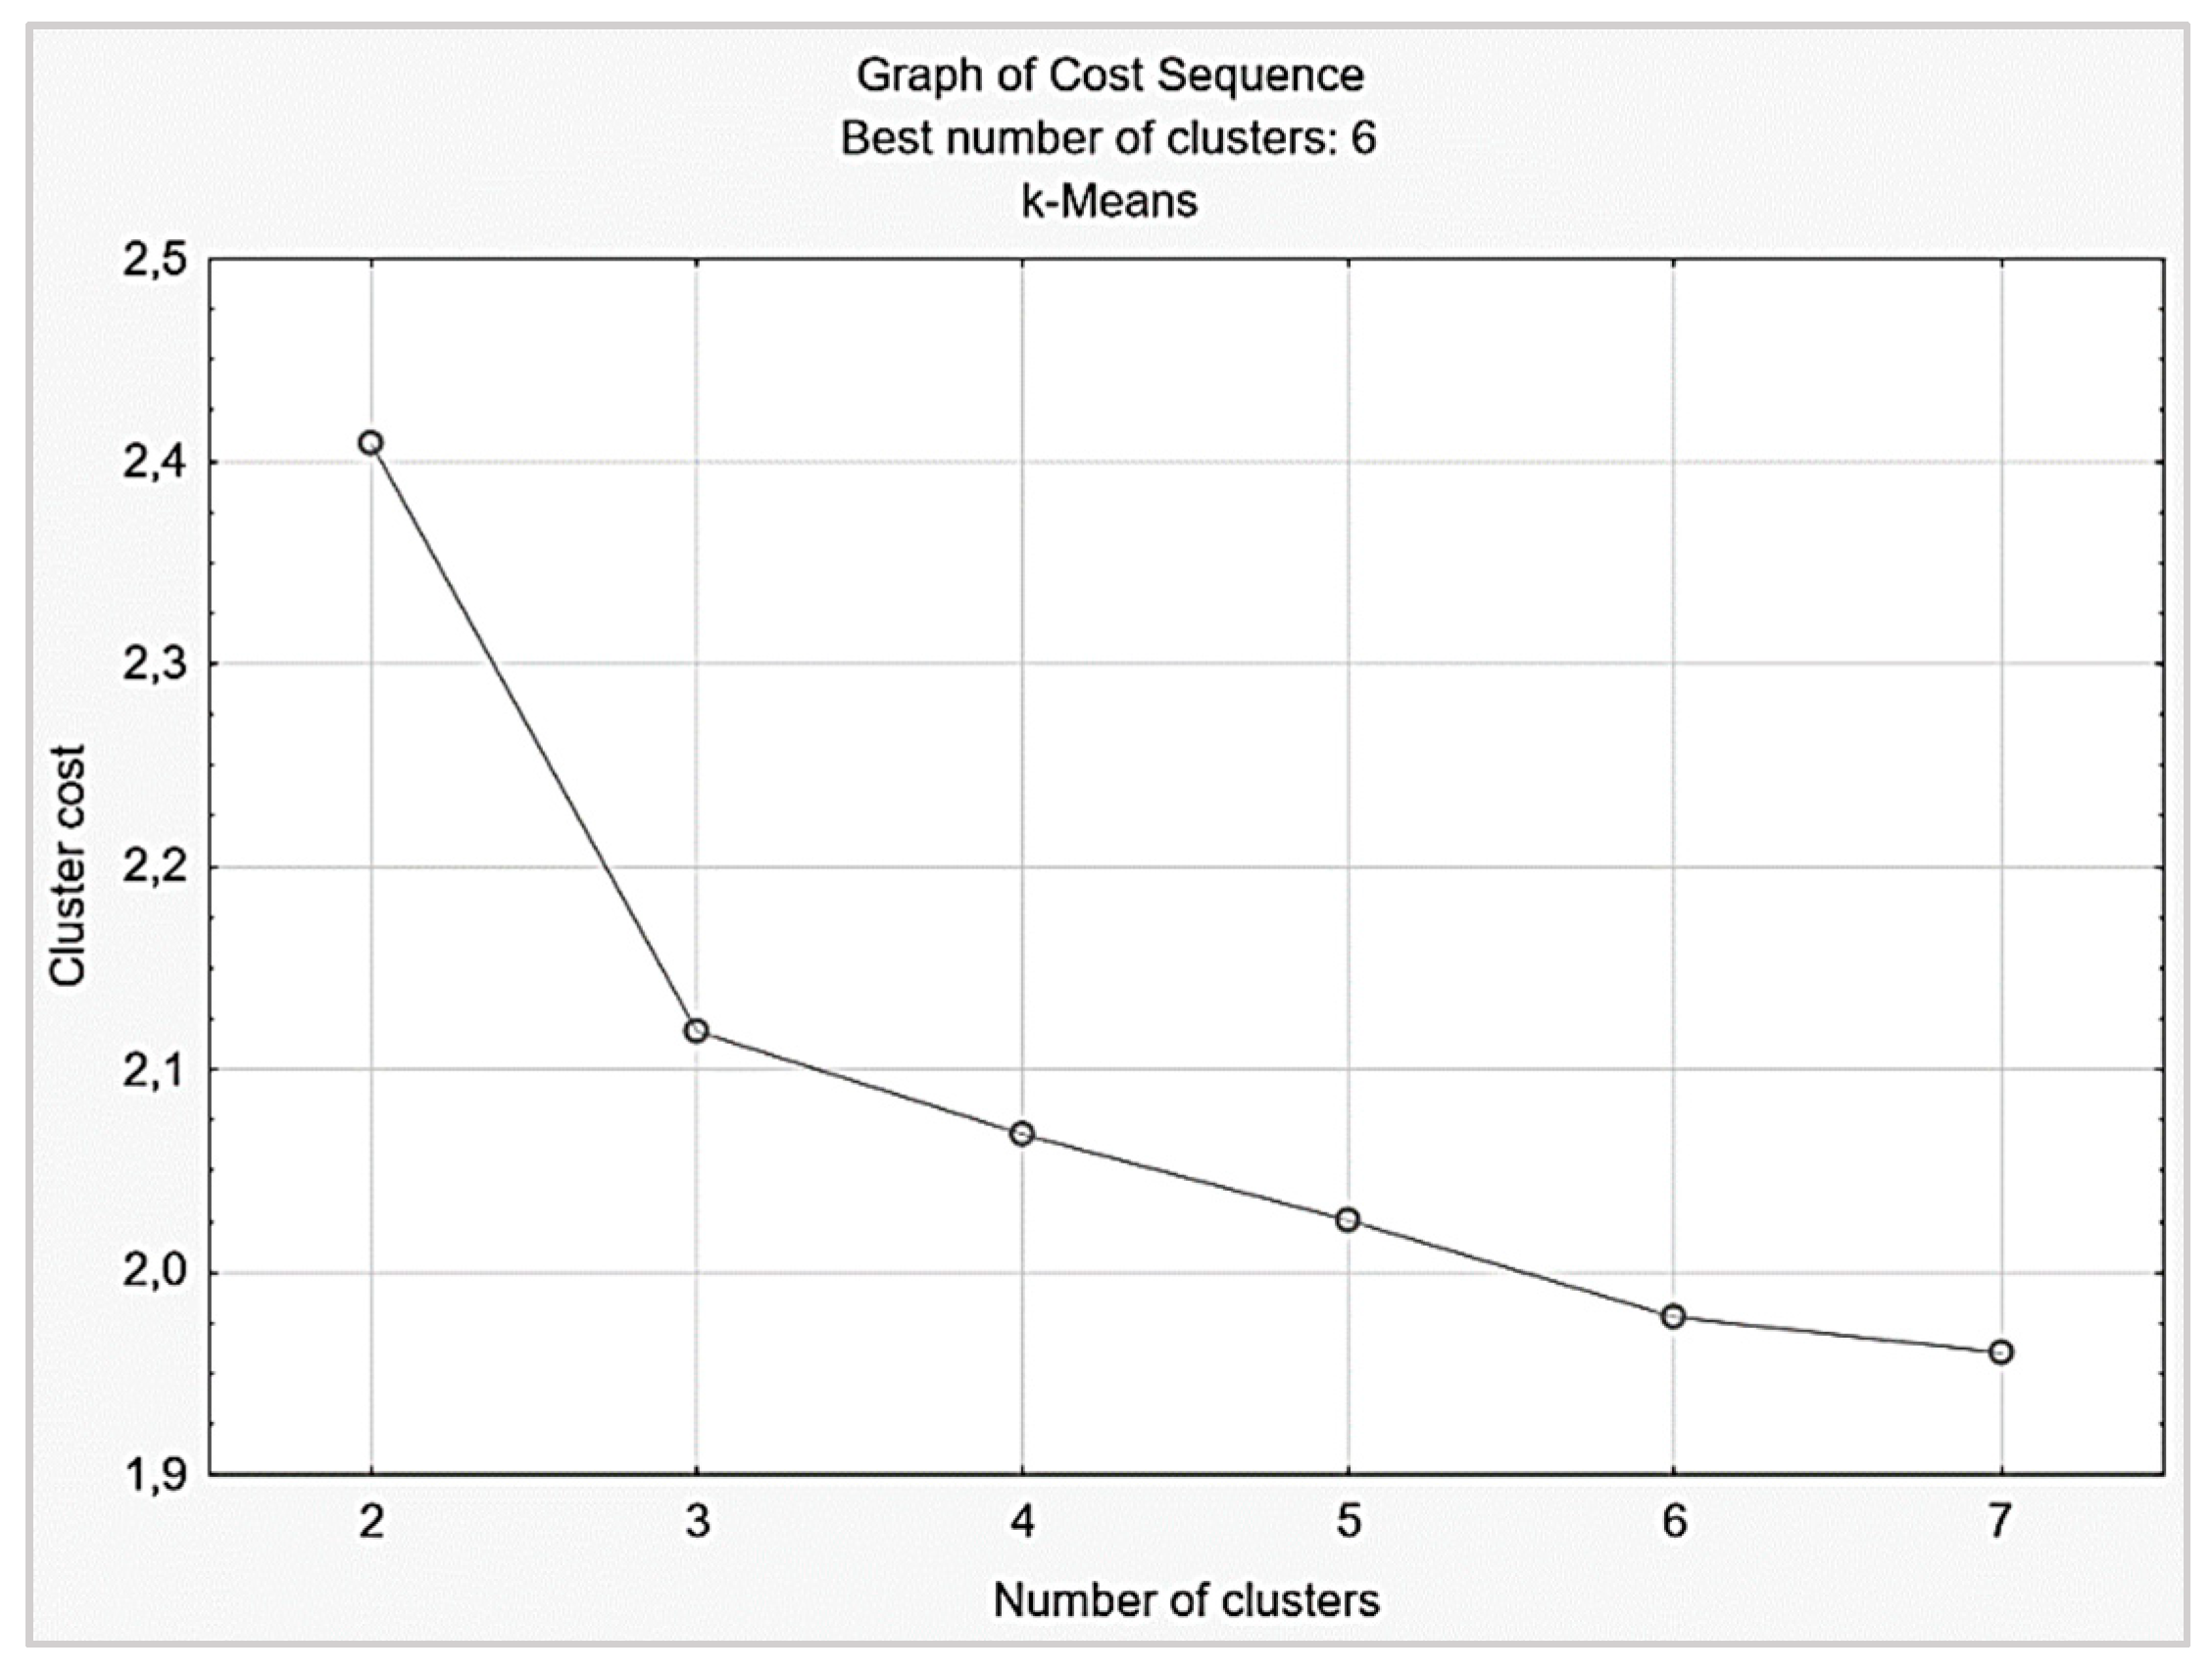
The optimal number of clusters was determined iteratively by utilizing 10-fold cross-validation. The cost sequence graph shows the error function for different numbers of clusters. As seen in the cost sequence graph (
Figure 2), the best number of clusters was six since the error function decreased up to the cluster solution with six clusters.
Step 2.2. Cluster solution validity
In
Table 2, the results of the ANOVA of the numeric variables used in the cluster analysis are shown for the solution with six clusters. All results of the ANOVA suggest that the null hypothesis, where it is stated that the means between the analyzed variables are equal, can be rejected.
Table 3 shows the values of chi-square statistics for the testing of differences between clusters according to nominal variables for the solution with six clusters. The values of the chi-squared test statistics for all variables and the associated
p-values indicate that the null hypothesis for each of the variables can be rejected. In other words, a conclusion can be made that differences between the clusters exist for all nominal variables.
Both the ANOVA and the chi-square analysis support the decision to use six clusters in the cluster analysis.
Step 2.3. Cluster characteristics
Table 4 presents the cluster characteristics. The largest cluster contained 1520 observations, whereas the smallest cluster consisted of 516 observations.
Demographic variables. The most common Gender of customers was male for Cluster 1, Cluster 3, Cluster 4 and Cluster 5, and female for Cluster 2 and Cluster 6. Non-senior citizens were the most common in all of the clusters. For Clusters 1, 2, 3 and 5, the customers without partners were in the majority, while the customers in Cluster 4 and 6 mostly had partners. In Cluster 6, most customers had children or partners they financially supported, while the customers in all other clusters mostly did not have dependents.
Contracts and billing. The month-to-month type of contract was the most common for Cluster 2, Cluster 3 and Cluster 6. One-year contracts prevailed in Cluster 1 while the Two-year contract constituted the majority for Cluster 4 and 5. The most common payment method was electronic check for Cluster 2, Cluster 3 and Cluster 6. Credit card as a payment method was found to be related explicitly to Cluster 1, bank transfer was identified as the most common payment method for Cluster 4, and mailed check was related explicitly to Cluster 5.
Additional services. Most customers from Cluster 4 used device protection. In other clusters, that was not the case; in other words, customers from Cluster 1, 2, 3 and 6 did not use device protection. The type of internet service that prevailed in Cluster 1 and 2 was DSL internet, and fiber optic was most common in Clusters 3, 4 and 6. Cluster 5 is unique insofar as most of the customers did not use internet service at all. When it comes to using multiple phone lines, it is noticeable that in Cluster 1, customers usually did not use phone service at all, Clusters 2, 5 and 6 contained customers who usually did not use multiple lines, and Clusters 3 and 4 contained those who used multiple lines. Usage of online backups was common for Cluster 4 and Cluster 6.
Members of Cluster 5 mostly did not use internet service. Therefore, they usually did not use additional online backups, online security, movie streaming, TV streaming, or technical support. However, they did use phone service.
Usage of online backups, movie streaming, and TV streaming was common in Cluster 4 and Cluster 6. However, those clusters differed in terms of technical support. In Cluster 4, most customers used technical support, while in Cluster 6, the opposite was the case. When it comes to other clusters, it is noticeable that online backup and streaming services were not used by the majority of customers in Clusters 1, 2 and 4. However, in Cluster 1, the majority of customers did use online security and technical support. Additionally, in Cluster 1, customers usually did not use phone service.
Customer monetary value and tenure. The length of a customer’s stay with the telecommunication service provider or tenure was measured in months. First, the tenure was the longest on average for customers in Cluster 4 (59.47 months). Clusters 1 and 7 were similar in terms of the tenure of their customers. Since Cluster 2 contained the customers with the shortest average tenure (14.28 months), telecommunication companies should pay more attention to them and possibly offer them additional services and one- or two-year contracts. New customers were found to be particularly vulnerable; therefore, if their experiences are not satisfactory, the relationship is likely to be short. Customers who were satisfied with the service provider and had high cumulative satisfaction tended to stay for longer durations.
The highest average monthly charges were in Cluster 4, related to the number of additional services. The majority of customers in that cluster also used many additional services. Interestingly, relatively high average monthly charges were related to Cluster 6. Those customers usually had month-to-month contracts and did not use some of the additional services. Telecommunication companies should consider additional offers or discuss signing long term contracts to ensure that those customers stay. Customers from Cluster 3 had relatively high average monthly charges, even though the majority of them did not use additional services. Telecommunications providers should take some precautions regarding those customers because they may become unsatisfied by high charges.
Total charges were highest on average in Cluster 4, which was expected due to the contract’s duration and monthly charges. On average, Cluster 5 had the lowest total charges due to the low monthly charges and the usage of only essential services such as phone service and one phone line.
Step 2.4. Relationship between clusters and churn
Table 5 presents results of chi-square analysis. They suggest that clusters were determined to be statistically different according to churn occurrence across the clusters at the 1% significance level (Pearson chi-square 1080.666;
p-value 0.000).
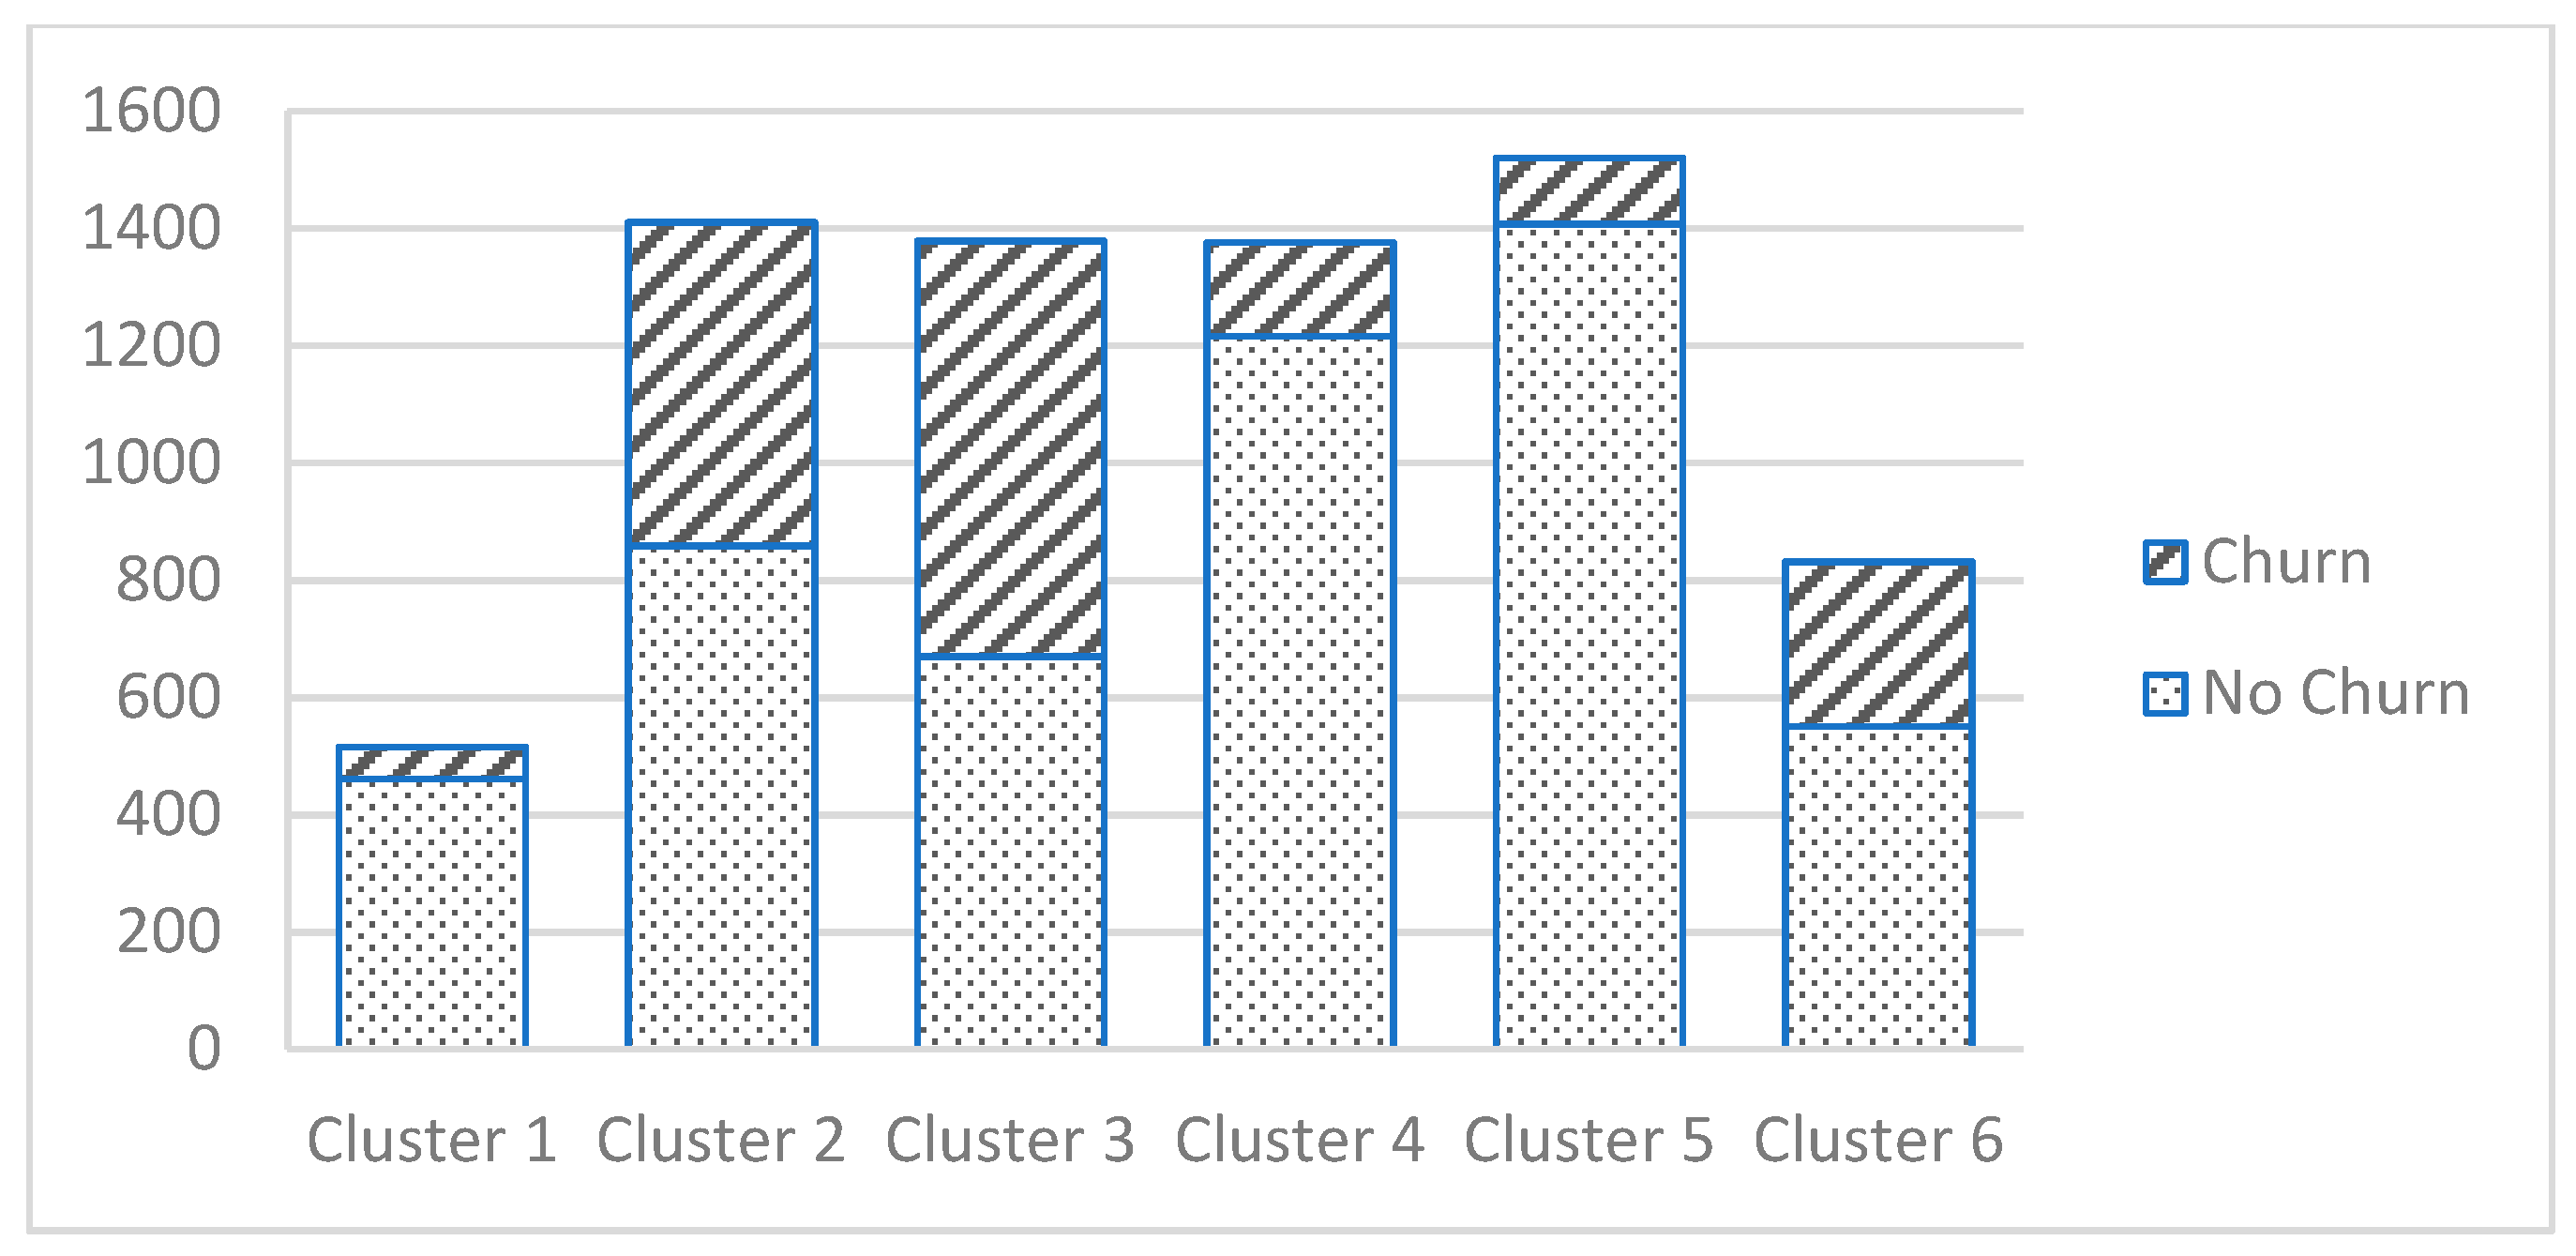
In total, almost a third of the customers (26.58%) were found to be churners. The highest absolute and the relative number of churn cases was identified in Cluster 3 (708 cases, 51.38%). Cluster 2 was the second for churn occurrence with 552 cases and 39.15% of a total of 1410 customers in that cluster. Cluster 5, which was the largest (1520 customers), had the lowest occurrence of churn—113 customers or 7.43% of customers in that cluster. Cluster 6 was third according to churn occurrence (281 or 33.77% of a total of 832 customers in that cluster). In all of these clusters, the majority of customers had a month-to-month contract.
It can be concluded that the Cluster 2 and Cluster 3 customers were those with the highest churn occurrence (
Figure 3). These clusters were selected to be used in further analyses, with decision tree analysis being utilized for churn prediction.
4.3. Stage 3. Churn Prediction
In the third stage, the variables were selected using the Feature Selection and Variable Screening features delivered by the Statistica software (Version 13.05). Decision trees were developed for the clusters with the highest churn rate using the SPSS software (Version 22).
Step 3.1. Variable selection
In this step, the variables were screened to select the variables used for the churn prediction step.
Table 6 contains the Feature Selection and Variable Screening results.
The chi-square and p-values indicated that the most important predictor of churn was the Contract variable (chi-square 1179.543; p-value 0.000), followed by Tenure (chi-square 873.717; p-value 0.00). The least important predictors of churn were the Gender and PhoneService variables. Therefore, they were not selected to be used in further analyses. All of the other 17 variables were selected to construct the CHAID decision trees.
Step 3.2. Decision trees’ development
CHAID decision trees were generated at the level of the entire dataset, as well as separate clusters. Independent variables were selected in the previous step. The dependent variable was the churn binary variable.
Table 7 presents the percentages of correct classifications for the decision trees. The decision tree of Cluster 3 was identified as the most successful in predicting churners as compared to the decision trees of other clusters. It correctly classified 81.4% of all churners. The decision tree for Cluster 2 was found to be also successful in its prediction, with 70.7% of churners correctly classified.
Since Cluster 2 and Cluster 3 had the highest prediction accuracy for churn and were in the same time clusters with the highest ratio of churn customers, it is recommended that the marketing department conduct the churn analysis solely for these groups of customers.
Step 3.3. Decision tree analysis
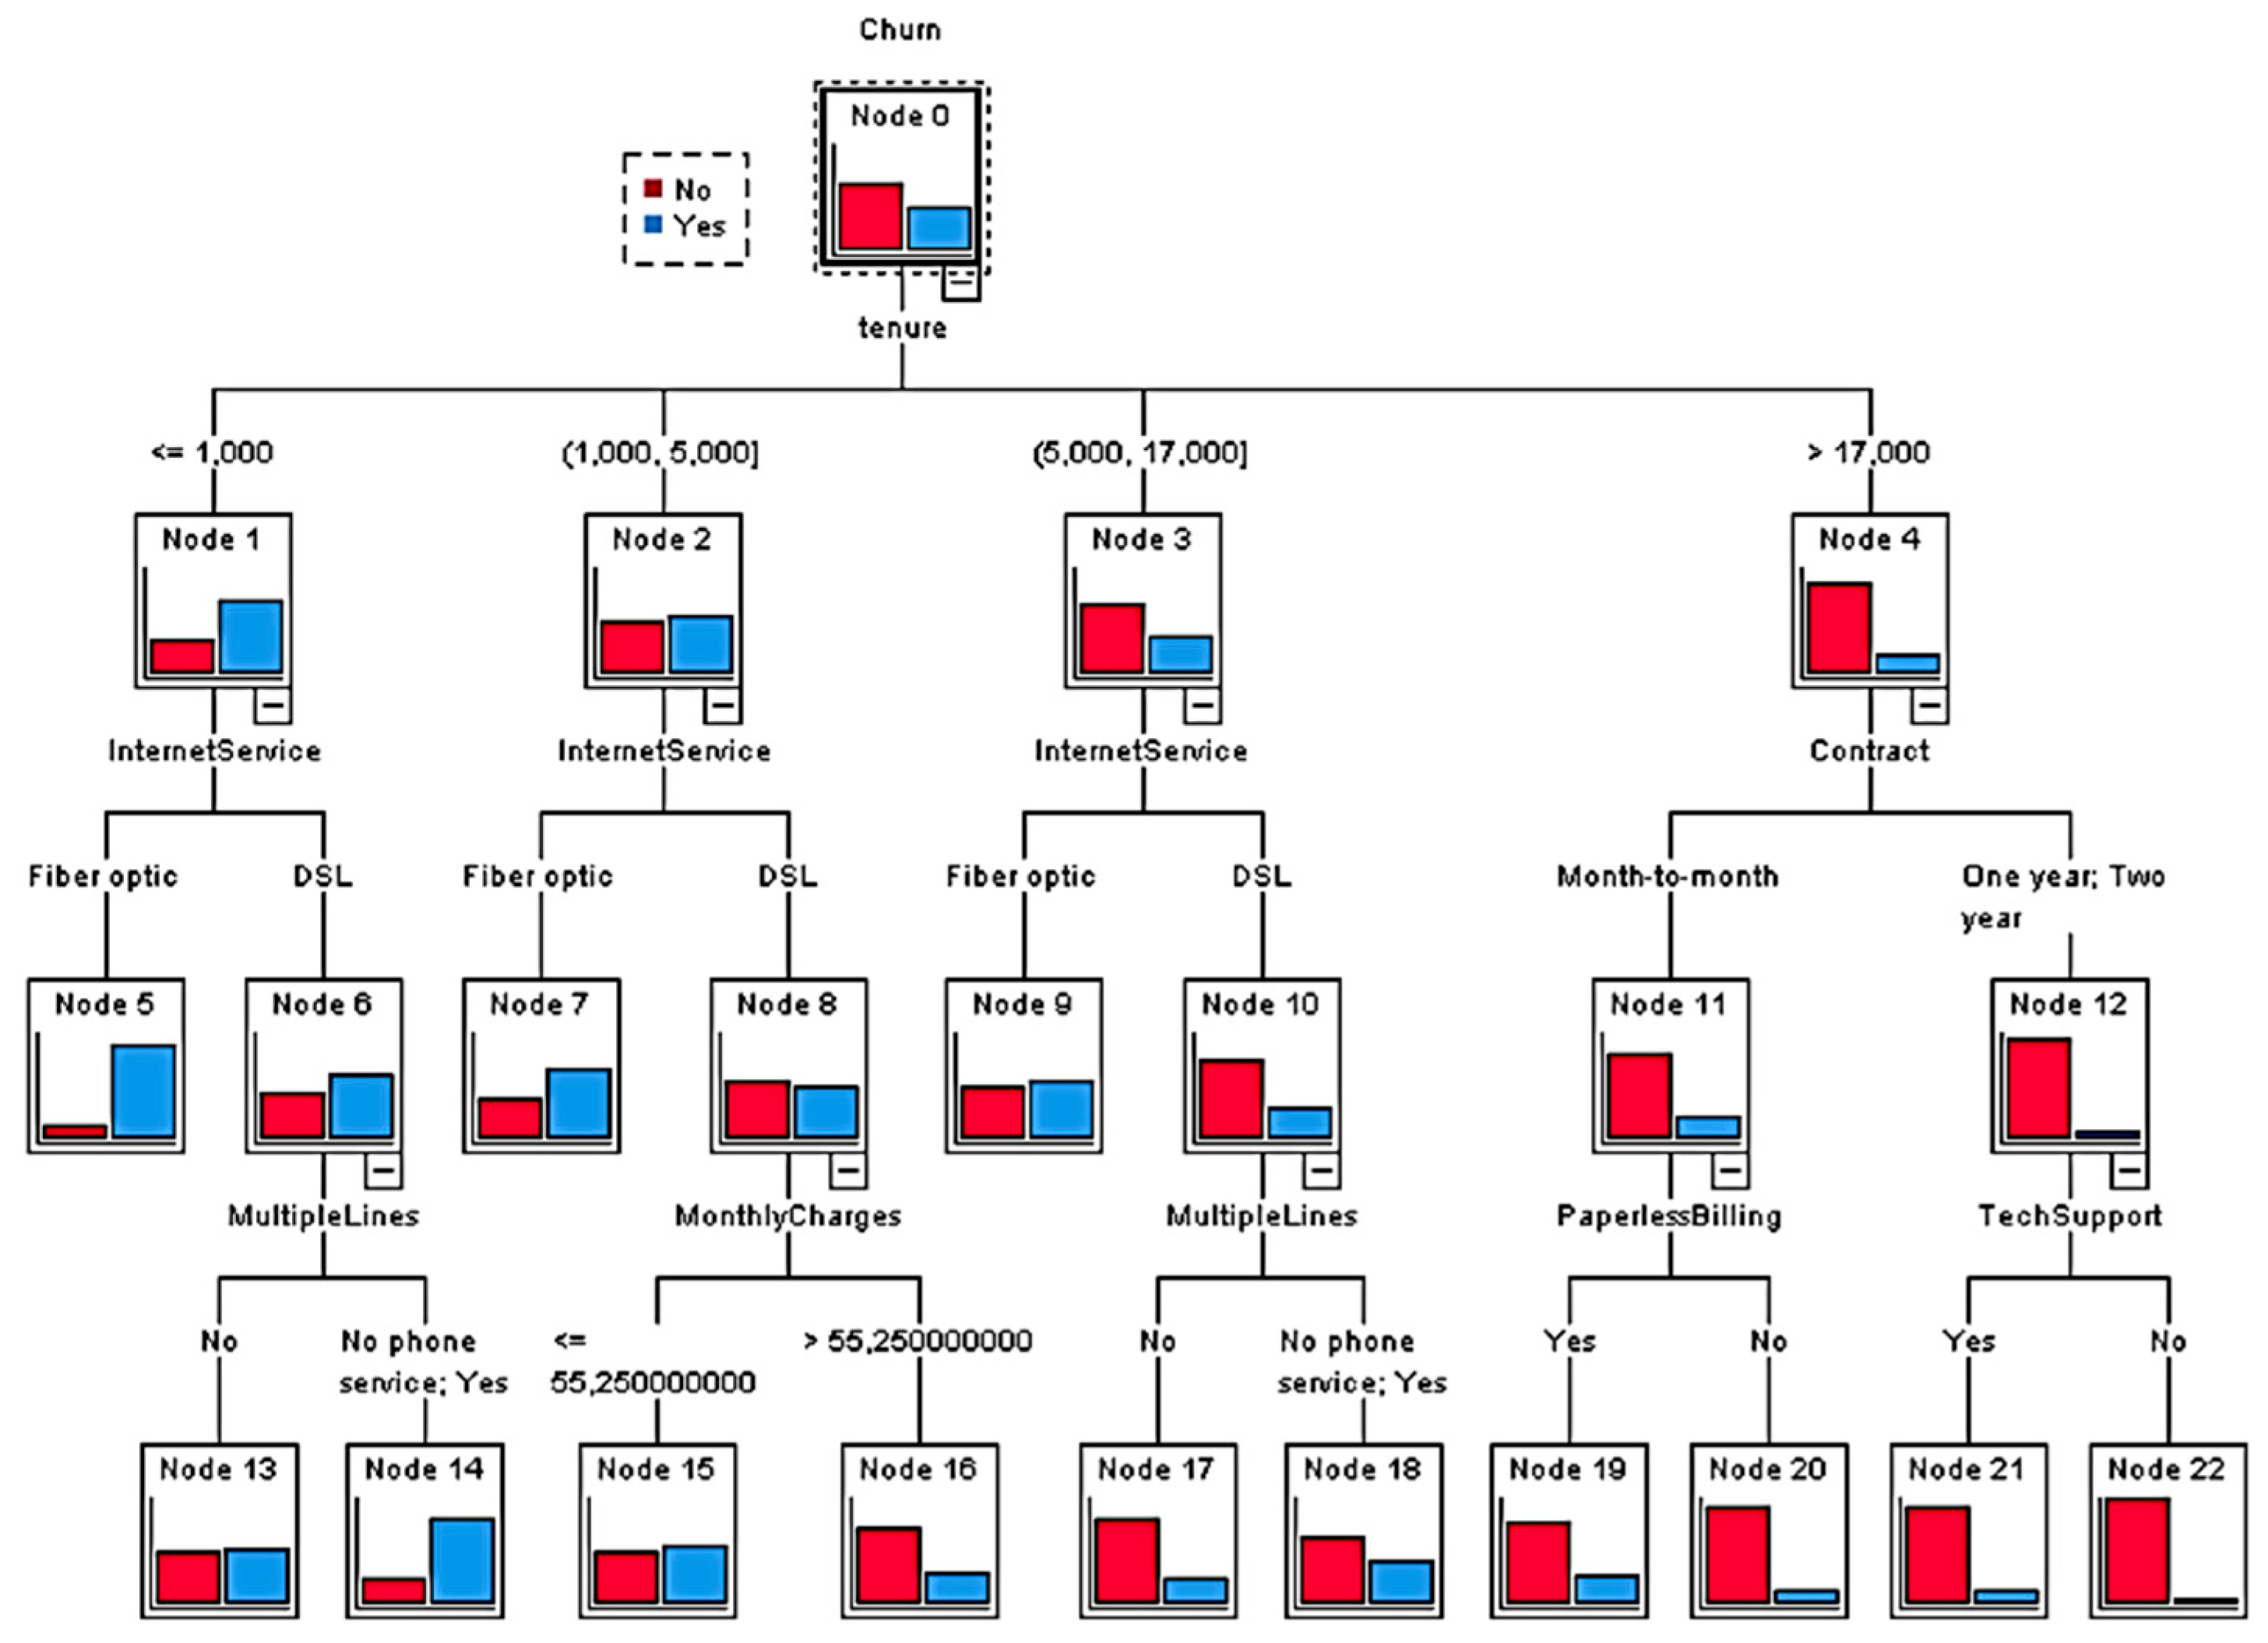
Figure 4 presents the decision tree developed for the customers in Cluster 2 with three levels and 23 nodes, of which 13 were considered terminal (leaf nodes).
Figure 3 reveals that the Tenure, Internet service, Contract, Multiple Lines, Monthly Charges, Paperless Billing and TechSupport variables were statistically significant and used the classification tree provided by the CHAID algorithm.
The variable that was used for branching on the first level was the Tenure variable. This branching resulted in four new nodes (Node 1, Node 2, Node 3 and Node 4). Node 1 included category ≤1.000 and consisted of customers who were mostly suspected of churning. Node 2 included customers who stayed with the company for between one and five months. It had slightly more customers suspected of churning than not suspected of churning. Node 3 included customers who had been with the company for between five and seventeen months. Node 4 included those who had been with the company for more than seventeen months. In both of them, the share of suspected churners was found to be greater than the share of non-suspected churners.
The variable Internet service was used for branching Node 1, Node 2 and Node 3 on the second level, while the variable contract was used for branching Node 4. Node 5 and Node 6 were derived from Node 1. Node 5 was related to the category of customers who used fiber optic. It is noticeable that majority of them were connected with suspected churn. Regarding Node 6, which was related to the category of customers who used DSL, it was shown that there was a more significant share of customers suspected of churning than the share not suspected of churning. However, the ratio between suspected churners and non-churners was much higher for fiber optic users. Similar results were shown for Node 7 and Node 8, which were derived from Node 2. Node 7 had a high share of suspected churners. Node 8 contained customers who used DSL, and it also contained a higher share of suspected non-churners than suspected churners. Node 3 branched to Node 9 and Node 10. For Node 9, which contained fiber optic customers, there was a slightly more significant share of suspected churners than non-churners. Node 10 showed a significantly larger share of suspected non-churners compared to churners. Node 4 had two branches, Node 11 and Node 12. Node 11 contained customers with a month-to-month contract, and Node 12 contained customers with One-year and Two-year contracts. In both of the nodes, there was a larger share of suspected non-churners compared to suspected churners. However, the share of non-churners for Node 11 was more significant compared to Node 12.
The third level branching variables were MultipleLines, MonthlyCharges, PaperlessBilling and TechSupport. The MultipleLines variable was used to further branch Node 6 into two nodes (Node 13 and Node 14). Node 13 consisted of customers who did not have multiple lines. Node 14 consisted of customers who had multiple lines or who did not have phone service. For Node 14, there was a significantly larger share of suspected churners compared to non-churners.
The MultipleLines variable was also used to branch Node 10 into two nodes (Node 19 and Node 20) in which, for both cases, there was a larger share of suspected non-churners than churners. Node 9 was branched using the Monthly Charges variable (Node 15 and Node 16). Node 15 contained customers who were charged for service at a price of 55.25 dollars or less per month. In that node, more than half of the customers were suspected of churning. In Node 16, which contained customers who paid more than 55.25 dollars per month for telecommunication services, there was a significantly larger share of not churners than churners. The PaperlessBilling variable was used to branch Node 11 into two nodes (Node 19 and Node 20). In both of those nodes, there was a larger share of non-churners compared to churners. There was a slightly higher share of churners in Node 19 compared to Node 20. Finally, Node 12 was branched to two nodes (Node 21 and 22) using the TechSupport variable. Node 21 contained customers who used technical support as an additional service. There was also a higher share of churners in Node 21 compared to Node 22. In both of the nodes, there was a higher percentage of non-churners compared to churners.
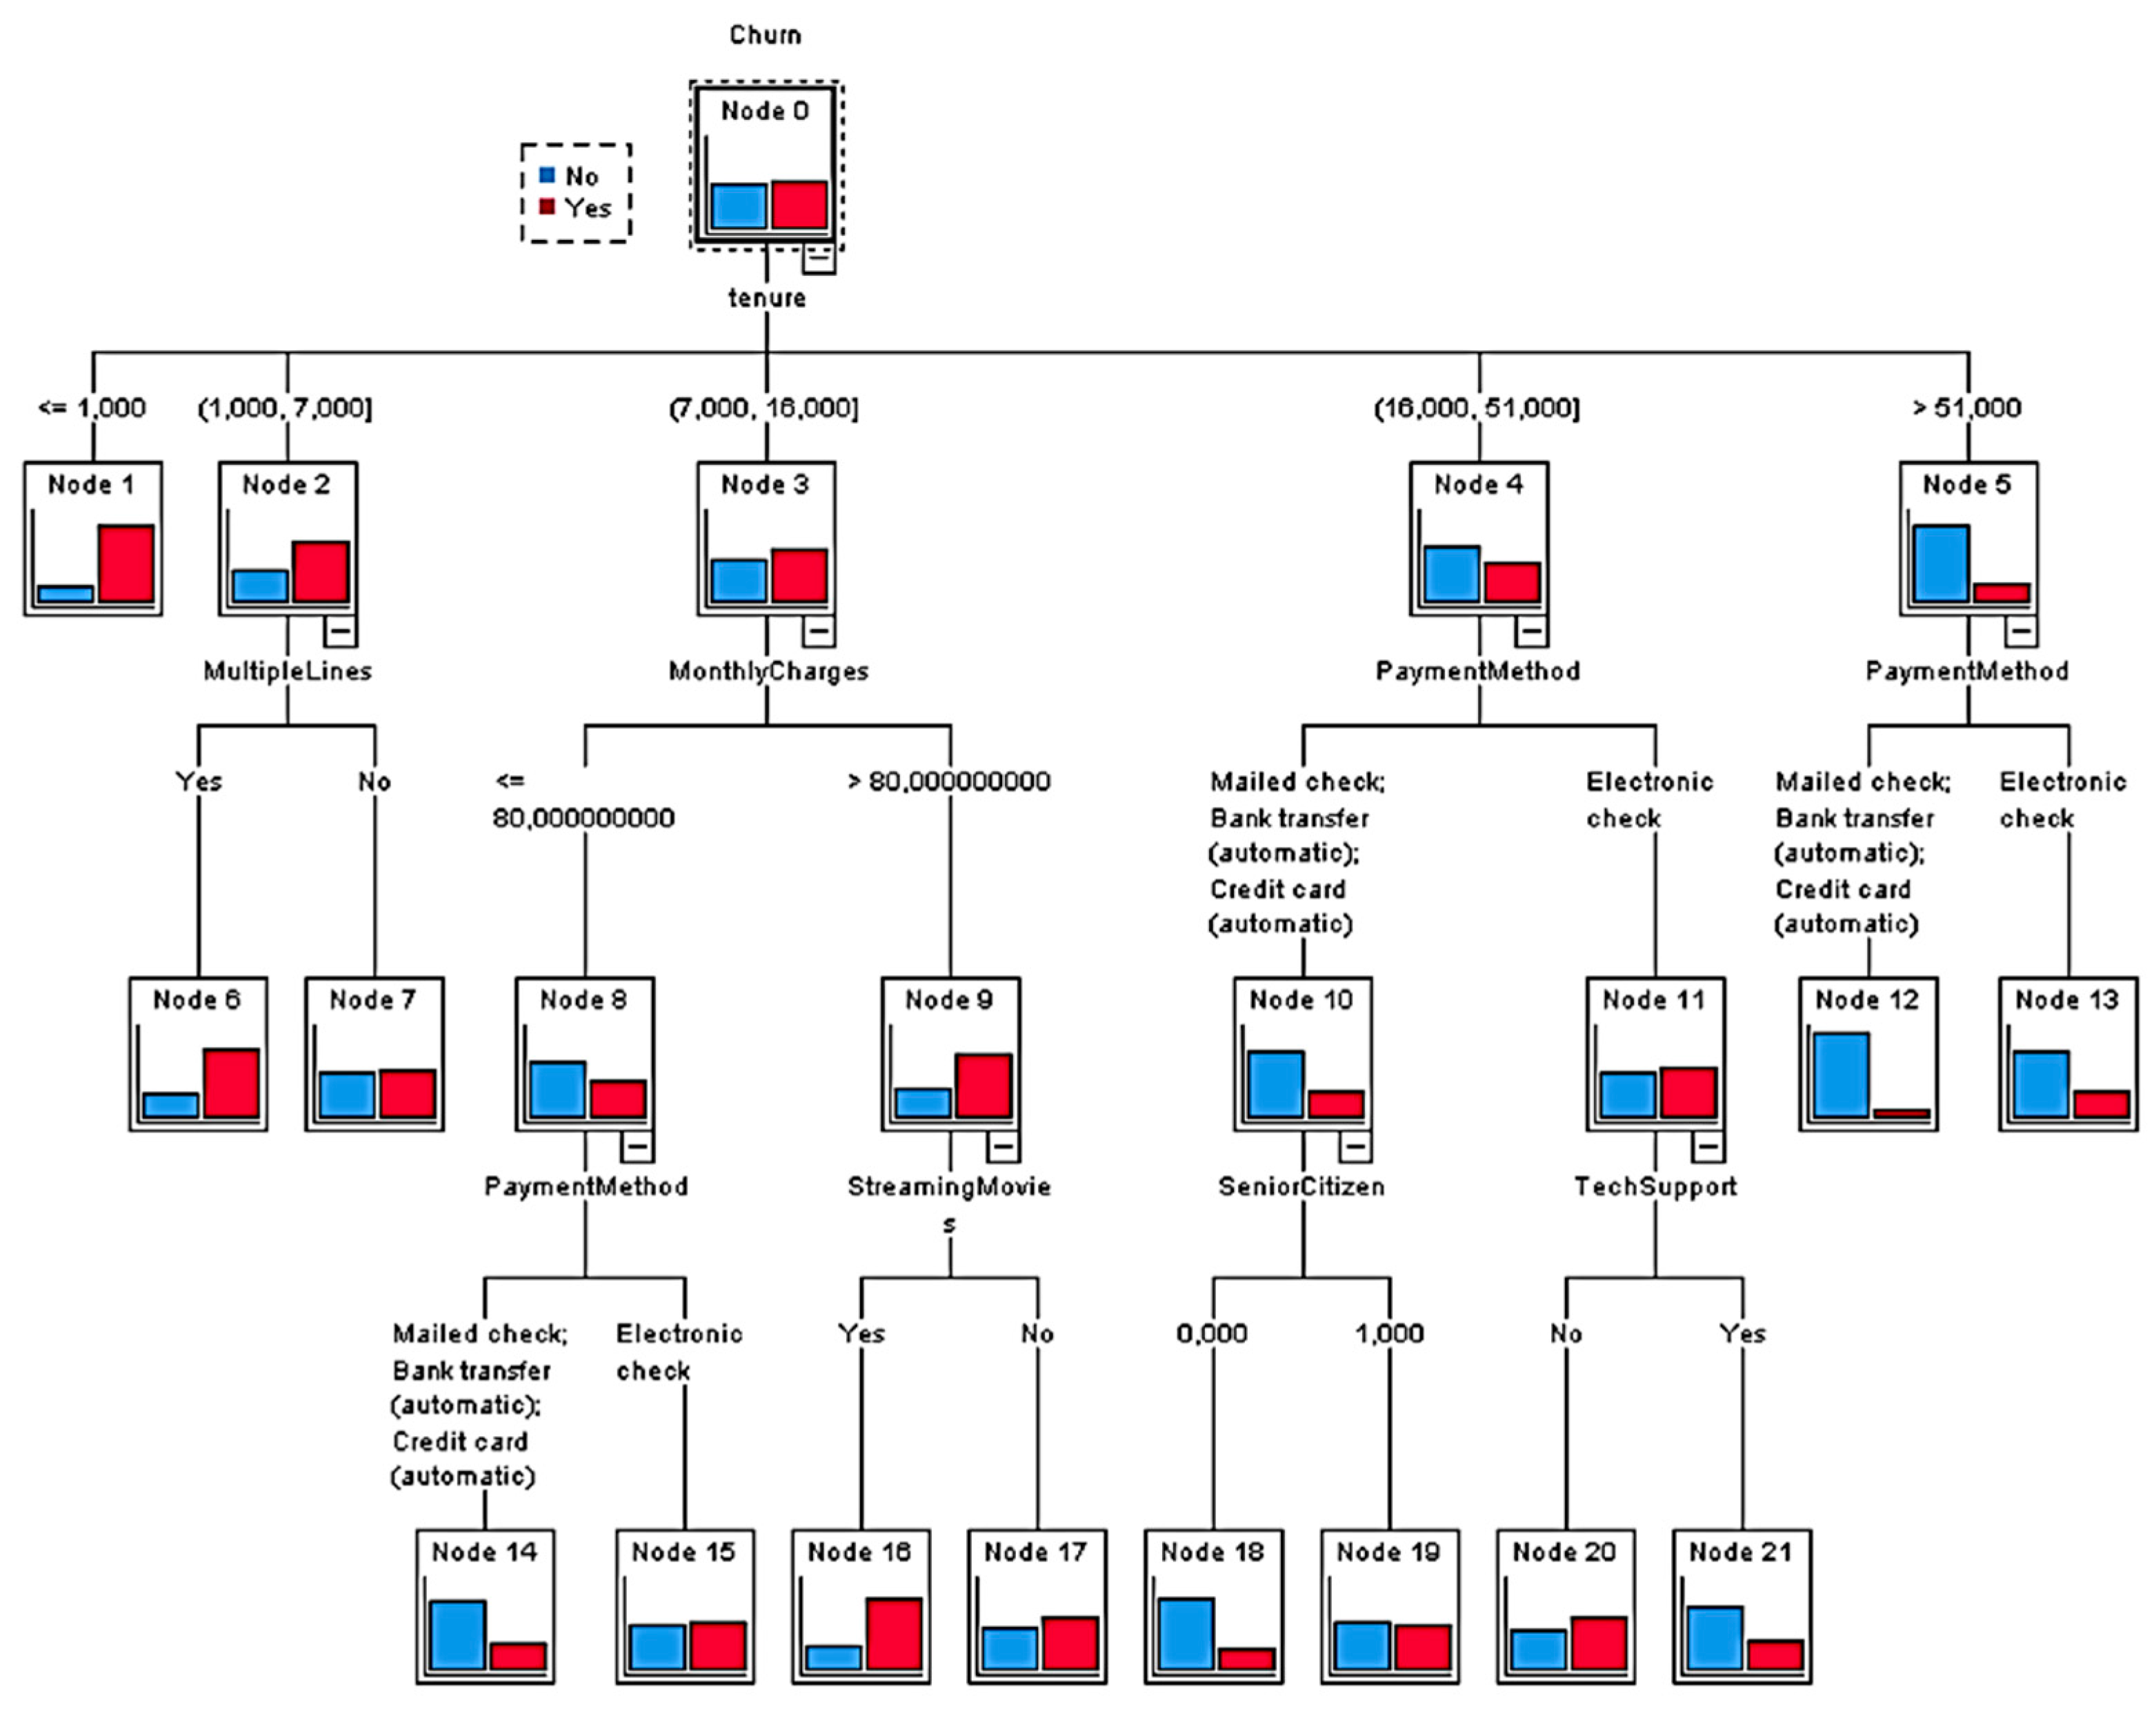
Figure 5 presents the decision tree developed for the customers in Cluster 3. The CHAID decision tree developed using the data on customers from Cluster 3 had three levels and 22 nodes, of which 13 were considered terminal.
Figure 4 reveals that Tenure, Internet service, Multiple Lines, Monthly Charges, PaymentMethod, StreamingMovie, Senior Citizen, and TechSupport were statistically significant, and these were used to build the classification tree using the CHAID algorithm.
The variable that was used for branching on the first level was the Tenure variable. This branching resulted in four new nodes (Node 1, Node 2, Node 3, Node 4 and Node 5). Node 1 included category ≤1.000 and consisted of customers who were mostly suspected of churning. Node 2 included customers who stayed with the company for between one and seven months. It had significantly more customers suspected of churning than not suspected of churning. Node 3 included customers who had been with the company for between seven and fifteen months. It had more customers suspected of churning than not suspected of churning. Node 4 included those who had been with the company for between and fifteen months, and Node 5 included customers who had been with the company for more than 51 months. In both of them, the share of suspected churners was greater than the share of non-suspected churners. However, in Node 5, the share of non-churners was significantly larger.
The second level branching variables included the MultipleLines variable for Node 2, the MonthlyCharges variable for Node 3 and the PaymentMethod variable for Node 4 and Node 5. According to
Figure 3, branching resulted in eight nodes. Node 6 and Node 7 were derived from Node 2. Node 6 was related to the category of customers who used multiple phone lines. It is noticeable that a majority of them were associated with suspected churn.
Regarding Node 7, which was related to the category of customers who did not use multiple lines, it was shown that there was a slightly more significant share of customers suspected of churn than the share who were not suspected of churn. However, the ratio between suspected churners and non-churners was much higher for customers who used multiple lines. Furthermore, Node 8 and Node 9 were derived from Node 3, which was branched using the Monthly Charges variable. Node 9, in which the monthly charges were higher than 80 dollars per month, had a higher share of suspected churners.
Node 4 was branched into Node 10 and Node 11 using the PaymentMethod variable. Node 10 contained customers who paid for their service by mailed check, bank transfer and credit card, whereas Node 11 contained customers who paid by electronic check. Node 10 contained a significantly larger share of non-churners than churners. Node 11 contained a slightly more significant share of churners. Additionally, Node 5 was branched to Node 12 and Node 13 using the Payment Methods variable. Node 13, which contained customers who paid for their service by electronic check, had a larger share of churners than Node 12.
The third level branching variables included the PaymentMethod variable for Node 8, the StreamingMovies variable for Node 9, the SeniorCitizen variable for Node 10 and the TechSupport variable for Node 11. Node 8 was branched further into two nodes (Node 15 and Node 15). Node 14 consisted of customers who paid for their service by mailed check, bank transfer or credit card. For Node 14, there was a significantly larger share of non-churners compared to churners. Node 15 consisted of customers who paid for their service by electronic check. More than 50% of customers from Node 15 were churners. The StreamingMovies variable was used to branch Node 9 into two nodes (Node 16 and Node 17). There was a larger share of suspected non-churners compared to churners, but the share was more significant for Node 16, which contained customers who used movie streaming services. Node 10 was branched using the SeniorCitizen variable (Node 18 and Node 19). For the SeniorCitizen variable the value 0,000 represented non-senior customers, and 1,000 represented senior citizens. Therefore, node 18 contained non-senior customers. A significantly larger share of these customers were not suspected of churning. Node 19, which contained senior citizens, contained a larger percentage of churners than Node 18. The TechSupport variable was used to branch Node 11 into two nodes (Node 20 and Node 21). Node 20 was related to customers who did not use technical support. It was shown that more than 50% of them were suspected of churning. Finally, in Node 21, which contained customers who used technical support as an additional service, a significantly higher percentage of customers were suspected of being non-churners than churners.
Step 3.4. Rule extraction for customer relationship management
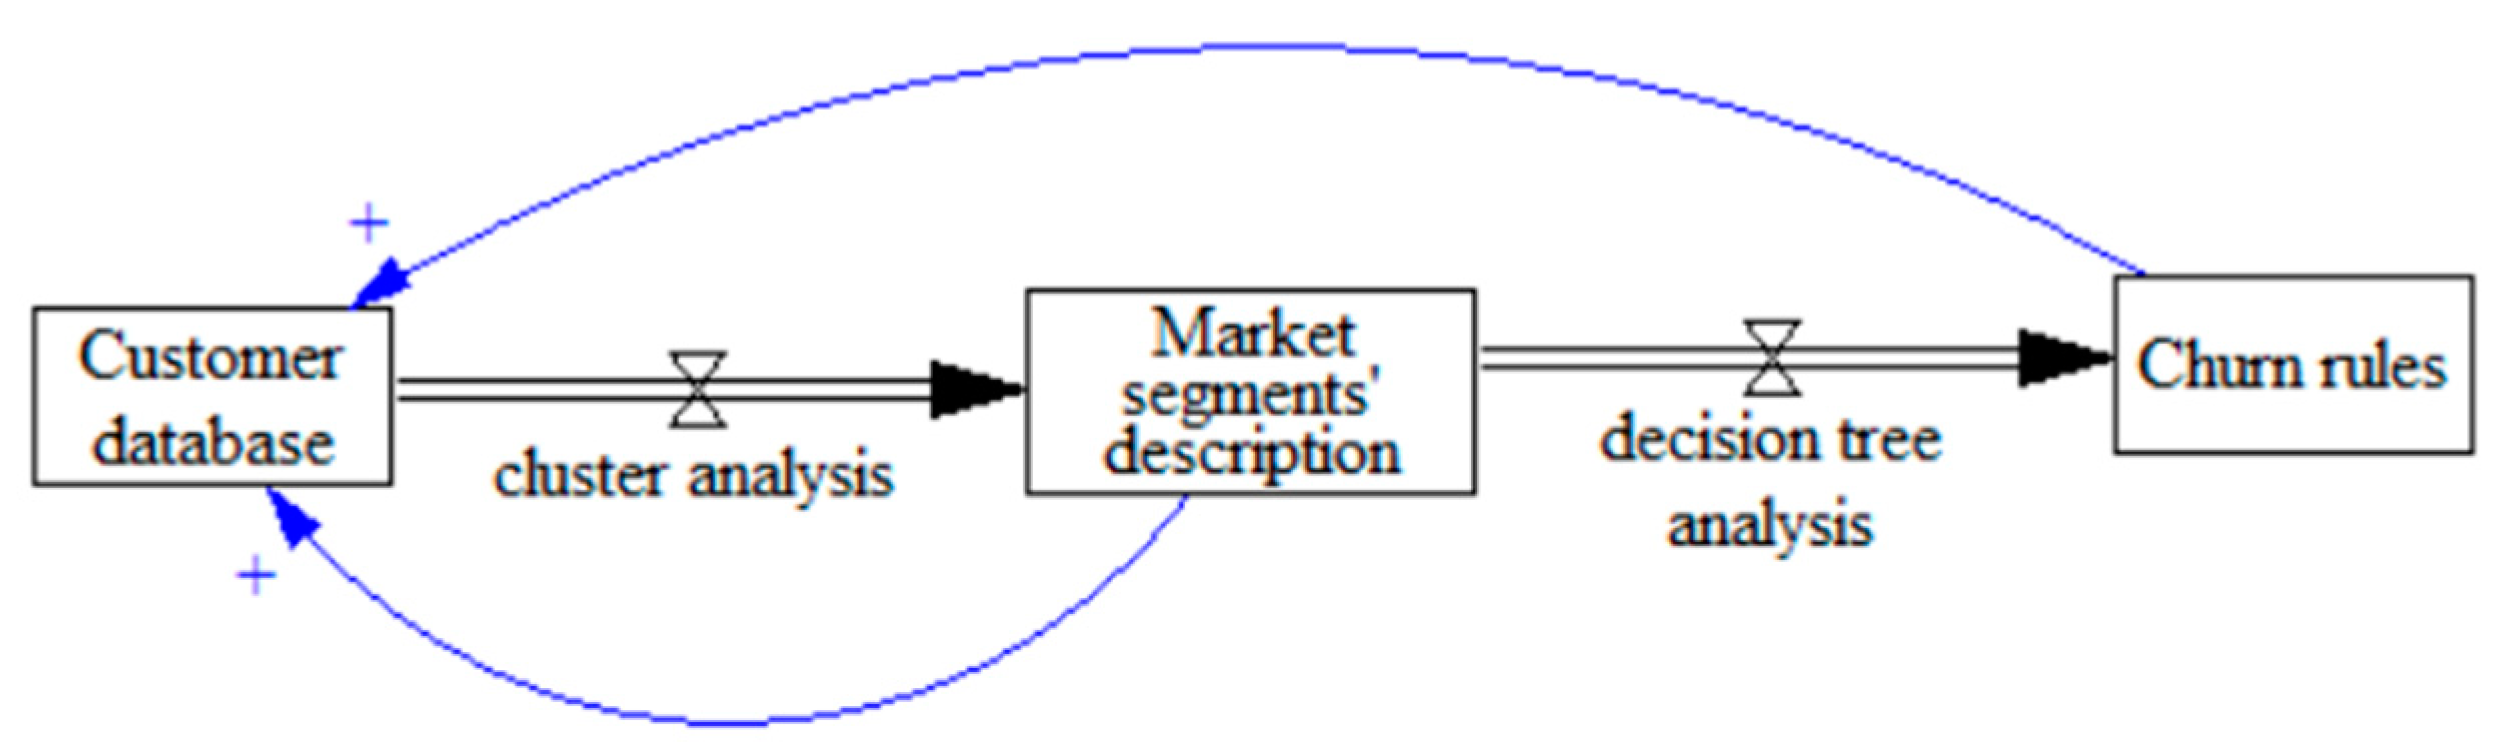
Decision trees result in the rules that can identify particular groups of customers who require special attention. In this research, the rules were used to identify groups of customers who are likely or unlikely to churn. These rules could be fed back to the customer database and be used for targeted marketing campaigns, e.g., providing incentives to the customers who were likely to churn.
The rules that predicted that customers in Cluster 2 and Cluster 3 were likely to churn for are provided in
Appendix B. The rules described the specific characteristics of customers who belonged to one of the terminal nodes. For example, the rule indicated that the customers in Node 6 of Cluster 2 had a tenure shorter than one year, used fiber optic, and had an 88.17% probability of churning. In such cases, the company may decide to offer incentives to this specific group of customers. Furthermore, since these customers were using the fiber optic to connect to the Internet, the quality of the fiber optic connection could be further investigated for these specific customers it could be determined whether there were systematic problems with their internet connections.


