
Measurement of Economic Forecast Accuracy: A Systematic Overview of the Empirical Literature


The Institute of Economics, Zagreb, Trg J.F. Kennedya 7, 10000 Zagreb, Croatia
J. Risk Financial Manag. 2022, 15(1), 1; https://0-doi-org.brum.beds.ac.uk/10.3390/jrfm15010001
Submission received: 26 October 2021
/
Revised: 9 December 2021
/
Accepted: 14 December 2021
/
Published: 21 December 2021
(This article belongs to the Special Issue Economic Forecasting)
Abstract
:The primary purpose of the paper is to enable deeper insight into the measurement of economic forecast accuracy. The paper employs the systematic literature review as its research methodology. It is also the first systematic review of the measures of economic forecast accuracy conducted in scientific research. The citation-based analysis confirms the growing interest of researchers in the topic. Research on economic forecast accuracy is continuously developing and improving with the adoption of new methodological approaches. An overview of the limits and advantages of the methods used to assess forecast accuracy not only facilitate the selection and application of appropriate measures in future analytical works but also contribute to a better interpretation of the results. In addition to the presented advantages and disadvantages, the chronological presentation of methodological development (measures, tests, and strategies) provides an insight into the possibilities of further upgrading and improving the methodological framework. The review of empirical findings, in addition to insight into existing results, indicates insufficiently researched topics. All in all, the results presented in this paper can be a good basis and inspiration for creating new scientific contributions in future works.
1. Introduction
Accuracy is one of the most important criteria in evaluating forecast quality. Some of the most significant factors determining the accuracy of economic forecasts are as follows: the expertise of forecasters, quality of the data and model, unforeseen events and uncertainty, social and political circumstances, financial stability, and forecast adjustment (Groemling 2002; Clements and Hendry 2008; Davydenko and Fildes 2013; Abel et al. 2016). The accuracy of economic forecasts is of great importance primarily due to the application of forecasts in decision making (Diebold and Mariano 1995). Reliable economic forecasts build confidence and certainty in an economy and allow economic subjects and individuals to feel more optimistic and make more efficient decisions. However, inaccurate forecasts, whether they underestimate or overestimate, have consequences in the form of wrong decisions and increasing costs (Q. Chen et al. 2016; Dovern and Jannsen 2017). Forecasts are, therefore, essential for all economic activity (Zarnowitz and Lambros 1987; Makridakis et al. 2009; Swanson and van Dijk 2012). Unforeseen events may arise in the future and create uncertainty and risks, and the fact that predictions may be inaccurate creates a serious dilemma for policy makers (Makridakis et al. 2009; Clements 2014).
Observing the measurement of forecasting accuracy, Llewellyn and Arai (1984) stated that at first sight, it seems straightforward to determine the accuracy of forecasts—simply compare what was forecast with what happened. However, the issue is rather more complicated. First, all forecasts are based on assumptions, which may or may not be confirmed as correct in the real world. Second, economic policy may be modified after a forecast has been made, thus affecting the final outcome (Llewellyn and Arai 1984; Sims 2002).
The aim of this study is to identify, analyze and critically appraise relevant research on the measurement of economic forecast accuracy. The key research questions are as follows: What are the most cited studies on the measurement of economic forecast accuracy? What are the most-cited journals in which papers on the topic have been published? How have methods for measuring the accuracy of economic forecasts been developed and improved? What are the most important measures applied in recent research for the analysis of economic forecast accuracy? What are the most relevant findings from the application of these methods in empirical research?
The research was conducted by applying a systematic literature review methodology (Tranfield et al. 2003; Prasad et al. 2018; Grilli et al. 2019; Snyder 2019; Sorin and Nucu 2020). The research period was from 1991 to 2020.
A systematic overview of the empirical literature on the measurement of economic forecast accuracy has not previously been conducted. This study provides important contributions to the scientific literature. First, it gives a complete picture of the published studies on the measurement of economic forecast accuracy and includes a comprehensive citation-based content analysis; this covers the theoretical background, methodological development, and empirical findings of the research identified. Second, the study brings together information on the relevant sources of published papers on the measurement of economic forecast accuracy as well as guidelines for researchers interested in applying a systematic literature review as a research method. Finally, this contribution to the literature is motivated by the significance of further developing and improving the methods of analyzing economic forecast accuracy. Measuring economic forecast accuracy is not only of an economic nature but also has statistical and mathematical implications. Therefore, the results presented here are a good basis for further research across a range of research areas.
2. Methodology
The research methodology adopted here is based on a systematic literature review (Tranfield et al. 2003; Prasad et al. 2018). A more detailed description of the research methodology applied, including phases, aims, and guideline questions, is set out in Table 1. The analysis comprises the literature on the measurement of economic forecast accuracy published in the period from 1991 to 2020 and indexed in the ISI Web of Science database (WoS CC).
At the very beginning of the research process, the initial studies collected according to the aim of the research must be sorted. For this purpose, it is necessary to define the criteria for the inclusion of articles in the research sample. The inclusion criteria for the systematic literature review in this paper address the following key aspects: theoretical framework, methodology development, and empirical research (Table 2).
The number of publications per year on measures of economic forecast accuracy in the period 1991–2020 is shown in Figure 1. The search for articles took place in June 2021. With few oscillations, the number of published articles is trending upward.
Other studies propose beginning the review process by searching for studies on the measurement of economic forecast accuracy (Huang et al. 2016; Abideen et al. 2020; Sorin and Nucu 2020). For this purpose, I used the Web of Science database. Article collection was based on a keyword search for the phrase ‘measures of economic forecast accuracy’. The preliminary search yielded an initial sample of 403 documents (Table 3).
After collection, the articles were sorted according to the aim of this study and defined methodological framework. In the selection process, certain document types were eliminated, including editorial materials and early access articles. In the next step, articles not in line with the key research questions are excluded. After collecting, sorting, and selecting the articles, the final sample comprised 145 impactful studies.
3. Citation-Based Analysis
The first research question in the citation-based analysis is, ‘what are the journals that have published the greatest number of papers from said research?’ The top 10 Web of Science publications, according to the number of papers published on measures of economic forecasts accuracy, are as follows: International Journal of Forecasting, Journal of Forecasting, Economic Modelling, Energies, Journal of Business & Economic Statistics, Romanian Journal of Economic Forecasting, Applied Energy, Empirical Economics, Energy, and Journal of Econometrics. Table 4 sets out the journals that have published more than three articles on the topic, together with an average number of citations, over the period 1991–2020. Apart from the 25 publications listed in Table 4, 31 journals have published two articles in the field of measures of economic forecast accuracy, and 141 journals have published only one article. These journals are not included to preserve space. The results presented in Table 4 reveal a high degree of dispersion across publications of articles on the topic; although the number of papers published on measures of economic forecast accuracy is relatively high, the number of articles per journal is relatively small. Similar findings have been confirmed in other research fields, such as working capital management (Prasad et al. 2018) and enterprise risk management (Sorin and Nucu 2020). The analysis of the average number of citations per year from the WoS CC shows that the Journal of Business & Economic Statistics has the highest citations per paper (148.62), followed by Applied Energy (46.25).
It seems especially interesting to analyze the most cited articles in this research area. Table 5 presents the top 20 studies on the measures of economic forecast accuracy in descending order of citation. In addition to the titles of the articles and the number of citations, Table 5 lists the names of the authors, the year of publication, and the journal in which each article is published. The results presented in the table show that in the Web of Science Core Collection, the Journal of Business & Economic Statistics has the highest citations per paper in the period 1991–2020 (3340 citations for the study ‘Comparing Predictive Accuracy’; Diebold and Mariano (1995)), followed by the International Journal of Forecasting with 637 citations for the paper titled ‘Error Measures for Generalizing About Forecasting Methods–Empirical Comparisons’; Armstrong and Collopy (1992). The article ‘Comparing Predictive Accuracy’; Diebold and Mariano (1995) has both the highest total number of citations during the observation period and the highest average number of citations per year (128.46). The study of Diebold and Mariano (1995) drew the interest of other researchers in the field of economic forecast accuracy and those in the broader academic community. Section 4—Content Analysis—sets out the contributions of other related papers to the theoretical framework, methodology development, and empirical application.
4. Content Analysis
The content analysis is divided into three main parts: theoretical background, review of methodology development, and overview of empirical findings. The section begins with the theoretical background that contains a brief chronological overview of the development of the theory of economic forecasts (and their accuracy).
4.1. Theoretical Background
There are many ways to define forecasts. The generally accepted definition is that a forecast is any statement about the future. There are numerous methods, techniques, and tools for making forecasts.
According to Clements and Hendry (2004), these are formal model-based statistical analyses.
Historically, the theory of economic forecasting is based on two key assumptions (Klein 1971): (1) the model is a good representation of the economy; (2) the structure of the economy will remain relatively unchanged.
Clements and Hendry (2001) stated that empirical experience in economic forecasting foregrounds the poverty of these two assumptions. Barrell (2001) discussed six examples of endemic structural change since the 1990s. Since, in economics, the future is rarely like the past, forecast failure is all too common (Clements and Hendry 2001). Makridakis et al. (1979) emphasized that ‘the ultimate test of any prognosis is whether or not it is capable of predicting future events accurately’.
The analysis of forecast accuracy has evolved with the history of time-series analysis (Woschnagg and Cipan 2004). In response to Keynes, who argues theories must be confirmed if the data and statistical methods are employed correctly, Tinbergen (1939) developed the first tests for forecasting models. A crucial criticism is the Lucas critique, which states that future development is influenced by projections because expectations have been accomplished. This is circular and raises the question of how predictions should take into account self-fulfilling prophecies in time-series forecasting. The theory implies that projections are informational input for the data generating process, and that they are invalidated by agents reacting to them. Hence, projections are susceptible to bias. Opponents of the Lucas critique claim that forecasts are not probability-based techniques that point to the future; rather, they are extrapolative patterns (Woschnagg and Cipan 2004).
Historically, research on the accuracy of economic forecasts has aroused interest. There is now a vast literature in this area, from the construction of various accuracy measures to the evaluation of these measures in empirical research (Fair 1986; Armstrong and Collopy 1992; Diebold and Mariano 1995; Granger and Pesaran 2000; Lamont 2002; Chen and Yang 2004; Clements et al. 2007; Clark and McCracken 2009; Billio et al. 2013; Kapetanios et al. 2015; Abel et al. 2016; Salisu et al. 2019). Research on economic forecast accuracy compares econometric model forecasts to those of naive time-series models (Theil 1966; Mincer and Zarnowitz 1969; Dhrymes et al. 1972; Cooper and Nelson 1975). Wallis (1989) emphasized that ‘in practical econometric forecasting exercises, incomplete data on current and immediate past values of endogenous variables are available’. In order to improve economic forecasts, a scientifically justified analysis of their accuracy is required. The next section is devoted to an overview of statistical and econometric methods that are applied to evaluate the economic forecast accuracy.
4.2. Methodology Development
Researchers are continuously focused on the scientific development of methods for the evaluation of economic forecast accuracy (Makridakis et al. 1982; Fair 1986; Keane and Runkle 1990; Armstrong and Collopy 1992; Davies and Lahiri 1995; Diebold and Mariano 1995; Granger and Pesaran 2000; Lamont 2002; Chen and Yang 2004; Koning et al. 2005; Clements et al. 2007; Ager et al. 2009; Clark and McCracken 2009; Dovern and Weisser 2011; Billio et al. 2013; Davydenko and Fildes 2013; Westerlund and Narayan 2015; Abel et al. 2016; C. Chen et al. 2017; Salisu et al. 2019). Furthermore, various accuracy measures have been constructed to estimate and rank the prediction methods themselves (Carbone and Armstrong 1982; Ahlburg 1992; Armstrong and Collopy 1992; Yokuma and Armstrong 1995; Granger and Jeon 2003; Chen and Yang 2004; Hyndman and Koehler 2006; Davydenko and Fildes 2013; Kapetanios et al. 2015).
4.2.1. Measures
Fair (1986) discussed the most common measures of the forecast accuracy, i.e., the root mean squared error (RMSE), mean absolute error (MAE), and Theil’s inequality coefficient (U). The forecast of variable i for period t is denoted by and the actual value by . If it is assumed that observations on and are available for t = 1, … T, then the measures of this variable are:
where denotes absolute or percentage change. If all these measure (RMSE, MAE, U) equal zero, it implies that the forecasts are perfect.
The mean squared forecast error (MSE) can be decomposed as:
where and denote the means of the actual and forecasted variables, respectively. The standard deviations of the actual and forecasted variables are denoted by and , respectively. The symbol r is the correlation between the actual variable and the forecasted variable .
After Fair (1986), numerous studies have been conducted in which the authors aim to improve the methodology for forecast accuracy measures (Armstrong and Collopy 1992; Diebold and Mariano 1995; Clements and Hendry 1993; Christoffersen and Diebold 1998; Granger and Jeon 2003; C. Chen et al. 2017). Armstrong and Collopy (1992) analyzed measures for making comparisons of errors across time series. They suggest that the most appropriate measures of economic forecast accuracy are the Geometric Mean of the Relative Absolute Error (GMRAE), where the task involves calibrating a model for a set of time series, the Median RAE (MdRAE), when few series are available, and the Median Absolute Percentage Error (MdAPE) otherwise. In exploring the differences in accuracy between two competing forecasts, Diebold and Mariano (1995) proposed several tests of the hypothesis that there is no difference in accuracy between two competing forecasts. For comparing the forecasting accuracy across data series, Clements and Hendry (1993) suggested the improvement of the MSE through the implementation of a new accuracy measure: the Generalized Forecast Error Second Moment (GFESM).
The study by Clements and Hendry (1993) has been the basis and inspiration for further contributions to the development of research methodology in the field of economic forecast accuracy. Armstrong and Fildes (1995) assumed that the conclusions by Clements and Hendry (1993) lacked external validity. They argued that the MSE should not be applied for comparisons between forecasting methods primarily due to its unreliability. Armstrong and Fildes (1995) claimed that the MSE, as a measure of economic forecast accuracy, is sensitive to outliers. Therefore, due to the complexity of real data, these authors concluded that no single accuracy measure is most appropriate. It is recommended that different measures of economic forecasts accuracy be compared to identify which measures have very serious shortcomings and should, thus, be avoided in certain empirical research. There are not many published studies in which the authors compare multiple forecast accuracy measures (see, for example, Makridakis 1993; Yokuma and Armstrong 1995; Tashman 2000). Christoffersen and Diebold (1998) confirmed the findings of Armstrong and Fildes (1995) on the inadequacy of the MSE as a measure of accuracy for cross-series comparison. Christoffersen and Diebold (1998) proposed a forecast accuracy measure that can value the maintenance of cointegration relationships among variables.
(Tashman 2000) and (Koehler 2001) analyzed the results of the latest M-Competition (Makridakis and Hibon 2000), focusing on measures of economic forecast accuracy. Following Keane and Runkle (1990), Davies and Lahiri (1995) developed a new methodological framework for examining forecast errors applying three-dimensional panel data. This was extended by Clements et al. (2007), Ager et al. (2009), and Dovern and Weisser (2011). Chen and Yang (2004) determined the stand-alone and relative measures of economic forecasts accuracy. As new measures, these authors proposed the Kullback–Leibler Divergence measure (K-L), which corresponds to the quadratic loss function (normal error) scaled with variance estimate, and measures of interquartile range based on the MSE adjusted by interquartile range.
In their analysis of quantitative and qualitative measures for evaluating economic forecast accuracy, Pesaran and Skouras (2004) applied generalized cost-of-error functions. In the current literature, there are several traditional measures of economic forecast accuracy. Despite efforts to refine the methods for analyzing the accuracy of economic forecasts, these traditional measures are still widely applied (Abreu 2011; Simionescu 2014a; Sheng 2015; Q. Chen et al. 2016; C. Chen et al. 2017; Gupta and Minai 2019). A complete classification of traditional measures presented in Table 6 was made by Hyndman and Koehler (2006) in their reference study ‘Another Look at Measures of Forecast Accuracy’. All measures were classified into four main groups: scale-dependent measures, measures based on percentage error, measures based on relative errors, and relative measures.
In addition to an overview of the traditional measures on economic forecasts accuracy, Hyndman and Koehler (2006) proposed the Mean Absolute Scaled Error (MASE) as a generally applicable measure for the analysis of forecast accuracy. Although the proposed measure avoids infinite and undefined values, it can be still influenced by a single large error (Davydenko and Fildes 2013; C. Chen et al. 2017).
A common feature of most of the measures for the analysis of economic forecast accuracy is their poor resistance to outliers and scale dependence. In endeavoring to avoid these shortcomings, C. Chen et al. (2017) proposed a new accuracy measure—the Unscaled Mean Bounded Relative Absolute Error (UMBRAE), which is based on bounded relative errors. Gorr (2009) developed the receiver operating characteristics as a new forecast error measure suitable for extraordinary conditions such as crisis periods. Bratu (2013) proposed new forecast accuracy measures for point forecasts and for forecast intervals.
The limits and advantages of methods used to assess forecast accuracy are presented in Table 7.
4.2.2. Statistical Tests
In addition to the presented measures, the tests used to check the accuracy of economic forecasts also play an unavoidable role. Statistical tests of forecast accuracy are continuously developed and upgraded with new methodological proposals (Granger and Newbold 1986; Meese and Rogoff 1988; Diebold and Mariano 1995; West 1996; Harvey et al. 1997; Clark and McCracken 2001; Mariano 2004; West 2006; Giacomini and White 2006; Dang et al. 2014; Diebold 2015; Harvey et al. 2017).
Granger and Newbold (1986) constructed a test for equal forecast accuracy based on the orthogonalization presented in Morgan (1939). Later, in the literature, this test became known as the Morgan-Granger-Newbold (MGN) test. Meese and Rogoff (1988) proposed a test of equal forecast accuracy that allows the forecast errors to be serially and contemporaneously correlated (MR test). Diebold and Mariano (1995) developed the test of the null hypothesis of equal forecast accuracy (DM test). Harvey et al. (1997) proposed some modifications to the original DM test, with the aim to improve the test’s performance for smaller samples (HLN tests). Additionally, Harvey et al. (1997) suggested some variations of the MGN test. Clark and McCracken (2001) examined the asymptotic and finite-sample properties of the tests for equal forecast accuracy and encompassing applied to one-step ahead forecasts from nested linear models. Giacomini and White (2006) argued that the framework for predictive ability testing such as in the study West (1996) was not necessarily valuable for real-time forecast selection. Therefore, they proposed an alternative approach which is based on the inference about conditional expectations of forecasts and forecast errors. Dang et al. (2014) proposed modifications of the DM and MGN tests that improve asymptotic power by exploiting available sample information more fully to estimate the tested parameters. Harvey et al. (2017) confirmed that the long-run variance can frequently be negative when computing original DM test for equal forecast accuracy and forecast encompassing if one is dealing with multi-step-ahead predictions in small, but empirically significant, sample sizes.
In parallel with the methodological development, statistical tests of forecast accuracy have found an increasing application in empirical research (Clark and McCracken 2001; Shen et al. 2009; Clark and McCracken 2013; H. Chen et al. 2014; Coroneo and Iacone 2020; Mayer et al. 2020; Glocker and Kaniovski 2021). In their latest empirical study, Glocker and Kaniovski (2021) used a modified version of the Diebold–Mariano test (Diebold and Mariano 1995) as proposed by Harvey et al. (1997).
In order to gain better insight into the tests used to check the accuracy of economic forecasts, the following is an overview and explanation of the tests through the application of appropriate mathematical formulas. Two standard tests are presented, the Morgan-Granger-Newbold (MGN) test and the Diebold-Mariano (DM) test, as well the modifications proposed by Harvey et al. (1997).
The Morgan-Granger-Newbold (MGN) Test
It is assumed that:
- are actual values.
- and are two forecast values.
The forecast errors are defined as:
The loss associated with the forecast i is denoted as the function of the actual and forecast values:
where is the squared-error loss or the absolute error loss of .
The loss differential between the two forecasts (i = 1,2) is denoted as:
It is assumed that the two forecasts (i = 1,2) have equal accuracy if and only if the loss differential has zero expectation for all values of t.
The null hypothesis is that there is no difference between the two forecasts:
Conversely, the hypothesis :
The MGN test is based on the following assumptions: (1) the loss is quadratic; (2) the forecast errors are (a) zero mean; (b) Gaussian; (c) serially uncorrelated. Based on these assumptions, Granger and Newbold (1986) proposed a test for forecast accuracy, which is founded on this orthogonalization (Morgan 1939): and .
Then, the null hypothesis of zero mean loss differential is equivalent to the equality of the two forecast error variances or, equivalently, zero covariance between xt and zt, since it follows directly from the definition of xt and zt, that .
Hence, the MGN test is given by the equation:
where:
where x and z are the T × 1 vectors with tth elements xt and zt, respectively. Under the null hypothesis of a zero covariance between xt and zt, the MGN test has a t-distribution with T − 1 degrees of freedom.
The Diebold-Mariano (DM) Test
The symbols for the actual and forecasts series are as follows:
- are actual data series.
- are the ith competing h-step forecasting series.
The forecast errors from the ith competing models are denoted by (i = 1,2,3,…,m), where m is the number of forecast models. The h-step of forecast errors is defined by:
The forecast accuracy is measured by the loss function:
The null hypothesis of equal forecast accuracy is:
where:
In that case, the sample mean loss differential is defined as:
Then, the DM test statistic is given by the equation:
where is a consistent estimator of the asymptotic variance of . It is important to note that the variance is used in the DM statistic because the sample of loss differentials dt, which are serially correlated for h > 1. Because DM tests converge to a normal distribution, the null hypothesis can be rejected at the 5% level if . Conversely, if , the null hypothesis cannot be rejected.
The Harvey-Lebourne-Newbold (HLN) Tests
- (1)
- Variations of the MGN test
Harvey et al. (1997) proposed some variations of the MGN test in a way that they set it up in a regression framework.
A model of simple linear regression is: .
It is noted that the above regression model contain the same null hypothesis testing where as the MGN test statistic. It can be written as follows:
where:
Hence, the test would work and be unbiased in an ideal situation where the assumptions on which the MGN test statistics are based on have (1) a loss that is quadratic; (2) forecast errors are (a) zero mean; (b) Gaussian; (c) serially uncorrelated. However, Harvey-Lebourne-Newbold (HLN) argued that the estimate of the variance of b is baied in the situation when the forecast errors come from a heavy-tailed distribution.
Therefore, they recommend the modification of the MGN test as follows:
where denotes the calculated OLS residual at time t. Harvey-Lebourne-Newbold (HLN) recommended comparing with critical values of the t-distribution with T-1 degrees of freedom.
Harvey et al. (1997) confirmed that the MGN test has empirical sizes that are equal to nominal sizes when forecast errors are drawn from the Gaussian distribution. However, when the forecast errors generating process is t-distribution with six degrees of freedom, the original MGN test becomes oversized. In that case the deficiency of the original MGN test gets worse as the sample size increases (Mariano 2004).
- (2)
- Modifications of the Diebold-Mariano (DM) test
Besides variations of the MGN test, Harvey et al. (1997) proposed a small-sample modification of the DM test. The modification is related to an approximately unbiased estimate of the variance of the mean loss differential when forecast accuracy is measured in terms of the mean squared prediction error, and h-steps-ahead forecast errors are assumed to have zero autocorrelations at order h and beyond.
Since the optimal h-steps-ahead forecasts are likely to have forecast errors that are a moving average process of order h − 1, the HLN test assumes that for h-steps-ahead forecasts, the loss differential has the following autocovariance:
The exact variance of the mean loss differential is as follows:
The original DM test would estimate the variance as follows:
where d is based on the squared prediction error. The HLN test obtains the following approximation of the expected value of :
Harvey et al. (1997) also proposed comparing with critical values from the t-distribution with degrees of freedom instead of the standard unit normal distribution.
4.2.3. Strategies
In order to achieve good forecasting accuracy, it is important to use an appropriate forecasting strategy. Research on forecasting strategies have been long in the focus of numerous researchers (Bates and Granger 1969; Makridakis 1988; Bunn 1989; De Menezes et al. 2000; Armstrong 2001; Timmermann 2006; Hall and Mitchell 2007; Clark and McCracken 2009; Geweke and Amisano 2011; Kourentzes et al. 2014; Fildes and Petropoulos 2015; Nowotarski et al. 2016; Pinar et al. 2017; Kourentzes et al. 2019; Galvão Bandeira et al. 2020; Giacalone 2021; Kang et al. 2021). In a seminal study on strategies about improving the forecasts accuracy, Bates and Granger (1969) confirmed that combining the forecasts using different models, instead of relying on the individual models, can improve the accuracy of predictions. Makridakis (1988) discussed how the forecasting accuracy can be improved by understanding and correcting the problems inherent in statistical methods and the past mistakes of judgmental forecasters. Armstrong (2001) emphasized that “combining forecasts is especially useful when you are uncertain about the situation, uncertain about which method is most accurate, and when you want to avoid large errors”. Timmermann (2006) theoretically explored the advantages from combining predictions such as the degree of correlation between forecast errors and the relative size of the individual models’ forecast error variances. Clark and McCracken (2009) presented Monte Carlo methods and empirical examples on the efficiency of combining recursive and rolling forecasts when linear forecast models are subject to structural change. Besides Monte Carlo experiments, several empirical evidences show that combination improves the forecasts accuracy relative to forecasts made using the recursive scheme or the rolling scheme with a fixed window width. The alternative to combining is selecting the adequate forecast model. However, selecting the most appropriate forecast model to achieve a good predicting accuracy is not such an easy task. For this purpose, different selection criteria were used. Galvão Bandeira et al. (2020) stated that the selection can be based on the time series characteristics (Petropoulos et al. 2018), the forecasting model performance (Wang and Petropoulos 2016; Fildes and Petropoulos 2015), the information criteria (Qi and Zhang 2001), or the judgmental expert selection (Petropoulos et al. 2018). Kourentzes et al. (2014) proposed a novel algorithm that aims to mitigate the importance of model selection, while increasing the accuracy. Nowotarski et al. explored the performance of combining so-called sister load forecasts, i.e., predictions generated from a family of models which share similar model structure but are built based on different variable selection processes. They confirmed that “combing sister forecasts outperforms the benchmark methods significantly in terms of forecasting accuracy measured by Mean Absolute Percentage Error”. Kourentzes et al. (2019) proposed a heuristic function to automatically identify forecast pools, regardless of their source or the performance criteria. Pinar et al. (2017) derived optimal forecast combinations based on the stochastic dominance efficiency (SDE) with differential forecast weights for different quantiles of forecast error distribution. Giacalone (2021) proposed a forecast combination method based on Lp-norm estimators, which can be used to solve the cases of multicollinearity and non-Gaussianity. Combining different GARCH and the ARIMA models, the Lp-norm scheme improves the forecasts accuracy. Using out-of-sample forecasts, Kang et al. (2021) aimed to obtain weights for forecast combinations by amplifying the diversity of the pool of methods being combined. Kang et al. (2021) confirmed that diversity-based forecast combination framework contributed to the improvement of forecast accuracy.
4.3. Empirical Findings
Empirical research about economic forecast accuracy has long been the focus of researchers (Mincer and Zarnowitz 1969; Makridakis et al. 1979; Boothe and Glassman 1987; Karamouzis and Lombra 1989; Zarnowitz 1991; Jansen and Kishnan 1996; Joutz and Stekler 2000; Romer and Romer 2000; Croushore and Stark 2001; Loungani 2001; Clements and Taylor 2001; Sims 2002; Ashiya 2005; Isiklar et al. 2006; Clements et al. 2007; Golinelli and Parigi 2008; Lahiri and Isiklar 2009; Ager et al. 2009; Blaskowitz and Herwartz 2009; Krkoska and Teksoz 2009; Sinclair et al. 2010; Abreu 2011; Croushore 2011; Dovern and Weisser 2011; Costantini and Kunst 2011; Carvalho and Minella 2012; Deschamps and Bianchi 2012; González Cabanillas and Terzi 2012; Loungani et al. 2013; Capistrán and López-Moctezuma 2014; Golinelli and Parigi 2014; Lewis and Pain 2014; Messina et al. 2015; Dovern et al. 2015; Guisinger and Sinclair 2015; Sheng 2015; Q. Chen et al. 2016; Dovern and Jannsen 2017; An et al. 2018).
Mincer and Zarnowitz (1969) confirmed the hypothesis that the forecast accuracy decreases with the increase in length of the predictive span. Using a sample of 111 time series, Makridakis et al. (1979) explored the accuracy of various forecasting methods focusing on time-series methods. Unexpectedly, their results showed that simpler methods perform well compared to the more complex and statistically sophisticated ARMA models. In addition to its relevance to profitability in forward-market speculation, Boothe and Glassman (1987) used economic forecast accuracy as an evaluation criterion for the ranking of different exchange rate forecasting models. Their findings are in line with previous research, where the highest economic forecast accuracy was realized by applying simple time-series models, such as the random walk.
Since the main goals of every economy should be maximizing the value of production, full employment, and stable prices, a number of studies explore the accuracy of economic forecasts related to GDP, unemployment, and inflation (Karamouzis and Lombra 1989; Jansen and Kishnan 1996; Joutz and Stekler 2000; Clements et al. 2007; Golinelli and Parigi 2008; Costantini and Kunst 2011; Golinelli and Parigi 2014; Sheng 2015; Q. Chen et al. 2016; Dovern and Jannsen 2017). Karamouzis and Lombra (1989) confirmed that for the period 1973 to 1982, forecasts involved large errors and contained untapped information.
Applying the Mincer and Zarnowitz (1969) methodological framework, Romer and Romer (2000) and Sims (2002) focused on the accuracy of the United States (US) Federal Reserve’s inflation forecasts. Both studies concluded that these forecasts are unbiased. In the analysis of the Federal Reserve Greenbook forecasts of real GDP, inflation and unemployment for the period from 1974 to 1997, Clements et al. (2007) concluded that there is evidence of systematic bias and of forecast smoothing of the inflation forecasts. According to Heilemann and Stekler (2007), unsuitable forecasting methods and unsuitable expectations regarding the degree of performance are the most important reasons for the lack of accuracy in G7 macroeconomic predictions. Franses et al. (2011) evaluated the accuracy of the economic forecasts made by the Netherlands Bureau for Economic Policy Analysis. They conclude that expert forecasts are far more accurate than the model forecasts, particularly when the forecast horizon is short. Bratu (2012) confirmed that the Holt–Winters method offers more accurate forecasts for inflation in the US when the initial expectations are provided by the Survey of Professional Forecasters.
Comparing the accuracy of various econometric forecasting models (AR, VAR, VARMA), Simionescu (2014b) concluded that vector autoregressive moving average (VARMA) models generate the most accurate forecasts; their research focuses on inflation, real GDP, and interest rates in Romania for the period 2012 to 2013. Lewis and Pain (2014) evaluated the projections of the Organisation for Economic Co-operation and Development. They confirmed that economic growth is repeatedly overestimated in the projections, which failed to anticipate the extent of the slowdown and, later, the weak pace of the economic recovery.
The existence of a general tendency to overestimate economic growth in future years is common among forecasters (Abreu 2011; Lewis and Pain 2014). Lewis and Pain (2014) pointed out two reasons for forecasters’ frequent failure to predict downturns and their size: (1) directional accuracy is asymmetric, with a much lower share of decelerations and recessions predicted a year in advance; (2) errors are larger in recessions. These difficulties are confirmed not only across forecasters but also across countries and over longer periods of time (Zarnowitz 1991; Loungani 2001; Abreu 2011; González Cabanillas and Terzi 2012). Sheng (2015) conducted an analysis of economic forecast accuracy concerning real GDP, inflation, and unemployment rates made by the Federal Open Market Committee in the period 1992 to 2003. The author shows these forecasts tend to underpredict real GDP and overpredict inflation and unemployment rates.
In addition to studying the accuracy of forecasts of GDP, unemployment, and inflation, researchers have explored the accuracy of economic forecasts for other variables, such as the exchange rate, consumption, interest rates, monetary supply, consumption, and export (Meese and Rogoff 1983; Lam et al. 2008; Shittu and Yaya 2009; Simionescu 2014a). Evaluating the out-of-sample forecasting accuracy of different structural and time-series exchange rate models, Meese and Rogoff (1983) confirmed that random walk processes generate better forecasts than structural models. Lam et al. (2008) explored exchange rate predictability using different theoretical and empirical models, such as the purchasing power parity, uncovered interest rate parity, and sticky-price monetary models, which are based on the Bayesian model averaging technique, and a combination of these. They conclude that the forecast based on combined models is more accurate than the forecast that uses only one model. These findings were also confirmed in later research, such as Bratu (2012).
Shittu and Yaya (2009) analyzed the forecast performance of ARIMA and ARFIMA models using the example of the US dollar/UK pound foreign exchange rate. To measure forecast accuracy, they use the root-mean-square forecast error (RMSFE) and mean absolute percentage forecast error (MAPFE). The results show that estimated forecast values from the ARFIMA model is more realistic and closely reflects the current economic reality. Comparing the accuracy of various econometric forecasting models (AR, VAR, and VARMA), Simionescu (2014b) concluded that VARMA models generated the most accurate forecasts in research concerning inflation, real GDP, and interest rates in Romania for the period from 2012 to 2013.
There are numerous studies that have analyzed the effects of business cycles on the accuracy of economic forecasts. Recent studies identified significant business-cycle impacts in systematic forecast errors (Loungani 2001; Croushore 2011; Loungani et al. 2013; Messina et al. 2015; Dovern and Jannsen 2017). In empirical research on a sample of several industrialized and developing countries for the period 1989 to 1998, Loungani (2001) concluded that forecasts for recession are subject to a large systematic forecast error. Sinclair et al. (2010) showed that the Federal Reserve’s Greenbook projections overestimated the annual rate of change in real GDP in periods of recession and underestimated it in periods of economic growth. These results were later confirmed in other studies (Messina et al. 2015). Loungani et al. (2013) explored information rigidity in forecasts of real GDP for a sample of 46 countries and concluded that sluggishness in forecast revisions decreased in periods of recession.
The dependence of systematic growth-forecast errors in advanced economies on the business cycle is explored by Dovern and Jannsen (2017). They confirmed that forecasts for recessions are subject to a large negative systematic forecast error (forecasters overestimate growth), while forecasts for recoveries are subject to a positive systematic forecast error. An et al. (2018) analyzed how well researchers forecast recessions using a sample of 63 advanced and emerging market economies. They confirmed that forecasts are revised much more quickly in periods of recession than in non-recession periods, but not rapidly enough to be able to avoid large forecast errors. These results are in line with the findings of some earlier studies (Lewis and Pain 2014; Dovern and Jannsen 2017).
The existing literature abounds in studies in which the performance of professional macroeconomic forecasts is intensively studied in relation to forecast accuracy, bias, and efficiency (Clements and Taylor 2001; Loungani 2001; Isiklar et al. 2006; Ager et al. 2009; Krkoska and Teksoz 2009; Lahiri and Isiklar 2009; Dovern and Weisser 2011; Carvalho and Minella 2012; Deschamps and Bianchi 2012; Bratu 2013; Loungani et al. 2013; Capistrán and López-Moctezuma 2014; Dovern et al. 2015; Q. Chen et al. 2016). Most of the initial research in this vein is focused on the most economically developed countries, such as the US and G-7 countries (Clements and Taylor 2001; Isiklar et al. 2006; Ager et al. 2009; Dovern and Weisser 2011).
There are numerous later studies on the samples of emerging market economies, such as Krkoska and Teksoz (2009) for transition countries, Carvalho and Minella (2012) for Brazil, and Capistrán and López-Moctezuma (2014) for Mexico. Other scholars were primarily focused on individual Asian countries, such as Ashiya (2005) for Japan, Lahiri and Isiklar (2009) for India, and Deschamps and Bianchi (2012) for China. Some of the abovementioned studies found significant discrepancies in forecast performance among advanced and emerging economies, particularly in terms of forecast accuracy, information rigidities, and the efficiency of data use (Loungani 2001; Loungani et al. 2013; Dovern et al. 2015). Using a large panel of forecasts analyzing the quality of professional macroeconomic forecasts for China for the period 1995–2009, Deschamps and Bianchi (2012) confirmed large differences in forecast accuracy across both forecasters and variables.
Q. Chen et al. (2016) explored the forecast accuracy, bias, and efficiency of professional macroeconomic forecasts and test the Asian-Pacific Consensus Forecasts in relation to the variables GDP growth and inflation. The analysis on the sample of ten Asian economies, i.e., China, Hong Kong, India, Indonesia, Japan, Korea, Malaysia, Singapore, Taiwan, and Thailand, covering the period 1995–2012. The methodological framework for the analysis of economic forecast accuracy is based on the application of the RMSE and measures proposed by Blaskowitz and Herwartz (2009). Q. Chen et al. (2016) confirmed the hypothesis that economic forecast accuracy improves very slowly from long to short horizons, which could explain the large magnitude of the forecast errors. Using survey data for G7-countries, Dovern and Weisser (2011) analyzed the accuracy of professional macroeconomic forecasts of GDP growth, inflation, and unemployment rates. They confirmed a high degree of dispersion of forecast accuracy across forecasters. Analyzing how to improve the predictability of the oil-US stock nexus, Salisu et al. (2019) argued that ‘it is important to pre-test the predictors for persistence, endogeneity, and conditional heteroscedasticity’.
The classification of key empirical findings is presented in Table 8.
5. Conclusions
Economic forecasts play an increasingly important role in the economic decision-making process. Therefore, a scientifically robust analysis of the accuracy of economic forecasts can help improve forecasts and consequently enhance the decision-making process. This paper presents a systematic review of the empirical literature on measuring the accuracy of economic forecasts. After collecting, sorting, and selecting the articles, the subject of the analysis was 145 impactful studies. Measured by the average number of citations per year, the greatest contribution to the research area was made by Diebold and Mariano (1995), ‘Comparison of prediction accuracy’. In that paper, the authors propose several tests of the null hypothesis of equal forecast accuracy.
The publication indexed in the ISI Web of Science database with the largest number of published articles on the researched topic is the International Journal of Forecasting. The results of the citation-based analysis indicate a growing interest by researchers in the topic of measuring the accuracy of economic forecasts. In addition to the short review of the theoretical background, the content analysis was primarily focused on the methodology development and its application in empirical studies. Traditional measures of the accuracy of economic forecasts are continuously developed and upgraded with new methodological proposals (Davies and Lahiri 1995; Christoffersen and Diebold 1998; Chen and Yang 2004; Pesaran and Skouras 2004; Clements et al. 2007; Ager et al. 2009; Gorr 2009; Dovern and Weisser 2011; Davydenko and Fildes 2013; Bratu 2013; Simionescu 2014b; C. Chen et al. 2017). With the development of a methodological framework, the authors tesedt, combined, compared, and evaluated various methods in empirical research (Armstrong and Collopy 1992; Yokuma and Armstrong 1995; Granger and Jeon 2003; Chen and Yang 2004; Hyndman and Koehler 2006; Davydenko and Fildes 2013; Kapetanios et al. 2015).
The usefulness of the methods for analyzing the accuracy of economic forecasts is evidenced by their widespread application in empirical research. Studies cover a wide range of topics, including the analysis of forecast accuracy for macroeconomic variables such as GDP, unemployment, inflation, exports, interest rates, consumption, and the effects of business cycles on the accuracy of economic forecasts (Lam et al. 2008; Shittu and Yaya 2009; Carvalho and Minella 2012; Deschamps and Bianchi 2012; González Cabanillas and Terzi 2012; Loungani et al. 2013; Capistrán and López-Moctezuma 2014; Golinelli and Parigi 2014; Lewis and Pain 2014; Simionescu 2014a; Messina et al. 2015; Dovern et al. 2015; Guisinger and Sinclair 2015; Sheng 2015; Q. Chen et al. 2016; Dovern and Jannsen 2017; An et al. 2018).
Together with the accuracy, scholars often analyze bias and efficiency in economic forecasts (Ager et al. 2009; Krkoska and Teksoz 2009; Lahiri and Isiklar 2009; Dovern and Weisser 2011; Carvalho and Minella 2012; Deschamps and Bianchi 2012; Bratu 2013; Loungani et al. 2013; Capistrán and López-Moctezuma 2014; Dovern et al. 2015; Q. Chen et al. 2016; Salisu et al. 2019).
Following a systematic literature review, the results presented in this paper provide insight into the previous research on measuring the accuracy of economic forecasts in terms of theoretical background, methodological development, and empirical findings. The outcome of this review process improves the knowledge base for researchers and practitioners.
A potential limitation of this research is that the citation-based analysis explores only articles indexed in the Web of Science database. Considering that the problem of economic forecasts and their accuracy is not recent but has a long history, another potential limitation of the research is that the research sample is limited to studies available on the Internet.
It is important to highlight both the theoretical and practical implications of the conducted research. The economic forecasts accuracy is of great importance for making quality decisions. This study provides a complete picture of the measurement on economic forecast accuracy. From a methodological point of view, it involves measures of forecast accuracy, statistical tests, and strategies to improve forecast accuracy. The presented advantages and limitations of individual measures for the analysis of economic forecasts accuracy facilitate the selection and application of appropriate measures in future analyses. A systematic overview of the methodological development and present empirical findings will provide insight into insufficiently explored topics, and thus, contribute to the creation of new research ideas and scientific contributions. Certainly, for future research, one of the most important questions is how to contribute to the improvement of economic forecasts accuracy? Besides upgrading measures and statistical tests, the future scientific contributions can be expected in new methodological proposals on strategies for improving the economic forecast accuracy.
Today, economic forecasts are increasingly impacted by external influences and shocks, such as the coronavirus pandemic or migrant crises, which make the decision-making process more complex. These do not come directly from the economy but from other areas. One possible direction for future research could, therefore, be the evaluation of the impact of these external impacts on the accuracy of economic forecasts and the advancement of existing methodology in this area.
Funding
This research received no external funding.
Informed Consent Statement
Not applicable.
Conflicts of Interest
The author declares no conflict of interest.
References
- Abel, Joshua, Robert Rich, Joseph Song, and Joseph Tracy. 2016. The Measurement and Behavior of Uncertainty: Evidence from the ECB Survey of Professional Forecasters. Journal of Applied Econometrics 31: 533–50. [Google Scholar] [CrossRef] [Green Version]
- Abideen, Ahmed Zainul, Fazeeda Binti Mohamad, and Yudi Fernando. 2020. Lean simulations in production and operations management—A systematic literature review and bibliometric analysis. Journal of Modelling in Management 16. [Google Scholar] [CrossRef]
- Abreu, Ildeberta. 2011. International Organisations’ vs. Private Analysts’ Forecasts: An Evaluation. Working Papers 20/2011. Lisbon: Banco de Portugal. [Google Scholar]
- Ager, Philipp, Marcus Kappler, and Steffen Osterloh. 2009. The accuracy and efficiency of the Consensus Forecasts: A further application and extension of the pooled approach. International Journal of Forecasting 25: 167–81. [Google Scholar] [CrossRef] [Green Version]
- Ahlburg, Dennis. 1992. A commentary on error measures: Error measures and the choice of a forecast method. International Journal of Forecasting 8: 99–111. [Google Scholar] [CrossRef]
- An, Zidong, Joao Tovar Jalles, and Parkash Loungani. 2018. How Well Do Economists Forecast Recessions? IMF Working Paper WP/18/39. Washington, DC: International Monetary Fund. [Google Scholar]
- Armstrong, Scott J. 2001. Combining Forecasts. In Principles of Forecasting, 1st ed. Edited by Scott J. Armstrong. London: Springer International Publishing, pp. 417–39. [Google Scholar]
- Armstrong, J. Scott, and Fred Collopy. 1992. Error Measures For Generalizing About Forecasting Methods: Empirical Comparisons. International Journal of Forecasting 8: 69–80. [Google Scholar] [CrossRef] [Green Version]
- Armstrong, J. Scott, and Robert Fildes. 1995. On the Selection of Error Measures for Comparisons Among Forecasting Methods. Journal of Forecasting 14: 67–71. [Google Scholar] [CrossRef]
- Ashiya, Masahiro. 2005. Twenty-two years of Japanese institutional forecasts. Applied Financial Economics Letters 12: 79–84. [Google Scholar] [CrossRef] [Green Version]
- Barrell, Ray. 2001. Forecasting the world economy. In Understanding Economic Forecasts. Edited by David F. Hendry and Neil R. Ericsson. Cambridge: The MIT Press, pp. 149–69. [Google Scholar]
- Bates, John. M., and Clive W. J. Granger. 1969. The Combination of Forecasts. Journal of the Operational Research Society 20: 451–68. [Google Scholar] [CrossRef]
- Billio, Monica, Roberto Casarin, Francesco Ravazzolo, and Herman K.van Dijk. 2013. Time-varying combinations of predictive densities using nonlinear filtering. Journal of Econometrics 177: 213–32. [Google Scholar] [CrossRef] [Green Version]
- Blaskowitz, Oliver, and Helmut Herwartz. 2009. Adaptive forecasting of the EURIBOR swap term structure. Journal of Forecasting 28: 575–94. [Google Scholar] [CrossRef] [Green Version]
- Boothe, Paul, and Debra Glassman. 1987. Comparing exchange rate forecasting models: Accuracy versus profitability. International Journal of Forecasting 3: 65–79. [Google Scholar] [CrossRef]
- Bratu, Mihaela. 2012. Strategies to Improve the Accuracy of Macroeconomic Forecasts in United States of America. Munich: Lap Lambert, p. 155. [Google Scholar]
- Bratu, Mihaela. 2013. Improvements in Assessing the Forecasts Accuracy—A Case Study for Romanian Macroeconomic Forecasts. Serbian Journal of Management 8: 53–65. [Google Scholar] [CrossRef] [Green Version]
- Bunn, Derek W. 1989. Forecasting with more than one model. Journal of Forecasting 8: 161–66. [Google Scholar] [CrossRef]
- Capistrán, Carlos, and Gabriel López-Moctezuma. 2014. Forecast revisions of Mexican inflation and GDP growth. International Journal of Forecasting 30: 177–91. [Google Scholar] [CrossRef] [Green Version]
- Carbone, Robert, and Scott J. Armstrong. 1982. Evaluation of extrapolative forecasting methods: Results of a survey of academicians and practitioners. Journal of Forecasting 1: 215–17. [Google Scholar] [CrossRef]
- Carvalho, Fabia A., and Andre Minella. 2012. Survey forecasts in Brazil: A prismatic assessment of epidemiology, performance, and determinants. Journal of International Money and Finance 31: 1371–91. [Google Scholar] [CrossRef]
- Chen, Zhuo, and Yuhong Yang. 2004. Assessing Forecast Accuracy Measures. Available online: https://www.researchgate.net/publication/228774888_Assessing_forecast_accuracy_measures (accessed on 3 November 2021).
- Chen, Hao, Qiulan Wan, and Yurong Wang. 2014. Refined Diebold-Mariano Test Methods for the Evaluation of Wind Power Forecasting Models. Energies 7: 4185–98. [Google Scholar] [CrossRef] [Green Version]
- Chen, Qiwei, Mauro Costantini, and Bruno Deschamps. 2016. How accurate are professional forecasts in Asia? Evidence from ten countries. International Journal of Forecasting 32: 154–67. [Google Scholar] [CrossRef] [Green Version]
- Chen, Chao, Jamie Twycross, and Jonathan M. Garibaldi. 2017. A new accuracy measure based on bounded relative error for time series forecasting. PLoS ONE 12: e0174202. [Google Scholar] [CrossRef] [PubMed] [Green Version]
- Christoffersen, Peter F., and Francis X. Diebold. 1998. Co-integration and Long Horizon Forecasting. Journal of Business and Economic Statistics 16: 450–58. [Google Scholar] [CrossRef]
- Clark, Todd E., and Michael W. McCracken. 2001. Tests of equal forecast accuracy and encompassing for nested models. Journal of Econometrics 105: 85–110. [Google Scholar] [CrossRef] [Green Version]
- Clark, Todd E., and Michael W. McCracken. 2009. Improving Forecast Accuracy by Combining Recursive and Rolling Forecasts. International Economic Review 50: 363–95. [Google Scholar] [CrossRef]
- Clark, Todd E., and Michael W. McCracken. 2013. Chapter 20—Advances in Forecast Evaluation. Handbook of Economic Forecasting 2: 1107–201. [Google Scholar] [CrossRef] [Green Version]
- Clements, Michael P. 2014. Forecast uncertainty—Ex ante and ex post: U.S. inflation and output growth. Journal of Business and Economic Statistics 32: 206–16. [Google Scholar] [CrossRef]
- Clements, Michael P., and David F. Hendry. 1993. On the limitations of comparing mean square forecast errors. Journal of Forecasting 12: 617–37. [Google Scholar] [CrossRef]
- Clements, Michael P., and David F. Hendry. 2001. Economic Forecasting: Some Lessons from Recent Research. Working Paper No. 82. Frankfurt am Main: European Central Bank. [Google Scholar]
- Clements, Michael P., and David F. Hendry. 2004. An Overview of Economic Forecasting. In A Companion to Economic Forecasting, 1st ed. Edited by Michael P. Clements and David F. Hendry. Malden: Blackwell Publishing, pp. 1–18. [Google Scholar]
- Clements, Michael P., and David F. Hendry. 2008. Economic Forecasting in a Changing World. Capitalism and Society 3: 1–18. [Google Scholar] [CrossRef] [Green Version]
- Clements, Michael P., and Nick Taylor. 2001. Robust evaluation of fixed-event forecast rationality. Journal of Forecasting 20: 285–95. [Google Scholar] [CrossRef]
- Clements, Michael P., Fred Joutz, and Herman O. Stekler. 2007. An Evaluation of the Forecasts of the Federal Reserve: A Pooled Approach. Journal of Applied Econometrics 22: 121–36. [Google Scholar] [CrossRef] [Green Version]
- Cooper, Philip J., and Charles R. Nelson. 1975. The ex-ante prediction performance of the St. Louis and FRBMIT-PENN econometric models and some results on composite predictors. Journal of Money, Credit, and Banking 7: 1–32. [Google Scholar] [CrossRef]
- Coroneo, Laura, and Fabrizio Iacone. 2020. Comparing predictive accuracy in small samples using fixedsmoothing asymptotics. Journal of Applied Econometrics 35: 391–409. [Google Scholar] [CrossRef]
- Costantini, Mauro, and Robert Kunst. 2011. Combining forecasts based on multiple encompassing tests in a macroeconomic core system. Journal of Forecasting 30: 579–96. [Google Scholar] [CrossRef] [Green Version]
- Croushore, Dean. 2011. Frontiers of Real-Time Data Analysis. Journal of Economic Literature 49: 72–100. [Google Scholar] [CrossRef] [Green Version]
- Croushore, Dean, and Tom Stark. 2001. A Real-Time Data Set for Macroeconomists. Journal of Econometrics 105: 111–30. [Google Scholar] [CrossRef] [Green Version]
- Dang, Xin, Wlater J. Mayer, and Wenxian Xu. 2014. More Powerful and Robust Diebold-Mariano and Morgan-Granger-Newbold Tests. Working Paper. Oxford: University of Mississippi. [Google Scholar]
- Davies, Anthony, and Kajal Lahiri. 1995. A new framework for analyzing survey forecasts using three-dimensional panel data. Journal of Econometrics 68: 205–27. [Google Scholar] [CrossRef]
- Davydenko, Andrey, and Robert Fildes. 2013. Measuring forecasting accuracy: The case of judgmental adjustments to SKU-level demand forecasts. International Journal of Forecasting 29: 510–22. [Google Scholar] [CrossRef]
- De Menezes, Lilian M., Derek W. Bunn, and James W. Taylor. 2000. Review of guidelines for the use of combined forecasts. European Journal of Operational Research 120: 190–204. [Google Scholar] [CrossRef]
- Deschamps, Bruno, and Paolo Bianchi. 2012. An evaluation of Chinese macroeconomic forecasts. Journal of Chinese Economic and Business Studies 10: 229–46. [Google Scholar] [CrossRef]
- Dhrymes, Phoebus J., E. Philip Howre, Saul H. Hymans, Jan Kmenta, Edward E. Leamer, Richard E. Quanot, James B. Ramsey, Harold T. Shapiro, and Victor Zarnowitz. 1972. Criteria for evaluation of econometric models. Annals of Economic and Social Measurement 1: 291–324. [Google Scholar]
- Diebold, Francis X. 2015. Comparing Predictive Accuracy, Twenty Years Later: A Personal Perspective on the Use and Abuse of Diebold–Mariano Tests. Journal of Business & Economic Statistics 33: 1. [Google Scholar] [CrossRef] [Green Version]
- Diebold, Francis X., and Robert S. Mariano. 1995. Comparing forecast accuracy. Journal of Business & Economic Statistics 13: 253–65. [Google Scholar]
- Dovern, Jonas, and Nils Jannsen. 2017. Systematic Errors in Growth Expectations over the Business Cycle. International Journal of Forecasting 33: 760–69. [Google Scholar] [CrossRef] [Green Version]
- Dovern, Jonas, and Johannes Weisser. 2011. Accuracy, unbiasedness and efficiency of professional macroeconomic forecasts: An empirical comparison for the G7. International Journal of Forecasting 27: 452–65. [Google Scholar] [CrossRef] [Green Version]
- Dovern, Jonas, Urlich Fritsche, Prakash Loungani, and Natalia Tamirisa. 2015. Information rigidities: Comparing average and individual forecasts for a large international panel. International Journal of Forecasting 31: 144–54. [Google Scholar] [CrossRef] [Green Version]
- Fair, Ray. 1986. Evaluating the predictive accuracy of models. Handbook of Econometrics 3: 1979–95. [Google Scholar]
- Fildes, Robert. 1992. The evaluation of extrapolative forecasting methods. International Journal of Forecasting 8: 81–98. [Google Scholar] [CrossRef]
- Fildes, Robert, and Fotios Petropoulos. 2015. Simple versus complex selection rules for forecasting many time series. Journal of Business Research 68: 1692–701. [Google Scholar] [CrossRef] [Green Version]
- Franses, Philip Hans, Henk C. Kranendonk, and Debby Lanser. 2011. One Model and Various Experts: Evaluating Dutch Macroeconomic Forecasts. International Journal of Forecasting 28: 482–95. [Google Scholar] [CrossRef]
- Galvão Bandeira, Saymon, Symone Gomes Soares Alcalá, Roberto Oliveira Vita, and Talles Marcelo Gonçalves de Andrade Barbosa. 2020. Comparison of selection and combination strategies for demand forecasting methods. Production 30: 1–13. [Google Scholar] [CrossRef]
- Geweke, John, and Gianni Amisano. 2011. Optimal prediction pools. Journal of Econometrics 164: 130–41. [Google Scholar] [CrossRef] [Green Version]
- Giacalone, Massimiliano. 2021. Optimal forecasting accuracy using Lp-norm combination. Metron 1: 1–44. [Google Scholar] [CrossRef]
- Giacomini, Raffaella, and Halbert White. 2006. Tests of conditional predictive ability. Econometrica 74: 1545–78. [Google Scholar] [CrossRef] [Green Version]
- Glocker, Christian, and Serguei Kaniovski. 2021. Macroeconometric forecasting using a cluster of dynamic factor models. Empirical Economics 1: 1–52. [Google Scholar] [CrossRef]
- Golinelli, Roberto, and Giuseppe Parigi. 2008. Real time squared: A real-time data set for real-time GDP forecasting. International Journal of Forecasting 24: 368–85. [Google Scholar] [CrossRef]
- Golinelli, Roberto, and Giuseppe Parigi. 2014. Tracking world trade and GDP in real time. International Journal of Forecasting 30: 847–62. [Google Scholar] [CrossRef]
- González Cabanillas, Laura, and Alessio Terzi. 2012. The Accuracy of the European Commission’s Forecasts Re-Examined. European Economy, Economic Papers 476. Brussels: European Commission. [Google Scholar]
- Gorr, Wilpen L. 2009. Forecast accuracy measures for exception reporting using receiver operating characteristic curves. International Journal of Forecasting 25: 48–61. [Google Scholar] [CrossRef]
- Granger, Clive W. J., and Yongil Jeon. 2003. A Time-Distance Criterion for Evaluating forecasting models. International Journal of Forecasting 19: 199–215. [Google Scholar] [CrossRef]
- Granger, Clive W.J., and Paul Newbold. 1986. Forecasting economic time series, 2nd ed. San Diego: Academic Press, Inc. [Google Scholar]
- Granger, Clive W. J., and Hashem M. Pesaran. 2000. Economic and Statistical Measures of Forecast Accuracy. Journal of Forecasting 19: 537–560. [Google Scholar] [CrossRef]
- Grilli, Luca, Gresa Latifi, and Boris Mrkajic. 2019. Institutional determinants of venture capital activity. Journal of Economic Surveys 33: 1094–122. [Google Scholar] [CrossRef]
- Groemling, Michael. 2002. Evaluation and Accuracy of Economic Forecasts. Historical Social Research/Historische Sozialforschung 27: 242–55. [Google Scholar]
- Guisinger, Amy Y., and Tara M. Sinclair. 2015. Okuns Law in real time. International Journal of Forecasting 31: 185–87. [Google Scholar] [CrossRef]
- Gupta, Monika, and Mohammad Haris Minai. 2019. An Empirical Analysis of Forecast Performance of the GDP Growth in India. Global Business Review 20: 368–86. [Google Scholar] [CrossRef]
- Hall, Stephen G., and James Mitchell. 2007. Combining density forecasts. International Journal of Forecasting 23: 1–13. [Google Scholar] [CrossRef]
- Harvey, David, Stephen Leybourne, and Paul Newbold. 1997. Testing the Equality of Prediction Mean Squared Errors. International Journal of Forecasting 13: 281–91. [Google Scholar] [CrossRef]
- Harvey, David I., Stephen J. Leybourne, and Emily J. Whitehouse. 2017. Forecast evaluation tests and negative long-run variance estimates in small samples. International Journal of Forecasting 33: 833–47. [Google Scholar] [CrossRef] [Green Version]
- Heilemann, Ullrich, and Herman Stekler. 2007. Introduction to “The future of macroeconomic forecasting”. International Journal of Forecasting 23: 159–65. [Google Scholar] [CrossRef]
- Huang, Jim Yuh, Joseph C. P. Shieh, and Yu-Cheng Kao. 2016. Starting points for a new researcher in behavioral finance. International Journal of Managerial Finance 12: 92–103. [Google Scholar]
- Hyndman, Rob J., and Anne B. Koehler. 2006. Another look at measures of forecast accuracy. International Journal of Forecasting 22: 679–88. [Google Scholar] [CrossRef] [Green Version]
- Isiklar, Gultekin, Kajal Lahiri, and Prakash Loungani. 2006. How quickly do forecasters incorporate news? Evidence from cross-country surveys. Journal of Applied Econometrics 21: 703–25. [Google Scholar] [CrossRef] [Green Version]
- Jansen, Dennis W., and Ruby P. Kishnan. 1996. An evaluation of Federal Reserve forecasting. Journal of Macroeconomics 18: 89–100. [Google Scholar] [CrossRef]
- Joutz, Fred, and Herman O. Stekler. 2000. An evaluation of the predictions of the Federal Reserve. International Journal of Forecasting 16: 17–38. [Google Scholar] [CrossRef]
- Kang, Yanfei, Wei Cao, Fotios Petropoulos, and Feng Li. 2021. Forecast with forecasts: Diversity matters. European Journal of Operational Research 1: 1–25. [Google Scholar] [CrossRef]
- Kapetanios, George, James Mitchell, Simon Price, and Nicholas Fawcett. 2015. Generalised density forecast combinations. Journal of Econometrics 188: 150–65. [Google Scholar] [CrossRef] [Green Version]
- Karamouzis, Nicholas, and Raymond Lombra. 1989. Federal Reserve policymaking: An overview and analysis of the policyprocess. Carnegie Rochester Conference Series on Public Policy 30: 7–62. [Google Scholar] [CrossRef]
- Keane, Michael P., and David E. Runkle. 1990. Testing the rationality of price forecasts: New evidence from panel data. American Economic Review 80: 714–35. [Google Scholar]
- Klein, Lawrence R. 1971. An Essay on the Theory of Economic Prediction. Chicago: Markham Publishing Company. [Google Scholar]
- Koehler, Anne B. 2001. The asymmetry of the sAPE measure and other comments on the M3-competition. International Journal of Forecasting 17: 570–74. [Google Scholar]
- Koning, Alex J., Philip Hans Franses, Michèle Hibon, and Herman O. Stekler. 2005. The M3 competition: Statistical tests of the results. International Journal of Forecasting 21: 397–409. [Google Scholar] [CrossRef]
- Kourentzes, Nikolaos, Fotios Petropoulos, and Juan R. Trapero. 2014. Improving forecasting by estimating time series structural components across multiple frequencies. International Journal of Forecasting 30: 291–302. [Google Scholar] [CrossRef] [Green Version]
- Kourentzes, Nikolaos, Devon Barrow, and Fotios Petropoulos. 2019. Another look at forecast selection and combination: Evidence from forecast pooling. International Journal of Production Economics 209: 226–35. [Google Scholar] [CrossRef] [Green Version]
- Krkoska, L.ibor, and Utku Teksoz. 2009. How reliable are forecasts of GDP growth and inflation for countries with limited coverage? Economic Systems 33: 376–88. [Google Scholar] [CrossRef]
- Lahiri, Kajal, and Gultekin Isiklar. 2009. Estimating international transmission of shocks using GDP forecasts: India and its trading partners. In Development Macroeconomics, Essays in Memory of Anita Ghatak, 1st ed. Edited by Subrata Ghatak and Paul Levine. New York: Routledge, pp. 123–62. [Google Scholar]
- Lam, Lillie, Laurence Fung, and Ip-wing Yu. 2008. Comparing Forecast Performance of Exchange Rate Models; Working Paper 0808. Hong Kong: Hong Kong Monetary Authority.
- Lamont, Owen A. 2002. Macroeconomic forecasts and microeconomic forecasters. Journal of Economic Behavior & Organization 48: 265–80. [Google Scholar]
- Lewis, Christine, and Nigel Pain. 2014. Lessons from OECD Forecasts during and after the Financial Crisis. OECD Journal: Economic Studies 1: 9–39. [Google Scholar] [CrossRef] [Green Version]
- Llewellyn, John, and Haruhito Arai. 1984. International Aspects of Forecasting Accuracy. OECD Economic Studies 1: 73–117. [Google Scholar]
- Loungani, Prakash. 2001. How Accurate are Private Sector Forecasts? Cross-country Evidence from Consensus Forecasts of Output Growth. International Journal of Forecasting 17: 419–32. [Google Scholar] [CrossRef] [Green Version]
- Loungani, Prakash, Herman O. Stekler, and Natalia Tamirisa. 2013. Information rigidity in growth forecasts: Some cross-country evidence. International Journal of Forecasting 29: 605–21. [Google Scholar] [CrossRef]
- Makridakis, Spyros. 1988. Metaforecasting: Ways of improving forecasting accuracy and usefulness. International Journal of Forecasting 4: 467–91. [Google Scholar] [CrossRef]
- Makridakis, Spyros. 1993. Accuracy measures: Theoretical and practical concerns. International Journal of Forecasting 9: 527–29. [Google Scholar] [CrossRef]
- Makridakis, Spyros, and Michele Hibon. 2000. The M3-Competition: Results, conclusions and implications. International Journal of Forecasting 16: 451–76. [Google Scholar] [CrossRef]
- Makridakis, Spyros, Michele Hibon, and Claus Moser. 1979. Accuracy of Forecasting: An Empirical Investigation. Journal of the Royal Statistical Society 4: 97–145. [Google Scholar] [CrossRef]
- Makridakis, Spyros, Allan Andersen, Robert Carbone, Robert Fildes, Michele Hibon, Rudolf Lewandowski, Joseph Newton, Emanuel Parzen, and Robert Winkler. 1982. The Accuracy of Extrapolation (Time Series) Methods: Results of a Forecasting Competition. Journal of Forecasting 1: 111–53. [Google Scholar] [CrossRef]
- Makridakis, Spyros, Robin M. Hogarth, and Anil Gaba. 2009. Forecasting and uncertainty in the economic and business world. International Journal of Forecasting 25: 794–812. [Google Scholar] [CrossRef]
- Mariano, Roberto S. 2004. Testing Forecast Accuracy. In A Companion to Economic Forecasting, 1st ed. Edited by Michael P. Clements and David F. Hendry. Malden: Blackwell Publishing, pp. 284–98. [Google Scholar]
- Mayer, Walter, Gary Madden, and Xin Dang. 2020. Predictive Accuracy Tests for Prediction of Economic Growth Based on Broadband Infrastructure. In Applied Economics in the Digital Era, 1st ed. Edited by James Alleman, Paul N. Rappoport and Hamoudia Mohsen. London: Springer International Publishing, pp. 137–49. [Google Scholar]
- Meese, Richard A., and Kenneth Rogoff. 1983. Empirical Exchange Rate Models of the Seventies. Journal of International Economics 14: 3–24. [Google Scholar] [CrossRef]
- Meese, Richard A., and Kenneth Rogoff. 1988. Was it Real? The Exchange Rate–Interest Differential Relation Over the Modern Floating-Rate Period. Journal of Finance 43: 933–48. [Google Scholar] [CrossRef]
- Messina, Jeffrey D., Tara M. Sinclair, and Herman O. Stekler. 2015. What can we learn from revisions to the Greenbook forecasts? Journal of Macroeconomics 45: 54–62. [Google Scholar] [CrossRef] [Green Version]
- Mincer, Jacob, and Victor Zarnowitz. 1969. The evaluation of economic forecasts. In Economic Forecasts and Expectations, 1st ed. Edited by Jacob Mincer. New York: National Bureau of Economic Research, pp. 3–46. [Google Scholar]
- Morgan, W. A. 1939. A Test for the Significance of the Difference Between the two Variances in a Sample From a Normal Bivariate Population. Biometrika 31: 13–19. [Google Scholar] [CrossRef]
- Nowotarski, Jakub, Bidong Liu, Rafał Weron, and Tao Hong. 2016. Improving short term load forecast accuracy via combining sister forecasts. Energy 98: 40–49. [Google Scholar] [CrossRef]
- Pesaran, Hashem M., and Spyros Skouras. 2004. Decision-Based Methods for Forecast Evaluation. In A Companion to Economic Forecasting, 1st ed. Edited by Michael P. Clements and David F. Hendry. Malden: Blackwell Publishing, pp. 241–67. [Google Scholar]
- Petropoulos, Fotios, Nikolaos Kourentzes, Konstantinos Nikolopoulos, and Enno Siemsen. 2018. Judgmental selection of forecasting models. Journal of Operations Management 60: 34–46. [Google Scholar] [CrossRef] [Green Version]
- Pinar, Mehmet, Thanasis Stengos, and Ege M. Yazgan. 2017. Quantile forecast combination using stochastic dominance. Empirical Economics 55: 1717–55. [Google Scholar] [CrossRef] [PubMed] [Green Version]
- Prasad, Punam, Sivasankaran Narayanasamy, Samit Paul, Subir Chattopadhyay, and Palanisamy Saravanan. 2018. Review of literature on working capital management and future research agenda. Journal of Economic Surveys 33: 827–61. [Google Scholar] [CrossRef]
- Qi, Min, and Guoqiang Peter Zhang. 2001. An investigation of model selection criteria for neural network time series forecasting. European Journal of Operational Research 132: 666–80. [Google Scholar] [CrossRef]
- Romer, Christina D., and David H. Romer. 2000. Federal Reserve private information and the behaviour of interest rates. American Economic Review 90: 429–57. [Google Scholar] [CrossRef] [Green Version]
- Salisu, Afees A., Raymond Swaray, and Tirimisiyu F. Oloko. 2019. Improving the predictability of the oil–US stock nexus: The role of macroeconomic variables. Economic Modelling 76: 153–71. [Google Scholar] [CrossRef]
- Shen, Shujie, Gang Li, and Haiyan Song. 2009. Is the Time-Varying Parameter Model the Preferred Approach to Tourism Demand Forecasting? Statistical Evidence. In Advances in Tourism Economics, 1st ed. Edited by Alvaro Matias, Manuela Sarmento and Peter Nijkamp. London: Springer International Publishing, pp. 107–20. [Google Scholar]
- Sheng, Xuguang. 2015. Evaluating the economic forecasts of FOMC members. International Journal of Forecasting 31: 165–75. [Google Scholar] [CrossRef]
- Shittu, Olanrewaju I., and OlaOluwa S. Yaya. 2009. Measuring forecast performance of ARMA & ARFIMA models: An application to US Dollar/UK pound foreign exchange rate. European Journal of Scientific Research 32: 168–78. [Google Scholar]
- Simionescu, Mihaela. 2014a. The Accuracy Assessment of Macroeconomic Forecasts based on Econometric Models for Romania. Procedia Economics and Finance 8: 671–77. [Google Scholar] [CrossRef] [Green Version]
- Simionescu, Mihaela. 2014b. The Performance of Predictions Based on the Dobrescu Macromodel for the Romanian Economy. Romanian Journal of Economic Forecasting 17: 179–95. [Google Scholar] [CrossRef] [Green Version]
- Sims, Christopher A. 2002. The role of models and probabilities in the monetary policy process. Brookings Papers on Economic Activity 2: 1–40. [Google Scholar] [CrossRef] [Green Version]
- Sinclair, Tara M., Herman O. Stekler, and Fred Joutz. 2010. Can the Fed Predict the State of the Economy? Economics Letters 108: 28–32. [Google Scholar] [CrossRef] [Green Version]
- Snyder, Hannah. 2019. Literature review as a research methodology: An overview and guidelines. Journal of Business Research 104: 333–39. [Google Scholar] [CrossRef]
- Sorin, Gabriel Anton, and Anca Elena Afloarei Nucu. 2020. Enterprise Risk Management: A Literature Review and Agenda for Future Research. Journal of Risk and Financial Management 13: 281. [Google Scholar] [CrossRef]
- Swanson, Norman R., and Dick van Dijk. 2012. Are Statistical Reporting Agencies Getting It Right? Data Rationality and Business Cycle Asymmetry. Journal of Business & Economic Statistics 24: 24–42. [Google Scholar] [CrossRef] [Green Version]
- Tashman, Leonard J. 2000. Out-of-sample tests of forecasting accuracy: An analysis and review. International Journal of Forecasting 16: 437–50. [Google Scholar] [CrossRef]
- Theil, Henri. 1966. Applied Economic Forecasting. Amsterdam: North-Holland. [Google Scholar]
- Timmermann, Allan. 2006. Forecast combinations. Handbook of Economic Forecasting 1: 135–96. [Google Scholar] [CrossRef]
- Tinbergen, Jan. 1939. Statistical Testing of Business Cycle Theories: Part II: Business Cycles in the United States of America, 1919–1932. New York: Agaton Press. [Google Scholar]
- Tranfield, David, David Denyer, and Palminder Smart. 2003. Towards a Methodology for Developing Evidence-Informed Management Knowledge by Means of Systematic Review. British Journal of Management 14: 207–22. [Google Scholar] [CrossRef]
- Wallis, Kenneth F. 1989. Macroeconomic forecasting: A survey. Economic Journal 99: 28–61. [Google Scholar] [CrossRef]
- Wang, Xun, and Fotios Petropoulos. 2016. To select or to combine? The inventory performance of model and expert forecasts. International Journal of Production Research 54: 5271–82. [Google Scholar] [CrossRef] [Green Version]
- West, Kenneth D. 1996. Asymptotic Inference about Predictive Ability. Econometrica 64: 1067–84. [Google Scholar] [CrossRef]
- West, D. Kenneth. 2006. Forecast evaluation. Handbook of Economic Forecasting 1: 99–134. [Google Scholar]
- Westerlund, Joakim, and Paresh Kumar Narayan. 2015. Testing for predictability in conditionally hetoroscedastic stock returns. Journal of Financial Econometrics 13: 342–75. [Google Scholar] [CrossRef]
- Woschnagg, Elisabeth, and Jana Cipan. 2004. Evaluating Forecast Accuracy. In 406347 UK Ökonometrische Prognose. Vienna: University of Vienna, Department of Economics, Available online: https://homepage.univie.ac.at/robert.kunst/procip.pdf (accessed on 6 October 2021).
- Yokuma, J. Thomas, and Scott J. Armstrong. 1995. Beyond Accuracy: Comparison of Criteria Used to Select Forecasting Methods. International Journal of Forecasting 11: 591–97. [Google Scholar] [CrossRef] [Green Version]
- Zarnowitz, Victor. 1991. Has Macro-Forecasting Failed? NBER Working Paper No. 3867. Cambridge: The National Bureau of Economic Research. [Google Scholar]
- Zarnowitz, Victor, and Louis A. Lambros. 1987. Consensus and uncertainty in economic prediction. Journal of Political Economy 95: 591–621. [Google Scholar] [CrossRef]
Figure 1.
Results of the ISI Web of Science search for ‘Measures of Economic Forecast Accuracy’ in the title of publications for the period 1991–2020. Source: Web of Science database.
Figure 1.
Results of the ISI Web of Science search for ‘Measures of Economic Forecast Accuracy’ in the title of publications for the period 1991–2020. Source: Web of Science database.


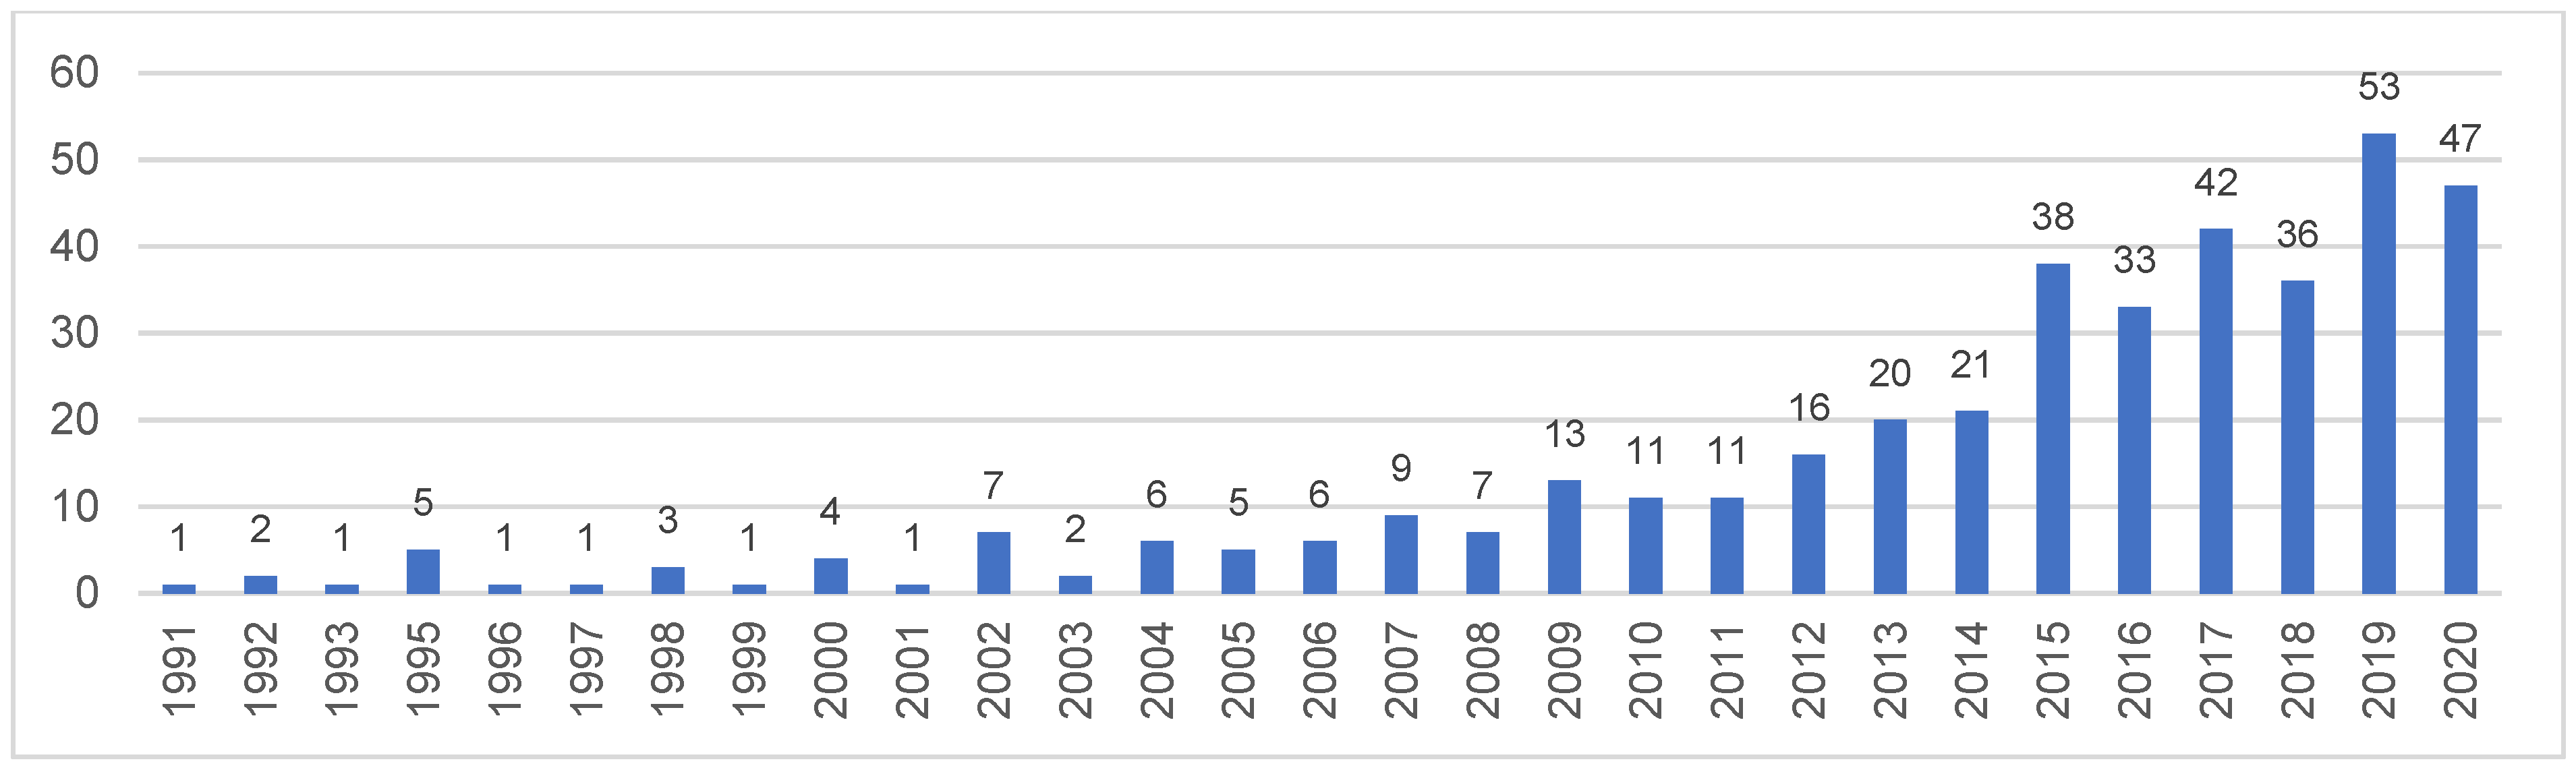
Table 1.
Systematic literature review—phases and guideline questions.
| Phase | Aim/s | Guideline Questions |
|---|---|---|
| Phase 1: Designing the review | Research questions identified. Overall review approach considered. Research strategy established to identify relevant literature. |
|
| Phase 2: Conducting the review | Articles selected, classified, and described. |
|
| Phase 3: Analysis | Content analysis of selected research articles performed. |
|
| Phase 4: Writing the review | Literature review reported and structured. |
|
Source: the author follows the processes of Sorin and Nucu (2020), Snyder (2019), and Prasad et al. (2018).
Table 2.
Inclusion criteria for the systematic literature review.
| Inclusion Criteria | Description |
|---|---|
| Theoretical framework | Include all articles that offer a contribution to the development of a theoretical framework on the research topic. |
| Methodology development | Include all studies that contribute to the development of methodology in the field of the analysis of economic forecasts accuracy. |
| Empirical findings | Include all articles that contribute to the application to empirical research of the methods analyzed. |
Table 3.
Breakdown by document type of initial contributions to the literature on measures of economic forecast accuracy from 1991 to 2020.
Table 3.
Breakdown by document type of initial contributions to the literature on measures of economic forecast accuracy from 1991 to 2020.
| Document Type | Number of Research Work | % of the Total |
|---|---|---|
| Articles | 340 | 84.4 |
| Proceeding Papers | 51 | 12.7 |
| Review Articles | 6 | 1.5 |
| Book Chapters | 2 | 0.5 |
| Editorial Materials | 2 | 0.5 |
| Early Access | 1 | 0.2 |
| Reprints | 1 | 0.2 |
| Total | 403 | 100.0 |
Source: WoS CC.
Table 4.
The first 25 source titles (by record count).
| Serial Number | Title of the Journal | Number of Articles | Average Number of Citations Per Year from the Web of Science Core Collection |
|---|---|---|---|
| 1 | International Journal of Forecasting | 15 | 28.4 |
| 2 | Journal of Forecasting | 13 | 10.04 |
| 3 | Economic Modelling | 8 | 19.88 |
| 4 | Energies | 8 | 10.63 |
| 5 | Journal of Business & Economic Statistics | 8 | 148.62 |
| 6 | Romanian Journal of Economic Forecasting | 6 | 1.1 |
| 7 | Applied Energy | 5 | 46.25 |
| 8 | Empirical Economics | 5 | 2.21 |
| 9 | Energy | 5 | 12 |
| 10 | Journal of Econometrics | 5 | 9 |
| 11 | Journal of Empirical Finance | 4 | 2.6 |
| 12 | Quantitative Finance | 4 | 3.4 |
| 13 | Technological Forecasting and Social Change | 4 | 4.55 |
| 14 | Computational Economics | 3 | 3 |
| 15 | European Journal of Operational Research | 3 | 6 |
| 16 | Journal of Applied Econometrics | 3 | 9.8 |
| 17 | Journal of Banking Finance | 3 | 4.71 |
| 18 | Journal of Economic Behaviour Organization | 3 | 9,7 |
| 19 | Journal of Economic Surveys | 3 | 6.32 |
| 20 | Journal of Financial Economic Policy | 3 | 1.1 |
| 21 | Renewable Energy | 3 | 11.71 |
| 22 | Review of Accounting Studies | 3 | 4.44 |
| 23 | Science of the Total Environment | 3 | 21.67 |
| 24 | Sustainability | 3 | 7 |
| 25 | Water | 3 | 17.6 |
Source: WoS CC.
Table 5.
Top 20 studies on “Measures on Economic Forecast Accuracy”.
| No. | Title of the Paper | Author(s) | Number of Citations | Average Number of Citations Per Year | Year of Publication | Journal |
|---|---|---|---|---|---|---|
| 1 | Comparing Predictive Accuracy | Diebold, F.X.; Mariano, R.S. | 3340 | 128.46 | 1995 | Journal of Business & Economic Statistics |
| 2 | Error Measures for Generalizing About Forecasting Methods-Empirical Comparisons | Armstrong, J.S.; Collopy, F. | 637 | 21.97 | 1992 | International Journal of Forecasting |
| 3 | Economic and statistical measures of forecast accuracy | Granger, C.W.J.; Pesaran, M.H. | 183 | 7.96 | 2000 | Journal of Forecasting |
| 4 | Review of guidelines for the use of combined forecasts | de Menezes, L.M.; Bunn, D.W.; Taylor, J.W. | 122 | 5.81 | 2000 | European Journal of Operational Research |
| 5 | A Model-Selection Approach to Assessing The Information in the Term Structure Using Linear-Models and Artificial Neural Networks | Swanson, N.R.; White, H. | 122 | 4.69 | 1995 | Journal of Business & Economic Statistics |
| 6 | Can Internet Search Queries Help to Predict Stock Market Volatility? | Dimpfl, T.; Jank, S. | 113 | 22.60 | 2016 | European Financial Management |
| 7 | Macroeconomic forecasts and microeconomic forecasters | Lamont, O.A. | 99 | 5.21 | 2002 | Journal of Economic Behaviour & Organization |
| 8 | The state of macroeconomic forecasting | Fildes, R.; Stekler, H. | 81 | 4.26 | 2002 | Journal of Macroeconomics |
| 9 | Cointegration and long-horizon forecasting | Christoffersen, P.F.; Diebold, F.X. | 73 | 3.17 | 1998 | Journal of Business & Economic Statistics |
| 10 | How does Google search affect trader positions and crude oil prices? | Li, X.; Ma, J.; Wang, S.; Zhang, X. | 64 | 10.67 | 2015 | Economic Modelling |
| 11 | The M3 competition: Statistical tests of the results | Koning, A.J.; Franses, P.H.; Hibon, M.; Stekler, H.O. | 54 | 3.38 | 2005 | International Journal of Forecasting |
| 12 | Backtesting Parametric Value-at-Risk With Estimation Risk | Escanciano, J.C.; Olmo, J. | 54 | 4.91 | 2010 | Journal of Business & Economic Statistics |
| 13 | Credit Spreads as Predictors of Real-Time Economic Activity: A Bayesian Model-Averaging Approach | Faust, J.; Gilchrist, S.; Wright; J.H.; Zakrajsek, E. | 48 | 6.00 | 2013 | Review of Economics and Statistics |
| 14 | Tests of Equal Predictive Ability With Real-Time Data | Clark, T.E.; McCracken, M.W. | 40 | 3.33 | 2009 | Journal of Business & Economic Statistics |
| 15 | Do investor expectations affect sell-side analysts’ forecast bias and forecast accuracy? | Walther, B.R.; Willis, R.H. | 39 | 4.88 | 2013 | Review of Accounting Studies |
| 16 | Time-varying combinations of predictive densities using nonlinear filtering | Billio, M.; Casarin, R.; Ravazzolo, F.; van Dijk, H.K. | 39 | 4.88 | 2013 | Journal of Econometrics |
| 17 | Forecast Uncertainty-Ex Ante and Ex Post: US Inflation and Output Growth | Clements, M.R. | 37 | 5.29 | 2014 | Journal of Business & Economic Statistics |
| 18 | Improving the predictability of the oil-US stock nexus: The role of macroeconomic variables | Salisu, A.A.; Swaray, R.; Oloko, T.F. | 36 | 18.00 | 2019 | Economic Modelling |
| 19 | The Measurement and Behavior of Uncertainty: Evidence from the ECB Survey of Professional Forecasters | Abel, J.; Rich, R.; Song, J.; Tracy, J. | 29 | 5.80 | 2016 | Journal of Applied Econometrics |
| 20 | Generalised density forecast combinations | Kapetanios, G.; Mitchell, J.; Price, S.; Fawcett, N. | 21 | 3.50 | 2015 | Journal of Econometrics |
Source: WoSCC.
Table 6.
Classification of traditional measures of economic forecast accuracy.
| Measure | Symbol | Calculation | Explanation of Variables |
|---|---|---|---|
| Scale-Dependent Measures | |||
| Mean Square Error | MSE | Mean | et denotes the forecast error. It is defined by the equation et = Yt–Ft, where Yt denotes the observation at time t and Ft denotes the forecast of Yt. |
| Root Mean Square Error | RMSE | ||
| Mean Absolute Error | MAE | ||
| Median Absolute Error | MdAE | ||
| Measures Based on Percentage Error | |||
| Mean Absolute Percentage Error | MAPE | The percentage error is the ratio between the forecast error and observation value: . The advantage of percentage errors is scale independency, and therefore, it is a very common measure in the analysis of forecast performance across different datasets. | |
| Median Absolute Percentage Error | MdAPE | ||
| Root Mean Square Percentage Error | RMSPE | ||
| Root Median Square Percentage Error | RMdSPE | ||
| Measures Based on Relative Errors | |||
| Mean Relative Absolute Error | MRAE | rt = et / et* is the relative error, where et* denotes the forecast error obtained from the benchmark method. Usually, the benchmark method is the random walk, where Ft is equal to the last observation. | |
| Median Relative Absolute Error | MdRAE | ||
| Geometric Mean Relative Absolute Error | GMRAE | ||
| Relative Measures | |||
| Relative Mean Absolute Error | ReIMAE | Instead of applying relative errors, the authors use relative measures. In the calculation of ReIMAE (Relative Mean Absolute Error), MAEb denotes the MAE from the benchmark method. When the benchmark method is a random walk, and the forecasts are all one-step forecasts, the relative RMSE is Theil’s U statistic (Theil 1966), sometimes called U2. | |
| U Theil’s statistic (1) | U1 | ||
| U Theil’s statistic (2) | U2 | ||
Source: Hyndman and Koehler (2006).
Table 7.
Advantages and limits of the methods used to assess forecast accuracy.
| Measure | Symbol | Advantages | Limits |
|---|---|---|---|
| Scale-Dependent Measures | |||
| Mean Square Error | MSE | Oftentimes, the RMSE is preferred to the MSE, as it is on the same scale as the data. Historically, the RMSE and MSE have been popular, largely because of their theoretical relevance in statistical modeling. The RMSE is useful as a relative measure to compare forecasts for the same series across different models. The smaller the error, the better the forecasting ability of that model according to the RMSE criterion. The mean absolute error (MAE) is less sensitive to large deviations than the usual squared loss. | Scale-dependent measures are on the same scale as the data. Therefore, none of them are meaningful for assessing a method’s accuracy across multiple series. The sensitivity of the RMSE to outliers is the most common limitation of using of this measure. |
| Root Mean Square Error | RMSE | ||
| Mean Absolute Error | MAE | ||
| Median Absolute Error | MdAE | ||
| Measures Based on Percentage Error | |||
| Mean Absolute Percentage Error | MAPE | Measures based on percentage errors have the advantage because they are scale-independent. Therefore, they are frequently used to compare forecast accuracy between different data series. Additionally, these measures have an easy interpretation. In this group of measures, the Mean Absolute Percentage Error (MAPE) is the most applied measure. | These measures can produce infinite or undefined errors if zero values occur on the data. Moreover, percentage errors can have an extremely skewed distribution when the actual values are close to zero. |
| Median Absolute Percentage Error | MdAPE | ||
| Root Mean Square Percentage Error | RMSPE | ||
| Root Median Square Percentage Error | RMdSPE | ||
| Measures Based on Relative Errors | |||
| Mean Relative Absolute Error | MRAE | Measures based on the relative errors are an alternative to the percentages for the calculation of scale-independent measurements. They imply dividing each error by the error obtained using some benchmark method of forecasting. Since these measures are not scale-dependent, they were recommended by Armstrong and Collopy (1992) and by Fildes (1992) for estimating the forecast accuracy across multiple series. | A deficiency of measures based on relative errors is that the forecast error obtained from the benchmark method can be small. In fact, the relative error has infinite variance because the forecast error obtained from the benchmark method has positive probability density at 0. When the errors are small, as they can be with intermittent series, use of the naïve method as a benchmark is no longer possible because it would involve division by zero. |
| Median Relative Absolute Error | MdRAE | ||
| Geometric Mean Relative Absolute Error | GMRAE | ||
| Relative Measures | |||
| Relative Mean Absolute Error | ReIMAE | An advantage of these methods is their interpretability. For example, relative MAE measures the improvement possible from the proposed forecast method relative to the benchmark forecast method. When RelMAE < 1, the proposed method is better than the benchmark method and when RelMAE > 1, the proposed method is worse than the benchmark method. | These measures require several forecasts on the same series to enable a MAE (or MSE) to be computed. One common situation where it is not possible to use such measures is where one is measuring the out-of-sample forecast accuracy at a single forecast horizon across multiple series. It makes no sense to compute the MAE across series (due to their different scales). |
| U Theil’s statistic (1) | U1 | ||
| U Theil’s statistic (2) | U2 | ||
Source: Hyndman and Koehler (2006).
Table 8.
Classification of Empirical Findings.
| Subject of Research | Title of the Paper | Author/s | Year of Publication | Empirical Findings |
|---|---|---|---|---|
| Evaluation of economic forecast accuracy | The evaluation of economic forecasts | Mincer, Jacob, and Victor Zarnowitz | 1969 | Forecast accuracy decreases with an increase in length of the predictive span. |
| Accuracy of Forecasting: An Empirical Investigation | Makridakis, Spyros, and Michele Hibon | 1979 | Simpler methods perform well compared to the more complex and statistically sophisticated ARMA models. | |
| Comparing exchange rate forecasting models: Accuracy versus profitability | Boothe, Paul, and Debra Glassman | 1987 | The highest economic forecast accuracy is realized applying simple time-series models such as the random walk. | |
| The accuracy of economic forecasts related to GDP, unemployment, and inflation | Forecast smoothing and the optimal underutilization of information at the Federal Reserve | Scotese, Carol A. | 1994 | Testing forecasts for real GNP and inflation do not confirm significant biases in either the real GNP or inflation forecasts. |
| An Evaluation of the Forecasts of the Federal Reserve: A Pooled Approach | Clements, Michael P., Fred Joutz, and Herman O. Stekler. | 2007 | There is evidence of systematic bias and of forecast smoothing of the inflation forecasts. | |
| Introduction to “The future of macroeconomic forecasting” | Heilemann, Ullrich, and Herman Stekler | 2007 | Unsuitable forecasting methods and unsuitable expectations regarding the degree of performance are the most important reasons for the lack of accuracy in G7 macroeconomic predictions. | |
| One Model and Various Experts: Evaluating Dutch Macroeconomic Forecasts | Franses, Philip Hans, Henk C. Kranendonk, and Debby Lanser | 2011 | The model forecasts are biased for a range of variables, and expert forecasts are far more accurate than the model forecasts, particularly when the forecast horizon is short. | |
| Strategies to Improve the Accuracy of Macroeconomic Forecasts in United States of America | Bratu, Mihaela | 2012 | The Holt–Winters method offers more accurate forecasts for inflation in the US when the initial expectations are provided by the Survey of Professional Forecasters. | |
| Comparing the accuracy of various econometric forecasting models | The Accuracy Assessment of Macroeconomic Forecasts based on Econometric Models for Romania | Simionescu, Mihaela | 2014a | Comparing the accuracy of various econometric forecasting models (AR, VAR, and VARMA), it is concluded that vector autoregressive moving average (VARMA) models generate the most accurate forecasts. |
| Testing of a tendency to overestimate economic growth | Lessons from OECD Forecasts during and after the Financial Crisis | Lewis, Christine, and Nigel Pain | 2014 | It is confirmed that economic growth is repeatedly overestimated in the projections, which failed to anticipate the extent of the slowdown and, later, the weak pace of the economic recovery. |
| Evaluating the economic forecasts of FOMC members | Sheng, Xuguang | 2015 | The analysis of economic forecast accuracy concerning real GDP, inflation, and unemployment rates made by the Federal Open Market Committee confirmed a tendency to underpredict real GDP and overpredict inflation and unemployment rates. | |
| The accuracy of economic forecasts for the exchange rate | Comparing forecast performance of exchange rate models | Lam, Lillie, Laurence Fung, and Ip-wing Yu | 2008 | Exchange rate predictability is explored using different theoretical and empirical models, such as the purchasing power parity, uncovered interest rate parity, and sticky-price monetary models, models based on the Bayesian model averaging technique, and a combination of these. The forecast based on combined models is more accurate than the forecast that uses only one model. |
| Measuring forecast performance of ARMA & ARFIMA models: An application to US Dollar/UK pound foreign exchange rate | Shittu, Olanrewaju, I., and OlaOluwa S. Yaya | 2009 | Analyzing the forecast accuracy of ARIMA and ARFIMA models using the example of the US dollar/UK pound foreign exchange rate, it was concluded that estimated forecast values from the ARFIMA model is more realistic and closely reflects the current economic reality. | |
| The effects of business cycles on the accuracy of economic forecasts | How Accurate are Private Sector Forecasts? Cross-country Evidence from Consensus Forecasts of Output Growth | Loungani, Prakash | 2001 | Forecasts for recessions are subject to a large systematic forecast error. |
| Can the Fed Predict the State of the Economy? | Sinclair, Tara M., Herman O. Stekler, and Fred Joutz | 2010 | The Federal Reserve’s Greenbook projections overestimate the annual rate of change in real GDP in periods of recession and underestimate it in periods of economic growth. | |
| Systematic Errors in Growth Expectations over the Business Cycle | Dovern, Jonas, and Nils Jannsen | 2017 | Forecasts for recessions are subject to a large negative systematic forecast error, while forecasts for recoveries are subject to a positive systematic forecast error. | |
| How well do economists forecast recessions? | An, Zidong, Joao Tovar Jalles, and Parkash Loungani | 2018 | Forecasts are revised much more quickly in periods of recession than in non-recession periods, but not rapidly enough to be able to avoid large forecast errors. | |
| Comparison in forecast accuracy among advanced and emerging economies | Information rigidities: Comparing average and individual forecasts for a large international panel | Dovern, Jonas, Urlich Fritsche, Prakash Loungani, and Natalia Tamirisa | 2015 | There are significant discrepancies in forecast performance among advanced and emerging economies, particularly in terms of forecast accuracy. |
| How to improve the predictability of the oil-US stock nexus | Improving the predictability of the oil–US stock nexus: The role of macroeconomic variables | Salisu, Afees A., Raymond Swaray and Tirimisiyu F. Oloko | 2019 | ‘It is important to pre-test the predictors for persistence, endogeneity, and conditional heteroscedasticity, particularly when modeling with high-frequency series’. |
Publisher’s Note: MDPI stays neutral with regard to jurisdictional claims in published maps and institutional affiliations. |
© 2021 by the author. Licensee MDPI, Basel, Switzerland. This article is an open access article distributed under the terms and conditions of the Creative Commons Attribution (CC BY) license (https://creativecommons.org/licenses/by/4.0/).
Share and Cite
MDPI and ACS Style
Buturac, G. Measurement of Economic Forecast Accuracy: A Systematic Overview of the Empirical Literature. J. Risk Financial Manag. 2022, 15, 1. https://0-doi-org.brum.beds.ac.uk/10.3390/jrfm15010001
AMA Style
Buturac G. Measurement of Economic Forecast Accuracy: A Systematic Overview of the Empirical Literature. Journal of Risk and Financial Management. 2022; 15(1):1. https://0-doi-org.brum.beds.ac.uk/10.3390/jrfm15010001
Chicago/Turabian StyleButurac, Goran. 2022. "Measurement of Economic Forecast Accuracy: A Systematic Overview of the Empirical Literature" Journal of Risk and Financial Management 15, no. 1: 1. https://0-doi-org.brum.beds.ac.uk/10.3390/jrfm15010001